Measurement of Volumetric Mass Transfer Coefficient in Bubble Columns


Department of Multiphase Reactors, Institute of Chemical Process Fundamentals of the CAS, v.v.i., Rozvojová 2/135, 165 02 Prague, Czech Republic
*
Author to whom correspondence should be addressed.
ChemEngineering 2018, 2(2), 19; https://doi.org/10.3390/chemengineering2020019
Submission received: 5 March 2018
/
Revised: 14 April 2018
/
Accepted: 23 April 2018
/
Published: 1 May 2018
(This article belongs to the Special Issue Bubble Column Fluid Dynamics)
Abstract
:The paper presents a brief overview of experiments on volumetric mass transfer coefficient in bubble columns. The available experimental data published are often incomparable due to the different type of gas distributor and different operating conditions used by various authors. Moreover, the value of the coefficient obtained experimentally is very sensitive to the particular method and to the physical models used in its evaluation. It follows that the Dynamic Pressure Method (DPM) is able to provide physically correct values not only in lab-scale contactors but also in pilot-scale reactors. However, the method was not correctly proven in bubble columns. In present experiments, DPM was employed in a laboratory-scale bubble column with a coalescent phase and tested in the pure heterogeneous flow regime. The method was successfully validated by the measurements under two different conditions relevant to the mass transfer. First, the ideal pressure step was compared with the non-ideal pressure step. Second, the pure oxygen absorption was compared with the simultaneous oxygen-and-nitrogen absorption. The obtained results proved that DPM is suitable for measuring the mass transport in bubble columns and to provide reliable data of volumetric mass transfer coefficient.
1. Introduction
Bubble columns are multiphase reactors/contactors which are widely used in chemical and biochemical industry [1,2,3,4]. Especially in biotechnologies, the bubble columns are advantageous due to their low costs and low shear stress hydrodynamics gentle to the microorganisms. Kantarci (2005) [2] reviewed several biochemical studies using bubble columns as bioreactors to produce various products, such as enzymes, proteins, antibiotics, etc. Nowadays, bubble columns are studied as an efficient photo-bioreactor for production of microalgae [5,6,7]. The supply of gas to the liquid is a crucial process to keep microorganisms alive and the knowledge of gas-liquid mass transfer rate is an important design and scale-up parameter determining the reactor efficiency [2,8].
The mass transfer rate is characterized by the volumetric mass transfer coefficient, kLa, and there exists plenty of papers providing correlations predicting this parameter in bubble columns (reviewed e.g., in [2,3,8]). However, the comparison of these predictions brings substantial data scatter and the choice of the proper correlation becomes difficult. As the mass transfer rate depends on the hydrodynamic conditions in the bubble column, there are too many parameters affecting the kLa values such as design parameters (dimensions, free liquid height, sparger design, etc.) and liquid properties (viscosity, presence of ions inhibiting coalescence or surfactants inhibiting mass transfer, etc.). In the present work, we wanted to reduce the number of parameters thus we focused on the coalescent batch only. Table 1 provides some of the most cited data of volumetric mass transfer coefficient mostly treated in a correlation form. The table includes also the bubble column size, operating conditions, sparger, and method used to measure the volumetric mass transfer coefficient.
When we compare available experimental data and predictions by correlations, we find a huge data scatter. Data differences can be attributed to the different hydrodynamic conditions in the bubble column generated by different types of gas distributors and also to the various methods used for kLa measurements. As different measurement methods can be affected by different assumptions and simplifications, various errors in kLa results can occur [8,19,20,21]. In all the articles presented in Table 1, dynamic methods were used where physical absorption (without chemical reaction) of oxygen into a liquid occurs and the change of oxygen concentration is recorded by a probe and fitted by a theoretical model with kLa as the optimized parameter. Each particular method differs in the way how the oxygen concentration disturbance is introduced into the system.
In the “standard dynamic method” (the most commonly used technique) [4,10,11,13,18], the change of oxygen concentration is created by sudden interchange between two inlet gases with different oxygen concentration (in most cases, interchange between nitrogen and air is used) while the gas flow rate is kept unchanged. The drawback of the method lies in the fact that the description of the mixing in the phases can’t be simplified by ideal mixing because it can bring significant errors. Moreover, when air is used as a gas phase, the simultaneous oxygen and nitrogen transfer needs to be taken into account.
A special case of the standard dynamic method is the “oxygen-enriched method” [5,17] where air is exchanged with oxygen enriched air (oxygen concentration increased by ca. 3%). The advantage of this method is that the nitrogen transfer is negligible due to the small change in the oxygen concentration. The drawback of the method is that the oxygen concentration needs to be measured with high sensitivity to small concentration changes.
The “start-up dynamic method” [9,14,15,16] is based on initial desaturation of oxygen from the liquid, typically by saturating the liquid with pure nitrogen. After removing all the oxygen from the liquid, bubbling is stopped and all the bubbles are allowed to escape the contactor. Then, a new gas with a defined amount of oxygen is introduced into the system. The effect of the non-ideality of the gas mixing is eliminated using this method but the building-up of the gas hold-up during the experiments needs to be considered in the theoretical model.
In the “dynamic pressure method” (DPM) [22,23], the oxygen concentration disturbance is introduced by a small step increase of the pressure in the contactor (approximately 15 kPa) while the volumetric gas flow rate through the vessel is maintained constant. This special way of gas introduction suppresses the gas phase axial mixing because the change in the oxygen concentration is produced instantaneously and simultaneously in all the bubbles of the dispersion. The method is also less sensitive to the axial mixing in the liquid phase [20], however, this may not be true in contactors with high height-to-diameter ratio [24]. Scargiali et al., 2010 [25] provided a simplified version of DPM which uses the model, skipping the mathematical complexities and evaluating the kLa from the slope of oxygen concentration dependence on time. The authors reported a simplified kLa evaluation with sufficient accuracy for practical purpose.
Regardless of the dynamic method used, the oxygen probe dynamics and simultaneous oxygen and nitrogen transfer needs to be taken into account when air is used as the gas phase. Otherwise, it can bring significant errors in the evaluated results of volumetric mass transfer coefficient [18,19]. Gogate and Pandit [19] analyzed the methods for kLa measurement in bioreactors and concluded that the DPM with the model described in [22] eliminates most of the errors mentioned above and can be used also in large-scale bioreactors [26].
The DPM seems to be the most suitable method for reliable kLa measurement in gas-liquid contactors. However, the drawback of the method is that it can be used only for physical absorption. In the presence of a chemical/biochemical reaction, a reaction enhancement factor needs to be considered in the models describing the mass transfer rate [8,27,28]. This become relevant especially when fast chemical/biochemical reactions take place. In the case of a reaction rate slower than the mass transfer rate, the enhancement factor is equal to unity and the volumetric mass transfer coefficient for physical absorption characterizes the mass transfer rate.
The DPM was successfully validated for stirred tank reactors [22,23,26] and for internal loop air-lift reactors [29,30,31]. In bubble columns, the DPM was applied by Letzel et al., 1999 [12]. However, the pressure step non-ideality and simultaneous oxygen and nitrogen transfer was not taken into account, thus the results can be affected by significant errors. The aim of the present work is to validate the DPM for reliable kLa measurement in bubble columns. The two following aspects are analyzed: (i) the effect of the non-ideality of the pressure step on the measured kLa and (ii) the effect of the gas phase composition on the determined kLa value, to justify the use of air in measurements instead of the more expensive and less safe pure oxygen.
2. Materials and Methods
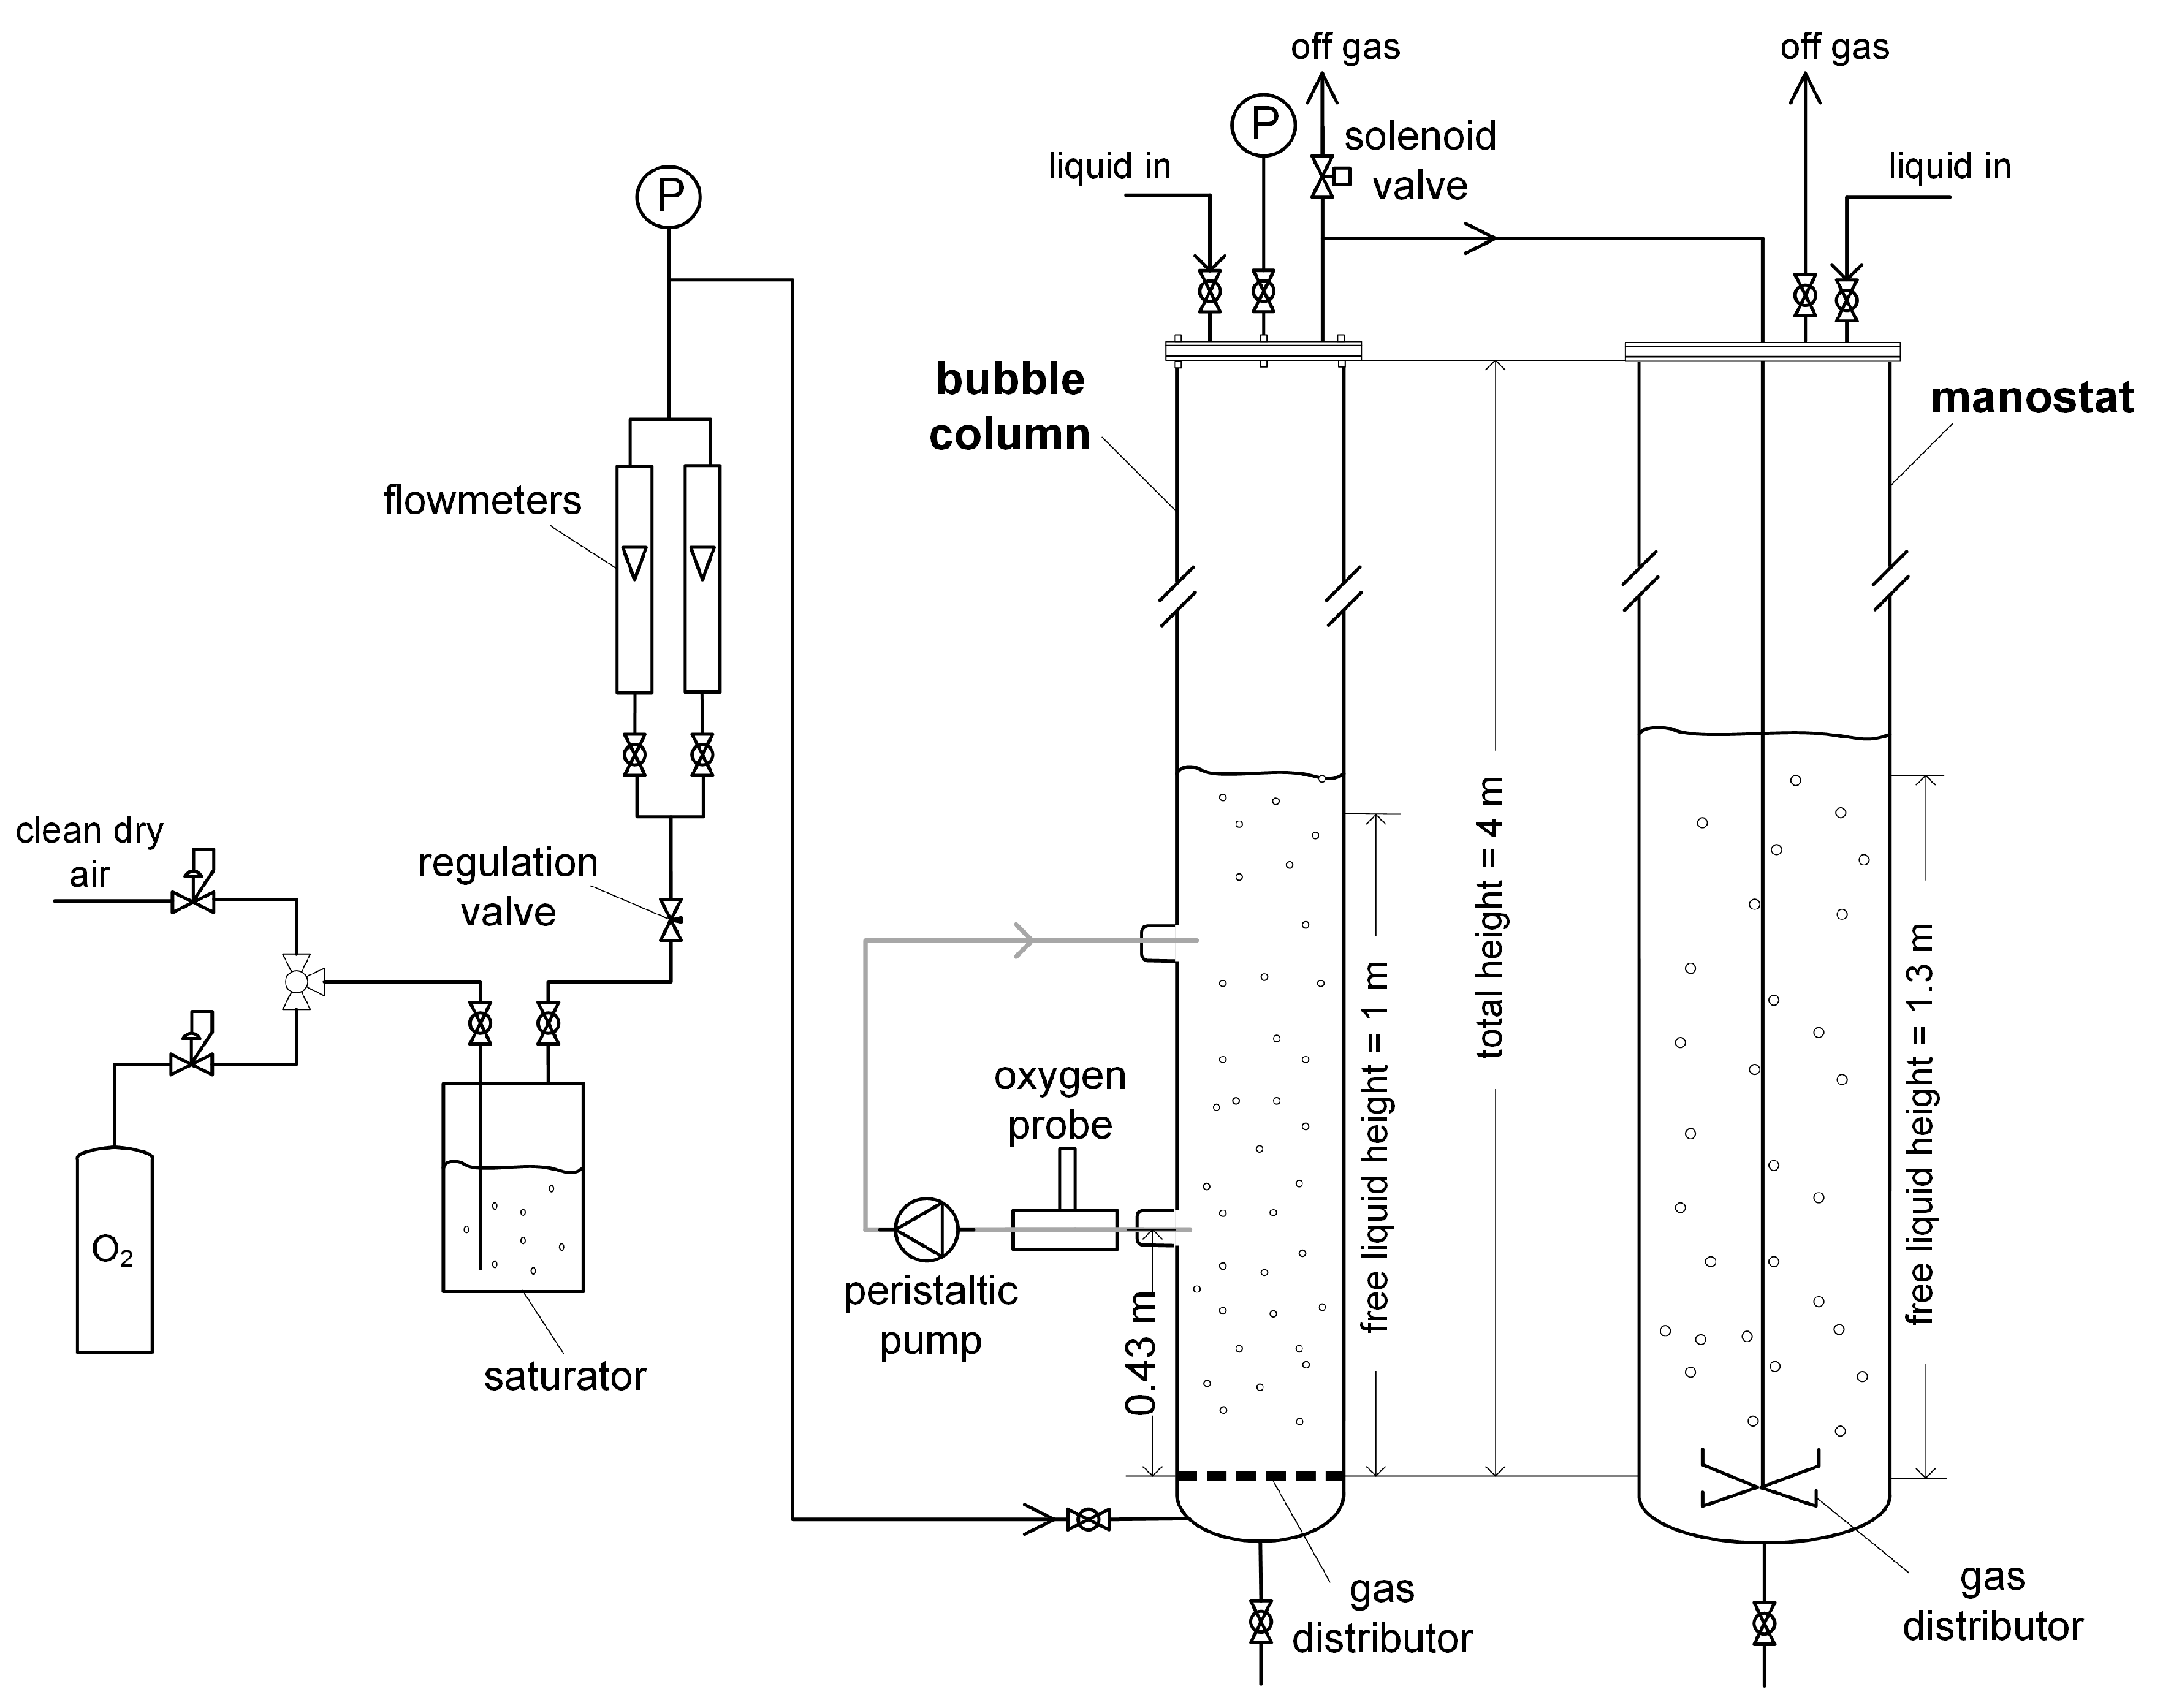
Experiments were carried out in a cylindrical bubble column made of acrylic glass with 0.19 m in diameter and 4 m in total height (Figure 1). The gas distributor was a perforated metal plate with free plate area of 0.2% and orifices 1.6 mm in diameter which produces pure heterogeneous regime for the whole range of gas flow rate investigated [32,33]. All experiments were performed in batch mode with 1 m of clear liquid height. Aspect ratio is approximately D/H ≅ 5.
Distilled water was used as liquid phase. Pure oxygen and air (21% of O2 and 79% of N2), respectively, were used as gas phases. Gas flow rates ranged from 2 to 20 m3/h with corresponding gas superficial velocities 0.02–0.28 m/s. Table 2 presents the physical-chemical properties of used media. The bubble column was operated under temperature control and all the experiments were performed at 25 ± 0.5 °C.
The volumetric mass transfer coefficient was measured by dynamic pressure method (DPM) described in detail in [22,23]. The principle of the method is based on the change of the oxygen concentration in gas phase created by a small pressure change in the column which induces the mass transfer of oxygen between the bubbles and the liquid. The time evolution of the dissolved oxygen concentration in the liquid and of the total pressure in the bubble column are recorded and fitted with a mass transfer model with kLa as parameter. The model used in the present article assumes ideal mixing in both phases, includes simultaneous oxygen and nitrogen mass transfer and considers the transient characteristic of the oxygen probe. The model equations adapted from [22] are described in Section 3.
The oxygen concentration in the liquid phase is measured by a fast responding polarographic oxygen probe (described in [24,34]). The probe was covered with a 12 μm polypropylene membrane ensuring sufficiently fast response. Before the kLa measurements, the transient characteristic of the probe was determined in gas phase by fast changing from pure nitrogen to oxygen. The response of the probe was evaluated using the two-region exponential model [34] and the time constant of the probe was approximately 1 s−1. For kLa determination, the probe was placed in a bypass-cell located immediately after the liquid sampling point, to minimize the time delay (as shown in Figure 1). Both time delays due to bypass and due to probe response were included in the kLa evaluation process using convolution integral [22].
The “non-ideal” pressure up-step (slow change) was generated by closing the exhaust gas from the bubble column to the atmosphere and forcing it to pass through a 1.3 m column of liquid (manostat). This change leads to a continuous pressure increase to an overpressure of 13 kPa. The “ideal” pressure up-step (faster change) was experimentally produced by simultaneous introduction of additional gas from a 10 L pressurized vessel into the head space of the bubble column. The theoretical (absolutely perfect) pressure step used in modelling cannot be carried out in reality and is denoted as “perfect” pressure up-step (instantaneous change).
The pressure down-step was carried out by opening the bubble column directly to the atmosphere. The pressure at the head of the bubble column was measured by an accurate differential pressure sensor (INDIF 51, ZPA Nová Paka, a.s., Nová Paka, Czech Republic).
During kLa measurements, the gas holdup was measured by bed expansion method and no significant difference was observed during the pressure changes.
3. Theoretical Model Describing the Mass Transfer during DPM
The physical situation occurring during dynamic pressure method (adapted from [22]) can be described as follows: the gas entering the bubble column is wetted air (contains mainly oxygen, nitrogen, and water vapor) and the liquid in the bubble column is saturated with this gas under atmospheric pressure. At a given time, the pressure in the column starts to grow and promotes the dissolution of oxygen and nitrogen into the liquid until the saturation under the new pressure is reached. The oxygen mass balance in liquid phase can be described by equation:
where and are dimensionless oxygen concentrations in liquid and gas phase, respectively. The Equation (1) assumes ideal mixing of liquid phase and the negligible mass transfer resistance in gas phase, which is reasonable in the case of low soluble gases such as oxygen and nitrogen. The dimensionless concentrations and the relation between the oxygen concentration in liquid , and partial pressure in gas, are defined as:
where is Henry’s constant of oxygen given in Table 2. The superscripts “atm” and “press” refer to the steady states under atmospheric and overpressure conditions, respectively. The nitrogen mass balance in the liquid can be expressed by similar equation again assuming the ideal mixing of the liquid phase:
where denotes the volumetric mass transfer coefficient for nitrogen transport, different from the volumetric mass transfer coefficient for oxygen transport, kLa. The relationship between the mass transfer coefficients for these two gases can be derived according to the theoretical concept of the mass transport through the interphase, e.g., film model, Higbie’s penetration model or Danckwerts surface-renewal model (all models reviewed by Danckwerts [35]). In the present case, the Higbie’s penetration model was used and the mass transfer coefficient was taken as proportional to the square root of gas diffusivity. On the right-hand side of Equation (3), coefficients and are the diffusivities of oxygen and nitrogen in liquid given in Table 2, respectively, P is dimensionless total pressure, is oxygen molar fraction in dry gas in steady state (excluding water partial pressure pw) and is dimensionless nitrogen concentration in the liquid:
As the pressure is changed during the experiments, the mass balance of the gas phase also needs to be considered. Equations (5) and (6) express the dimensionless mass balance of oxygen in the gas phase and the dimensionless total balance for the gas phase, respectively, assuming ideal mixing of the gas phase:
Here QG,in and QG,out are input and output gas flow rates, respectively, V is the total volume of dispersion, R is the gas constant, T is temperature, and εG is the gas hold up which is assumed to be constant during the pressure step (approximation valid for pressure change lower than 20% according to [23]). The quantities and denote the equilibrium Henry’s constants given in Table 2. Additional parameters are defined as:
The particular terms in Equation (5) from left to right denote the gas input to the system, gas output from the system, time change of oxygen partial pressure due to total pressure change, and time loss of oxygen due to the mass transfer through the interface. The meaning of the terms in Equation (6) is the same just the last term denotes the flux of both oxygen and nitrogen through the interphase. In the case of using pure oxygen instead of air, the mass balance given by Equations (1), (3), (5) and (6) reduce to a single equation:
The equations of the model with air absorption (1) or pure oxygen absorption (8) are numerically solved with the initial conditions (0) = (0) = (0) = P(0) = 0 and the solution is used to fit the experimental oxygen probe responses with kLa as optimized parameter. Before the fitting procedure, the probe response dynamic D(t) is included using convolution integral:
where t0 is the time delay due to bypass and is the final model oxygen concentration profile which is fitted with experimental oxygen probe response to get the value of the volumetric mass transfer coefficient.
All the Equations (1)–(8) are expressed assuming the ideal mixing of both phases. These assumptions were tested in a stirred tank reactor with multiple impellers [20], Appendix A in [24]. The authors found that the effect of gas phase axial mixing on the kLa values measured by DPM is suppressed because the oxygen concentration in the gas is changed simultaneously in all the bubbles in the batch. Note that the assumption of gas phase ideal mixing is not valid when standard dynamic method is used where the gas is exchanged at the reactor inlet. Such simplification of the reality can bring unacceptably high errors [20]. As for the mixing in the liquid phase, Fujasová et al. [24] pointed out that the liquid axial mixing is not negligible especially in reactors with high height-to-diameter ratio. However, the arithmetic mean of kLa values across the liquid height (evaluated with ideal mixing of both phases) gives a reasonable approximation of the physically correct mass transfer data. The same authors also provide the comparison of this arithmetic mean with kLa data measured at the middle of a multiple-impeller stirred tank reactor and found reasonable agreement within the standard deviation of 10%. According to these findings, we can conclude that the uncertainty of kLa values obtained by DPM in the middle of the contactor (at half free liquid height) and assuming ideal mixing of both phases is about 10%.
Han & Al-Dahhan (2007) [17] tested the effect of liquid phase axial mixing on resulting kLa data in bubble column measured by standard dynamic method and found that by increasing or decreasing 50% of the liquid axial dispersion coefficient, the fitted kLa data was affected by less than 2%.
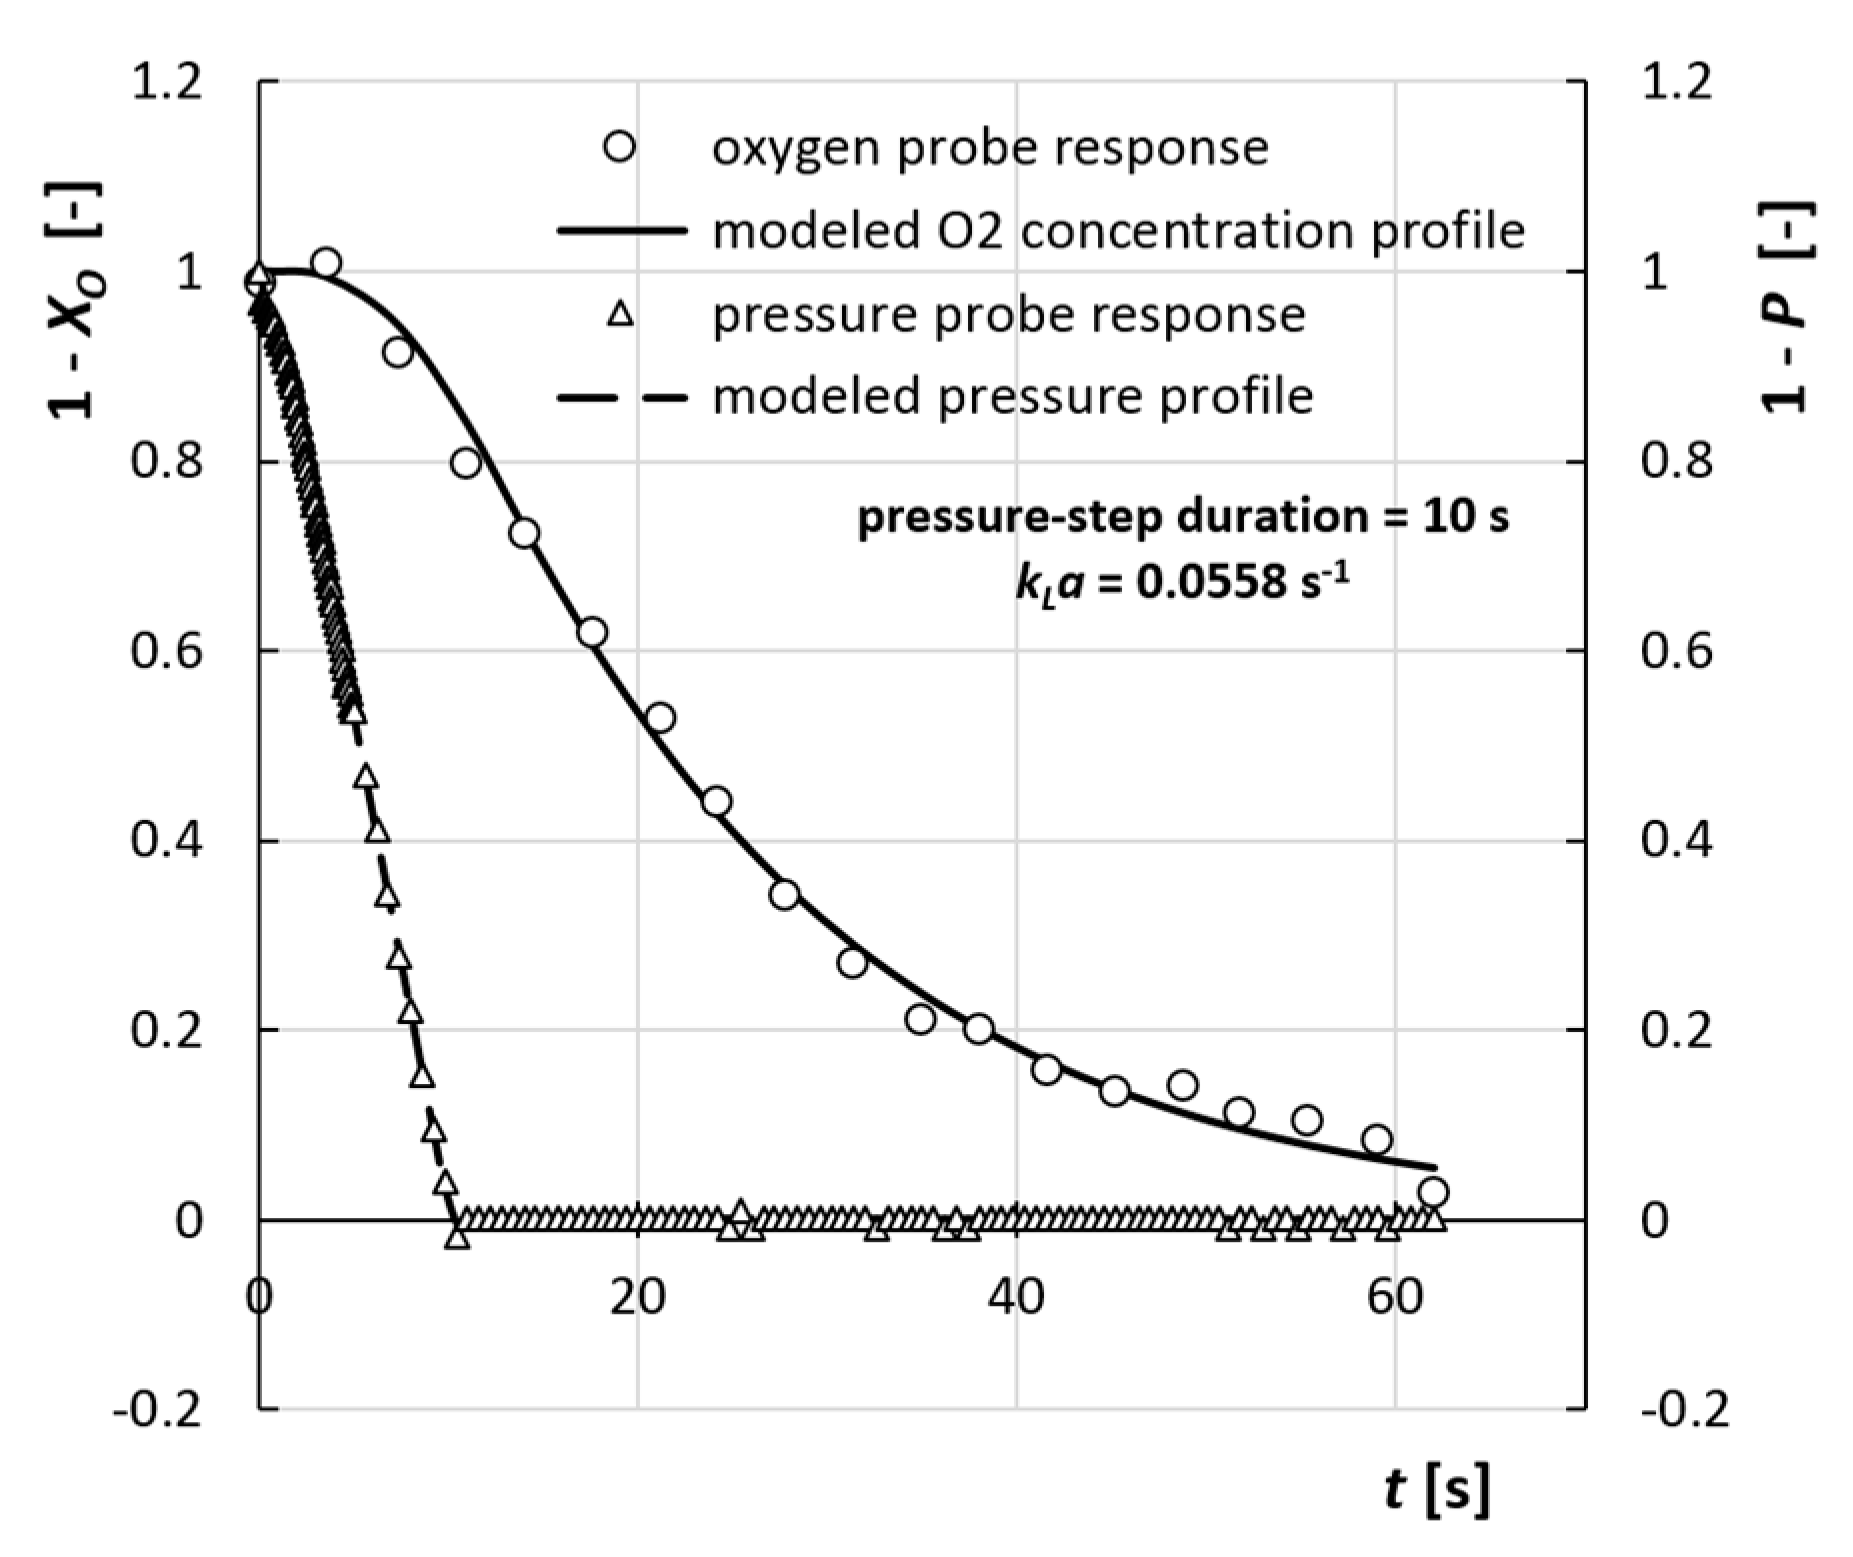
Based on the previous discussion, we tried to reduce the effect of liquid axial mixing on the resulting kLa data by measuring the oxygen concentration in the liquid as close as possible to the middle of the free liquid height (Figure 1). The correctness of the used model (Equations (1)–(8)) for the present system can be seen in the comparison of the experimental responses with the profile fits obtained from the model (Figure 2). The good agreement between the experimental and modeled profiles demonstrates that the model assuming ideal mixing of both phases describes reasonably the mass transfer in bubble column when the oxygen concentration in the liquid is measured approximately in the middle of the column. Note that, the study of the effect of the liquid axial mixing on the kLa value is out of the scope of the present work and it should be investigated by independent axial dispersion coefficient measurements and also by measurements of the oxygen responses in several positions along the liquid height.
4. Results
4.1. Description of Hydrodynamics
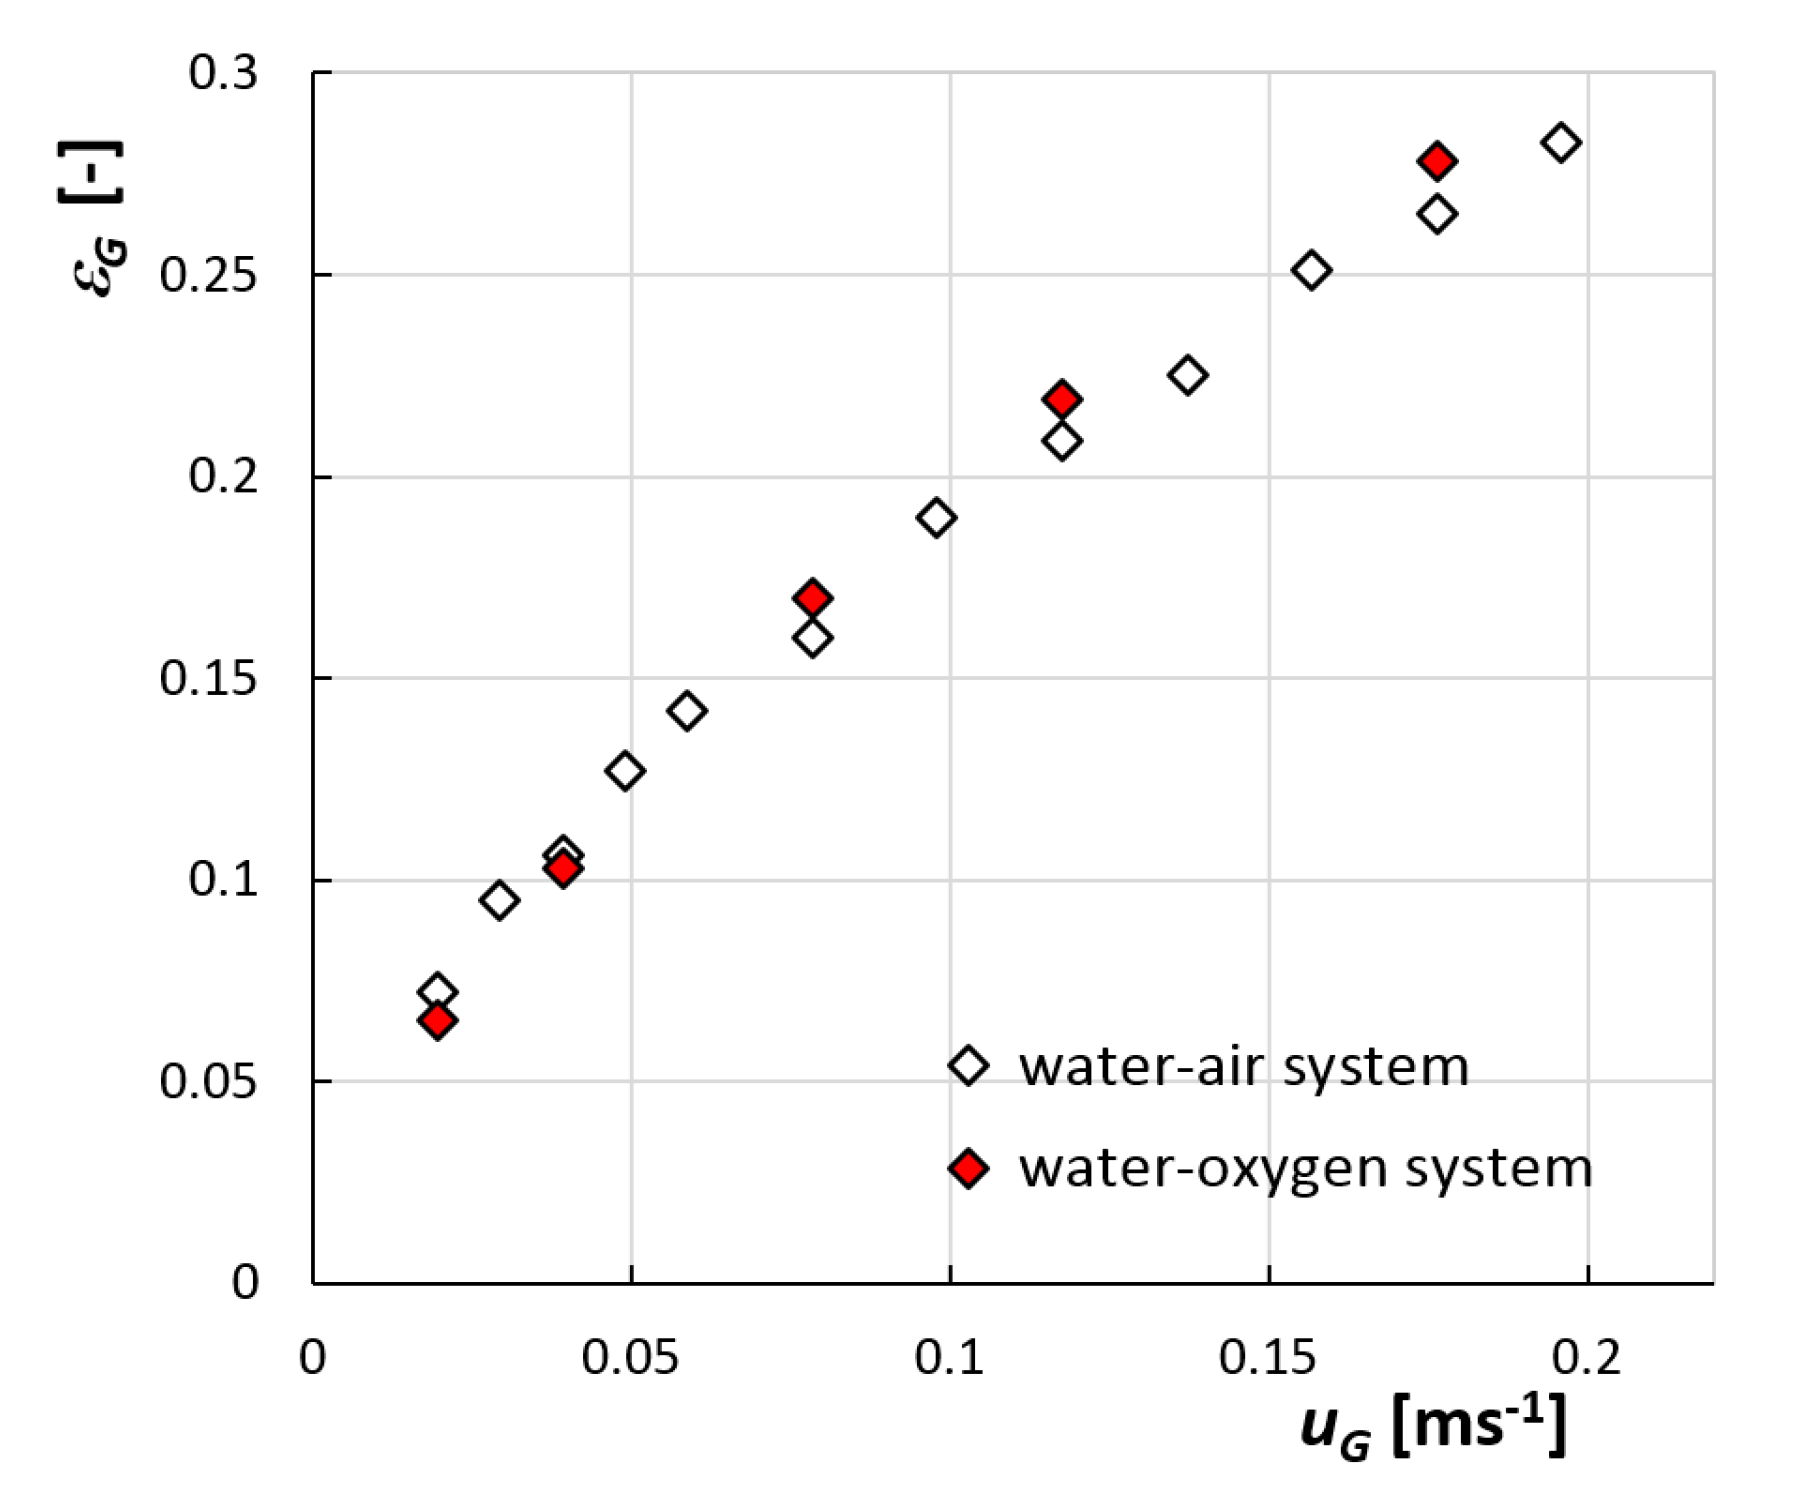
The mass transfer rate in gas-liquid systems, such as bubble columns, is function of hydrodynamic conditions present during measurements [36], so we start the presentation of our results with the characterization of the hydrodynamic regime observed. The gas distributor used in the present work was a perforated metal plate with wide spacing between large orifices (1.6 mm diameter). Regardless of the gas input into the bubble column, this distributor produces poly-dispersed bubble size distribution with presence of small and large bubbles [37,38] which is characteristic for pure heterogeneous regime. The monotonous dependence of gas hold-up on gas superficial velocity seen in Figure 3 is typical for a bubble column operated in pure heterogeneous regime [32,33].
In order to obtain physically correct kLa data, as discussed in Section 3, the liquid height and consequently the aspect ratio (H/D) were chosen to minimize the effect of liquid axial mixing. We worked with H = 1 m, D = 0.19 m and D/H ≅ 5. Such design parameters obey the scale-up criteria defined by Wilkinson et al., 1992 [39] and discuss in [40] that the gas hold-up curve is independent on aspect ratio and can be used to design larger bubble columns. Recently, new criteria were proposed by Sasaki et al., 2017 [41]: D ≥ 0.2 m, H ≥ 2.2 m. According to these criteria, our column is out of the aspect ratio independent operation mode. Note that, these criteria were established for safe design of industrial columns, establishing the optimum dimensions of a lab scale column for design parameters determination. The present work does not aim at scale-up measurement but as validation of DPM as method providing physically correct data of volumetric mass transfer coefficient in bubble columns.
4.2. Mass Transfer—Comparision of Ideal and Non-Ideal Pressure Step
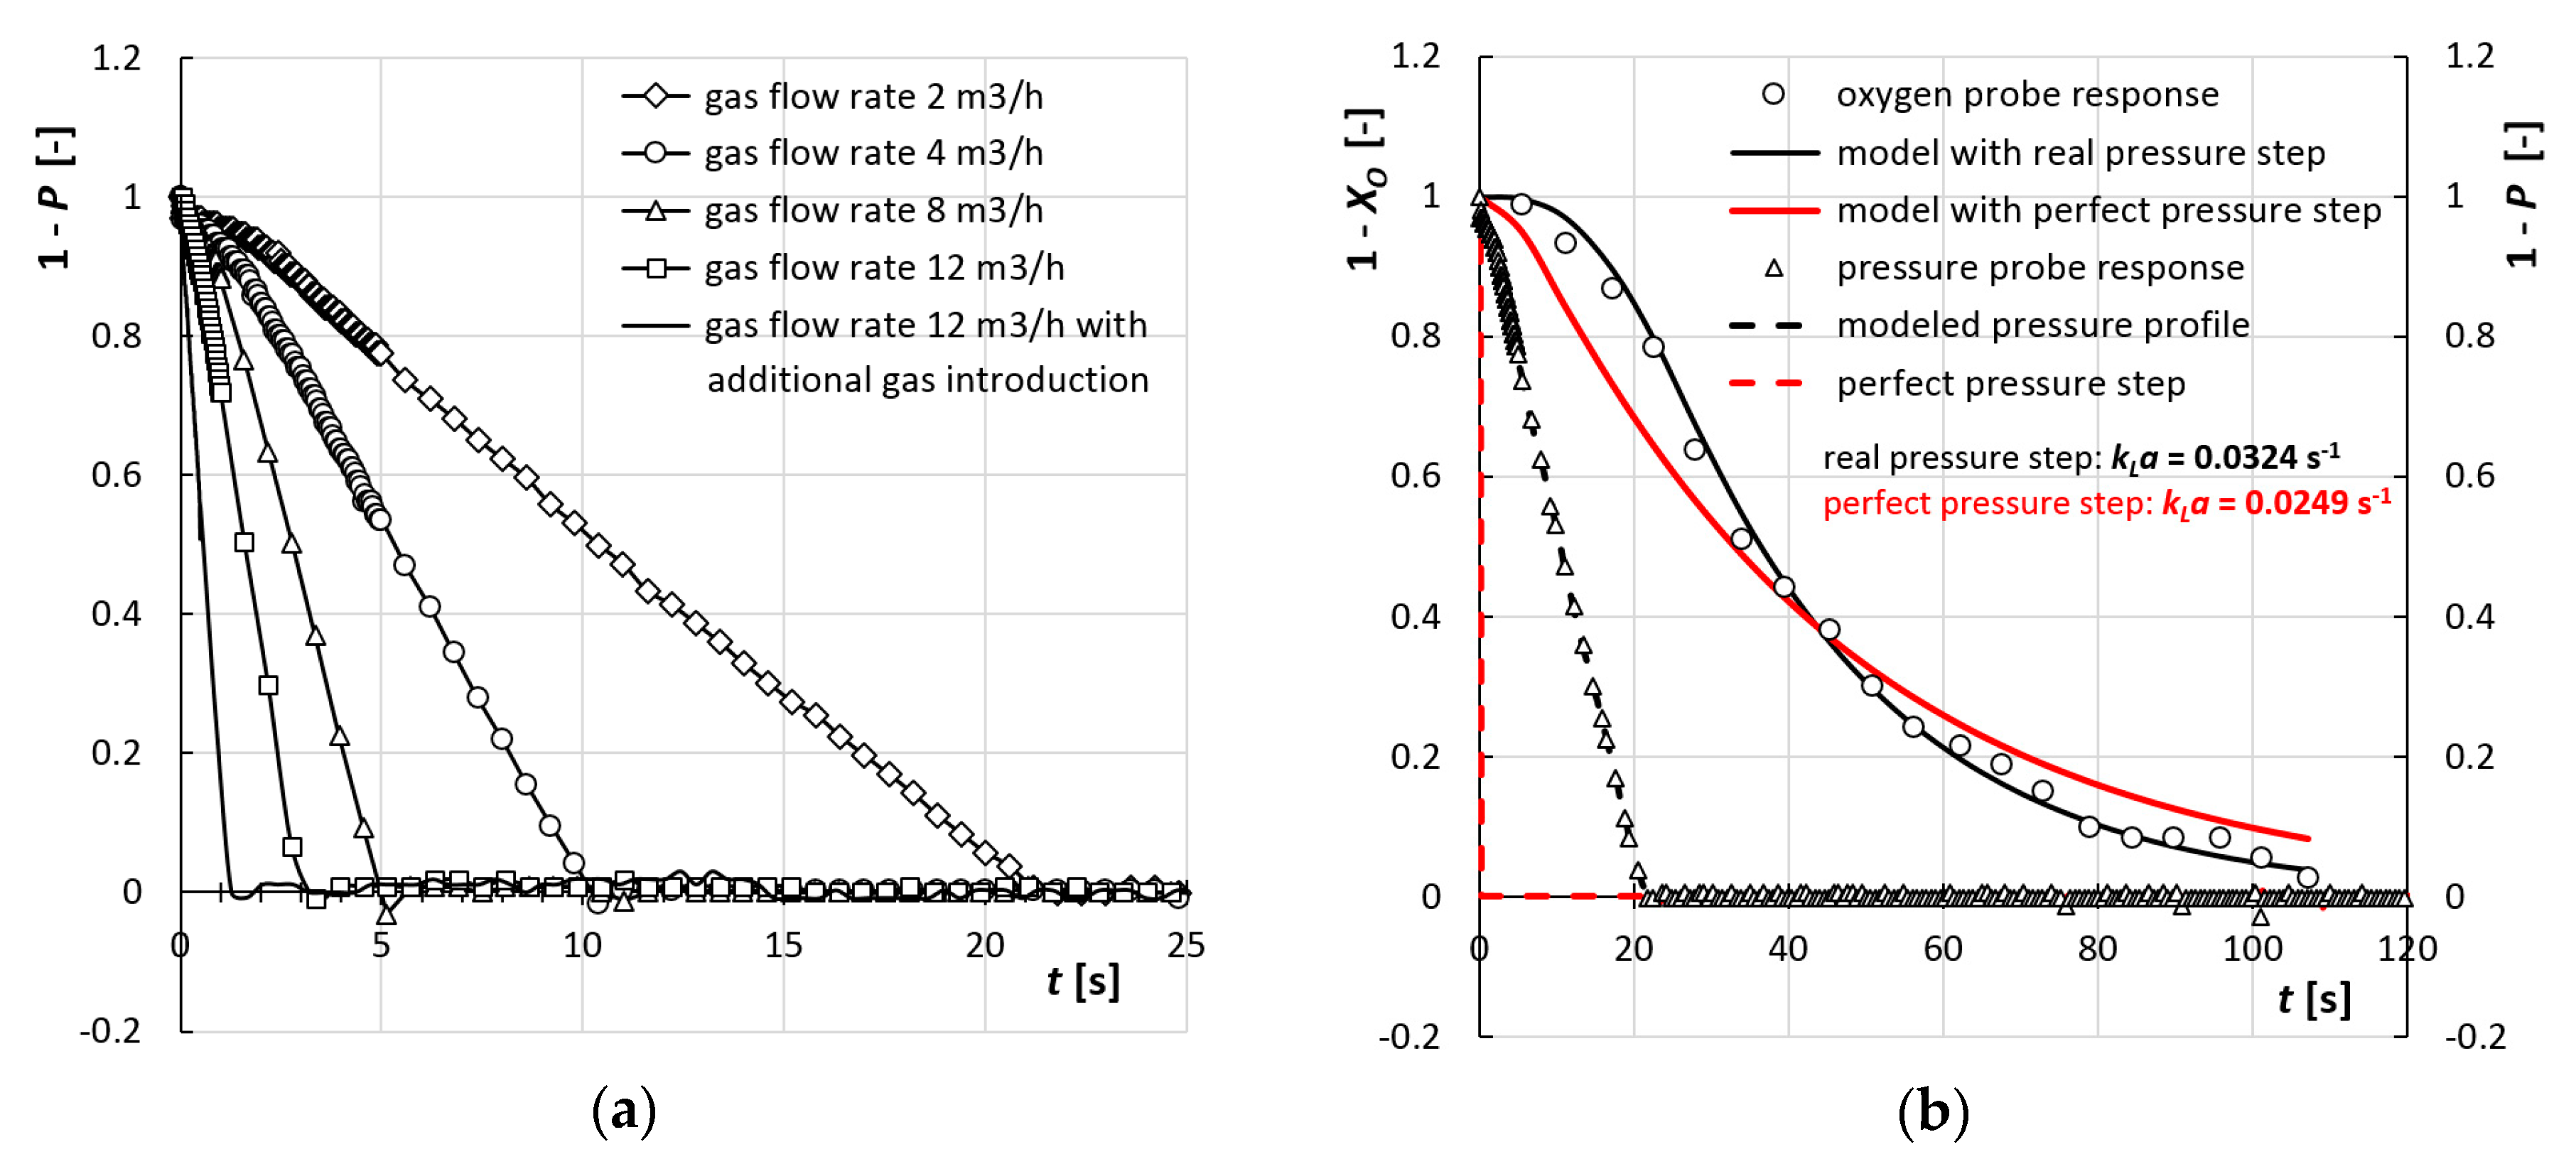
The effect of pressure step duration was tested using air as the gas phase. Using the non-ideal pressure step, the steady state value for the pressure was reached within 3 to 20 s depending on the gas flow rate (Figure 4a). In the same figure, the pressure profile obtained in the system for the ideal pressure step is also shown for QG = 12 m3/h (continuous line without symbols), with a pressure steady state value being reached in 1 s. The duration and shape of the pressure step can affect the value of kLa. If the virtual perfect pressure step is considered in the modelling, significant errors can be caused in kLa evaluation [22].
This is demonstrated in Figure 4b where the perfect pressure step gives incorrect oxygen profile and a different kLa value. The comparison is shown for the lowest gas flow rate (QG = 2 m3/h) where the pressure relaxation time is the highest contrary to the zero-time duration of the virtual perfect pressure step. Accordingly, in the present work, we used the realistic data from experimentally realized pressure steps, both in non-ideal and ideal conditions.
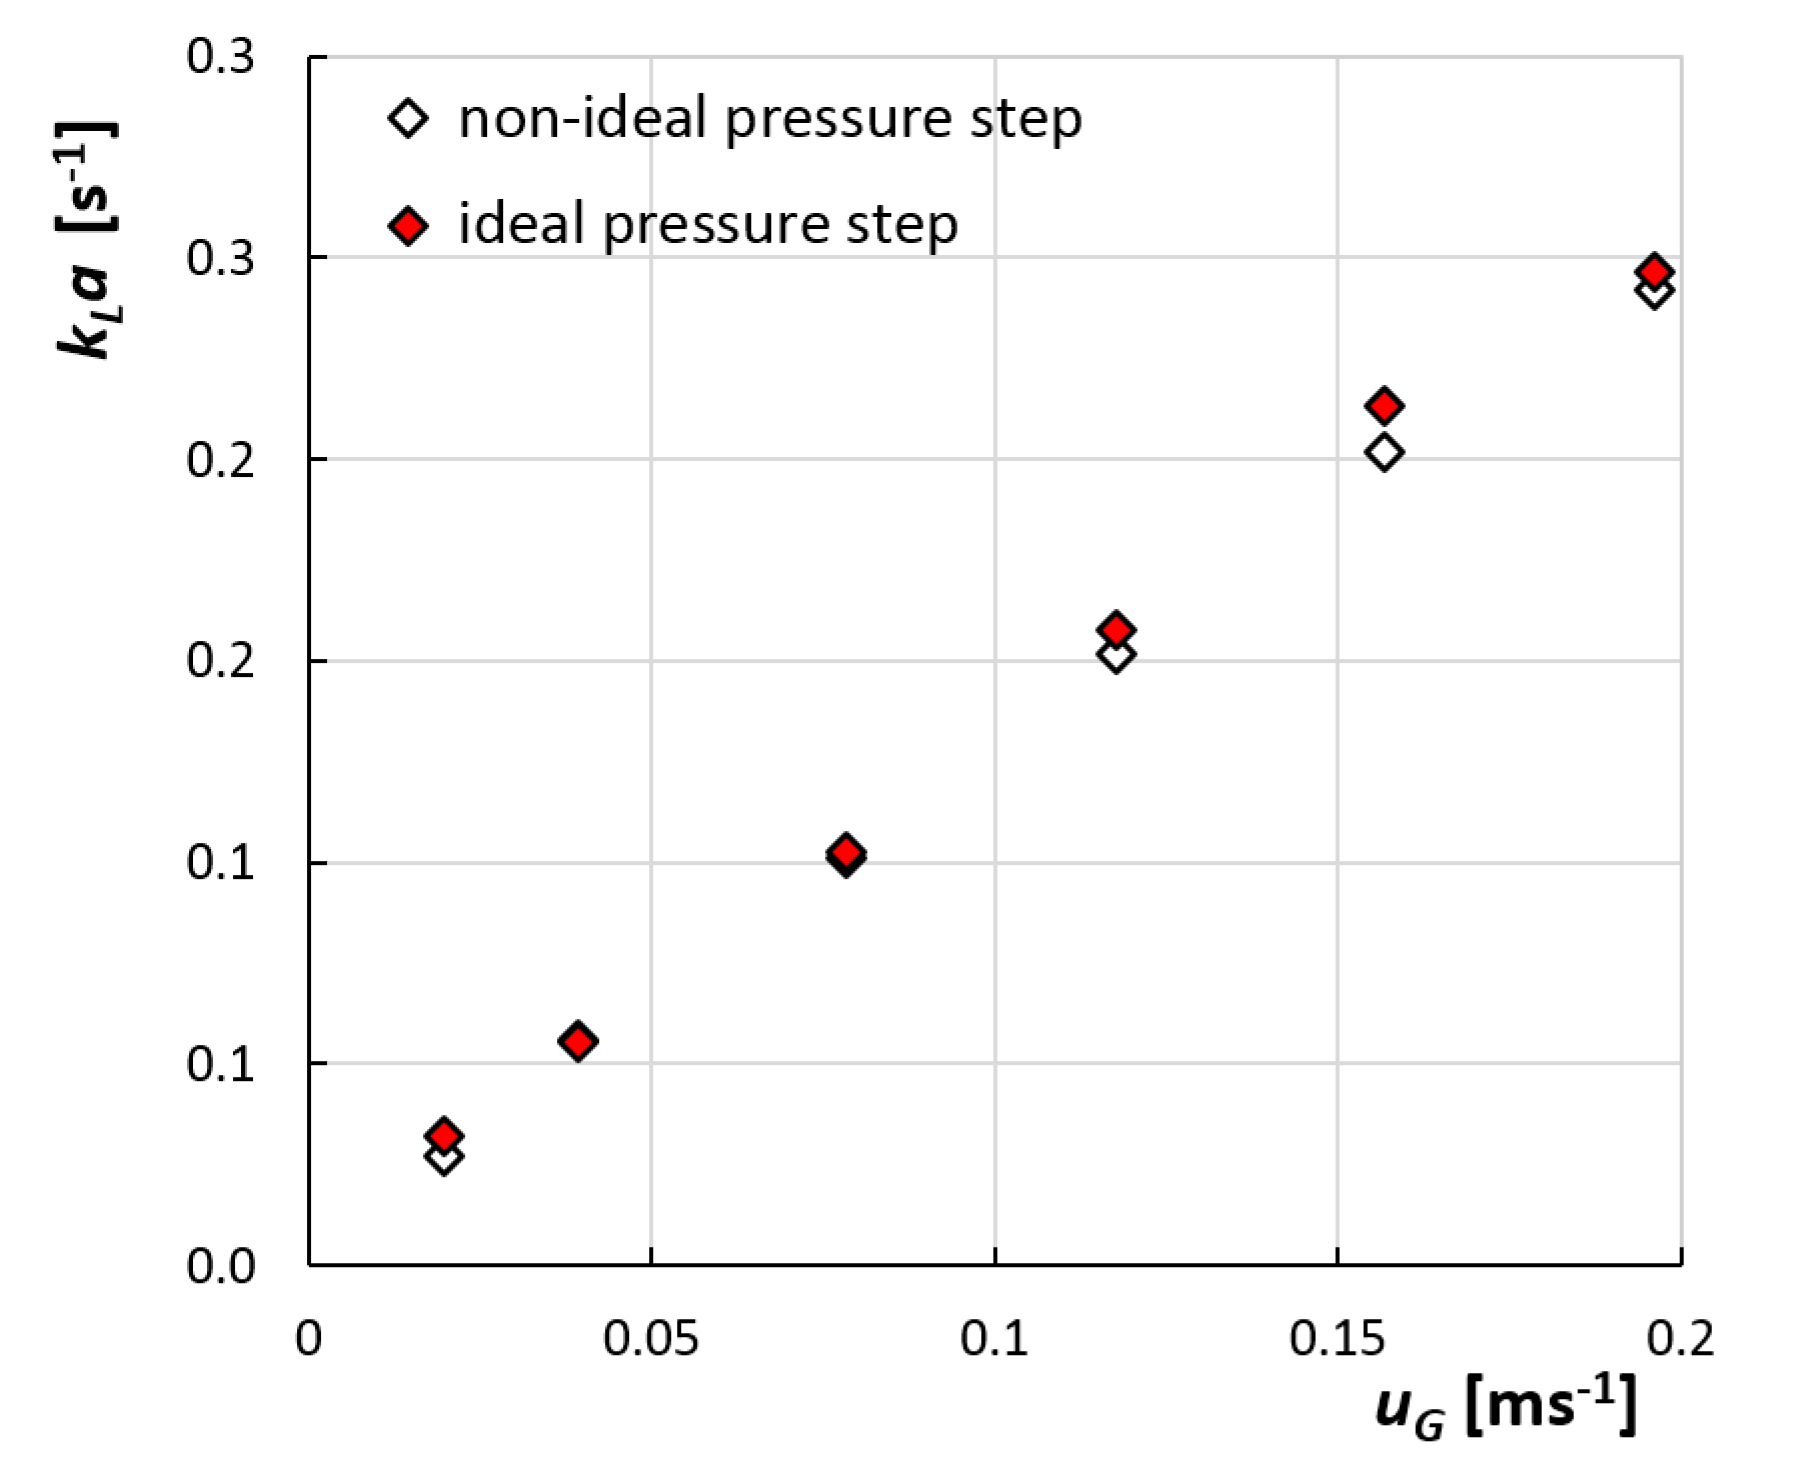
Figure 5 shows results of using ideal and non-ideal pressure step for kLa as function of the gas superficial velocity. A very good agreement is found between the results obtained using both methods in the whole range of superficial gas velocities. Similar results were obtained for measurements in a stirred tank reactor by [22]. These authors proved that kLa data in stirred tank reactor measured using ideal and non-ideal pressure step methods did not differ, regardless of the coalescing properties of the batch. Thus, the non-ideal pressure step method, which is much easier to handle than the ideal pressure step method, can be used also in a bubble column with high height-to-diameter ratio.
4.3. Mass Transfer—Comparison of Pure Oxygen and Air Absorption
The biggest problem related to the kLa measurement comes from the incorrect description of driving force in modelling of mass transport [19,22]. The physical correctness of kLa data can be verified by comparing the results obtained from pure oxygen absorption and results obtained from air absorption with simultaneous oxygen and nitrogen mass transfer. During pure oxygen absorption, there is no problem with driving force description in the model, thus the resulting kLa should be physically correct. On the contrary, the modeling of air absorption is more complicated and neglecting the nitrogen transport can cause significant underestimation of kLa data especially in non-coalescent batch at high gas flow rates [21,22,25,26,30].
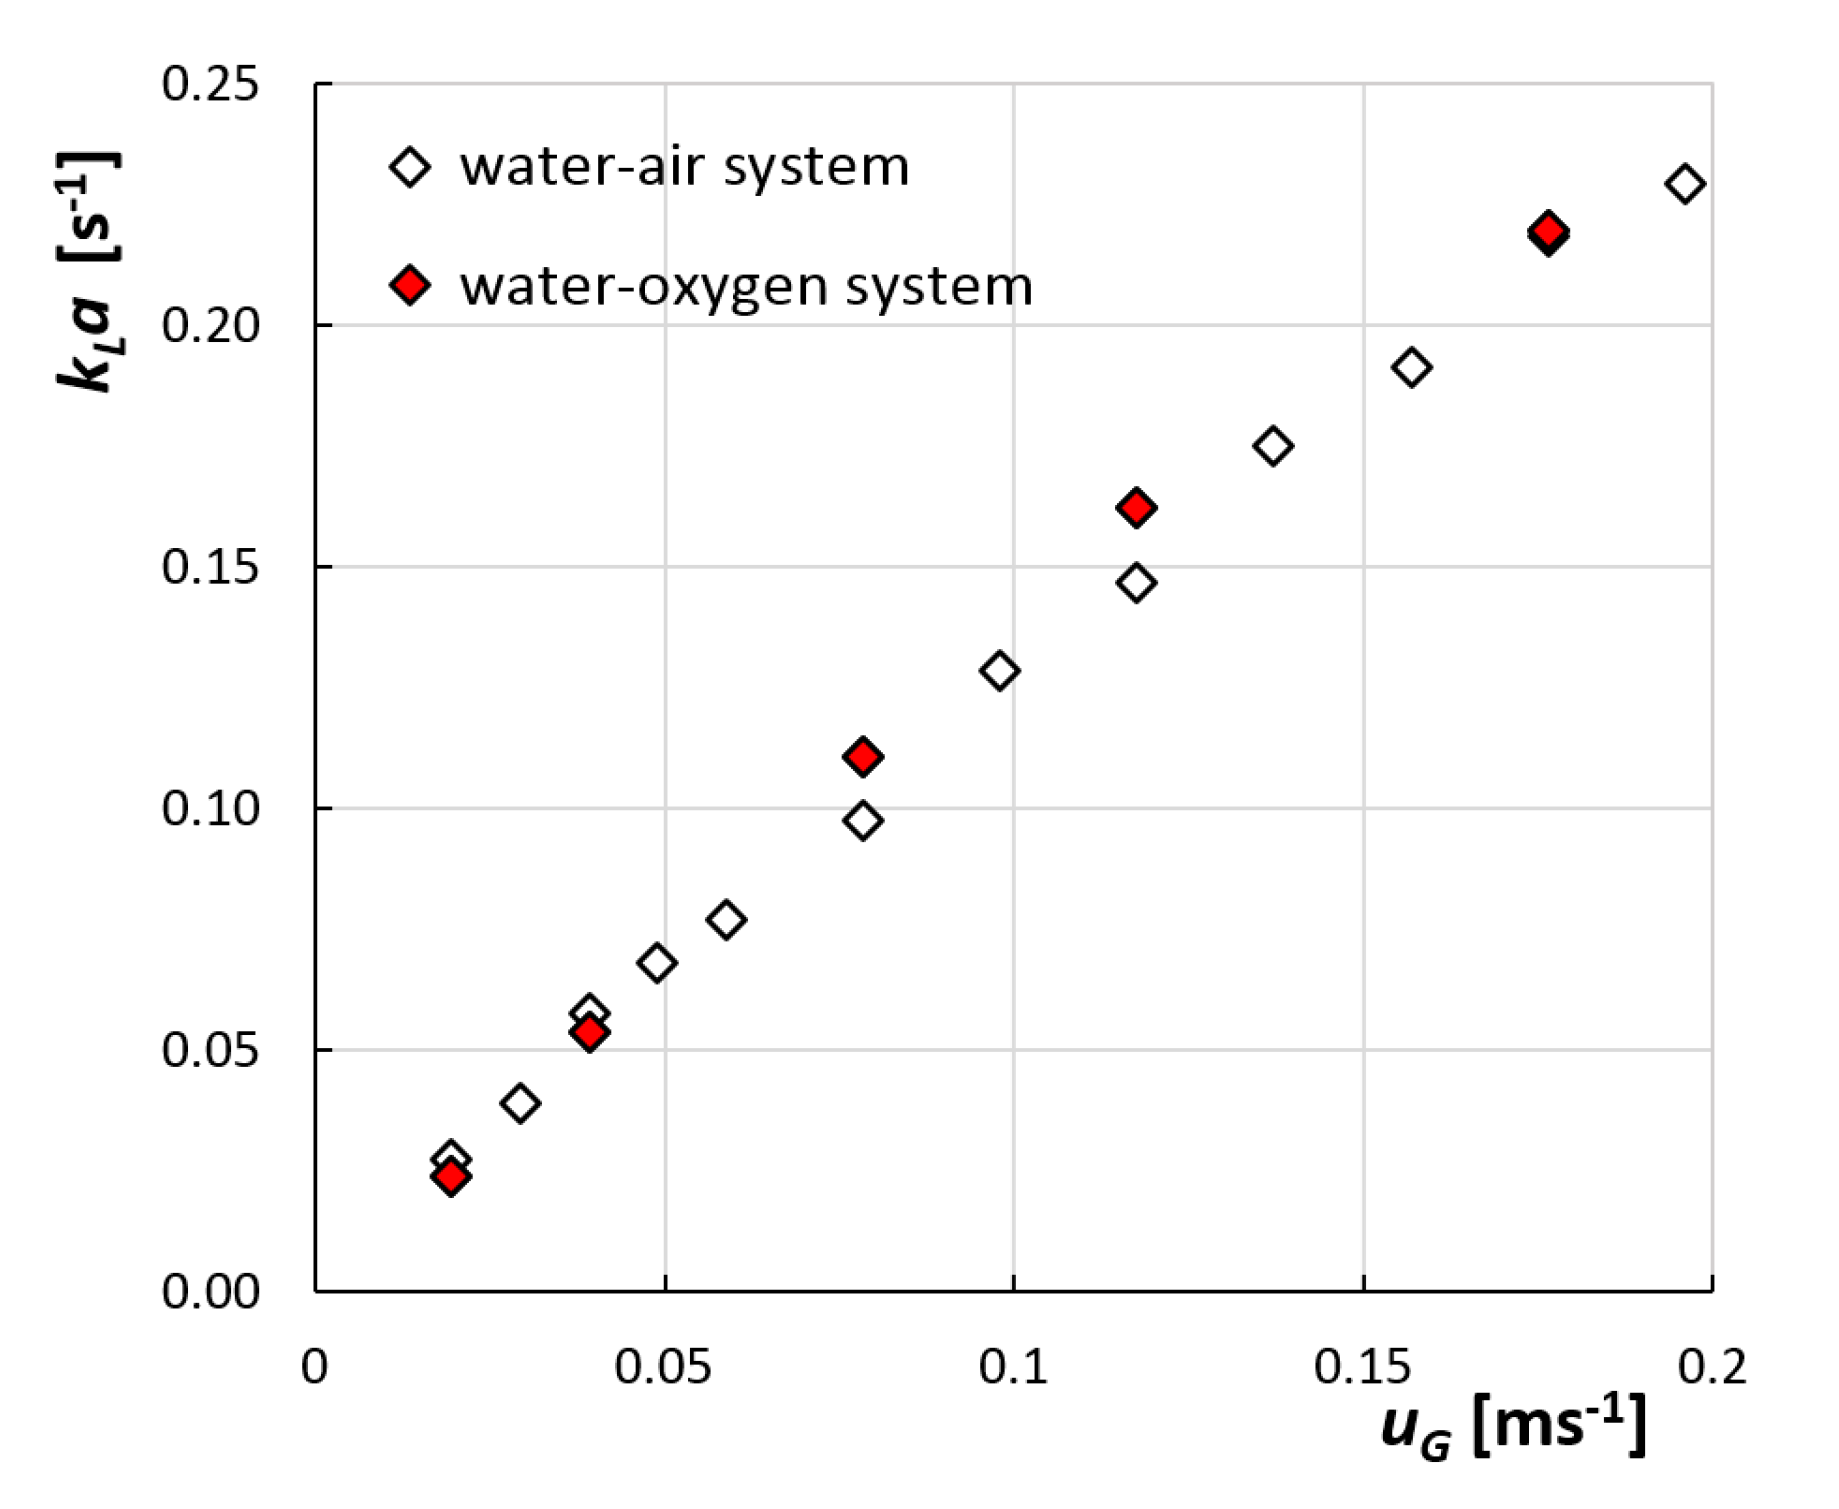
In the present work, the physical correctness of the obtained kLa values is proved for the coalescent liquid only (distilled water) using the non-ideal pressure step. In the Figure 6, the data obtained during pure oxygen absorption and during air absorption assuming the simultaneous oxygen and nitrogen transport are compared. Very good agreement is found and the differences do not exceed the uncertainty of the kLa measurement (±10%).
Similar results, concerning the agreement between data obtained with pure O2 absorption and air absorption both in coalescent and non-coalescent batches, were observed also by other authors [22,26,29,30]. Linek and co-workers compared results obtained in laboratory (0.29 m in diameter in [22]) and pilot-scale stirred tank reactors (0.6 m in diameter in [26]) and in both cases, the DPM provided physically correct kLa data within a reasonable data scatter. The same conclusion was presented by Blazej and co-workers for internal loop air-lift reactor [29,30].
The present results allow us to take the DPM with air absorption as a valid method for the measurement of volumetric mass transfer coefficient in bubble columns. This variant of DPM is more economical and safer than the alternative use of pure oxygen.
5. Discussion
As shown in Section 4, the dynamic pressure method was validated to provide reliable data for volumetric mass transfer coefficient in bubble columns with coalescent liquids. For correlating experimental data of kLa there are two approaches: either to express their dependency on the gas superficial velocity (more frequent) or their dependency on the gas holdup data (see the correlations [9,12,14,15,16] in Table 1). Table 3 resumes both types of correlations and it includes also the correlation for gas holdup data and operating conditions for our measurements. The correlations were obtained by fitting all the gas holdup and kLa data determined using ideal, non-ideal pressure step, air and pure oxygen absorption.
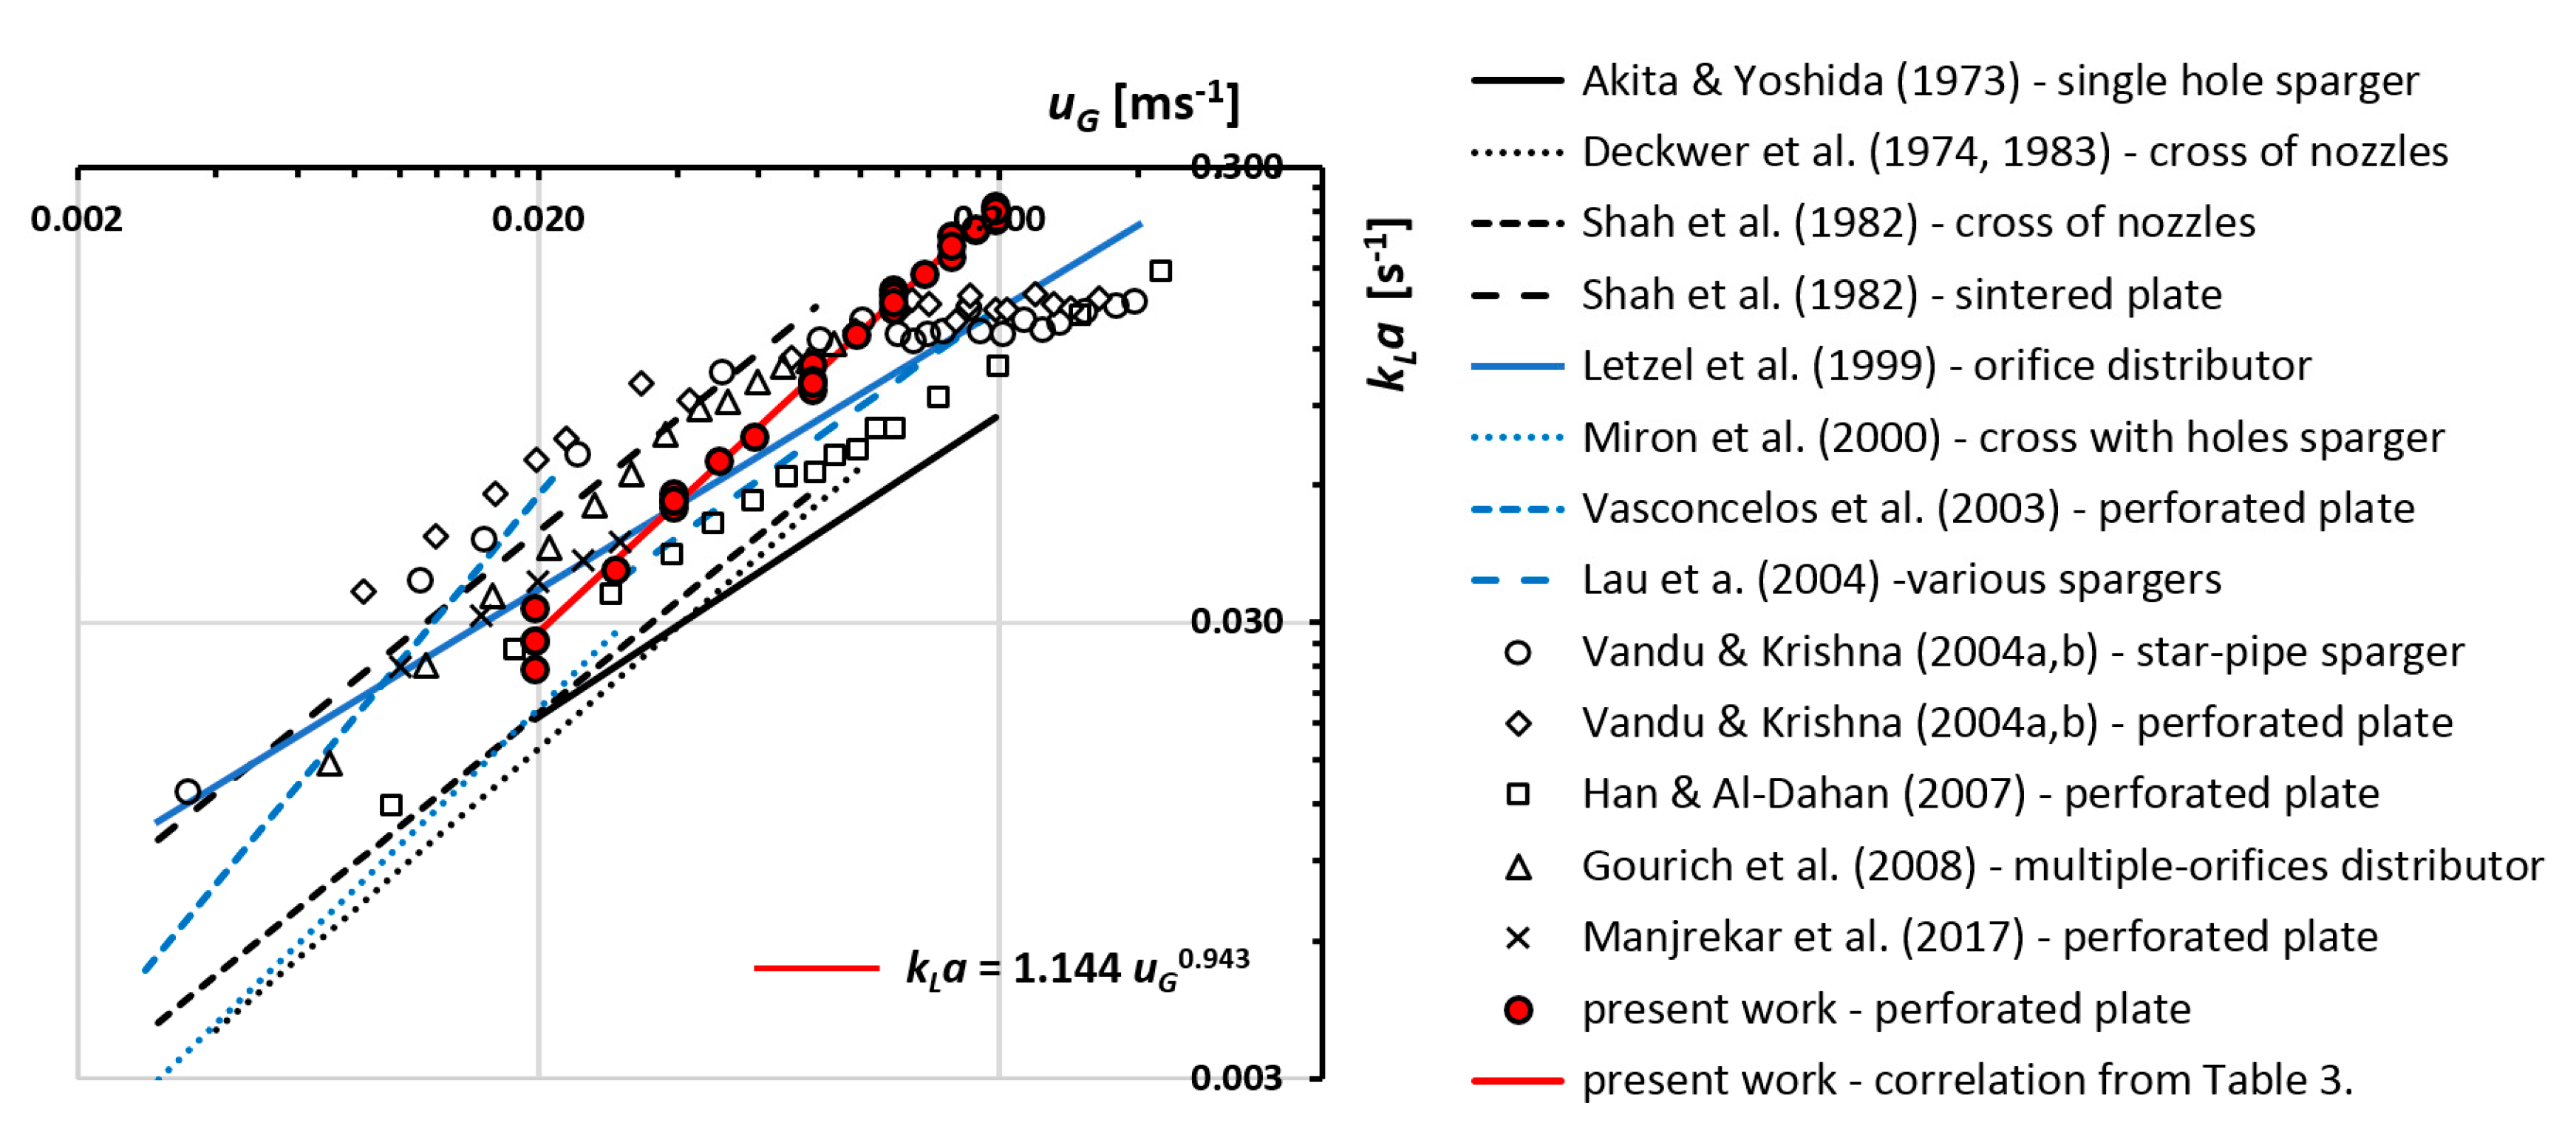
The obtained experimental data and correlations are compared with kLa values, obtained by various authors (Table 1), in Figure 7 and Figure 8. A reasonable agreement of present experimental data is found with experimental data by Han and Al-Dahan (2007) [17] and by Manjrekar (2017) [5] for low gas flow rates (uG < 0.03 m/s). Both studies report results of experiments performed in bubble columns equipped with perforated plate and their hydrodynamic conditions were probably comparable with ours.
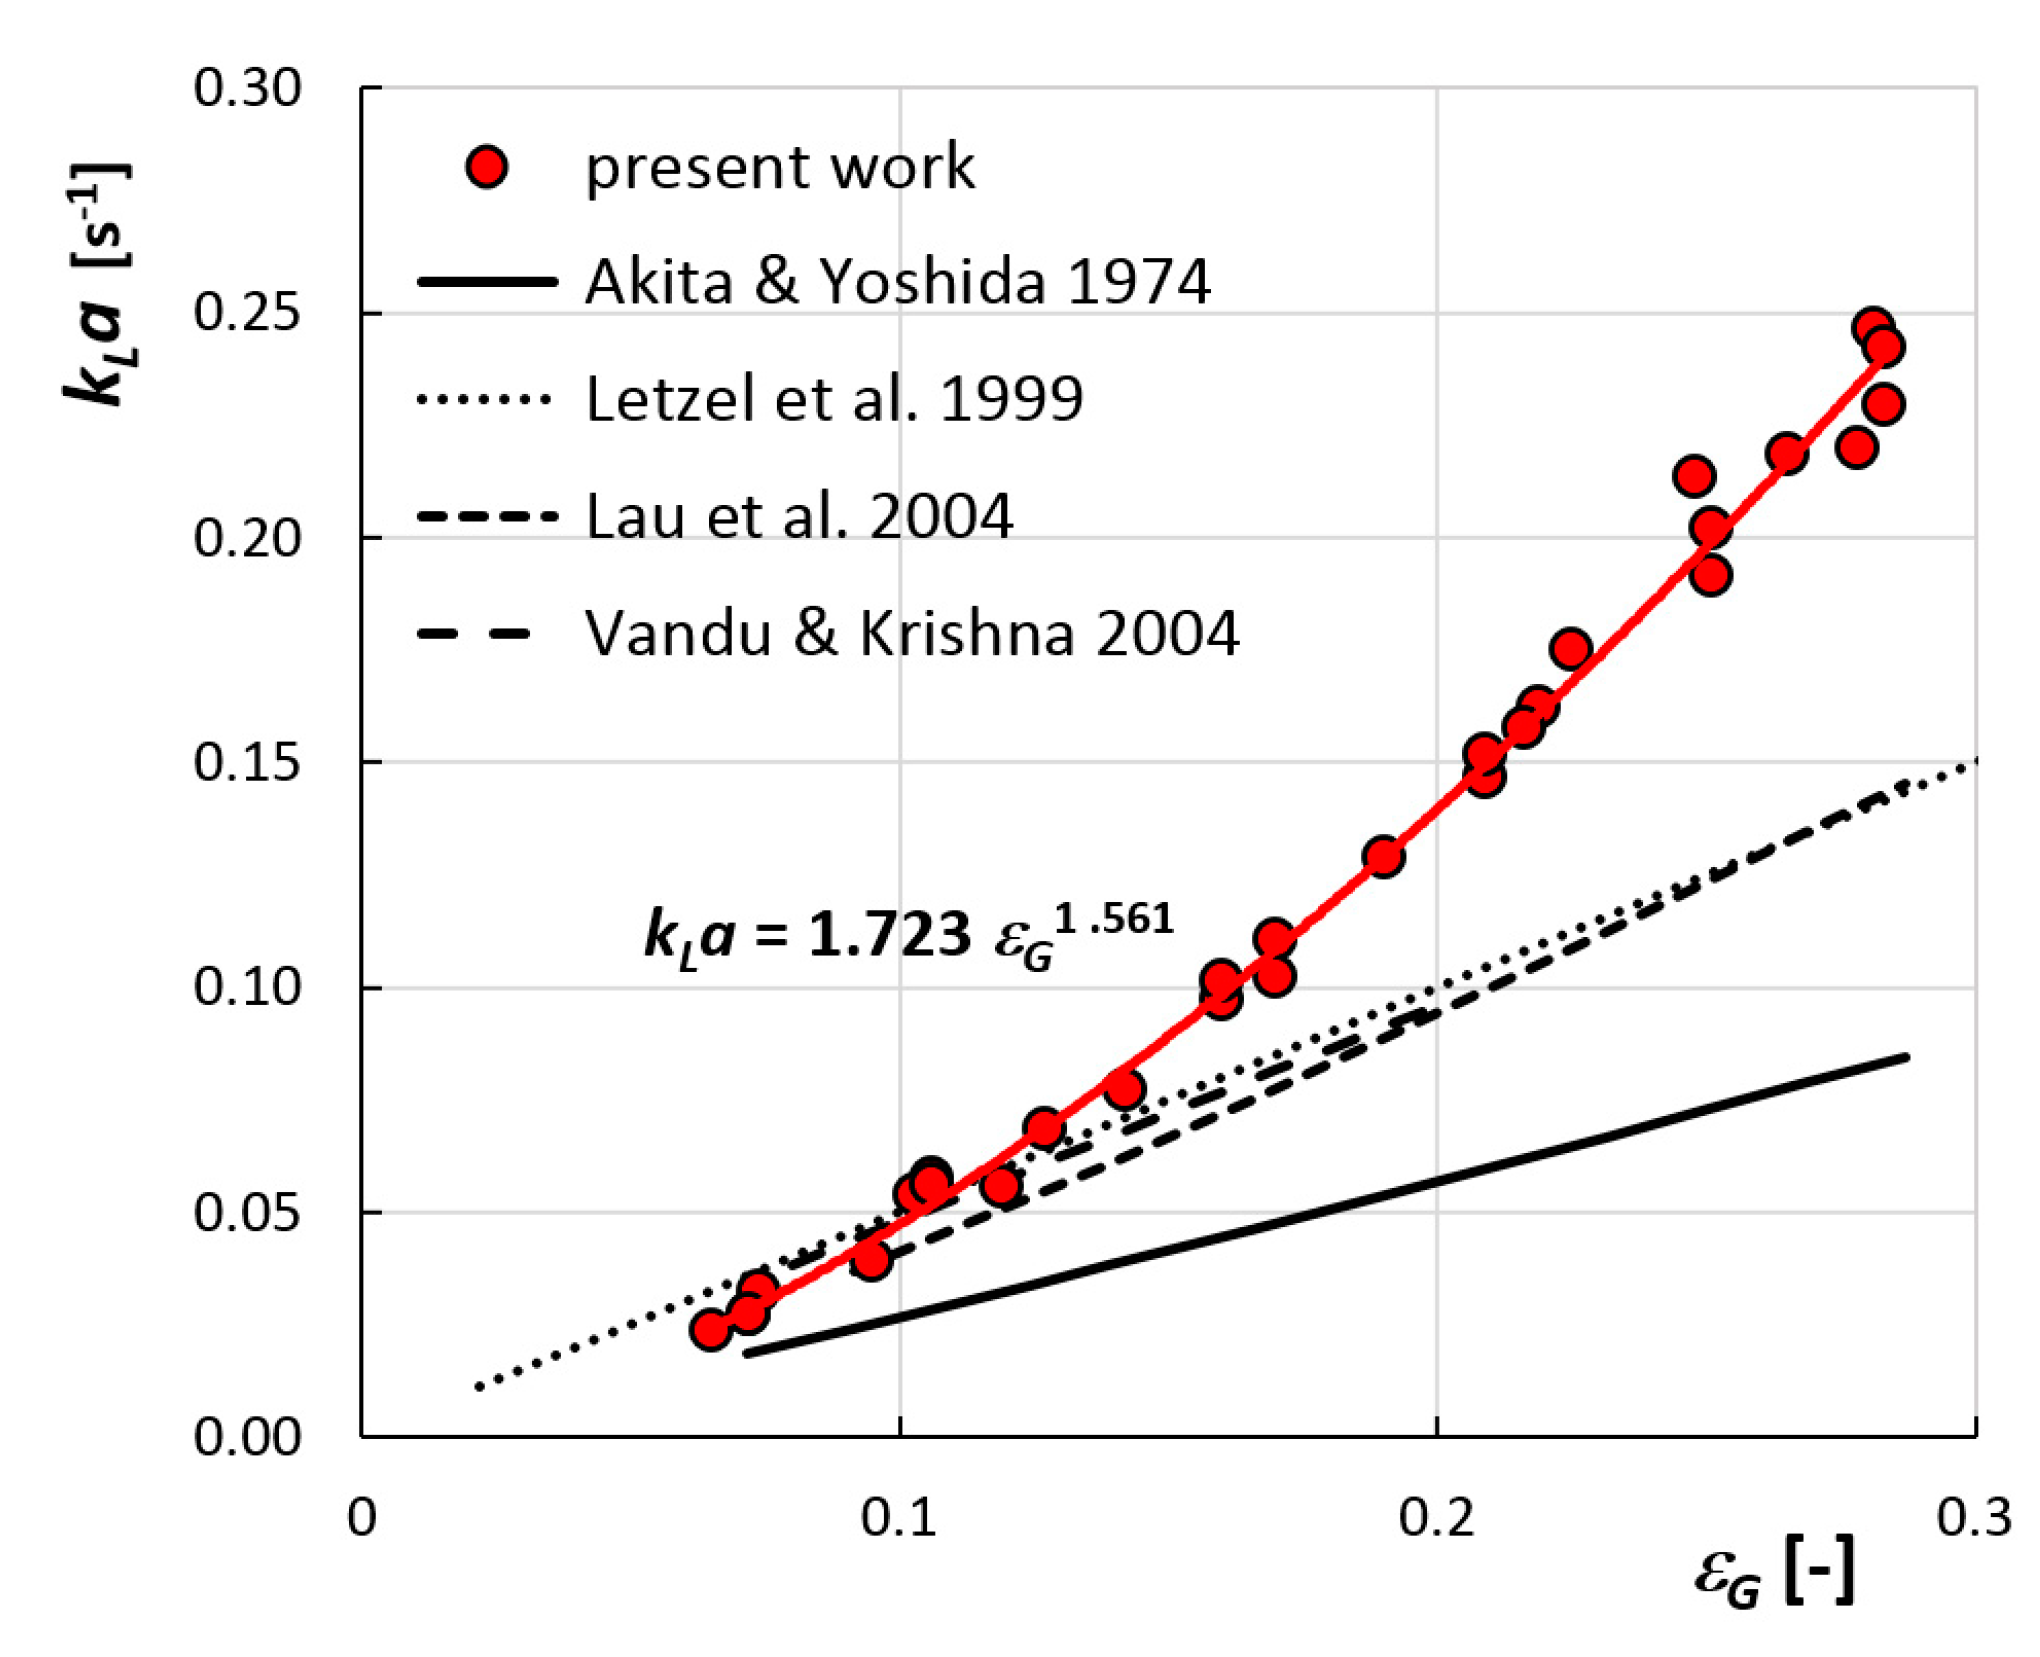
The correlation between volumetric mass transfer coefficient and gas holdup is presented in Figure 8 and shows good agreement with published results by several authors [12,14,15,16], however, again at low gas flow rates only, i.e., gas holdups (uG < 0.07 m/s, εG < 15%). At high gas flow rates (uG > 0.07 m/s), there are significant differences between the present data and the data published by other authors. There can be several reasons for these differences. Besides different hydrodynamics present, caused by different gas distributors and operating conditions, and different measurement method used, other possible reason is the temperature change during the experiments. According to our experience, the aeration in bubble columns causes a significant cooling of the liquid (up to 5 °C) especially at high gas flow rates. As both diffusivity and solubility of gases depend on the temperature, this temperature effect should be taken into account in calculations. In the case of the present data, the temperature was kept constant at 25 °C during all the experiments. In other works, this aspect is omitted, with experiments running at ambient temperature without mention of its value and if it was controlled. None of the less, a decrease of temperature up to 5 °C causes the increase of volumetric mass transfer coefficient up to 13% [42]. Accordingly, the temperature control in bubble columns is important and its omission can cause systematic errors in the prediction of mass transfer rates.
6. Conclusions
The dynamic pressure method was used to measure the volumetric mass transfer coefficient in 0.19 m bubble column with pure heterogeneous flow regime for distilled water representing a coalescent liquid. The two effects proving the reliability of kLa results were tested: (i) the effect of pressure step non-ideality and (ii) the effect of gas composition (air absorption and pure oxygen absorption).
Taking into account the measured pressure profile and using it in the theoretical model, the DPM provides reliable kLa values in all ranges of the operating conditions. The good agreement between the measured values of kLa using air and pure oxygen absorption proved the physical correctness of obtained results. Resuming, the dynamic pressure method was validated for the measurement of the volumetric mass transfer coefficient in bubble columns with 10% estimated uncertainty in the results.
Author Contributions
Marie Fialová, Sandra Orvalho and Mária Zedníková conceived and designed the experiments; Marie Fialová and Sandra Orvalho performed, the experiments; Sandra Orvalho, Marek C. Ruzicka and Mária Zedníková analyzed and interpreted the data; Mária Zedníková wrote the paper.
Acknowledgments
The authors would like to thank to parent institution Institute of Chemical Process Fundamentals of the CAS for the financial support of current research. Further, the authors would like to thank to Václav Linek and Tomáš Moucha for valuable help during the construction of experimental setup for mass transfer measurement and correct data analysis. The authors would like to thank also to Petr Stanovský for technical and experimental support.
Conflicts of Interest
The authors declare no conflict of interest.
References
- Degaleesan, S.; Dudukovic, M.; Pan, Y. Experimental study of gas-induced liquid-flow structures in bubble columns. AIChE J. 2001, 47, 1913–1931. [Google Scholar] [CrossRef]
- Kantarci, N.; Borak, F.; Ulgen, K.O. Bubble column reactors. Process Biochem. 2005, 40, 2263–2283. [Google Scholar] [CrossRef]
- Kraakman, N.J.R.; Rocha-Rios, J.; van Loosdrecht, M.C.M. Review of mass transfer aspects for biological gas treatment. Appl. Microbiol. Biotechnol. 2011, 91, 873–886. [Google Scholar] [CrossRef] [PubMed]
- Shah, Y.T.; Kelkar, B.G.; Godbole, S.P.; Deckwer, W.D. Design parameters estimations for bubble column reactors. AIChE J. 1982, 28, 353–379. [Google Scholar] [CrossRef]
- Manjrekar, O.N.; Sun, Y.J.; He, L.; Tang, Y.J.; Dudukovic, M.P. Hydrodynamics and mass transfer coefficients in a bubble column photo-bioreactor. Chem. Eng. Sci. 2017, 168, 55–66. [Google Scholar] [CrossRef]
- Thobie, C.; Gadoin, E.; Blel, W.; Pruvost, J.; Gentric, C. Global characterization of hydrodynamics and gas-liquid mass transfer in a thin-gap bubble column intended for microalgae cultivation. Chem. Eng. Process. 2017, 122, 76–89. [Google Scholar] [CrossRef]
- Miron, A.S.; Camacho, F.G.; Gomez, A.C.; Grima, E.M.; Chisti, Y. Bubble-column and airlift photobioreactors for algal culture. AIChE J. 2000, 46, 1872–1887. [Google Scholar] [CrossRef]
- Garcia-Ochoa, F.; Gomez, E. Bioreactor scale-up and oxygen transfer rate in microbial processes: An overview. Biotechnol. Adv. 2009, 27, 153–176. [Google Scholar] [CrossRef] [PubMed]
- Akita, K.; Yoshida, F. Gas holdup and volumetric mass-transfer coefficient in bubble columns—Effects of liquid properties. Ind. Eng. Chem. Process Des. Dev. 1973, 12, 76–80. [Google Scholar] [CrossRef]
- Deckwer, W.D.; Burckhart, R.; Zoll, G. Mixing and mass-transfer in tall bubble columns. Chem. Eng. Sci. 1974, 29, 2177–2188. [Google Scholar] [CrossRef]
- Deckwer, W.D.; Nguyentien, K.; Kelkar, B.G.; Shah, Y.T. Applicability of axial-dispersion model to analyze mass-transfer measurements in bubble-columns. AIChE J. 1983, 29, 915–922. [Google Scholar] [CrossRef]
- Letzel, H.M.; Schouten, J.C.; Krishna, R.; van den Bleek, C.M. Gas holdup and mass transfer in bubble column reactors operated at elevated pressure. Chem. Eng. Sci. 1999, 54, 2237–2246. [Google Scholar] [CrossRef]
- Vasconcelos, J.M.T.; Rodrigues, J.M.L.; Orvalho, S.C.P.; Alves, S.S.; Mendes, R.L.; Reis, A. Effect of contaminants on mass transfer coefficients in bubble column and airlift contactors. Chem. Eng. Sci. 2003, 58, 1431–1440. [Google Scholar] [CrossRef]
- Lau, R.; Peng, W.; Velazquez-Vargas, L.G.; Yang, G.Q.; Fan, L.S. Gas-liquid mass transfer in high-pressure bubble columns. Ind. Eng. Chem. Res. 2004, 43, 1302–1311. [Google Scholar] [CrossRef]
- Vandu, C.O.; Krishna, R. Volumetric mass transfer coefficients in slurry bubble columns operating in the churn-turbulent flow regime. Chem. Eng. Process. 2004, 43, 987–995. [Google Scholar] [CrossRef]
- Vandu, C.O.; Krishna, R. Influence of scale on the volumetric mass transfer coefficients in bubble columns. Chem. Eng. Process. 2004, 43, 575–579. [Google Scholar] [CrossRef]
- Han, L.; Al-Dahhan, M.H. Gas-liquid mass transfer in a high pressure bubble column reactor with different sparger designs. Chem. Eng. Sci. 2007, 62, 131–139. [Google Scholar] [CrossRef]
- Gourich, B.; Vial, C.; El Azher, N.; Soulami, M.B.; Ziyad, M. Influence of hydrodynamics and probe response on oxygen mass transfer measurements in a high aspect ratio bubble column reactor: Effect of the coalescence behaviour of the liquid phase. Biochem. Eng. J. 2008, 39, 1–14. [Google Scholar] [CrossRef]
- Gogate, P.R.; Pandit, A.B. Survey of measurement techniques for gas-liquid mass transfer coefficient in bioreactors. Biochem. Eng. J. 1999, 4, 7–15. [Google Scholar] [CrossRef]
- Linek, V.; Sinkule, J. The influence of gas and liquid axial-dispersion on determination of kLa by dynamic method. Chem. Eng. Res. Des. 1991, 69, 308–312. [Google Scholar]
- Scargiali, F.; Russo, R.; Grisafi, F.; Brucato, A. Mass transfer and hydrodynamic characteristics of a high aspect ratio self-ingesting reactor for gas-liquid operations. Chem. Eng. Sci. 2007, 62, 1376–1387. [Google Scholar] [CrossRef]
- Linek, V.; Benes, P.; Sinkule, J.; Moucha, T. Non-ideal pressure step method for kLa measurement. Chem. Eng. Sci. 1993, 48, 1593–1599. [Google Scholar] [CrossRef]
- Linek, V.; Benes, P.; Vacek, V. Dynamic pressure method for kLa measurement in large-scale bioreactors. Biotechnol. Bioeng. 1989, 33, 1406–1412. [Google Scholar] [CrossRef] [PubMed]
- Fujasova, M.; Linek, V.; Moucha, T. Mass transfer correlations for multiple-impeller gas-liquid contactors. Analysis of the effect of axial dispersion in gas and liquid phases on “local” kLa values measured by the dynamic pressure method in individual stages of the vessel. Chem. Eng. Sci. 2007, 62, 1650–1669. [Google Scholar] [CrossRef]
- Scargiali, F.; Busciglio, A.; Grisafi, F.; Brucato, A. Simplified dynamic pressure method for kLa measurement in aerated bioreactors. Biochem. Eng. J. 2010, 49, 165–172. [Google Scholar] [CrossRef]
- Moucha, T.; Rejl, F.J.; Kordac, M.; Labik, L. Mass transfer characteristics of multiple-impeller fermenters for their design and scale-up. Biochem. Eng. J. 2012, 69, 17–27. [Google Scholar] [CrossRef]
- Garcia-Ochoa, F.; Gomez, E. Prediction of gas-liquid mass transfer coefficient in sparged stirred tank bioreactors. Biotechnol. Bioeng. 2005, 92, 761–772. [Google Scholar] [CrossRef] [PubMed]
- Garcia-Ochoa, F.; Gomez, E.; Santos, V.E.; Merchuk, J.C. Oxygen uptake rate in microbial processes: An overview. Biochem. Eng. J. 2010, 49, 289–307. [Google Scholar] [CrossRef]
- Blazej, M.; Annus, J.; Markos, J. Comparison of gassing-out and pressure-step dynamic methods for kLa measurement in an airlift reactor with internal loop. Chem. Eng. Res. Des. 2004, 82, 1375–1382. [Google Scholar] [CrossRef]
- Blazej, M.; Jurascik, M.; Annus, J.; Markos, J. Measurement of mass transfer coefficient in an airlift reactor with internal loop using coalescent and non-coalescent liquid media. J. Chem. Technol. Biotechnol. 2004, 79, 1405–1411. [Google Scholar] [CrossRef]
- Jurascik, M.; Blazej, M.; Annus, J.; Markos, J. Experimental measurements of volumetric mass transfer coefficient by the dynamic pressure-step method in internal loop airlift reactors of different scale. Chem. Eng. J. 2006, 125, 81–87. [Google Scholar] [CrossRef]
- Zahradnik, J.; Fialova, M.; Ruzicka, M.; Drahos, J.; Kastanek, F.; Thomas, N.H. Duality of the gas-liquid flow regimes in bubble column reactors. Chem. Eng. Sci. 1997, 52, 3811–3826. [Google Scholar] [CrossRef]
- Ruzicka, M.C.; Zahradnik, J.; Drahos, J.; Thomas, N.H. Homogeneous-heterogeneous regime transition in bubble columns. Chem. Eng. Sci. 2001, 56, 4609–4626. [Google Scholar] [CrossRef]
- Linek, V.; Vacek, V.; Sinkule, J.; Benes, P. Measurement of Oxygen by Membrane-Covered Probes: Guidelines for Applications in Chemical and Biochemical Engineering; Ellis Horwood: Chichester, UK, 1988; Halsted Press: New York, NY, USA, 1988; ISBN 0745801994. [Google Scholar]
- Danckwerts, P.V. Gas-Liquid Reactions; McGraw-Hill Book Company: New York, NY, USA, 1970; ISBN 9780070152878. [Google Scholar]
- Besagni, G.; Inzoli, F.; Ziegenhein, T. Two-Phase Bubble Columns: A Comprehensive Review. ChemEngineering 2018, 2, 13. [Google Scholar] [CrossRef]
- Besagni, G.; Inzoli, F.; Ziegenhein, T.; Lucas, D. Computational Fluid-Dynamic modeling of the pseudo-homogeneous flow regime in large-scale bubble columns. Chem. Eng. Sci. 2017, 160, 144–160. [Google Scholar] [CrossRef]
- Sharaf, S.; Zednikova, M.; Ruzicka, M.C.; Azzopardi, B.J. Global and local hydrodynamics of bubble columns—Effect of gas distributor. Chem. Eng. J. 2016, 288, 489–504. [Google Scholar] [CrossRef]
- Wilkinson, P.M.; Spek, A.P.; Vandierendonck, L.L. Design parameters estimation for scale-up of high-pressure bubble-columns. AIChE J. 1992, 38, 544–554. [Google Scholar] [CrossRef]
- Besagni, G.; Di Pasquali, A.; Gallazzini, L.; Gottardi, E.; Colombo, L.P.M.; Inzoli, F. The effect of aspect ratio in counter-current gas-liquid bubble columns: Experimental results and gas holdup correlations. Int. J. Multiph. Flow 2017, 94, 53–78. [Google Scholar] [CrossRef]
- Sasaki, S.; Uchida, K.; Hayashi, K.; Tomiyama, A. Effects of column diameter and liquid height on gas holdup in air-water bubble columns. Exp. Therm. Fluid Sci. 2017, 82, 359–366. [Google Scholar] [CrossRef]
- American Society of Civil Engineers. Measurement of Oxygen Transfer in Clean Water (ASCE/EWRI 2-06); American Society of Civil Engineers: Reston, VA, USA, 2007; ISBN 9780784408483. [Google Scholar]
Figure 1.
Experimental setup.

Figure 2.
Comparison of experimental and model profiles of oxygen concentration and total pressure. Water-air system, non-ideal pressure step, QG = 4 m3/h, kLa = 0.0558 s−1.
Figure 2.
Comparison of experimental and model profiles of oxygen concentration and total pressure. Water-air system, non-ideal pressure step, QG = 4 m3/h, kLa = 0.0558 s−1.

Figure 3.
Effect of gas phase composition on the dependence of gas hold-up on gas superficial velocity.
Figure 3.
Effect of gas phase composition on the dependence of gas hold-up on gas superficial velocity.

Figure 4.
Examples of ideal and non-ideal pressure profiles: (a) examples of real pressure profiles and (b) comparison of modeled O2 concentration profiles and final kLa values for real pressure step (black lines) and for assumption of perfect pressure step (red lines). Water-air system, QG = 2 m3/h.

Figure 5.
Effect of pressure step non-ideality on kLa values. All the data were evaluated with measured real pressure profile.
Figure 5.
Effect of pressure step non-ideality on kLa values. All the data were evaluated with measured real pressure profile.

Figure 6.
Effect of gas phase composition on resulting volumetric mass transfer coefficient.

Figure 7.
Dependence of volumetric mass transfer coefficient on gas superficial velocity, comparison of present data with correlations and data provided in Table 1.
Figure 7.
Dependence of volumetric mass transfer coefficient on gas superficial velocity, comparison of present data with correlations and data provided in Table 1.

Figure 8.
Dependence of volumetric mass transfer coefficient on corresponding gas holdup, comparison of present data with available correlations provided in Table 1.
Figure 8.
Dependence of volumetric mass transfer coefficient on corresponding gas holdup, comparison of present data with available correlations provided in Table 1.


Table 1.
Available data and correlations for prediction of volumetric mass transfer coefficient in coalescent batch (distilled water, tap water, ambient pressure and temperature).
Table 1.
Available data and correlations for prediction of volumetric mass transfer coefficient in coalescent batch (distilled water, tap water, ambient pressure and temperature).
| Reference | kLa Correlation | Operating Conditions | Sparger | kLa Method |
|---|---|---|---|---|
| Akita & Yoshida 1973 [9] | D = 0.15–0.60m uG = 4–117 mm/s | single hole 5 mm | start-up method | |
| Deckwer et al., 1974, 1983 [10,11] | D = 0.15–0.2 m uG = 4–100 mm/s liquid circulation | cross of nozzles | standard dynamic | |
| Shah et al., 1982 [4] | D = 0.1–0.15 m uG = 2–80 mm/s | cross of nozzles | standard dynamic | |
| Shah et al., 1982 [4] | D = 0.2 m uG = 3–80 mm/s | sintered plate | standard dynamic | |
| Letzel et al., 1999 [12] | D = 0.15 m uG = 0–400 mm/s | orifice distributor | DPM | |
| Miron et al., 2000 [7] | D = 0.193 m uG = 2–30 mm/s liquid circulation | cross with holes | start-up method | |
| Vasconcelos et al., 2003 [13] | D = 0.193 m uG = 3–22 mm/s | perforated plate | standard dynamic | |
| Lau et al., 2004 [14] | D = 0.045-0.45 m uG = 3–68 mm/s liquid circulation | various spargers | start-up method | |
| Vandu & Krishna 2004 [15,16] | D = 0.1–0.38 m uG > 80 mm/s | perforated plate; sieve plate | start-up method | |
| Han & Al-Dahhan 2007 [17] | kLa data available | D = 0.162 m uG = 10–450 mm/s | perforated plate | oxygen-enriched method |
| Gourich et al., 2008 [18] | kLa data available | D = 0.1 m uG = 6–87 mm/s | multiple-orifices | standard dynamic |
| Manjrekar et al., 2017 [5] | kLa data available | D = 0.1 m uG = 10–30 mm/s | perforated plate | oxygen-enriched method |
Table 2.
Physical-chemical properties of the phases at 25 °C.
| Physical-Chemical Property | Water |
|---|---|
| diffusivity of O2 [m2/s] | 2.143 × 10⁻⁹ |
| diffusivity of N2 [m2/s] | 1.903 × 10⁻⁹ |
| Henry’s constant of O2 [mol/(m3·atm)] | 1.257 |
| Henry’s constant of N2 [mol/(m3·atm)] | 0.6432 |
| conductivity [S/cm] | 0.002 × 10⁻³ |
| density [kg/m3] | 997 |
| viscosity [mPa·s] | 0.89 |
| surface tension [mN/m] | 71.0 |
Table 3.
Correlations for gas holdup and volumetric mass transfer coefficient obtained in coalescent liquid (distilled water).
Table 3.
Correlations for gas holdup and volumetric mass transfer coefficient obtained in coalescent liquid (distilled water).
| Correlation | Operating Conditions |
|---|---|
| D = 0.19m, uG = 20–200 mm/s | |
| 1 m clear liquid height perforated plate | |
| pure heterogeneous flow regime T = 25 °C, atmospheric pressure |
© 2018 by the authors. Licensee MDPI, Basel, Switzerland. This article is an open access article distributed under the terms and conditions of the Creative Commons Attribution (CC BY) license (http://creativecommons.org/licenses/by/4.0/).
Share and Cite
MDPI and ACS Style
Zedníková, M.; Orvalho, S.; Fialová, M.; Ruzicka, M.C. Measurement of Volumetric Mass Transfer Coefficient in Bubble Columns. ChemEngineering 2018, 2, 19. https://doi.org/10.3390/chemengineering2020019
AMA Style
Zedníková M, Orvalho S, Fialová M, Ruzicka MC. Measurement of Volumetric Mass Transfer Coefficient in Bubble Columns. ChemEngineering. 2018; 2(2):19. https://doi.org/10.3390/chemengineering2020019
Chicago/Turabian StyleZedníková, Mária, Sandra Orvalho, Marie Fialová, and Marek C. Ruzicka. 2018. "Measurement of Volumetric Mass Transfer Coefficient in Bubble Columns" ChemEngineering 2, no. 2: 19. https://doi.org/10.3390/chemengineering2020019