Net Snowpack Accumulation and Ablation Characteristics in the Inland Temperate Rainforest of the Upper Fraser River Basin, Canada


Abstract
:1. Introduction
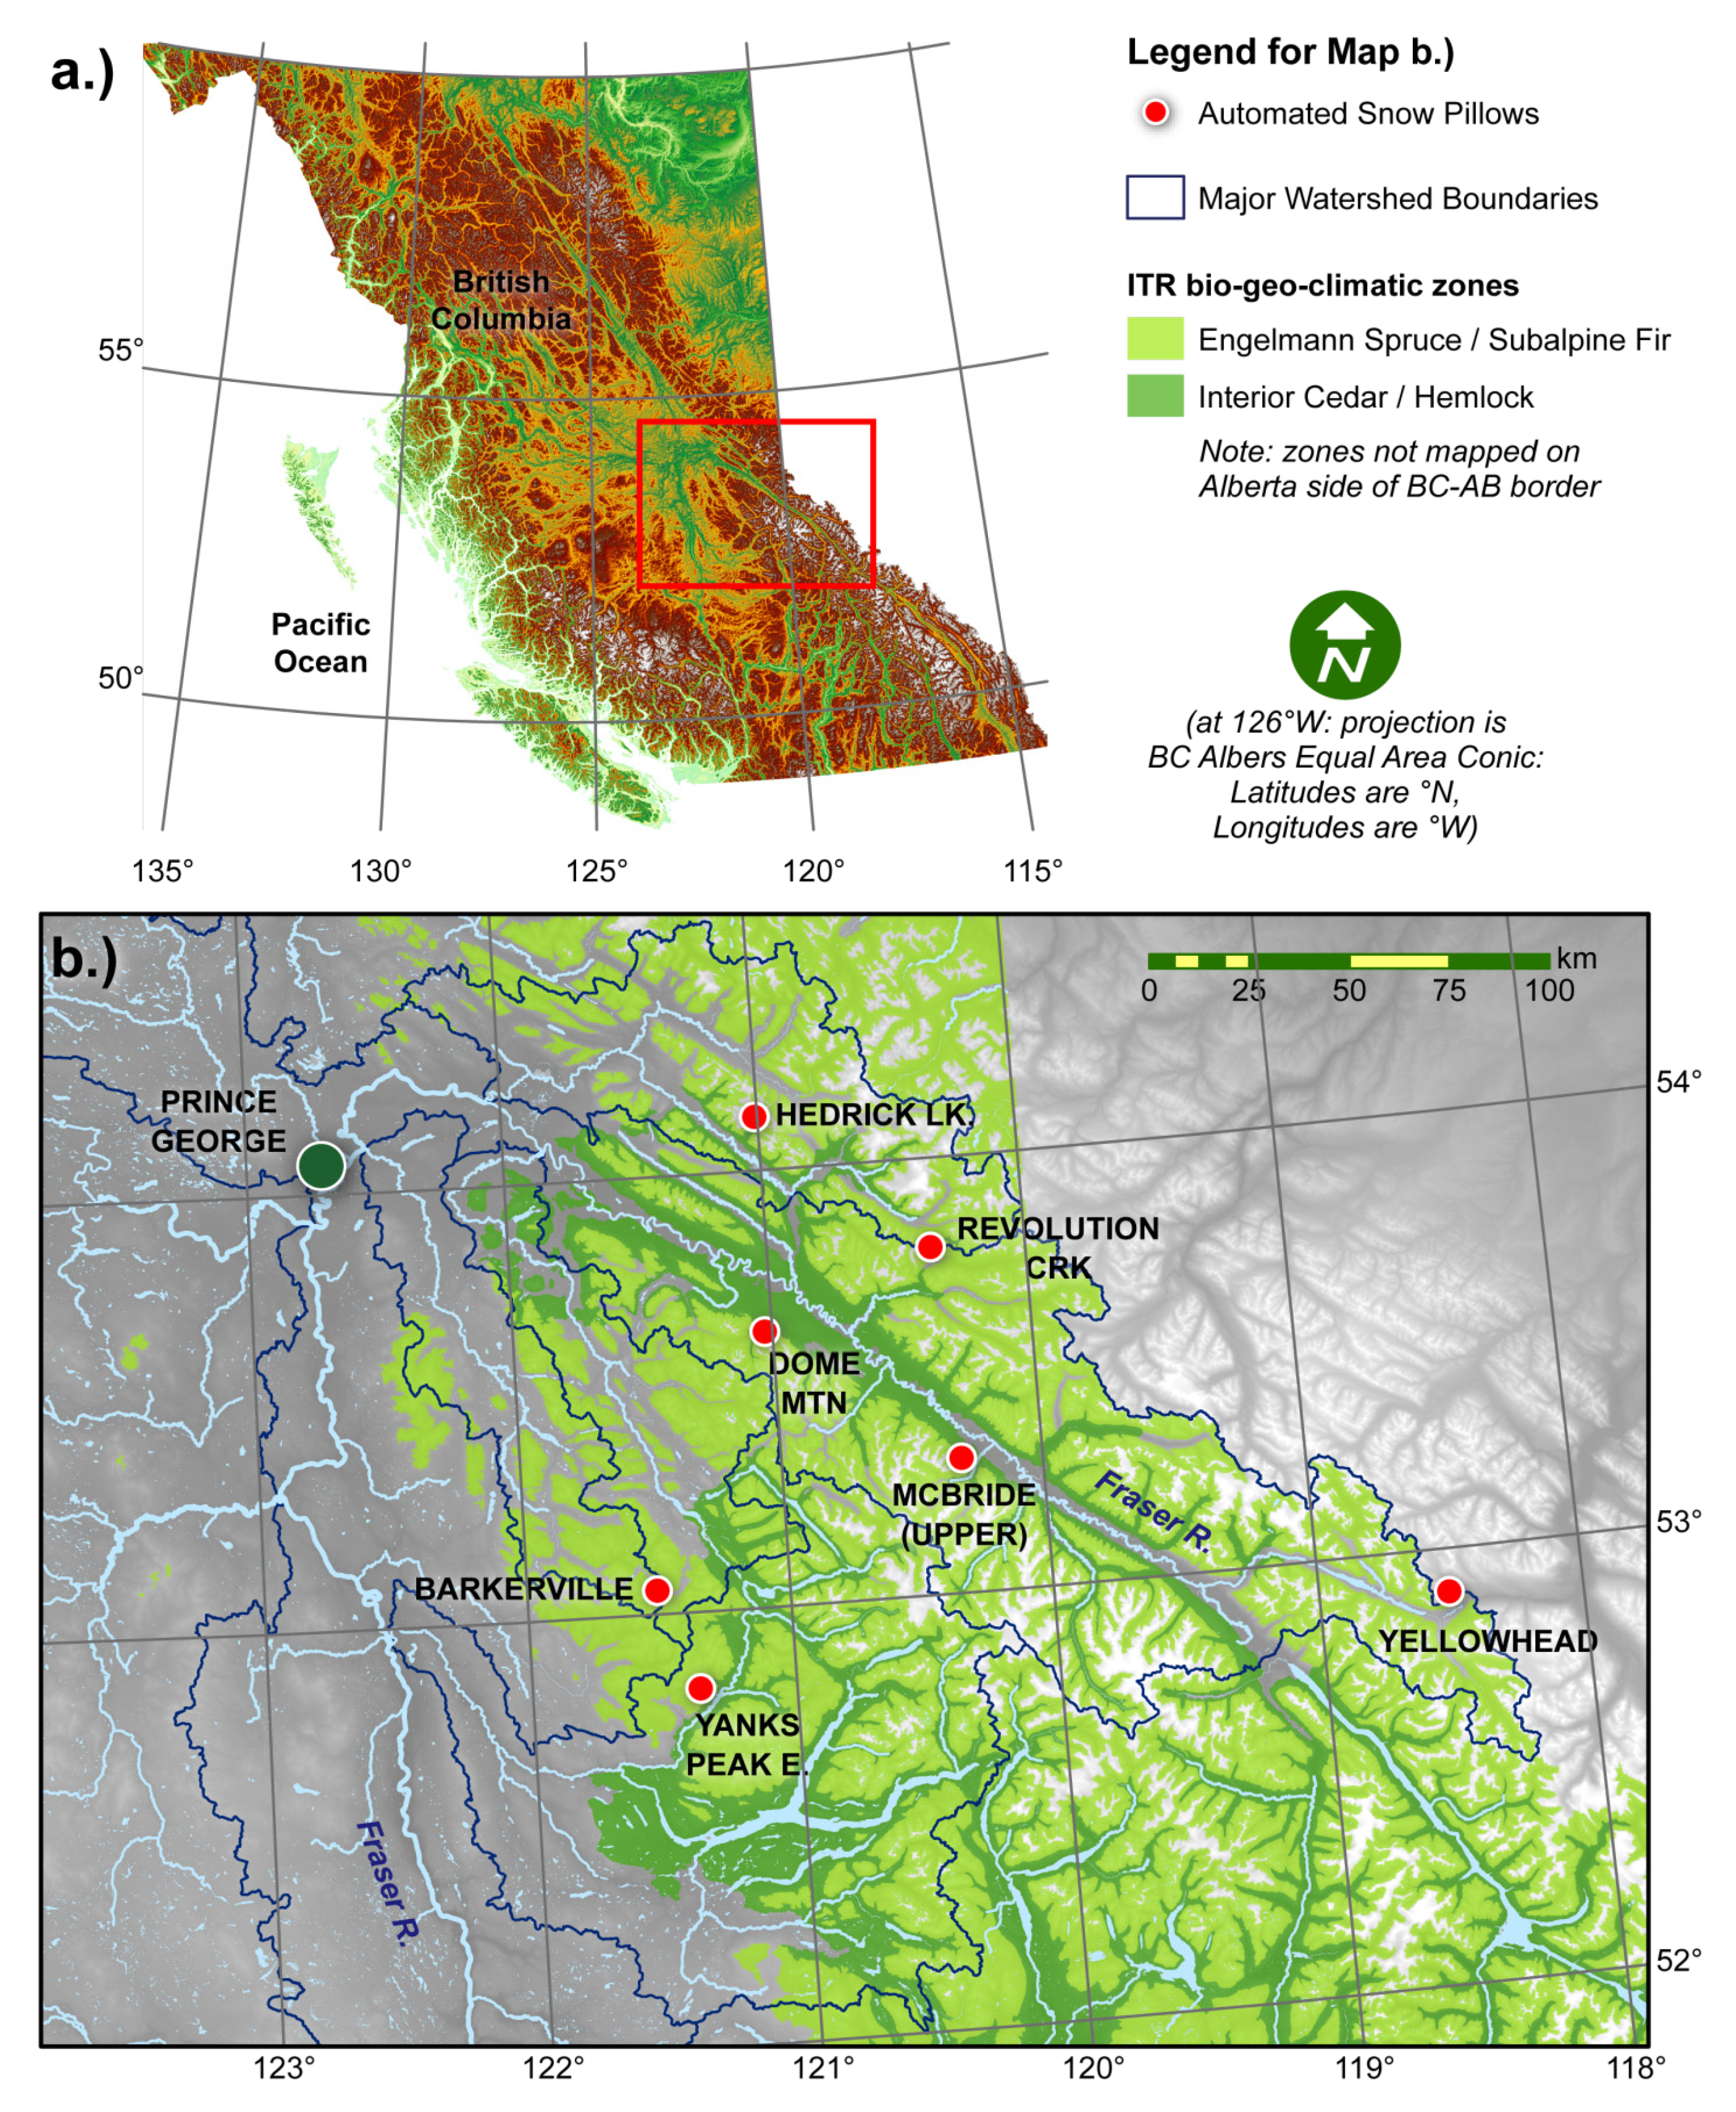
2. Study Area

3. Data and Methods

| Station Name | Station I.D. | Latitude (°N) | Longitude (°W) | Elevation (m a.s.l.) | Mean Annual Peak SWE (mm) | Years of Data Availability |
|---|---|---|---|---|---|---|
| Barkerville | 1A03P | 53.05 | 121.48 | 1483 | 391.3 | 1968–20121 |
| Dome Mountain | 1A19P | 53.62 | 121.02 | 1768 | 893.4 | 2005–2012 |
| Hedrick Lake | 1A14P | 54.10 | 121.00 | 1118 | 924.4 | 1999–2012 |
| McBride (Upper) | 1A02P | 53.30 | 120.32 | 1608 | 562.6 | 1971–20122 |
| Revolution Creek | 1A17P | 53.78 | 120.37 | 1676 | 882.6 | 1984–2012 |
| Yanks Peak East | 1C41P | 52.82 | 121.35 | 1683 | 900.5 | 1996–2012 |
| Yellowhead | 1A01P | 52.90 | 118.53 | 1847 | 582.2 | 1997–2012 |
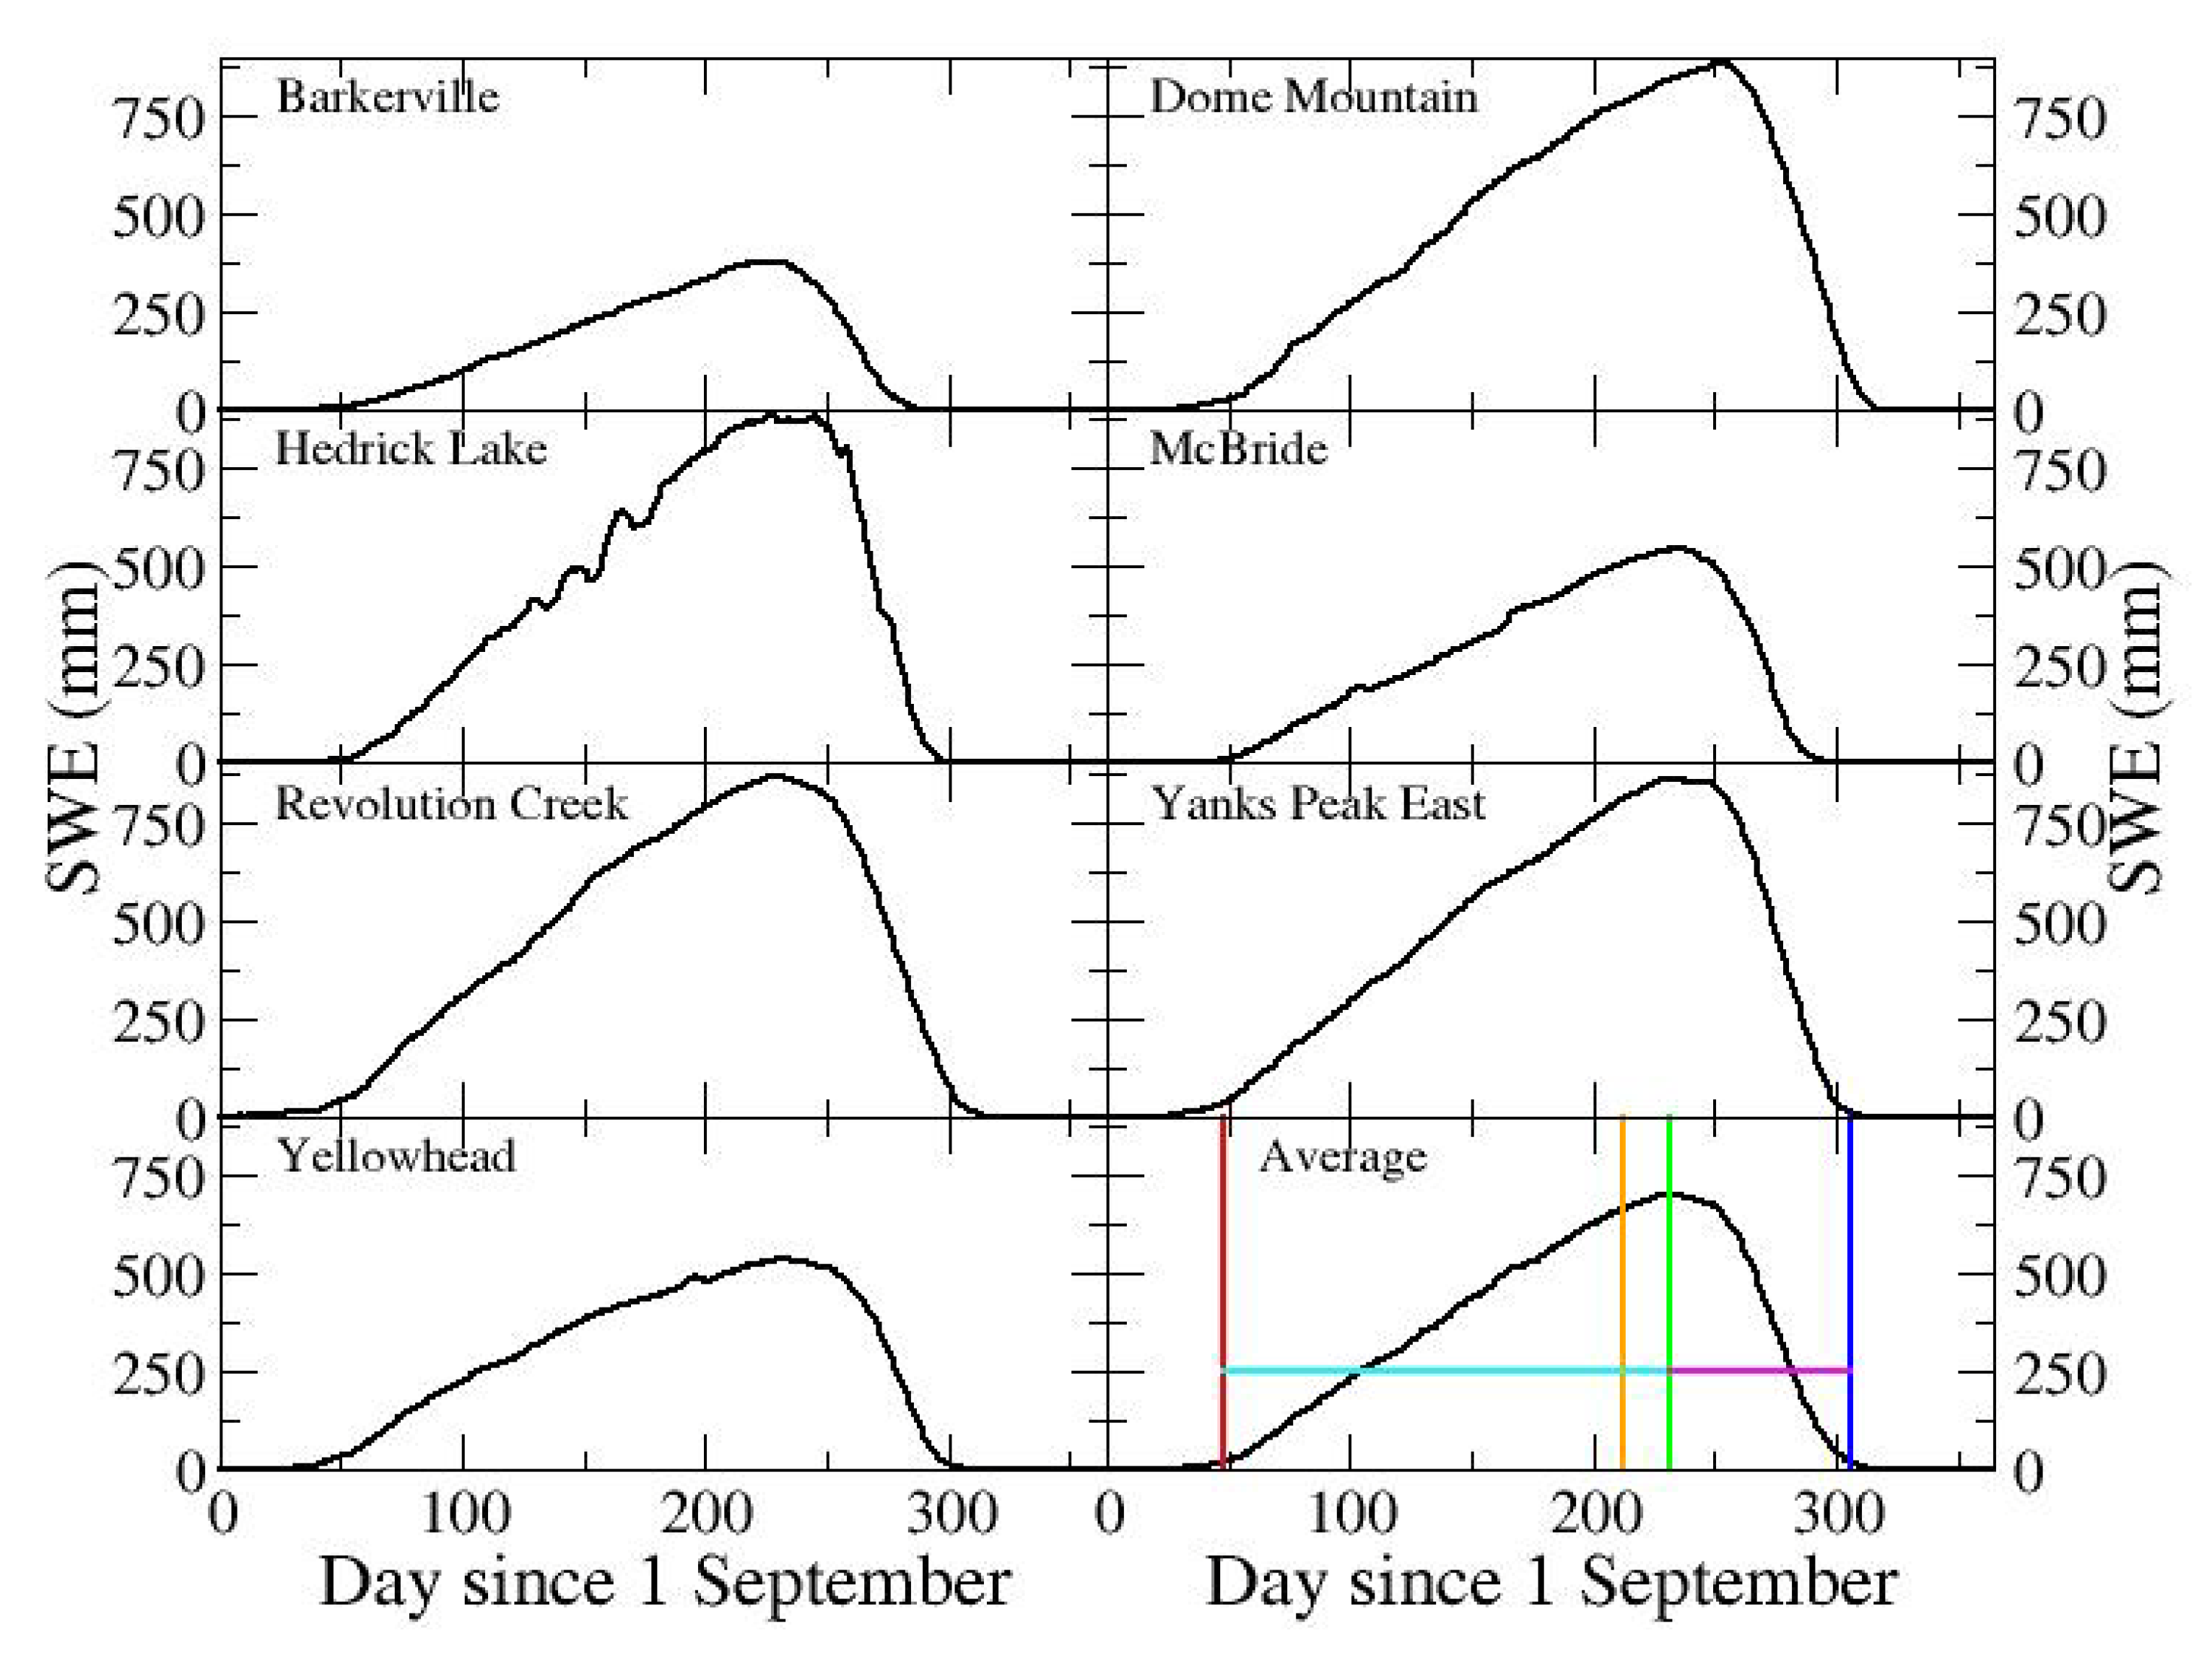
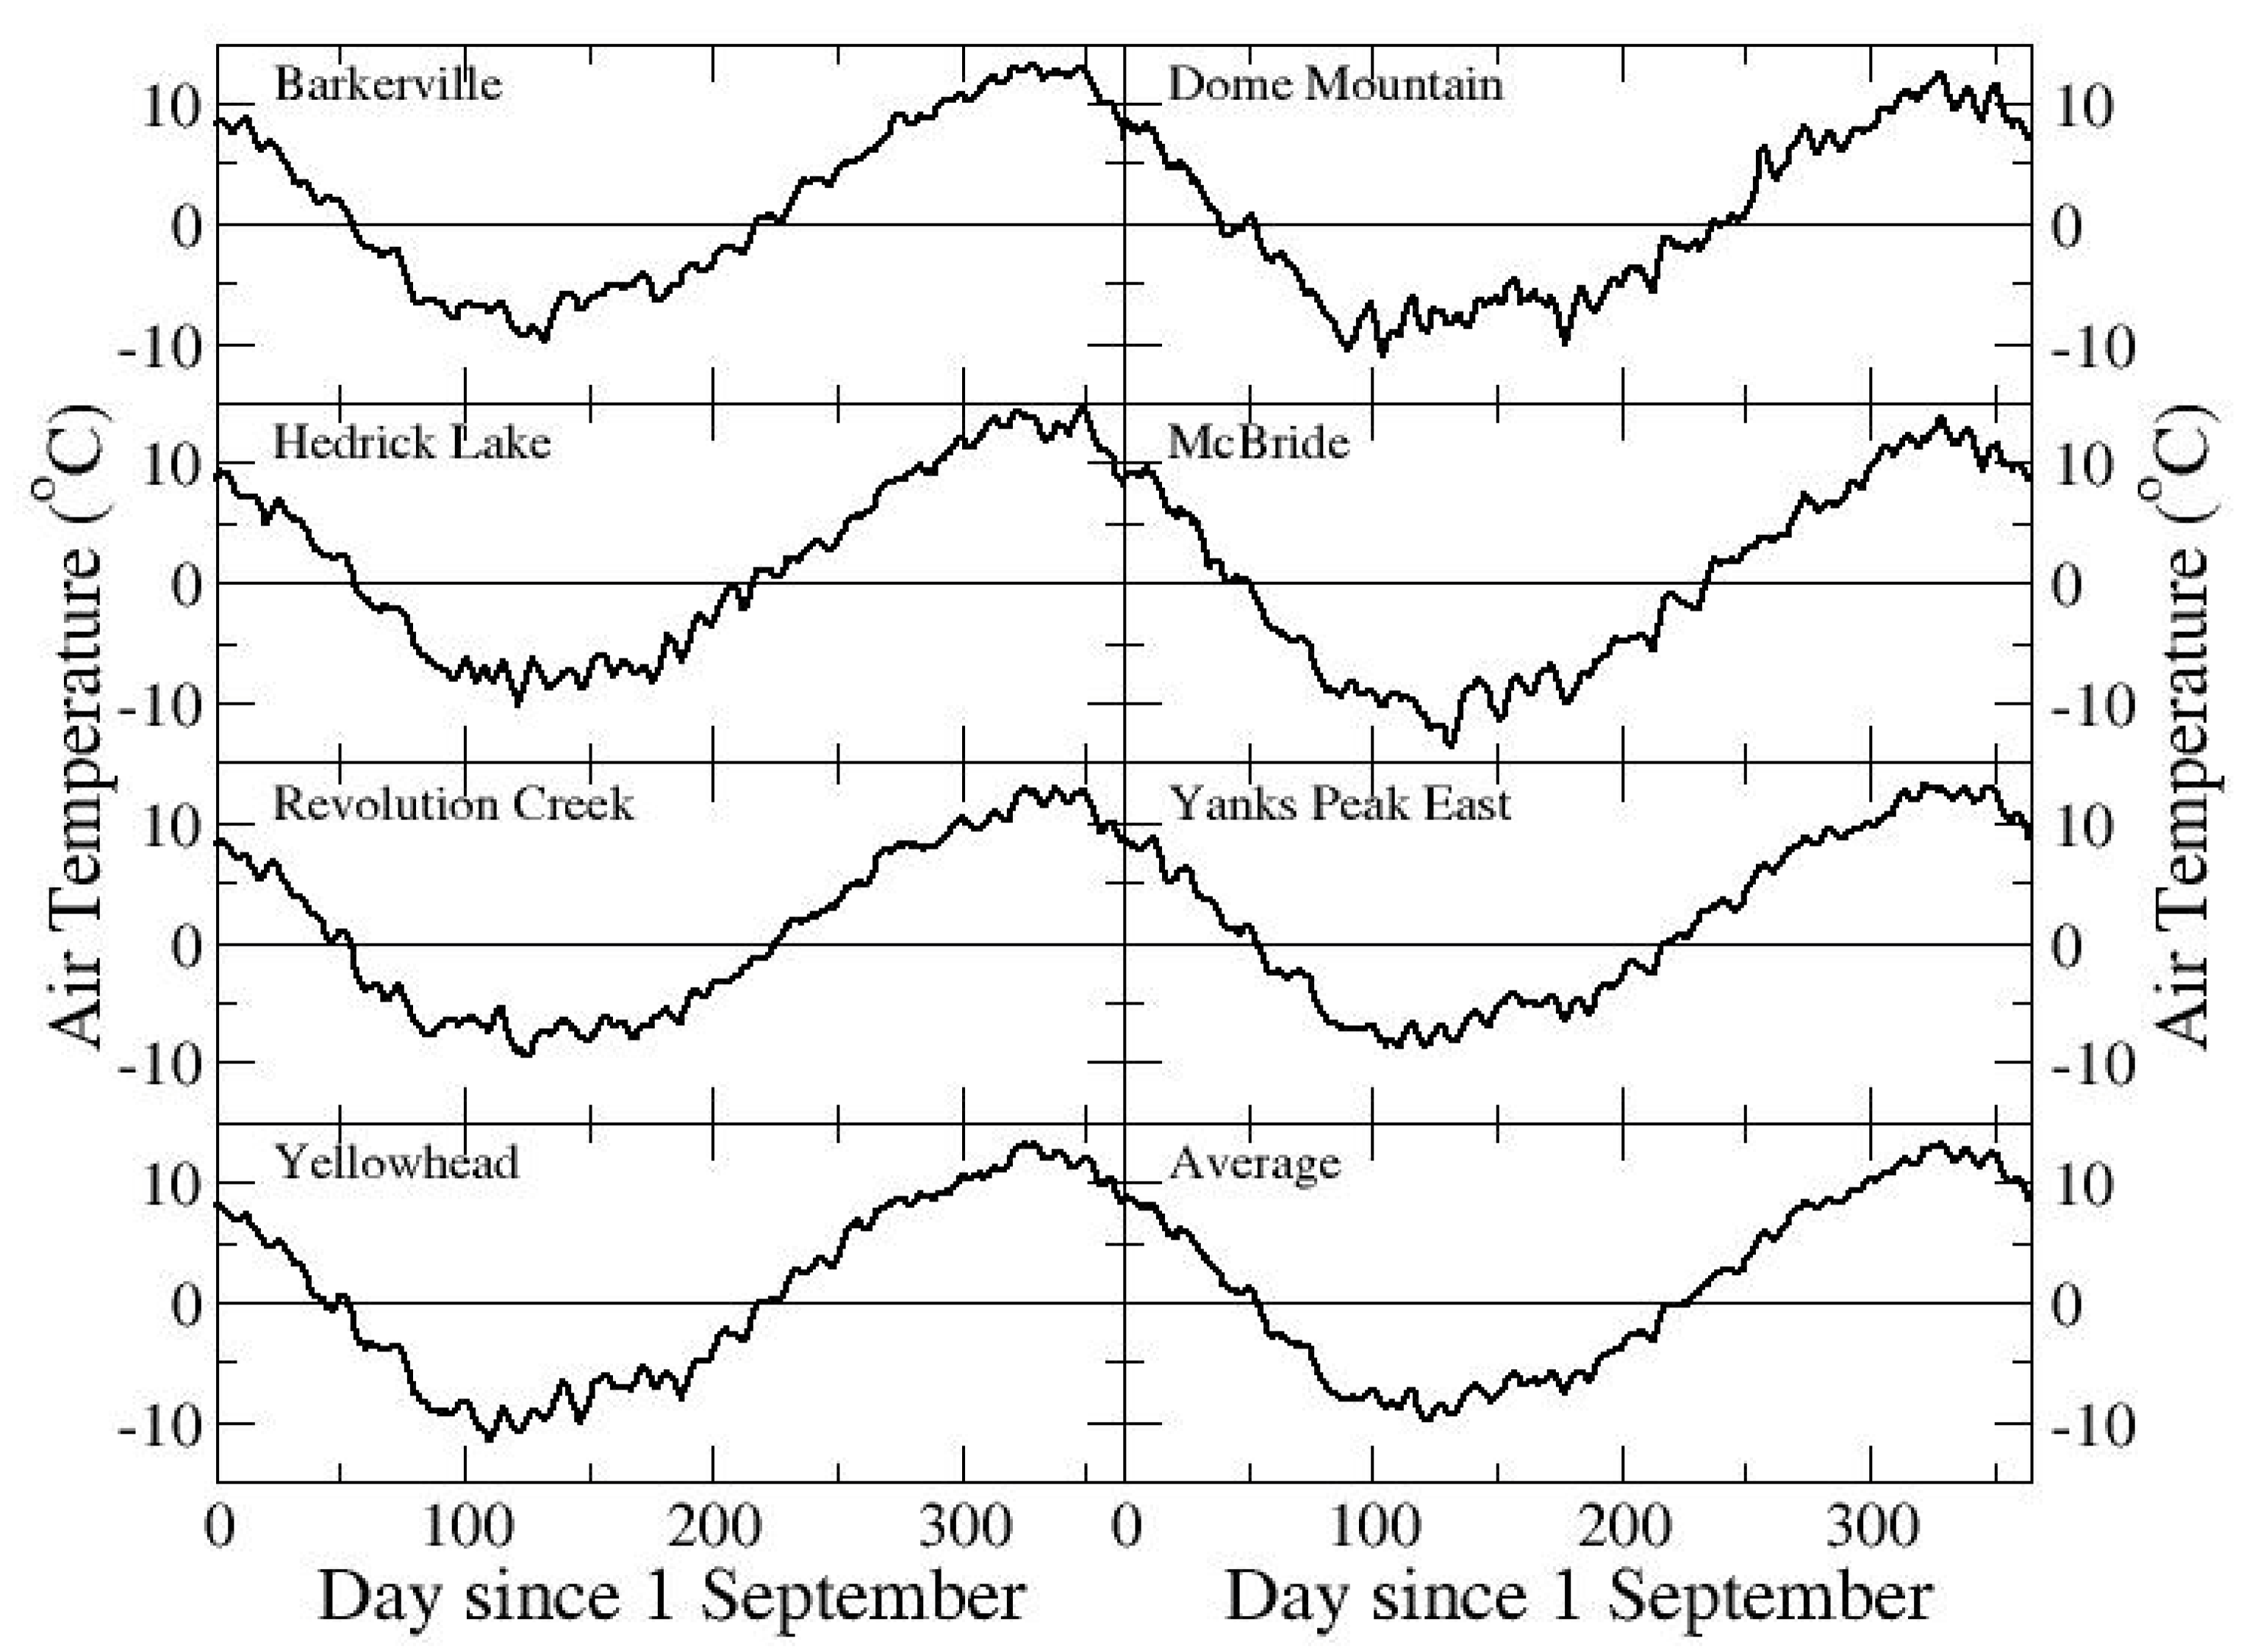
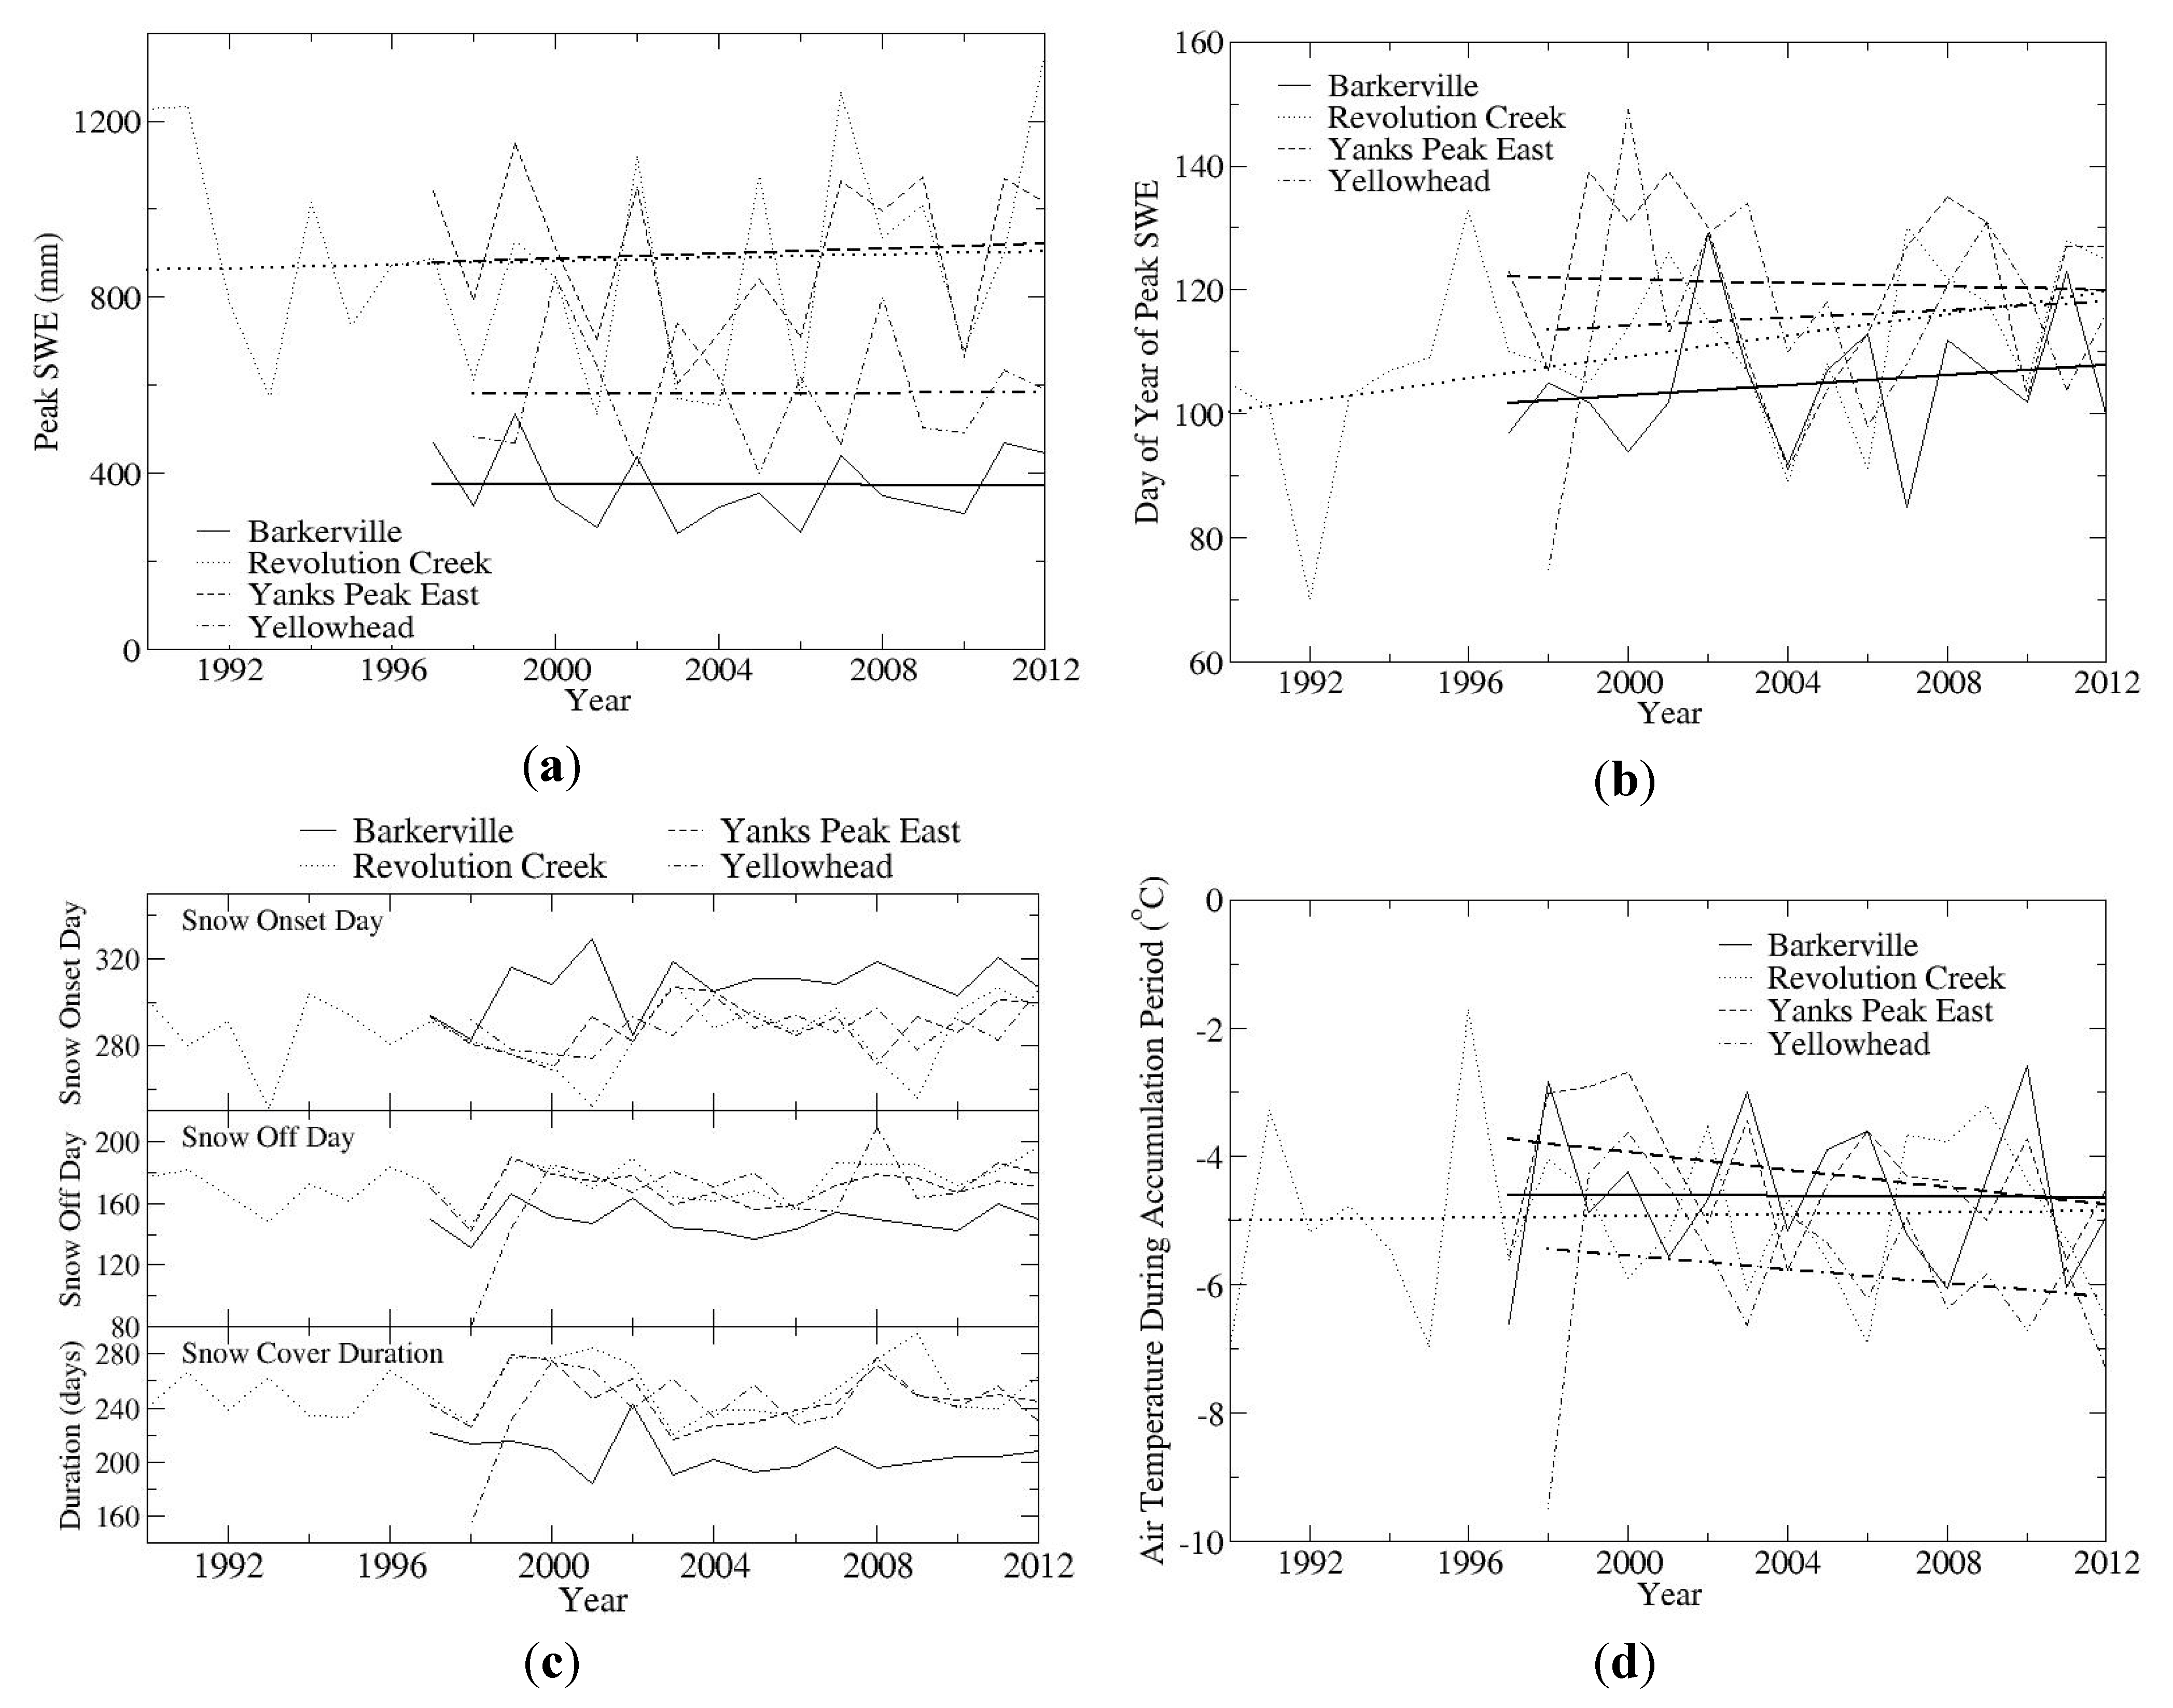
4. Results


| Variable Mean and [SD] (Units) | Barkerville | Dome Mtn. | Hedrick Lake | McBride (Upper) | Revolution Creek | Yanks Peak East | Yellowhead |
|---|---|---|---|---|---|---|---|
| Annual Maximum SWE (mm) | 391.3 | 893.4 | 924.4 | 562.6 | 882.9 | 900.5 | 582.2 |
| [79.7] | [219.7] | [205.8] | [122.5] | [247.1] | [172.9] | [132.6] | |
| Annual Day of Year of Maximum SWE (mm) | 105.8 | 131.7 | 117.4 | 115.9 | 110.0 | 121.0 | 115.7 |
| (16 Apr) | (12 May) | (27 Apr) | (26 Apr) | (20 Apr) | (1 May) | (25 Apr) | |
| [10.9] | [5.1] | [12.0] | [7.0] | [14.2] | [14.0] | [16.6] | |
| April 1 Annual SWE (mm) | 363.9 | 782.1 | 851.7 | 509.0 | 829.8 | 808.1 | 507.7 |
| [75.8] | [208.5] | [213.7] | [110.8] | [234.6] | [144.4] | [183.5] | |
| Snow Onset Day | 309.2 | 290.6 | 305.8 | 302.7 | 285.3 | 289.3 | 288.3 |
| (5 Nov) | (18 Oct) | (2 Nov) | (30 Oct) | (12 Oct) | (16 Oct) | (15 Oct) | |
| [13.1] | [10.0] | [13.6] | [11.6] | [16.0] | [11.0] | [9.1] | |
| Snow Offset Day | 150.4 | 183.9 | 163.0 | 163.0 | 173.7 | 170.9 | 165.4 |
| (30 May) | (3 Jul) | (12 Jun) | (12 Jun) | (23 Jun) | (21 Jun) | (14 Jun) | |
| [9.7] | [9.4] | [9.0] | [6.8] | [13.2] | [15.1] | [27.1] | |
| Duration of Snow Cover (days) | 206.4 | 258.4 | 222.4 | 225.5 | 253.6 | 246.8 | 242.3 |
| [16.8] | [9.2] | [17.7] | [14.3] | [20.1] | [17.3] | [28.5] | |
| Net Accumulation Period (days) | 161.9 | 206.3 | 176.8 | 178.4 | 189.9 | 196.9 | 192.7 |
| [19.2] | [12.3] | [18.8] | [14.3] | [22.6] | [21.1] | [21.0] | |
| Net Ablation Period | 44.6 | 52.1 | 45.6 | 47.1 | 63.7 | 49.9 | 49.7 |
| (days) | [11.9] | [11.1] | [15.4] | [9.3] | [13.1] | [9.8] | [19.0] |
| Ablation Rate | 8.8 | 16.7 | 21.7 | 12.0 | 13.8 | 18.3 | 16.9 |
| (mm∙day−1) | [2.5] | [2.4] | [7.2] | [3.7] | [3.6] | [4.5] | [20.6] |
| Degree Day Factor | 2.2 | 2.8 | 4.0 | 5.2 | 3.5 | 2.4 | 1.4 |
| (mm∙day−1∙°C−1) | [1.3] | [0.2] | [1.3] | [8.4] | [2.0] | [0.5] | [0.6] |

| Station Name | Barkerville | Dome Mountain | Hedrick Lake | McBride (Upper) | Revolution Creek | Yanks Peak East | Yellowhead |
|---|---|---|---|---|---|---|---|
| Barkerville | 0.85 | 0.92 | 0.59 | 0.71 | 0.93 | 0.75 | |
| Dome Mountain | n = 6 | 0.91 | 0.95 | 0.98 | 0.82 | 0.73 | |
| Hedrick Lake | n = 12 | n = 7 | 0.82 | 0.88 | 0.90 | 0.64 | |
| McBride (Upper) | n = 12 | n = 6 | n = 6 | 0.94 | 0.52 | 0.84 | |
| Revolution Creek | n = 15 | n = 7 | n = 13 | n = 6 | 0.77 | 0.73 | |
| Yanks Peak East | n = 15 | n = 7 | n = 13 | n = 6 | n = 16 | 0.56 | |
| Yellowhead | n = 14 | n = 7 | n = 13 | n = 6 | n = 15 | n = 15 |
| Variable Mean and [SD] (Units) | Barkerville | Dome Mtn. | Hedrick Lake | McBride (Upper) | Revolution Creek | Yanks Peak East | Yellowhead |
|---|---|---|---|---|---|---|---|
| Annual Air Temperature (°C) | 1.7 | 0.1 | 1.8 | -0.1 | 1.0 | 1.6 | 0.8 |
| [1.0] | [0.7] | [0.6] | [1.3] | [0.9] | [0.7] | [0.7] | |
| Date with Air Temperature <0°C | 290.5 | 274.9 | 293.6 | 282.6 | 284.0 | 285.4 | 281.7 |
| (17 Oct) | (2 Oct) | (21 Oct) | (10 Oct) | (11 Oct) | (12 Oct) | (9 Oct) | |
| [10.7] | [6.0] | [10.7] | [6.7] | [9.6] | [8.4] | [7.0] | |
| Date with Air Temperature >0°C | 108.2 | 130.7 | 111.5 | 127.0 | 117.4 | 115.3 | 115.7 |
| (19 Apr) | (11 May) | (22 Apr) | (7 May) | (27 Apr) | (25 Apr) | (25 Apr) | |
| [12.5] | [6.7] | [11.2] | [19.3] | [12.9] | [10.3] | [10.6] | |
| Duration of Air Temperature <0°C | 182.9 | 221.0 | 183.1 | 209.6 | 198.7 | 195.1 | 199.3 |
| [20.3] | [9.6] | [18.1] | [22.8] | [16.0] | [14.8] | [13.4] | |
| Air Temperature During Net Accumulation Period (°C) | −5.3 | −5.4 | −4.9 | −7.4 | −4.9 | −4.2 | −5.8 |
| [1.4] | [1.1] | [1.2] | [1.8] | [1.3] | [0.9] | [1.4] | |
| Air Temperature During Net Ablation Period (°C) | 4.6 | 6.6 | 6.3 | 4.3 | 5.6 | 7.2 | 6.1 |
| [1.4] | [0.5] | [1.0] | [2.2] | [2.4] | [1.1] | [3.2] |
5. Discussion
5.1. Analysis and Synthesis of Results
5.2. Comparison with Other Studies
5.3. Study Limitations
5.4. Possible Implications to the ITR
5.5. Climate Change and Prospects for the Future
6. Conclusions
Acknowledgments
Author contributions
Conflict of Interest
References
- Barnett, T.P.; Adam, J.C.; Lettenmaier, D.P. Potential impacts of a warming climate on water availability in snow-dominated regions. Nature 2005, 438, 303–309. [Google Scholar] [CrossRef]
- Déry, S.J.; Sheffield, J.; Wood, E.F. Connectivity between Eurasian snow cover extent and Canadian snow water equivalent and river discharge. J. Geophys. Res. 2005. [Google Scholar] [CrossRef]
- Stevenson, S.K.; Armleder, H.M.; Arsenault, A.; Coxson, D.; Delong, S.C.; Jull, M. British Columbia’s Inland Rainforest; UBC Press: Vancouver, BC, Canada, 2011; p. 432. [Google Scholar]
- Ketcheson, M.V.; Braumandal, T.F.; Meidinger, D.; Utzig, G.; Demarchi, D.A.; Wikeem, B.M. Interior Cedar–Hemlock Zone. Ecosystems of British Columbia; Meidinger, D., Pojar, J., Eds.; Special Report Series No. 6; BC Ministry of Forests, Research Branch: Victoria, Canada, 1991; pp. 167–181. Available online: www.for.gov.bc.ca/hfd/pubs/docs/Srs/Srs06/chap11.pdf (accessed on 29 November 2013).
- Arsenault, A.; Goward, T. Ecological characteristics of inland rainforests. Ecoforestry 2000, 15, 20–23. [Google Scholar]
- Coxson, D.S.; Goward, T.; Connell, D.J. Analysis of ancient western redcedar stands in the upper Fraser watershed, and scenarios for protection. J. Ecosyst. Manag. 2013, 13, 1–20. [Google Scholar]
- Rice, R.; Bales, R.C.; Painter, T.H.; Dozier, J. Snow water equivalent along elevation gradients in the Merced and Tuolumne River basins of the Sierra Nevada. Water Resour. Res. 2011. [Google Scholar] [CrossRef]
- Meromy, L.; Molotch, N.P.; Link, T.E.; Fassnacht, S.R.; Rice, R. Subgrid variability of snow water equivalent at operational snow stations in the western USA. Hydrol. Process. 2013, 27, 2383–2400. [Google Scholar] [CrossRef]
- Mote, P.W. Trends in snow water equivalent in the Pacific Northwest and their climatic causes. Geophys. Res. Lett. 2003. [Google Scholar] [CrossRef]
- Hsieh, W.W.; Tang, B. Interannual variability of accumulated snow in the Columbia basin, British Columbia. Water Resour. Res. 2001, 37, 1753–1759. [Google Scholar] [CrossRef]
- Mote, P.W.; Hamlet, A.F.; Clark, M.P.; Lettenmaier, D.P. Declining mountain snowpack in western North America. Bull. Am. Meteorol. Soc. 2005, 86, 39–49. [Google Scholar] [CrossRef]
- Harpold, A.; Brooks, P.; Rajagopal, S.; Heidbuchel, I.; Jardine, A.; Stielstra, C. Changes in snowpack accumulation and ablation in the intermountain west. Water Resour. Res. 2012. [Google Scholar] [CrossRef]
- Troendle, C.A.; King, R.M. The effect of partial and clearcutting on streamflow at Deadhorse Creek, Colorado. J. Hydrol. 1987, 90, 145–157. [Google Scholar] [CrossRef]
- Golding, D.L.; Swanson, R.H. Snow distribution patterns in clearings and adjacent forest. Water Resour. Res. 1986, 22, 1931–1940. [Google Scholar] [CrossRef]
- Boon, S. Snow accumulation following forest disturbance. Ecohydrology 2012, 5, 279–285. [Google Scholar] [CrossRef]
- Pugh, E.; Small, E. The impact of pine beetle infestation on snow accumulation and melt in the headwaters of the Colorado River. Ecohydrology 2012, 5, 467–477. [Google Scholar] [CrossRef]
- Biederman, J.A.; Brooks, P.D.; Harpold, A.A.; Gochis, D.J.; Gutmann, E.; Reed, D.E.; Pendall, E.; Ewers, B.E. Multiscale observations of snow accumulation and peak snowpack following widespread, insect-induced lodgepole pine mortality. Ecohydrology 2012. [Google Scholar] [CrossRef]
- Harpold, A.A.; Biederman, J.A.; Condon, K.; Merino, M.; Korgaonkar, Y.; Nan, T.; Sloat, L.L.; Ross, M.; Brooks, P.D. Changes in snow accumulation and ablation following the Las Conchas Forest Fire, New Mexico, USA. Ecohydrology 2013. [Google Scholar] [CrossRef]
- Danard, M.; Murty, T.S. On recent climate trends in selected salmon-hatching areas of British Columbia. J. Clim. 1994, 7, 1803–1808. [Google Scholar] [CrossRef]
- Burford, J.E.; Déry, S.J.; Holmes, R.D. Some aspects of the hydroclimatology of the Quesnel River Basin. Hydrol. Process. 2009, 23, 1529–1536. [Google Scholar] [CrossRef]
- Moore, R.D.; McKendry, I.G. Spring snowpack anomaly patterns and winter climatic variability, British Columbia, Canada. Water Resour. Res. 1996, 32, 623–632. [Google Scholar] [CrossRef]
- Tong, J.; Déry, S.J.; Jackson, P.L.; Derksen, C. Testing snow water equivalent retrieval algorithms for passive microwave remote sensing in an alpine watershed of western Canada. Can. J. Remote Sens. 2010, 36, S74–S86. [Google Scholar] [CrossRef]
- Shrestha, R.R.; Schnorbus, M.A.; Werner, A.T.; Berland, A.J. Modelling spatial and temporal variability of hydrologic impacts of climate change in the Fraser River basin, British Columbia, Canada. Hydrol. Process. 2012, 26, 1840–1860. [Google Scholar] [CrossRef]
- Morrison, J.; Quick, M.; Foreman, M.G.G. Climate change in the Fraser River watershed: Flow and temperature projections. J. Hydrol. 2002, 263, 30–44. [Google Scholar]
- Kerkhoven, E.; Gan, T. Differences and sensitivities in potential hydrologic impact of climate change to regional-scale Athabasca and Fraser River basins of the leeward and windward sides of the Canadian Rocky Mountains respectively. Clim. Chang. 2011, 106, 583–607. [Google Scholar] [CrossRef]
- Déry, S.J.; Hernández-Henríquez, M.A.; Owens, P.N.; Parkes, M.W.; Petticrew, E.L. A century of hydrological variability and trends in the Fraser River Basin. Environ. Res. Lett. 2012. [Google Scholar] [CrossRef]
- Picketts, I.P.; Werner, A.T.; Murdock, T.Q.; Curry, J.; Déry, S.J.; Dyer, D. Planning for climate change adaptation: lessons learned from a community-based workshop. Environ. Sci. Policy 2012, 17, 82–93. [Google Scholar] [CrossRef]
- Tong, J.; Déry, S.J.; Jackson, P.L. Topographic control of snow distribution in an alpine watershed of western Canada inferred from spatially-filtered MODIS snow products. Hydrol. Earth Syst. Sci. 2009, 13, 319–326. [Google Scholar] [CrossRef]
- Tong, J.; Déry, S.J.; Jackson, P.L. Interrelationships between MODIS/Terra remotely sensed snow cover and the hydrometeorology of the Quesnel River Basin, British Columbia, Canada. Hydrol. Earth Syst. Sci. 2009, 13, 1439–1452. [Google Scholar] [CrossRef]
- Eliason, E.J.; Clark, T.D.; Hague, M.J.; Hanson, L.M.; Gallagher, Z.S.; Jeffries, K.M.; Gale, M.K.; Patterson, D.A.; Hinch, S.G.; Farrell, A.P. Differences in thermal tolerance among sockeye salmon populations. Science 2011, 332, 109–112. [Google Scholar] [CrossRef]
- Déry, S.J.; Stahl, K.; Moore, R.D.; Whitfield, P.H.; Menounos, B.; Burford, J.E. Detection of runoff timing changes in pluvial, nival and glacial rivers of western Canada. Water Resour. Res. 2009. [Google Scholar] [CrossRef]
- DeWalle, D.R.; Rango, A. Principles of Snow Hydrology; Cambridge University Press: Cambridge, UK, 2008; p. 410. [Google Scholar]
- Déry, S.J.; Clifton, A.; MacLeod, S.; Beedle, M.J. Blowing snow fluxes in the Cariboo Mountains of British Columbia, Canada. Arct. Ant. Alpine Res. 2010, 42, 188–197. [Google Scholar] [CrossRef]
- Bao, Z.; Kelly, R.; Wu, R. Variability of regional snow cover in spring over western Canada and its relationship to temperature and circulation anomalies. Int. J. Climatol. 2010, 31, 1280–1294. [Google Scholar]
- Bohr, G.S.; Aguado, E. Use of April 1 SWE measurements as estimates of peak seasonal snowpack and total cold-season precipitation. Water Resour. Res. 2001, 37, 51–60. [Google Scholar] [CrossRef]
- Mote, P.W.; Parson, E.A.; Hamlet, A.F.; Keeton, W.S.; Lettenmaier, D.; Mantua, N.; Miles, E.L.; Peterson, D.W.; Slaughter, R.; Snover, A.K. Preparing for climatic change: the water, salmon, and forests of the Pacific Northwest. Clim. Chang. 2003, 61, 45–88. [Google Scholar] [CrossRef]
- Goodison, B.E.; Ferguson, H.L.; McKay, G.A. Measurements and Data Analysis. In The Handbook of Snow: Principles, Processes, Management & Use; Gray, D.M., Male, D.H., Eds.; Pergamon Press: Toronto, ON, Canada, 1981; pp. 191–274. [Google Scholar]
- Johnson, J.B.; Schaefer, G.L. The influence of thermal, hydrologic, and snow deformation mechanisms on snow water equivalent pressure sensor accuracy. Hydrol. Process. 2002, 16, 3529–3542. [Google Scholar] [CrossRef]
- Antifeau, T. The Significance of Snow and Arboreal Lichen in the Winter Ecology of Mountain Caribou (Rangifer tarandus caribou) in the North Thompson Watershed of British Columbia. Master’s Thesis, University of British Columbia, Vancouver, BC, Canada, 1987. [Google Scholar]
- Terry, E.; Mclellan, B.; Watts, G. Winter habitat ecology of mountain caribou in relation to forest management. J. Appl. Ecol. 2000, 37, 589–602. [Google Scholar] [CrossRef]
- Trujillo, E.; Molotch, N.P.; Goulden, M.L.; Kelly, A.E.; Bales, R.C. Elevation-dependent influence of snow accumulation on forest greening. Nat. Geosci. 2012, 5, 705–709. [Google Scholar] [CrossRef]
- Fan, S.; Grossnickle, S.; Russell, J. Morphological and physiological variation in western redcedar (Thuja plicata) populations under contrasting soil water conditions. Trees 2008, 22, 671–683. [Google Scholar] [CrossRef]
- Peterson, D.L. Climate, Limiting Factors and Environmental Change in High-Altitude Forests of Western North America. In The Impacts of Climate Variability on Forests; Beniston, M., Innes, J.L., Eds.; Springer: Berlin/Heidelberg, Germany, 1998; Lecture Notes in Earth Sciences Volume 74, pp. 191–208. [Google Scholar]
- Holtmeier, F.K.; Brol, G. Sensitivity and response of northern hemisphere altitudinal and polar treelines to environmental change at landscape and local scales. Global Ecol. Biogeogr. 2005, 14, 395–410. [Google Scholar] [CrossRef]
- Daniels, L.D.; Maertens, T.B.; Stan, A.B.; McCloskey, S.P.; Cochrane, J.D.; Gray, R.W. Direct and indirect impacts of climate change on forests: three case studies from British Columbia. Can. J. Plant Pathol. 2011, 33, 108–116. [Google Scholar] [CrossRef]
- Matsuzaki, E.; Sanborn, P; Fredeen, A.L.; Shaw, C.H.; Hawkins, C. Carbon stocks in managed and unmanaged old-growth western redcedar and western hemlock stands of Canada’s inland temperate rainforests. Forest Ecol. Mgmt. 2013, 297, 108–119. [Google Scholar] [CrossRef]
- Déry, S.J.; Brown, R.D. Recent Northern Hemisphere snow cover extent trends and implications for the snow-albedo feedback. Geophys. Res. Lett. 2007. [Google Scholar] [CrossRef]
- Choi, G.; Robinson, D.A.; Kang, S. Changing Northern Hemisphere snow seasons. J. Clim. 2010, 23, 5305–5310. [Google Scholar] [CrossRef]
- Derksen, C.; Brown, R. Spring snow cover extent reductions in the 2008–2012 period exceeding climate model projections. Geophys. Res. Lett. 2012. [Google Scholar] [CrossRef]
- Brown, R.; Mote, P. The response of northern hemisphere snow cover to a changing climate. J. Clim. 2009, 21, 6404–6424. [Google Scholar]
- Räisänen, J. Warmer climate: More or less snow? Clim. Dynam. 2008, 30, 307–319. [Google Scholar] [CrossRef]
- Pollack, E.W.; Bush, A.B.G. Climate change in western North America caused by a CO2 rise: A coupled atmosphere-ocean model simulation. Atmos. Ocean 2012, 50, 70–85. [Google Scholar] [CrossRef]
- Kim, J.; Kim, T.K.; Arritt, R.W.; Miller, N.L. Impacts of increased atmospheric CO2 on the hydroclimate of the Western United States. J. Clim. 2002, 15, 1926–1942. [Google Scholar] [CrossRef]
- Wang, T.; Hamman, A.; Spittlehouse, D.L.; Aitken, S.N. Development of scale-free climate data for western Canada for use in resource management. Int. J. Climatol. 2006, 26, 383–397. [Google Scholar] [CrossRef]
- Separovic, L.; Alexandru, A.; Laprise, R.; Martynov, A.; Sushama, L.; Winger, K.; Tete, K.; Valin, M. Present climate and climate change over North America as simulated by the fifth-generation Canadian regional climate model. Clim. Dyn. 2013, 41, 3167–3201. [Google Scholar] [CrossRef]
© 2014 by the authors; licensee MDPI, Basel, Switzerland. This article is an open access article distributed under the terms and conditions of the Creative Commons Attribution license (http://creativecommons.org/licenses/by/3.0/).
Share and Cite
Déry, S.J.; Knudsvig, H.K.; Hernández-Henríquez, M.A.; Coxson, D.S. Net Snowpack Accumulation and Ablation Characteristics in the Inland Temperate Rainforest of the Upper Fraser River Basin, Canada. Hydrology 2014, 1, 1-19. https://doi.org/10.3390/hydrology1010001
Déry SJ, Knudsvig HK, Hernández-Henríquez MA, Coxson DS. Net Snowpack Accumulation and Ablation Characteristics in the Inland Temperate Rainforest of the Upper Fraser River Basin, Canada. Hydrology. 2014; 1(1):1-19. https://doi.org/10.3390/hydrology1010001
Chicago/Turabian StyleDéry, Stephen J., Heidi K. Knudsvig, Marco A. Hernández-Henríquez, and Darwyn S. Coxson. 2014. "Net Snowpack Accumulation and Ablation Characteristics in the Inland Temperate Rainforest of the Upper Fraser River Basin, Canada" Hydrology 1, no. 1: 1-19. https://doi.org/10.3390/hydrology1010001