Article

Hydrological Evaluation of TRMM Rainfall over the Upper Senegal River Basin

1
Laboratoire Leïdi “Dynamique des territoires et développement”, Université Gaston Berger (UGB), BP 234 Saint Louis, Senegal
2
IRD, UMR HydroSciences Montpellier, Laboratoire Mixte International (LMI) TREMA (Télédétection et Ressources en Eau en Méditerranée semi-Aride), Centre Geber salle 26, Faculté des Sciences Semlalia, Université Cadi Ayyad, BP 2390 Marrakech, Maroc
3
Laboratoire LSAO “Laboratoire des Sciences de l’Atmosphère et de l’Océan”, Université Gaston Berger (UGB), BP 234 Saint Louis, Senegal
4
UFR S2ATA “Sciences Agronomiques, de l’Aquaculture et des Technologies Alimentaires”, Université Gaston Berger (UGB), BP 234 Saint Louis, Senegal
5
Department of Food, Agricultural and Biological Engineering, Ohio State University, Columbus, OH 43210, USA
*
Author to whom correspondence should be addressed.
Hydrology 2016, 3(2), 15; https://doi.org/10.3390/hydrology3020015
Submission received: 12 March 2016 / Revised: 8 April 2016 / Accepted: 8 April 2016 / Published: 15 April 2016

Abstract

:
The availability of climatic data, especially on a daily time step, has become very rare in West Africa over the last few years due to the high costs of climate data monitoring. This scarcity of climatic data is a huge obstacle to conduct hydrological studies over some watersheds. In this context, our study aimed to evaluate the capacity of Tropical Rainfall Measuring Mission (TRMM) satellite data to simulate the observed runoffs over the Bafing (the main important tributary of the Senegal River) before their potential integration in hydrological studies. The conceptual hydrological model GR4J (modèle du Génie Rural (Agricultural Engineering Model) à 4 paramètres Journalier (4 parameters Daily)) has been used, calibrated and validated over the 1961–1997 period with rainfall and Potential Evapotranspiration (PET) as inputs. Then, the parameters that best reflect the rainfall-runoff relation, obtained during the cross-calibration-validation phase, were used to simulate runoff over the 1998–2004 period using observed and TRMM rainfalls. The findings of this study show that there is a high consistency between satellite-based estimates and ground-based observations of rainfall. Over the 1998–2004 simulation period, the two rainfall data series show quite satisfactorily results. The output hydrographs from satellite-based estimates and ground-based observations of rainfall coincide quite well with the shape of observed hydrographs with Nash-Sutcliffe Efficiency coefficient (NSE) of 0.88 and 0.80 for observed rainfalls and TRMM rainfalls, respectively.

1. Introduction

Over the last few decades, rainfall decrease in West Africa [1,2,3,4,5,6,7,8] has broadly brought a depletion of water resources [9,10], whereas populations’ water demands grow increasingly [11]. This increase in water needs can sometimes trigger water conflicts between the different users. In order to limit these potential conflicts and make water resources management viable, the Integrated Water Resources Management (IWRM) approach was introduced in 1992 during the International Conference on water and development that was held in Dublin [12]. Since then, The IWRM has been considered as a valuable alternative in assuring a sustainable water resource management [13].
One of the key features of IWRM is knowledge on water quality and quantity [12]. Indeed, it requires a balance between demands and available water. In this context, knowledge appears to be the foundation of the IWRM [14] or a recommendation about its implementation [13]. However, there is no sufficient knowledge on water resources in West Africa. National hydrological services have difficulty assuring a proper monitoring of water streams due to a lack of financial and human resources [15]. Consequently, West Africa is experiencing a deterioration of its monitoring network, and this results in substantial gaps in stream discharge series. These gaps in the series of hydrological data prevent specialists from having enough knowledge on water resources to properly manage, as well as to conduct designing studies, which constitute the prerequisites before building hydrological infrastructures (dam, anti-salt dike, retention basin, road infrastructure and containment-dike) for the benefit of populations.
Over the last few years, in addition to the issue related to scarce knowledge on water resources, specialists are facing another issue related to the evaluation of the impacts of climate change on water availability. Data on rainfalls and evapotranspiration are the key parameters of water balance since they enable people to have the necessary knowledge for the proper management of the resources, but also to make prospects on its evolution [16,17,18,19,20,21]. However, the availability of climatic data, especially on a daily time step, has become very rare in West Africa over the last few years [22,23] due to the high costs of climate data monitoring. This scarcity of climatic data is a huge obstacle to conduct hydrological studies over some watersheds. Moreover, high spatial variability of rainfalls may suggest the densification of the rain gauge station network, whereas this is not the case for the majority of West African watersheds [24,25,26]. For example, the Ebro basin in Spain, with an area of 85,000 km2, has over 1000 rainfall stations [27]; whereas the Senegal River basin, with an area of 300,000 km2, has only 80 rainfall stations, and furthermore, these stations present huge gaps [23]. Furthermore, of the 80 existing rainfall stations in the Senegal River basin, there are only 23 rainfall stations with less than 5% daily gaps over the 1950–1998 period [23].
Satellite-based rainfall products are a valuable alternative to address this lack of observed data [28]. In this context, several studies have been conducted to evaluate their accuracy [2,29,30,31,32,33,34,35,36,37,38,39,40]. In these studies, satellite rainfall data have been compared to a set of ground observed data on a yearly, monthly or daily time step. Results show progress achieved over the last few decades [38,41] in terms of the quality and exploitability of those data, which allow their potential use in the West African context. Gosset et al. [39] have used eight series of satellite-based rainfall products (PERSIANN, CMORPH, TRMM 3B42 RT, GSMaP, GPCP-1DD, TRMM 3B42 v6, RFE2 and EPSAT) to simulate runoffs in the AMMA-CATCH sites in Benin and Niger. Results regarding TRMM 3B42 v6 products are not very conclusive with biases in simulations of runoff varying from −60%–+60%. In a recent study, Casse et al. [42] have used six series of satellite data (CPC, RFE2, TRMM 3B42 v7, TRMM 3B42 RT, CMORPH and PERSIANN) to simulate runoffs and to forecast floods of the Niger River in Niamey with good results for the TRMM 3B42 v7 product. Over the Senegal River basin, Stisen and Sandholt [43] used five satellite rainfall products (CMORPH, CCD, CPC-FEWS v2, TRMM 3B42 v6 and PERSIANN) with the distributed hydrological model MIKE SHE to simulate runoffs in three discharge gauging stations: Oualia, Gourbassy and Bafing Makana. The MIKE SHE model was calibrated over the 1991–1996 period and then validated over the 1987–1990 period with observed data following by the simulation of runoffs over the 2003–2005 period using observed rainfall data and measured rainfall via satellite. The simulation based on TRMM data were inconclusive for the Bafing Makana watershed.
The objective of the present study is to evaluate the capacity of TRMM rainfall data series to simulate runoffs of the Bafing basin using the GR4J conceptual model with much longer series of data (1961–2004). The Bafing is an important tributary of the Senegal River since it accounts for about 40%–60% of the river’s discharge in Bakel [44]. GR4J is a data and parameter parsimonious model, and its capacity to simulate runoffs in the African context has been demonstrated by several studies [45,46].

2. Materials and Methods
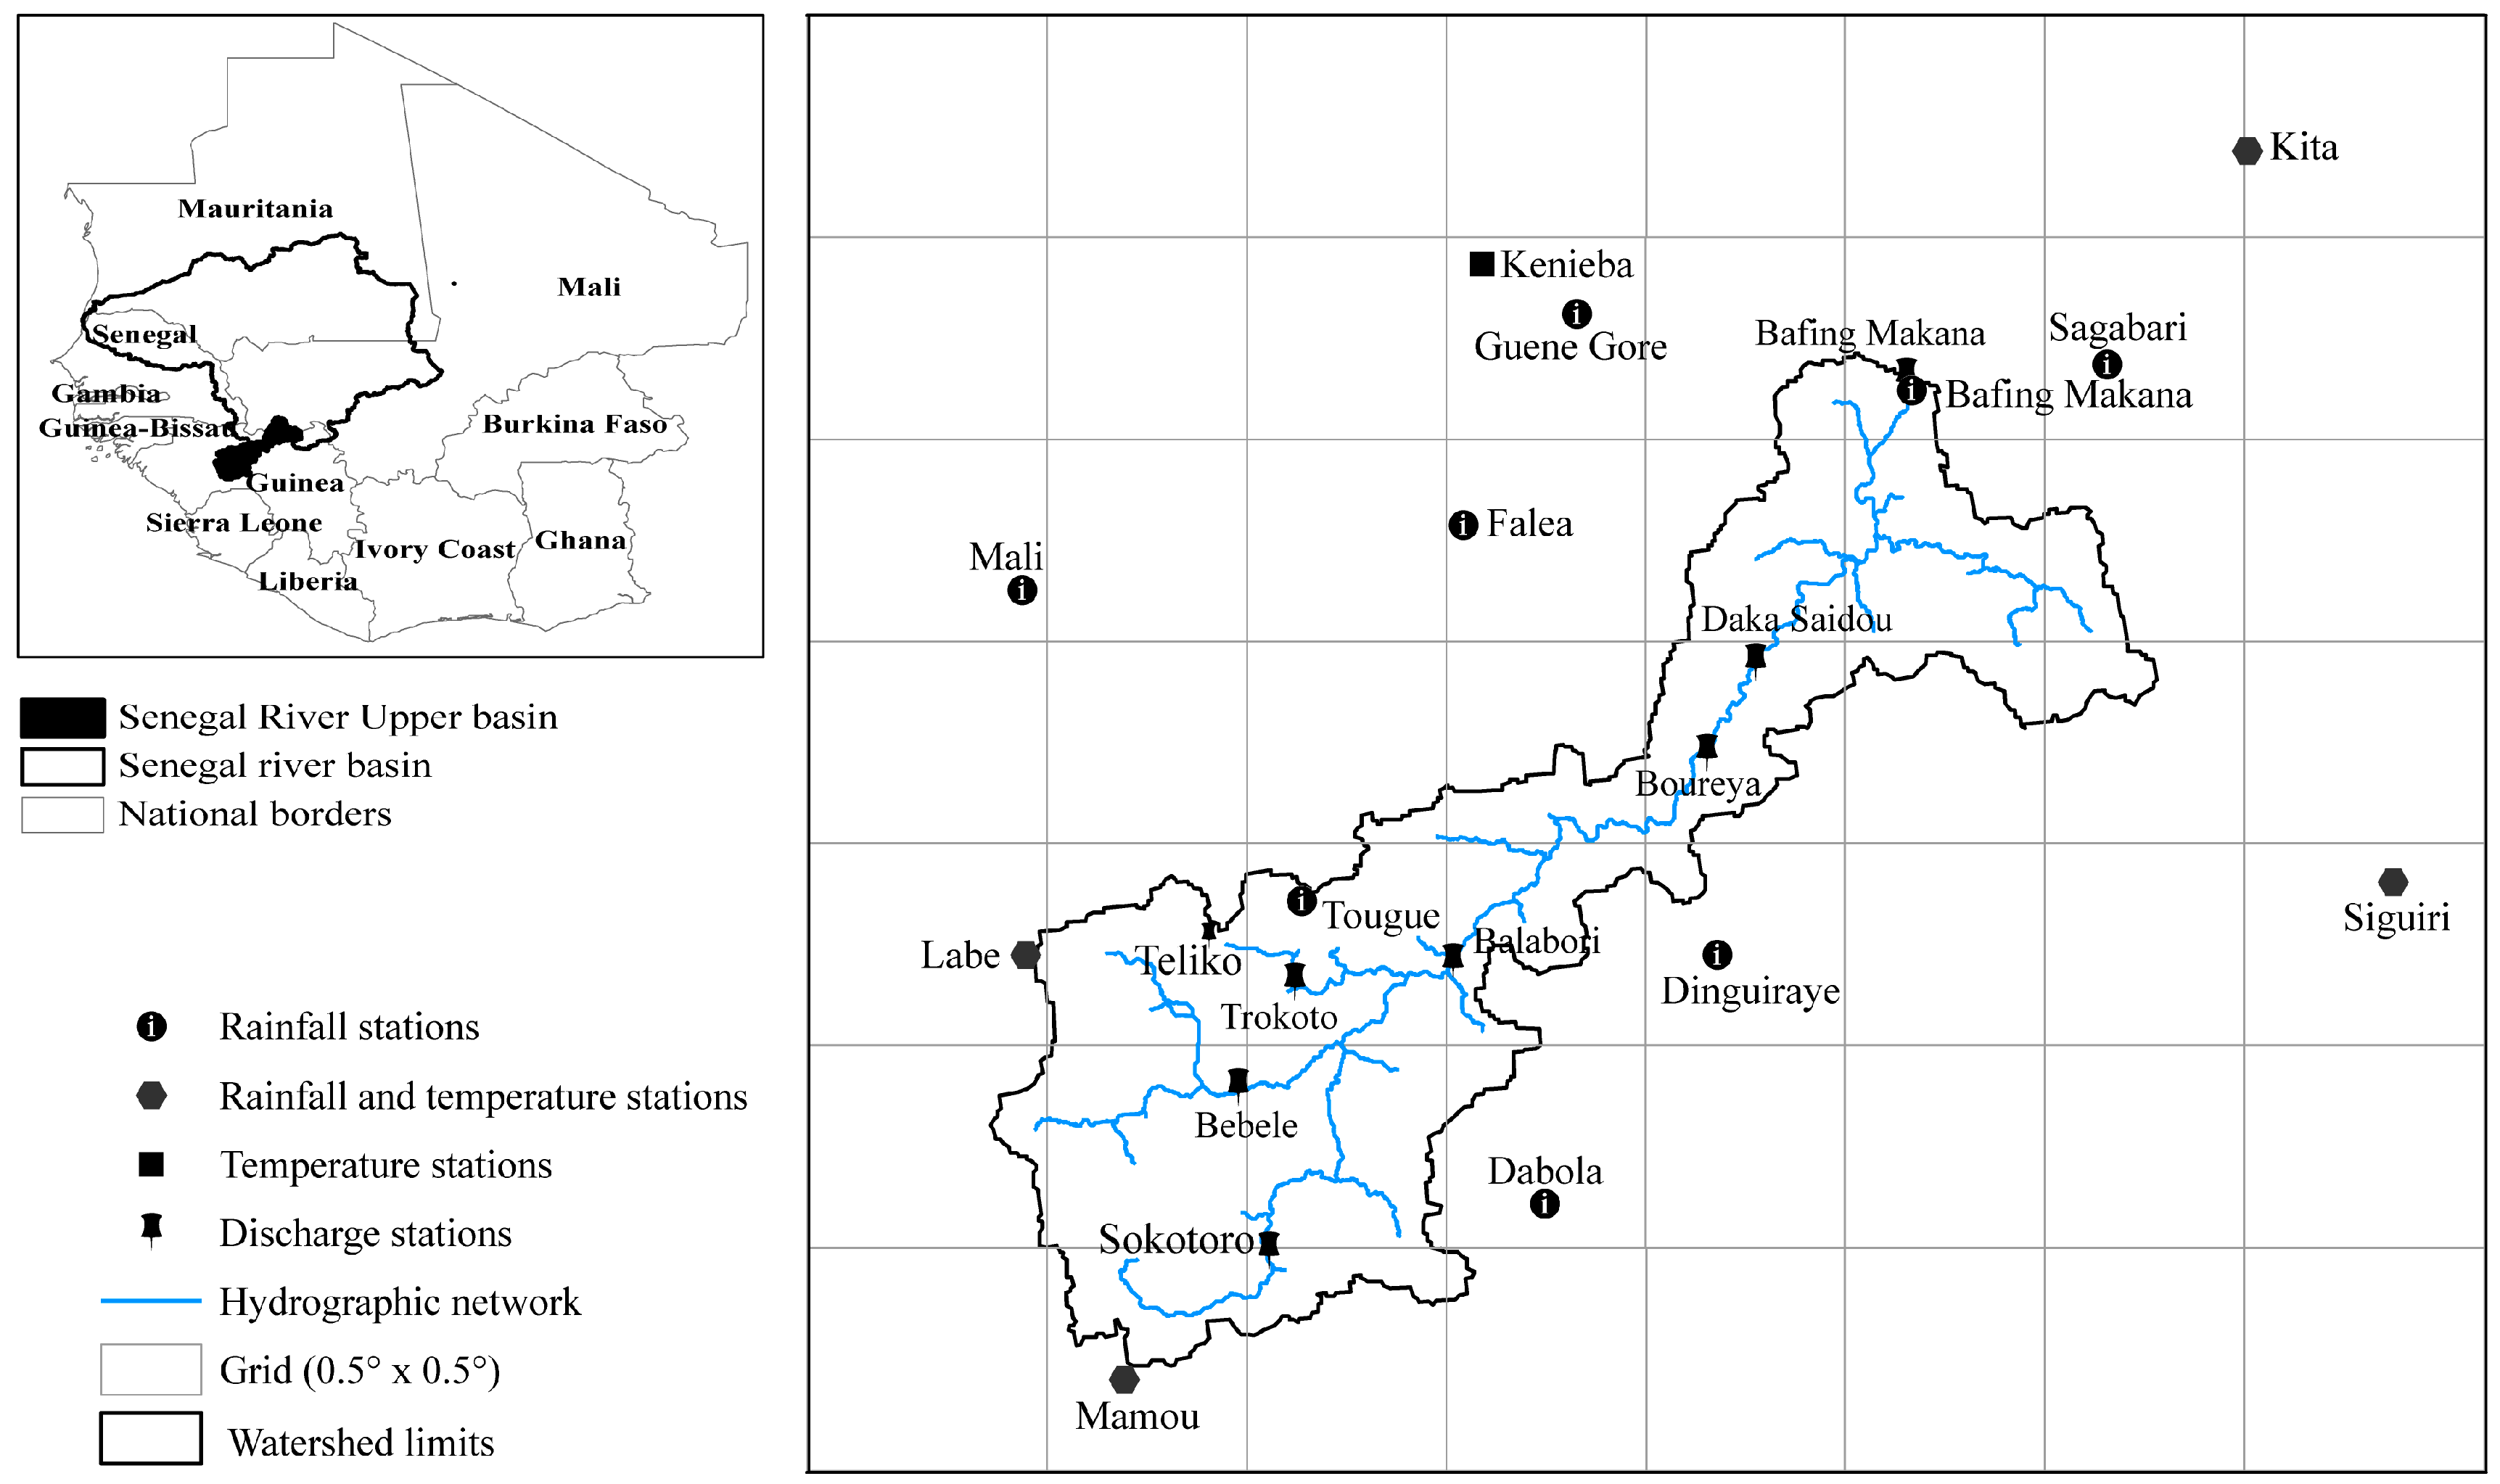
2.1. Study Area

The study area is located between latitudes 10°30’ and 12°30’ north and longitudes 12°30’ and 9°30’ west. It covers Guinea (Conakry) and Mali with a total surface of 21,290 km2 at the gauging station of Bafing Makana (Figure 1). The physical environment of the study area has already been described in previous studies [15,47,48]. The upper Senegal River basin is characterized by dense vegetation with some signs of deterioration due to the conjunction of several natural factors, such as drought and erosion, and anthropogenic factors, such as deforestation, bush fires, over-exploitation of forest resources and overgrazing [49]. The upper Senegal River basin has a dense hydrographic network [50], but the natures of the soil, as well as the geological formations are not favorable to the existence of large aquifers [51]. The physiographic parameters of the upper Senegal River basin calculated by Bodian et al. [15,47] using 90-m resolution data provided by the Shuttle Radar Topography Mission (SRTM) from the National Aeronautics and Space Administration (NASA) [52,53] show that the upstream basin has an elongated form. Elevations vary from 215–1389 m with a 2.3-m/km overall slope index. From a climatic point of view, the upstream basin of the Senegal River belongs to the Guinean-Sudanese zone, which is mainly characterized by a unique rainy season in the year from April–October [54]. The mean annual rainfall is 1490 mm [55]. It is induced by the movement of the Inter-tropical Convergence Zone from south northwards, allowing the penetration of the West African monsoon, which is driven by the thermal contrast between the sea and the continent.

2.2. Data and Tools

2.2.1. Data

Observed climatic and hydrological data and Tropical Rainfall Measuring Mission (TRMM) data were both used in this study.
Observed data (rainfall and temperatures) were provided by the National Meteorology Agencies in Guinea and Mali. Twelve rainfall stations and five temperature measurement stations have been used. Table 1 and Table 2 provide an inventory of the available data. The quality and duration of these data are variable, especially according to the country. Hydrological data of the Bafing Makana station originated from the database of the Organization for the Development of the Senegal River (OMVS). They deal with the 1961–2004 period with a near-zero missing data rate (0.003%). The reference period that has been chosen for this study is 1961–2004. More recent data are not taken into account because they are not available or not accessible from the Guinean and Mali Meteorological Agencies and OMVS. However, we used 43 years of data that concern wet and dry periods that West African countries experienced over the last periods. The 1961–2004 period has specificity to the present concomitant data (rainfalls, temperature and runoffs) with relatively few gaps. Figure 1 shows the spatial distribution of stations.
Three-hourly TRMM 3B42 [56] covering the latitude band 50°S–50°N with a 0.25° × 0.25° (~25 km × 25 km) spatial resolution has been used. These data are a combination of TRMM synthetic images and other satellite-provided images [57]. Thus, the Aqua microwave sensors, National Oceanic and Atmospheric Administration (NOAA), Defense Meteorological Satellite Program (DMSP) satellites, as well as visible/infrared data from geostationary satellites have been taken into account when estimating rainfall algorithms [58]. These estimates were then adjusted by including monthly ground climate measures generated by Global Precipitation Climatology Project (GPCP) and Climate Assessment and Monitoring System (CAMS) networks to provide TRMM 3B43 monthly data. The adjustment coefficients calculated for these data were finally applied to three-hourly data in order to determine the final TRMM 3B42 data, Version Number 7. This TRMM 3B42 v7 dataset was used due to its availability and successful results achieved over the world, particularly in the West Africa area. Gosset et al. [39] highlighted that the performance of TRMM data compared to gauges over Niamey is high when numerous statistical criteria are considered (overall bias; correlation of the time series and spatial patterns; frequency distribution of the rain rates). However, Moazami et al. [59] indicated that Version 6 of TRMM 3B42 underestimates (by around 25%) mean annual precipitation over the entire country of Iran, with a value of 0.17 mm/day.

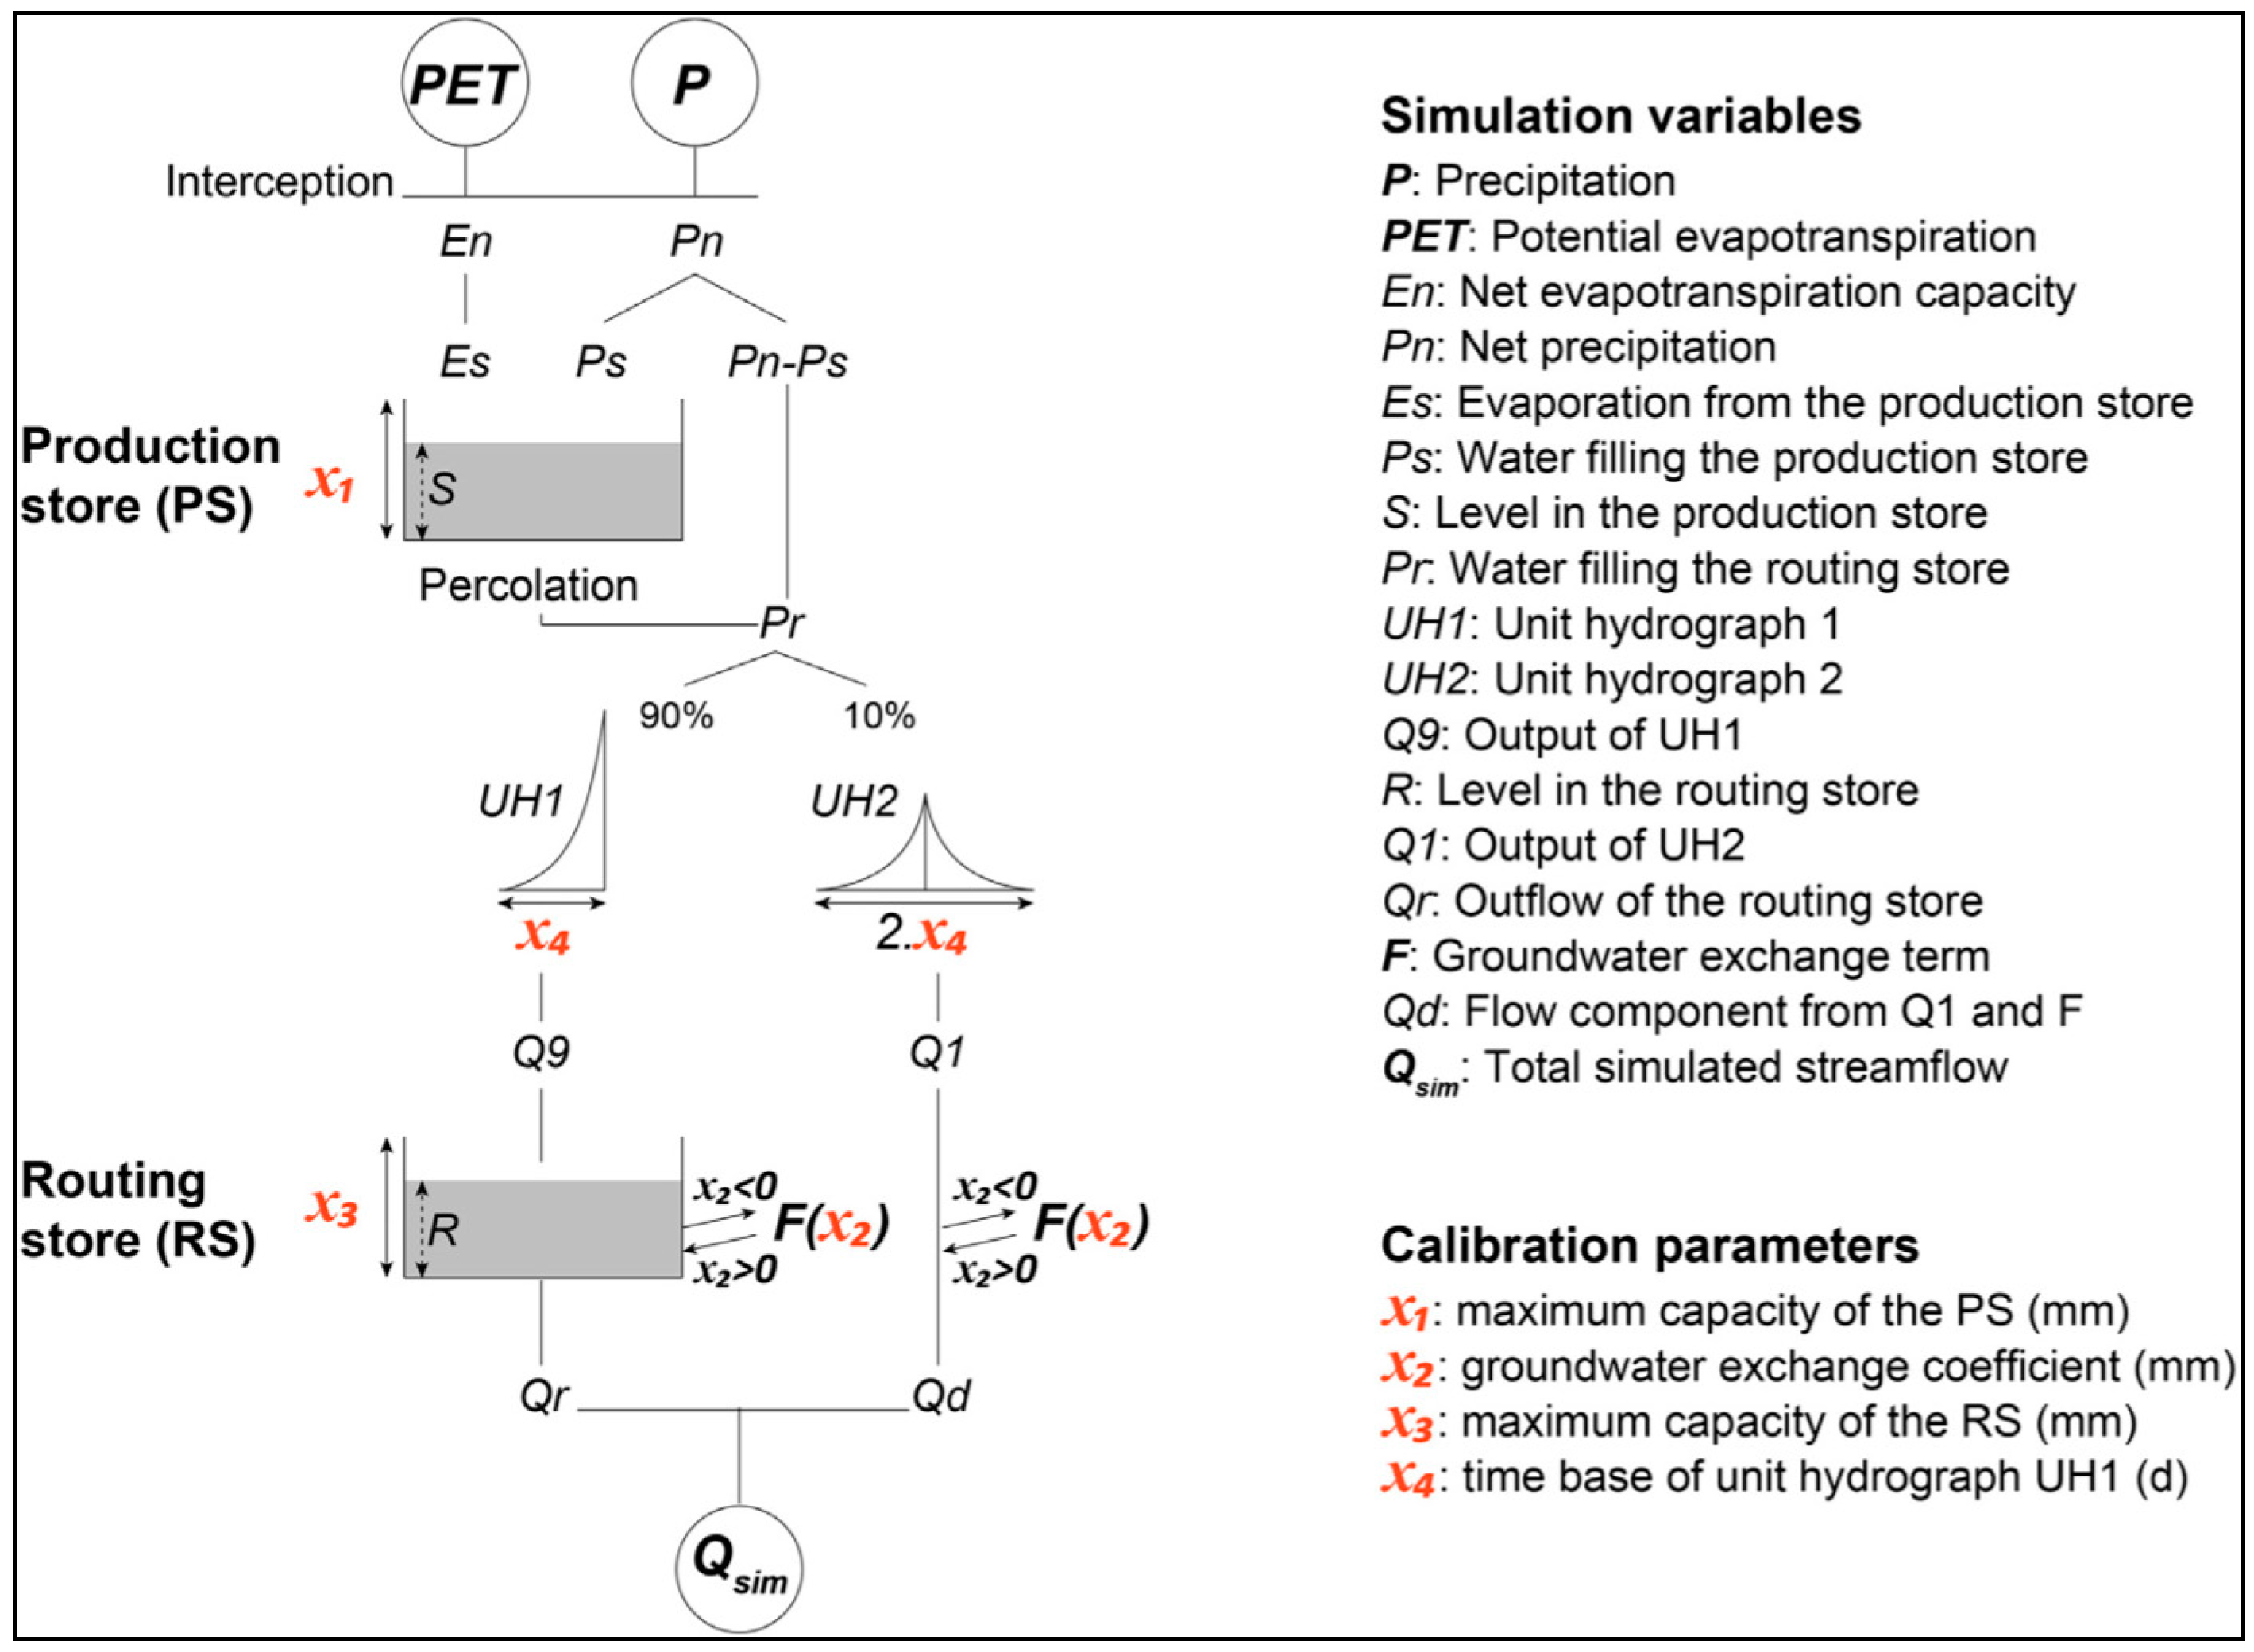
2.2.2. GR4J Hydrological Model

There are several types of hydrological models. In our study, the choice of model was constrained by the size of the watershed and the availability of input data. Indeed, given the spatial scale of the catchment basin of the study (21,290 km2) and the fact that it was not possible to obtain data related to land use and soil types, we have decided to use GR4J, a lumped and conceptual model. GR4J is a simple model with few input data and that successfully simulates flow in the West African context, as shown by several studies [45,46]. The GR4J conceptual model [60] simulates runoffs through two functions: production and transfer functions. The production function uses daily rainfalls (P) and daily Potential Evapotranspiration (PET) to determine the quantity of rainfall that contributes to the runoff and feeds the transfer reservoir [61]. Then, a routing function calculates the discharge at the basin’s outlet. The quantity of water feeding the routing function (Pr) is made of a fraction of the net precipitation (Pn) and the percolation. Pr is then divided into two parts: (i) 90% is routed by a unit hydrograph (UH1) and by the routing reservoir; (ii) the other 10% is routed by second unit hydrograph (UH2). The objective of these two unit hydrographs is to take into account the time delay between the rainfall and the runoff. GR4J calibration is determined by 4 parameters: the size of the production reservoir and routing reservoir are calibrated by Parameters X1 (mm) and X3 (mm), respectively. The function of Parameter X2 (mm) is to determine exchanges between surface and groundwater. When X2 < 0, groundwater feeds surface runoff, and inversely, when X2 > 0, surface runoff feeds groundwater. X4 (days) is the time base of the unit hydrograph UH1 (Figure 2). A more detailed description of the model is available in Perrin et al. [60]. The GR4J model requires daily rainfalls and PET data. There are several methods for calculating the PET. The Penman–Monteith (FAO-56) method is the recommended method by the Food and Agriculture Organization (FAO). However, it requires many climate data (wind speed, temperature, relative humidity, solar radiation) that were not available in this area. Thus, in this study, we used the formula proposed by Oudin et al. [62], which only needs daily air temperature, Julian day of the year and latitude and that was designed for rainfall-runoff modeling. This method underestimates PET values [63], but Khediri and Drugs [64] showed that the GR4J model is not very sensitive to PET.

2.3. Methods

In this study, (i) the evaluation of TRMM rainfall data, (ii) cross-validation of the GR4J model over the 1961–1997 with rainfall input data and PET data, (iii) simulation of flows over the 1998–2004 period with observed rainfalls and TRMM rainfalls with the sets of parameters validated in the second phase (iv) and a comparison of observed flow rates with those calculated with observed and TRMM rainfalls have been investigated. For the calibration-validation, we used ground-based data, because it was difficult to find a common period of at least 10 years between observed and TRMM rainfalls.

2.3.1. Evaluation of TRMM Rainfalls Data

Before using TRMM rainfall data to simulate runoff, we compared these data to observed rainfall. This evaluation was not done station by station [29], but we used the mean rainfall over the whole river basin [65]. Previous studies [15,47] in this area showed that the inverse squared distance method gave better results compared to the other interpolation methods (kriging and spline function). Mean rainfall was calculated by using the inverse distance squared method on a 0.5° × 0.5° spatial resolution grid (Figure 1). Then, the cumulative frequencies, the number of rainy days, as well as the monthly and annual means have been calculated and were compared in order to check whether the data generated by the different stations are consistent with satellite-generated data.

2.3.2. Calibration and Validation of GR4J Model

The rainfall series in the upper basin are not stationery (Figure 3). They present breaks located between 1960 and 1970 for 80% of the stations [55]. This situation involves a potential changes in the hydrological behavior of the watersheds [66,67]. Thus, the choice of the calibration periods must be made carefully for the definition of the parameters of the model. Therefore, we chose two periods: 1963–1982 and 1983–1997, which both follow a two-year initialization period. The optimization of the model parameters has been carried out based on a multi-criteria function (Fagg) proposed by Ruelland et al. [67] and which aggregates the Nash and Sutcliffe criterion, cumulative volume error and mean volume error (Table 3). To avoid bias due to the use of only one criterion (NSE), we preferred to use this multi-objective calibration procedure using two other criteria (volume error (VE) and mean VE (VEm)) aggregated in the Fagg function. This optimization has been carried out in three phases: (1) a random draw of 1715 combinations of parameters (X1, X2, X3 and X4) of the model enabled us to identify the best set of parameters that was subsequently used as a starting point for the Rosenbrock [68] non-linear optimization of the production function, followed by a second Rosenbrock optimization of the parameters of the transfer function; (2) 100 repetitions of the first phase enabled us to identify the best combination of parameters; and finally, (3) we carried out a local fine-tuning of parameters, using the Nelder and Mead simplex technique [69], in order to optimize all of the parameters depending on the combination chosen during Phase 2. This three-phase optimization procedure was chosen among others because of his capability to avoid local minima in the objective function and because of its short execution time. It has also been successfully used with the GR4J model for other studies [27]. The model’s parameters were adjusted to each period before validating the model over the other period. This process allows us to choose the parameters that best reflect the rainfall-runoff relationship [15].

2.3.3. Simulation of Daily Flows with Observed and TRMM Rainfalls

The cross-calibration-validation of the GR4J model with observed data enabled us to determine the model’s parameters that best reflect the rainfall-runoff relation. These parameters have then been used to simulate flows over 1998–2004 with ground and TRMM rainfall data. This approach aims to evaluate the capacity of the satellite-generated rainfall data to simulate runoffs in comparison with ground data. The Nash and Sutcliffe criterion [70] and the determination coefficient (R2) have been used for the purpose of this study. R2 has been widely used for model evaluation [71,72,73], though it is oversensitive to high extreme values (outliers) and insensitive to additive and proportional differences between model predictions and measured data [74]. The Nash and Sutcliffe criterion is a normalized statistic that determines the relative magnitude of the residual variance (‘‘noise”) compared to the measured data variance and indicates how well the plot of observed versus simulated data fits the 1:1 line [75]. Nash–Sutcliffe efficiencies range between (−∞, 1): NSE = 1 corresponds to a perfect match of forecasting discharge to the observed data; NSE = 0 shows that the model predictions are the same as the mean value of the observed data; and −∞ < NSE < 0 occurs when the mean observed value is a better predictor than the model simulated value, which indicates unacceptable performance [73]. The Nash criterion calculated on the basis of all flows of the flood hydrograph generally will favor simulating the flow of high water at the expense of low flows [76].

2.3.4. Comparison of Observed and Calculated Flows Rates with Observed and TRMM Rainfalls

The Hydraccess free software [77] widely used in West Africa (and notably in hydrological services for database management) was used to calculate observed characteristic discharges and simulated characteristic discharges with observed and TRMM rainfalls by using daily data over 1998–2004. Annual flows have been ranked in decreasing order and frequencies calculated. Values exceeding 1 day, 10 days, 20 days, 1 month, 2 months, etc., have been identified (Table 4).

3. Results

3.1. Evaluation of TRMM Data

The evaluation of TRMM mean rainfall was carried out on a yearly, monthly and daily basis (Figure 4). On a yearly basis, TRMM cumulative rainfall is lower than cumulative observed data in five out of seven years with variation rates ranging between −0.67% in 1998 and −19.21% in 2004. Only 1999 presents TRMM mean annual rainfall greater than observed rainfall. It should be noted that the difference (4% in average) between observed and TRMM annual cumulative rainfall remains low over the whole study period. On a seasonal basis, the TRMM satellite tends to underestimate monthly cumulative rainfalls at the beginning (April and May) and middle (August and September) of the rainy season with variation rates ranging between −45.6% in April and −2.8% in September in comparison to observed data. In June and July, the satellite tends to overestimate rainfall. Although the results (Figure 4) show that TRMM rainfall data tend to overestimate rainfall between 1 mm and 15 mm, the two series (observed and TRMM rainfall) show strong similarities.

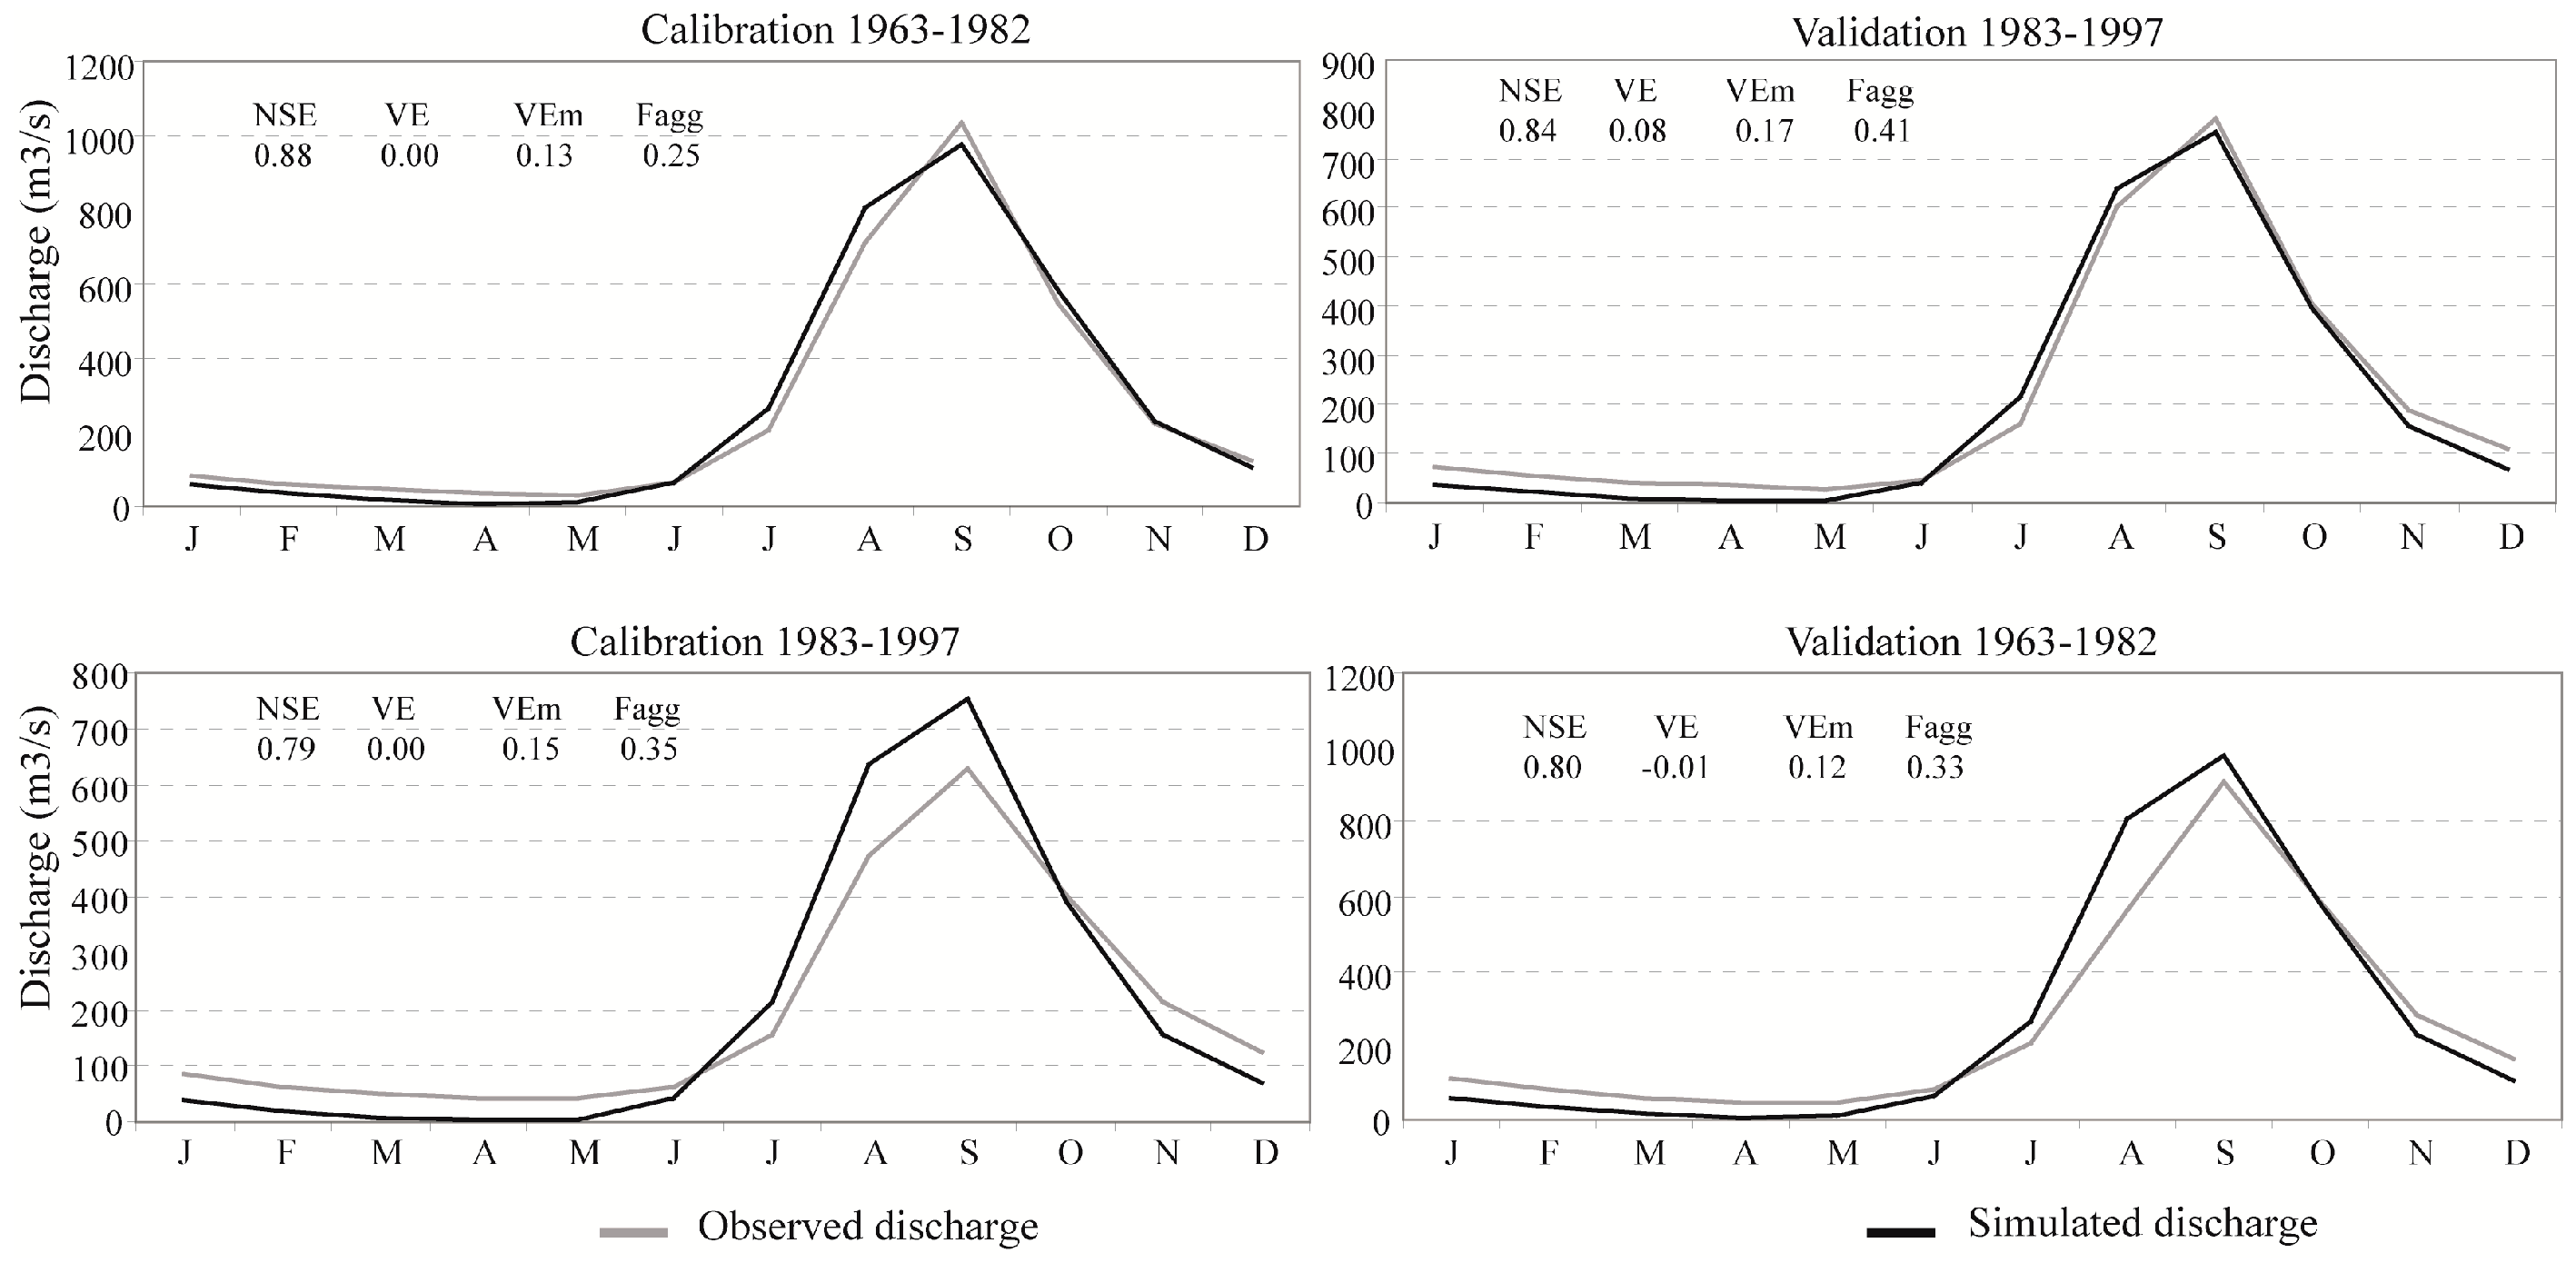
3.2. Efficiency of the Model GR4J on Calibration-Validation

The values of the criteria function obtained after the cross-validation are presented in Figure 5. For calibration and validation, the values of Nash are positive (greater than 0.70). For the calibration over 1963–1982 and the validation over 1983–1997, the model tends to overestimate low flows and slightly underestimate high flows, even though flood peaks are overestimated. For the calibration over the 1983–1997 period and the validation over the 1963–1982 period, the model tends to overestimate low flows and slightly underestimates the high flows and flood peaks. Overall, the model overestimates low flows, whereas it underestimates high flows (Figure 5). Through the effect of compensation, we end up with near zero cumulative volume error (Figure 5). In fact, the runoff volume errors compensate over the whole period, whereas runoffs are, for example, underestimated during wet years, while they are overestimated during dry years [61]. The mean annual volume error gives as much importance to dry years as to wet years in the evaluation of the model’s capacity to represent the runoff volumes [61]. Thus, the GR4J model overestimates by 12%–17% the runoff flows on calibration and validation. Parameters calibrated over the 1963–1982 period (covering both wet and dry years; see Figure 3) are those that best reflect the 1983–1997 period with Nash criteria of 0.88 and 0.84 on calibration and validation, respectively. As a result, we decided to choose the X1, X2, X3 and X4 parameters of the 1963–1982 calibration period as the ones that should be extrapolated to the 1998–2004 period.

3.3. Comparison of Simulated Daily Flows with Observed and TRMM Rainfalls

The parameters chosen in the previous phase were used to simulate flows over the 1998–2004 period based on ground and satellite rainfall data. The results (Figure 6) show that the two sets of rainfall data reproduce very well the shape of the observed hydrographs with Nash criteria of 0.88 and 0.80 for observed rainfalls and TRMM rainfalls, respectively.

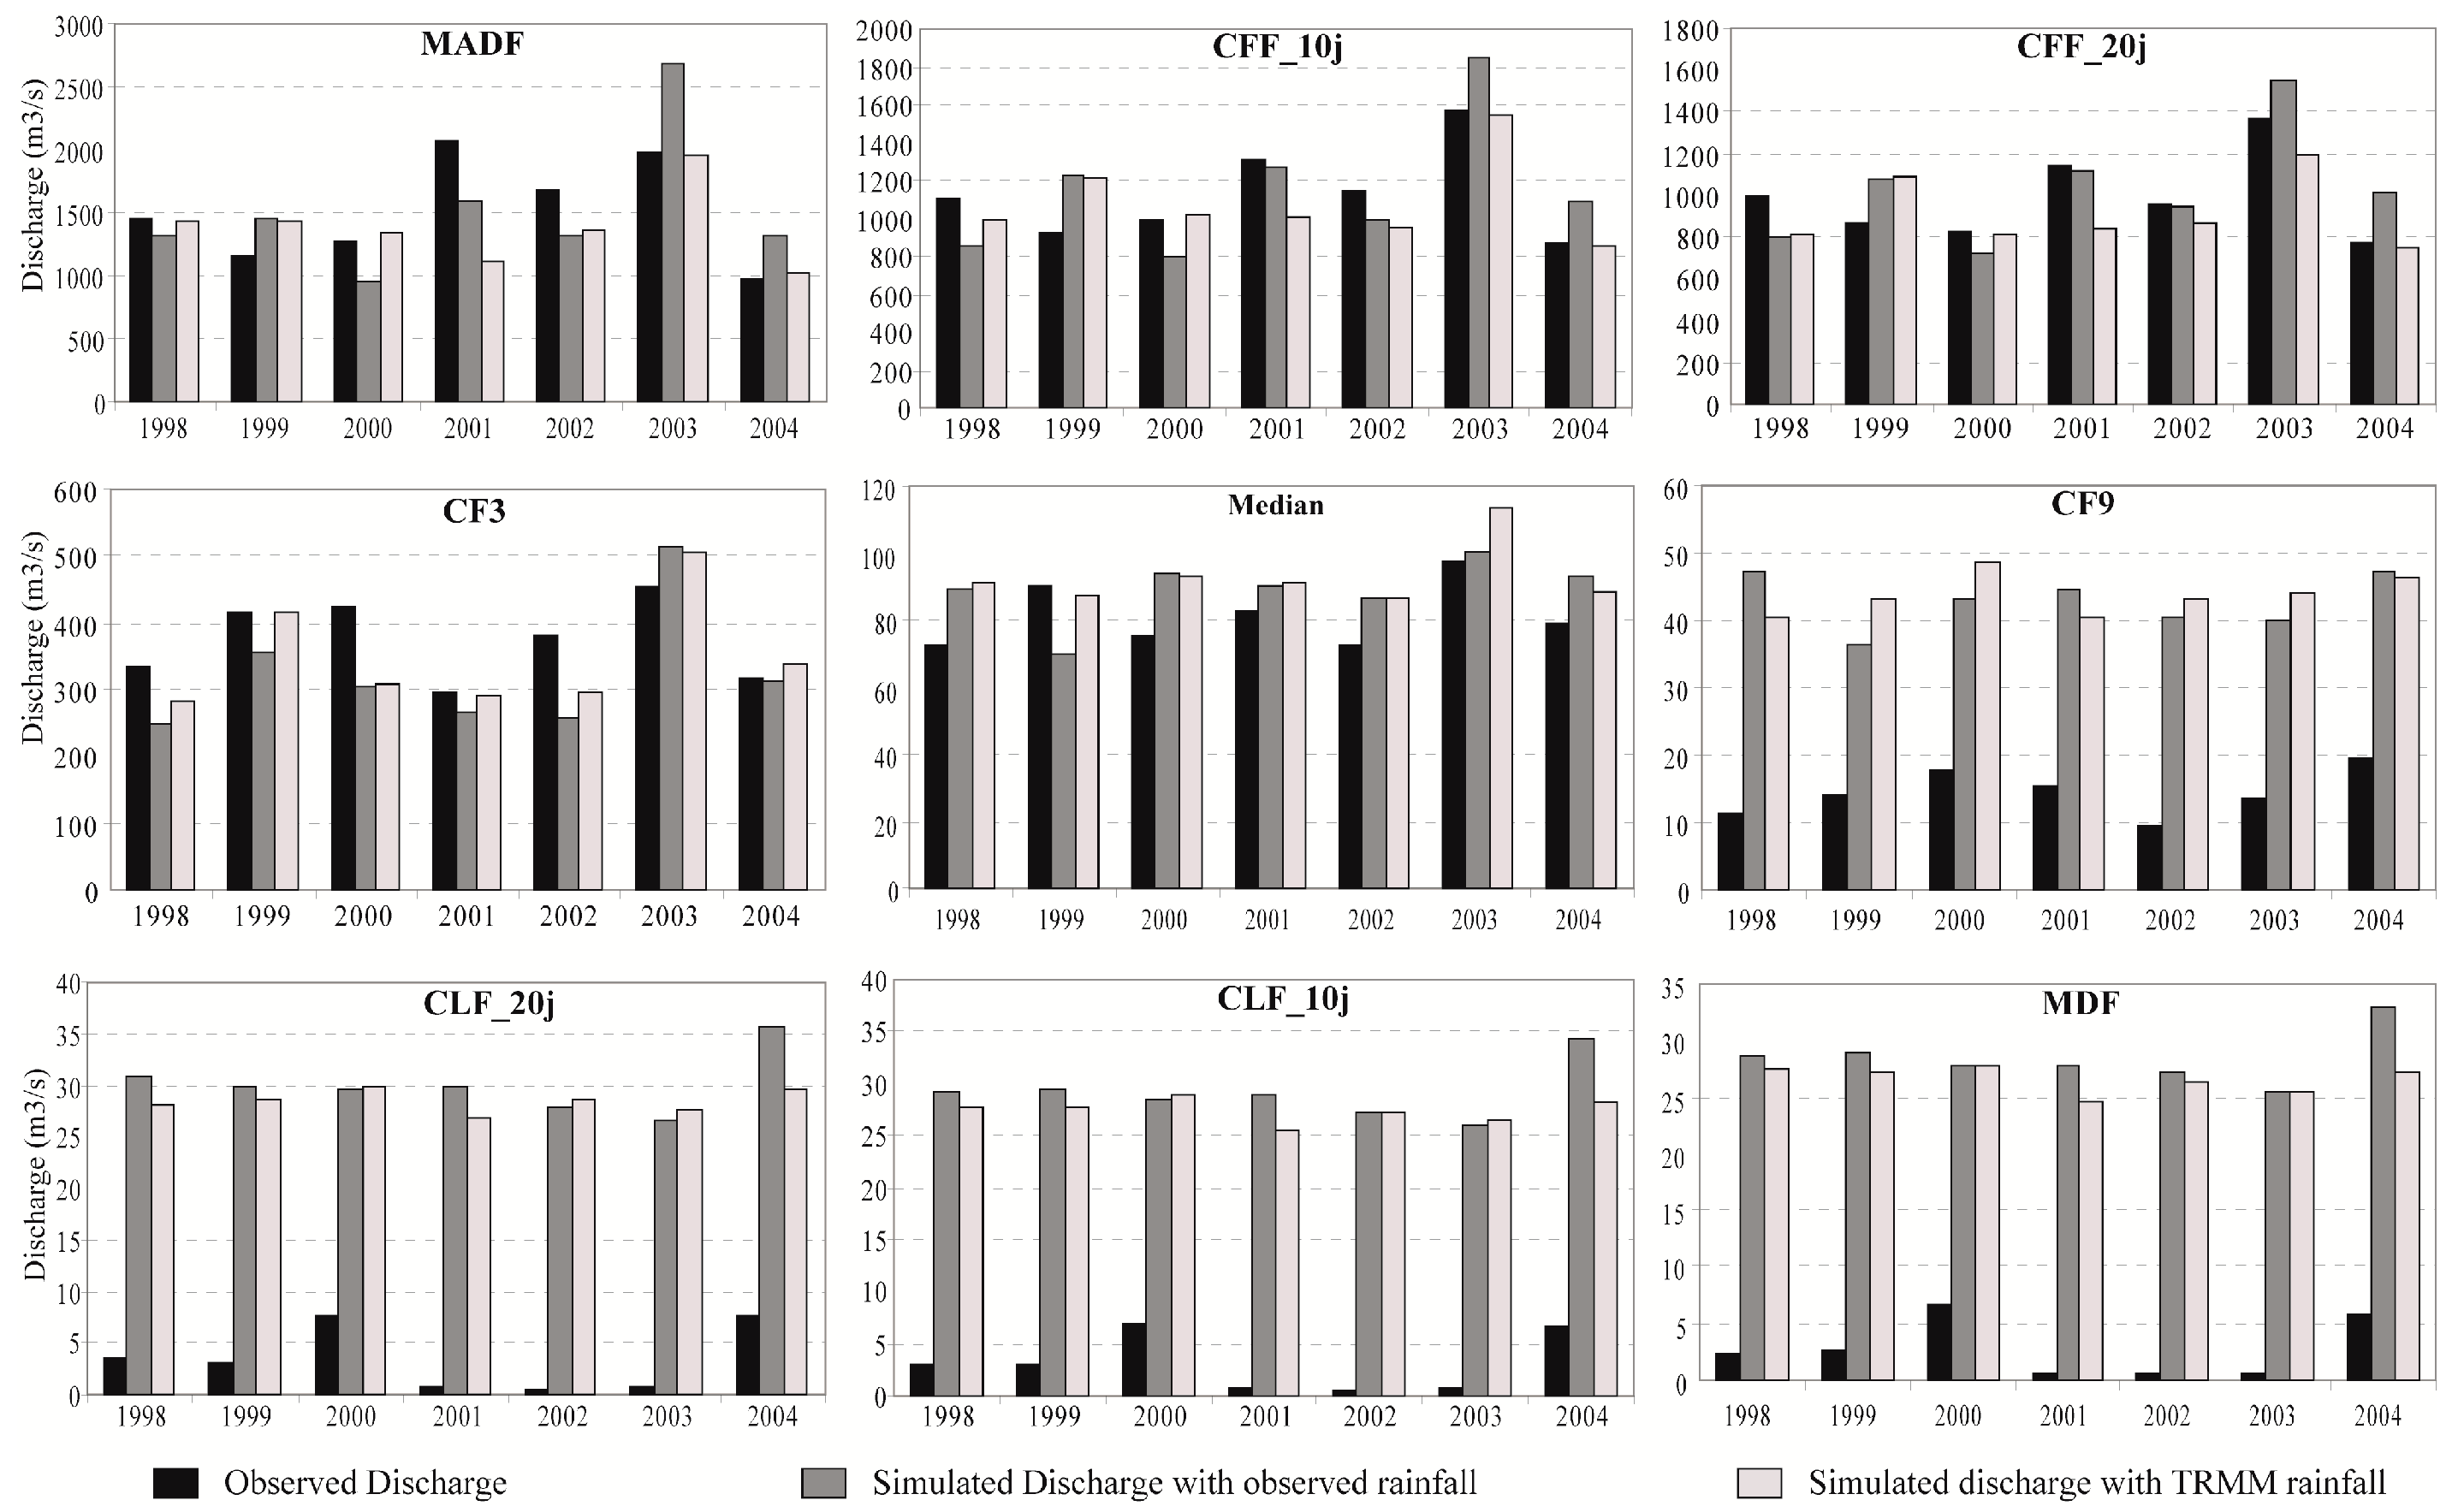
3.4. Comparison of Observed and Calculated Characteristics Flow Rates with Observed and TRMM Rainfalls

Each variable of flow rates has been calculated for each year, over the 1998–2004 period, for observed flows values and for flows simulated with observed rainfalls and TRMM rainfalls. The results (Figure 7) show by using observed and TRMM rainfalls that there are few differences between observed and simulated MAximum Daily Flow (MADF), Characteristic Flood Flow on a 10-day period (CFF_10d) CFF_20d and Characteristic Flow exceeded 3 months in the year (CF3). Thus, for MADF, the mean variation rates of simulated flows range from 0.03% for observed rainfalls to −8.81% for TRMM rainfalls in comparison with observed flows. As for CFF_10d, the mean variation rates of simulations range from 2.16%–−4.48% for observed rainfall and TRMM rainfalls respectively, in comparison with the observed data. The differences between simulations and observations become important for flows below the median (CF9, CLF_20d, CLF_10d and MDF). Thus, the observed daily minimum flow over the 1998–2004 period amounts to 2.7 m3/s, while the daily minimum flows simulated over the same period amount to 28.4 m3/s for observed rainfalls and to 26.6 m3/s for TRMM rainfalls. These results show that the errors in the simulations of low flows are not caused by the nature of the model’s rainfall inputs, but rather by the structure, as well as the calibration of the hydrological model. Because of this limitation, it would be interesting to test other hydrological models to evaluate their performances to simulate low flows.

4. Conclusions and Discussion

The hydrology of the upper Senegal River basin, particularly in its Guinean part, is not well known due to the lack of meteorological and hydrological data. Data series in this area present many gaps because from 1972–2005, Guinea was not a member of OMVS, comprising Mali, Mauritania and Senegal. This leads to the deterioration of gauge networks’ quality in the upper part of the basin. Following the integration of Guinea in 2006, the World Bank has supported OMVS to rehabilitate and densify the meteorological and hydrological network in order to fill the gap of information in the upper Senegal River basin. A vast program has also been implemented in order to increase hydropower production by the construction of multifunctional reservoirs and dams [48]. However, serious hydrological studies are needed before building hydraulic infrastructures. As mentioned by Mahé [78], rainfall analysis is the first step for any hydrologic study. He pointed out that runoff is just a response to rainfall depending on different factors (basin size, geology, sol, slope and land use). Due to the importance of rainfall, Bodian et al. [55] investigated the spatiotemporal evolution and distribution of the rainfall in the upper Senegal River basin. Other studies from Bodian et al. [15,47] used the conceptual model GR2M to reconstitute the series of monthly hydrological data in the upper Senegal River basin.
This paper completes the previous works of Bodian et al. [15,47,55] by assessing the capacity of TRMM rainfall data series to simulate runoffs of the Bafing basin (upper Senegal River basin) using the GR4J conceptual model in the context of data scarcity and the difficulty of access to data. The novel contributions of this research compared to the previous ones are: (i) GR4J (daily time step), same family as the model GR2M (monthly time step), successfully simulates daily flow at the upper Senegal River basin, which is an important aspect for water resource management, because monthly flows are not suitable for high and low flow analysis; (ii) in the context of a lack of observed meteorological data, we can use TRMM for hydrologic analyses or use it to extend meteorological data series.
For this, at first, TRMM data have been evaluated in connection with ground data. This evaluation of TRMM rainfall data was carried out for mean rainfall throughout the watershed. Then, the GR4J model was calibrated and validated over the 1961–1997 period with observed rainfall PET as inputs at a daily time step. Finally, the parameters that best reflect the rainfall-flow relationship have been used to simulate flows over the 1998–2004 period with ground and TRMM data.
The results show consistency between satellite estimates and ground-based observations. Similar conclusions have been drawn by Gosset et al. in their study on the AMMA-CATCH sites, by Casse et al. in their study on the Niger River basin and by Collischonn et al. [62] on the Amazon basin. However, the satellite tends to overestimate rainfall between 1 mm and 15 mm. This result is consistent with recent findings of Diallo [79]. The cross-validation of the GR4J model with observed data shows satisfactory results, which are consistent with the studies of Amoussou et al. on the Mono basin (Benin) as well as with those conducted by Le Lay [46] on the Donga basin (Benin), with Nash criteria superior to 0.70 in calibration and validation. Yet, the graphic of observed and simulated hydrographs on calibration and validation indicates that the GR4J model overestimates low flows while underestimating high flows. The two sets of rainfall data collected over the 1998–2004 simulation period reproduce in a quite satisfactory way the shape of the observed hydrographs with Nash criteria of 0.88 and 0.80 for observed rainfall and the TRMM rainfall, respectively. If we focus on the characteristic flow rates, we notice that the simulation of observed high flows (MADF, CFF_10d, CFF_20d and CF3) by TRMM rainfall is worthwhile. For these different variables, there is a consistency between observed values and simulations carried out with satellite rainfall and ground rainfall. However, the differences between simulations and observations become important for flows below the median (CF9, CLF_20d, CLF_10d and MDF). These differences can be explained by the fact that modeling low flows is more complex than modeling high flows, because the low flow process is less linear than that for high flows [80]. Memory effects are also another driving factor [80]. Moreover, the choices that are made when optimizing the model’s parameters, especially when setting out the objective function, can also have a huge negative impact on the simulation of various flow categories [81]. Gupta et al. [82] have shown in this regard that traditional criteria in least squares often induce under-estimation of the variance of flow rates, and this can lead to a frequent over-estimation of low flows.
This study supports the conclusion drawn by previous studies [38,42,62,83], which show that satellite rainfall provides valuable information for the knowledge and management of water resources. However, we should not underestimate the limits of satellites in simulating runoffs in some circumstances. Indeed, as already mentioned in the Introduction of this study, Stisen and Sandholt [43], using TRMM 3B46 v6 as an input to the MIKE SHE distributed hydrological model, did not come to satisfactory findings for the same Bafing gauging station in Bafing Makana. These inconclusive findings are driven by many factors: (i) the observed series that were used to calibrate, validate and simulate the model were too short (1991–1996 for the calibration, 1987–1990 for the validation and 2003–2005 for the simulation); according to Ardoin-Bardin [16], longer periods include a much higher variability of hydrological phenomenon and are therefore more representative of the set of situations than can be potentially experienced by the different basins; on the contrary, shorter periods can be mostly characterized by more extreme conditions over the considered period; (ii) another factor is that the implementation of the distributed models is a complex task and requires a wide range of parameters for which there is generally no observed series in the Senegal River’s watershed. As a result, we have no other choice, but to transpose parameters, and this can lead to many errors when conducting simulations.
Although this study provides interesting results for managers of water resources, it is noted that GR4J presents some weakness to simulate base flows because it does not fully account for groundwater and groundwater-surface flow links [63]. It simulates streamflow coming from both surface and groundwater sources. As mentioned by Fabre et al., other models that properly account for surface water and ground water-interactions exist (e.g., Pulido-Velazquez et al. [84,85]). However, their application at the scale of the upper Senegal River basin is difficult due to the complexity of the hydrogeological context, as well as the scarcity of hydrogeological data. However, in recent years, new soft computing techniques have been developed to improve the methods used in hydrologic engineering (modeling, forecasting, etc.). Wu et al. [86] used moving average, singular spectrum analysis and wavelet multi-resolution analysis and coupled them with an artificial neural network to improve the estimate of daily flows. Chen et al. [87] investigated Auto-Regressive Moving Average (ARMA) based on Ensemble Empirical Mode Decomposition (EEMD) to improve the forecasting accuracy of annual runoff time series. Several other authors used singular spectrum analysis and a hybrid neuron network for flow forecasting and prediction [86,88,89]. It is hoped that future research efforts will focus in these directions to explore the application of these different methods to see if they can bring added value in the simulation of flows, particularly low flows.
Furthermore, it would be interesting to carry out some tests on the efficiency of TRMM precipitation on other tributaries of the Senegal River (Bakoye, Faleme), as well as on the Gambia and Casamance Rivers’ watersheds, which, along with the Senegal River, constitute Senegal’s main hydro-systems, because Thiemig et al. [28] showed that the quality of satellite rainfall is not homogeneous, since it varies according to climatic and topographic conditions. Besides, it would be useful to carry out some tests on the capacity of other satellites data to simulate runoff in order to make comparison between them. For the purpose of this study, the GR4J model has been calibrated and then validated with observed data, assuming they constitute the reference data. However, some authors [30,90] have shown that ground data are less accurate than those collected via satellites. In this regard, there are several studies suggesting that the cross-validation of the hydrological model should be carried out based on satellite data [28,91,92,93]. It would be interesting to do so. However, one of the major obstacles to use the TRMM data is its short time series.

Acknowledgments

This study was funded by the University Gaston Berger through a study trip to HydroSciences Montpellier. The authors also wish to thank the anonymous reviewers and the academic editor for their suggestions, which resulted in the improvement of the manuscript.

Author Contributions

Ansoumana Bodian and Alain Dezetter designed the study, developed the methodology and wrote the manuscript. Ansoumana Bodian collected the data and conducted the computer analysis with Alain Dezetter, while Abdoulaye Deme collected and analyzed TRMM data, and Lamine Diop readied the manuscript.

Conflicts of Interest

The authors declare no conflict of interest.

Abbreviations

The following abbreviations are used in this manuscript:
TRMMTropical Rainfall Measuring Mission
PERSIANNPrecipitation Estimation from Remotely-Sensed Information using Artificial Neural Networks
RTReal Time
CMORPHClimate Prediction Center Morphing method
GSMaPGlobal Satellite Mapping of Precipitation
GCPC-1DDGlobal Precipitation Climatology Project One Degree Daily estimate
RFE2African Rainfall Estimate
EPSATEstimation des Precipitation par SATellite
AMMA-CATCHAfrican Monsoon Multidisciplinary Analysis-Couplage Atmosphere Tropicale Cycle Hydrologique
CPC/FEWSClimate Prediction Center/ Famine Early Warning System
GR4JModèle du Génie Rural (Agricultural Engineering Model) à 4 paramètres Journalier (4 Daily parameters)
GR2MModèle du Génie Rural (Agricultural Engineering Model) à 2 paramètres Mensuel (2 Monthly parameters)
NASANational Aeronautics and Space Administration
OMVSOrganisation pour la Mise en Valeur du fleuve Sénégal (Organization for the Development of the Senegal River)

References

  1. Carbonnel, J.P.; Hubert, P. Sur la sécheresse au Sahel d’Afrique de l’Ouest. Une rupture climatique dans les séries pluviométriques du Burkina-Faso (ex Haute-Volta). C.R. Acad. Sci., t. 301; Série II n°13; Paris, France, 1985; pp. 941–944. (In French) [Google Scholar]
  2. Nicholson, S.E. The spatial coherence of African rainfall anomalies: Interhemispheric teleconnections. J. Clim. Appl. Meteor. 1986, 25, 1365–1381. [Google Scholar] [CrossRef]
  3. Hubert, P.; Carbonnel, J.P.; Chaouche, A. Segmentation des séries hydrométéorologiques; application à des séries de précipitations et de débits de l’Afrique de l’Ouest. J. Hydrol. 1988, 110, 349–367. (In French) [Google Scholar] [CrossRef]
  4. Olivry, J.C.; Bricquet, J.P.; Bamba, F.; Diarra, M. Le régime hydrologique du Niger supérieur et le déficit des deux dernières décennies. Available online: http://horizon.documentation.ird.fr/exldoc/pleins_textes/doc34–06/41211.pdf (accessed on 27 January 2016). (In French)
  5. Servat, E.; Paturel, J.E.; Lubes-Niel, H.; Kouamé, B.; Masson, J.M.; Travaglio, M.; Marieu, B. De différents aspects de la variabilité de la pluviométrie en Afrique de l’Ouest et Centra lenon sahélienne. Rev. Sci. l’Eau 1999, 12, 363–387. (In French) [Google Scholar] [CrossRef]
  6. Paturel, J.E.; Servat, E.; Delattre, M.O.; Lubès-Niel, H. Analyse de séries pluviométriques de longue durée en Afrique de l’Ouest et Centrale non sahélienne dans un contexte de variabilité climatique. Hydrol. Sci. J. 1998, 43, 937–946. (In French) [Google Scholar] [CrossRef]
  7. Nicholson, S.E.; Some, B.; Kone, B. An Analysis of Recent Rainfall Conditions in West Africa, Including the Rainy Seasons of the 1997 El Niño and the 1998 La Niña Years. J. Clim. 2000, 13, 2628–2640. [Google Scholar] [CrossRef]
  8. Mahé, G.; Paturel, J.E. 1896–2006 Sahelian annual rainfall variability and runoff increase of Sahelian Rivers. C.R. Geosci. 2009, 341, 538–546. [Google Scholar] [CrossRef]
  9. Hubert, P.; Bader, J.C.; Bendjoudi, H. Un siècle de débits annuels du fleuve Sénégal. J. Sci. Hydrol. 2007, 52, 68–73. (In French) [Google Scholar] [CrossRef]
  10. Abrate, T.; Hubert, P.; Sighomnou, D. A study on hydrological series of the Niger River. Hydrol. Sci. J. 2013, 58, 271–279. [Google Scholar] [CrossRef]
  11. FAOSTAT. FAO Statistical Service. United Nations Food and Agriculture Organization, 2012. Available online: http://faostat.fao.org/site/291/default.aspx (accessed on 25 January2015).
  12. Charnay, B. Pour une gestion intégrée des ressources en eau sur un territoire de montagne. Le cas du bassin versant du Giffre (Haute-Savoie). Thèse de Doctorat, Géographie présentée à l’Université de Savoie (E.D. SISEO), France, 2010. Available online: https://tel.archives-ouvertes.fr/tel-00472979/ (accessed on 30 March 2016). [Google Scholar]
  13. Global Water Partnership; International Network of Basin Organization. A Handbook for Integrated Water Resources Management in Basins; Elanders: Stockholm, Sweden, 2009; p. 112. [Google Scholar]
  14. Lasserre, F.; Dexcroix, L. La gestion intégrée des ressources en eau par bassin: Au-delà de la rhétorique. In Eaux et Territoires: Tensions, Coopérations et Géopolitique de l’eau; Harmattan: Paris, France, 2003; pp. 221–239. (In French) [Google Scholar]
  15. Bodian, A.; Dezetter, A.; Dacosta, H. Rainfall-Runoff Modelling of Water Resources in the Upper Senegal River Basin. Int. J. Water Resour. Dev. 2015. [Google Scholar] [CrossRef]
  16. Ardoin-Bardin, S. Variabilité hydro-climatique et impacts sur les ressources en eau de grands bassins hydrographiques en zone soudano-sahélien. Thèse de doctorat, Université de Montpellier II, Montpellier, Hérault, France, 2004. [Google Scholar]
  17. Dezetter, A.; Paturel, J.-E.; Ruelland, D.; Ardoin-Bardin, S.; Ferry, L.; Mahé, G.; Dieulin, C.; Servat, E. Modélisation semi-spatialisée des ressources en eau du fleuve Niger à Koulikoro. Prise en compte des variabilités spatio-temporelles. In Proceedings of the 13th IWRA World Water Congress, Montpelier, France, 1–4 September 2008; Available online: www.iwra.org/congress/2008/resource/authors/ abs728_ article.pdf (accessed on 12 December 2014). (In French)
  18. Ardoin-Bardin, S.; Dezetter, A.; Servat, E.; Paturel, J.E.; Mahé, G.; Niel, H.; Dieulin, C. Using general circulation model outputs to assess impacts of climate change on runoff for large hydrological catchments in West Africa. Hydrol. Sci. J. 2009, 54, 77–89. (In French) [Google Scholar] [CrossRef]
  19. Cornelissen, T.; Diekkrüger, B.; Giertz, S. A comparison of hydrological models for assessing the impact of land use and climate change on discharge in a tropical catchment. J. Hydrol. 2013, 498, 221–236. [Google Scholar] [CrossRef]
  20. Bop, M.; Amadou, A.; Seidou, O.; Kébé, C.M.F.; Ndione, J.A.; Sambou, S.; Sanda, I.S. Modeling the Hydrological Dynamic of the Breeding Water Bodies in Barkedji’s Zone. J. Water Resour. Prot. 2014, 6, 741–755. [Google Scholar] [CrossRef]
  21. Angelina, A.; Gado, D.A.; Seidou, O.; Seidou, S.I.; Ketvara, S. Changes to flow regime on the Niger River at Koulikoro under a changing climate. Hydrol. Sci. J. 2014. [Google Scholar] [CrossRef]
  22. Panthou, G.; Vischel, T.; Lebel, T. Recent trends in the regime of extreme rainfall in the Central Sahel. Int. J. Clim. 2014. [Google Scholar] [CrossRef]
  23. Bodian, A.; Ndiaye, O.; Dacosta, H. Evolution des caractéristiques des pluies journalières dans le bassin versant du fleuve Sénégal: Avant et après rupture. J. des Sci. Hydrol. 2016. (In French) [Google Scholar] [CrossRef]
  24. Nicholson, S.E.; Some, B.; McCollum, J.; Nelkin, E.; Klotter, D.; Berte, Y.; Diallo, B.M.; Gaye, I.; Kpabeba, G.; Ndiaye, O.; et al. Validation of TRMM and other rainfall estimates with a high-density gauge dataset for West Africa. Part II: Validation of TRMM Rainfall Products. J. Appl. Meteor. 2003, 42, 1355–1368. [Google Scholar] [CrossRef]
  25. Hughes, D.A. An evaluation of the potential use of satellite rainfall data for input to water resource estimation models in southern Africa. In Climate Variability and Change-Hydrological Impacts, Proceedings of the Fifth FRIEND World Conference, Havana, Cuba, 27 November–1 December 2006.
  26. Stisen, S.; Jensen, K.H.; Sandholt, I.; Grimes, D.I.F. A remote sensing driven distributed hydrological model of the Senegal River basin. J. Hydrol. 2008, 354, 131–148. [Google Scholar] [CrossRef]
  27. Dezetter, A.; Fabre, J.; Ruelland, D.; Servat, E. Selecting an optimal climatic dataset for integrated modelling of the Ebro hydrosystem. In Hydrology in a Changing World: Environmental and Human Dimensions Proceedings of FRIEND-Water; IAHS Press: Montpellier, France, 2014. [Google Scholar]
  28. Thiemig, V.; Rojas, R.; Bigiarini, M.Z.; de Roo, A. Hydrological evaluation of satellite-based rainfall estimates over the Volta and Baro-Akobo Basin. J. Hydrol. 2013, 499, 324–338. [Google Scholar] [CrossRef]
  29. Chen, C.; Yu, Z.; Li, L.; Yang, C. Adaptability Evaluation of TRMM Satellite Rainfall and Its Application in the Dongjiang River Basin. Procedia Environ. Sci. 2011, 10 Part A, 396–402. [Google Scholar] [CrossRef]
  30. Ali, A.; Lebel, T.; Amani, A. Estimation of rainfall in the Sahel. Part 1: Error function. J. Appl. Meteorol. 2005, 44, 1691–1706. [Google Scholar] [CrossRef]
  31. Ali, A.; Amani, A.; Diedhiou, A.; Lebel, T. Estimation of rainfall in the Sahel. Part 2: Evaluation of rain gauge networks in the CILSS countries and objective intercomparison of rainfall products. J. Appl. Meteorol. 2005, 44, 1707–1722. [Google Scholar] [CrossRef]
  32. Su, F.; Hong, Y.; Lettenmaier, D.P. Evaluation of TRMM Multisatellite Precipitation Analysis (TMPA) and Its Utility in Hydrologic Prediction in the La Plata Basin. J. Hydrometeorolog. 2007. [Google Scholar] [CrossRef]
  33. Roca, R.; Chambon, P.; Jobard, I.; Kirstetter, P.E.; Gosset, M.; Bergès, J.C. Comparing Satellite and Surface Rainfall Products over West Africa at Meteorologically Relevant Scales during the AMMA campaign using error estimates. J. Appl. Meteorol. Climatol. 2010, 49, 715–731. [Google Scholar] [CrossRef]
  34. Almazroui, M. Calibration of TRMM rainfall climatology over Saudi Arabia during 1998–2009. Atmos. Res. 2011, 99, 400–414. [Google Scholar] [CrossRef]
  35. Jobard, I.; Chopin, F.; Bergès, J.C.; Roca, R. An intercomparison of 10-day precipitation satellite products during West African monsoon. Int. J. Remote Sens. 2001, 32. [Google Scholar] [CrossRef]
  36. Kisrtetter, P.E.; Viltard, N.; Gosset, M. An error model for instantaneous satellite rainfall estimates: Evaluation of BRAIN-TMI over West Africa. Q. J. R. Meteorol. Soc. 2012, 139, 894–911. [Google Scholar] [CrossRef]
  37. Kacimi, S.; Viltard, N.; Kisrtetter, P.E. A new methodology for rain identification from passive microwave data in Tropics using neuronal networks. Q. J. R. Meteorol. Soc. 2013, 139, 919–922. [Google Scholar] [CrossRef]
  38. Thiemig, V.; Rojas, R.; Zambrano-Bigiarini, M.; Levizzani, V.; De Roo, A. Validation of Satellite-Based Precipitation Products over Sparsely Gauged African River Basins. J. Hydrom. 2012, 13, 1760–1783. [Google Scholar] [CrossRef]
  39. Gosset, M.; Viarre, J.; Quantin, G.; Alcoba, M. Evaluation of several rainfall products used for hydrological applications over West Africa using two high-resolution gauge networks. Q. J. R. Meteorol. Soc. 2013, 139, 923–940. [Google Scholar] [CrossRef]
  40. Diem, J.E.; Hartter, J.; Ryan, S.J.; Palace, M.W. Validation of Satellite Rainfall Products for Western Uganda. J. Hydrom. 2014, 15, 2030–2038. [Google Scholar] [CrossRef]
  41. Roca, R.; Bergès, J.C.; Brogniez, H.; Capderou, M.; Chambon, P.; Chomette, O.; Cloché, S.; Fiolleau, T.; Jobard, I.; Lémond, J.; et al. On the Water and energy cycle in the Tropics. C. R. Geosci. 2010. [Google Scholar] [CrossRef]
  42. Casse, C.; Gosset, M.; Peugeot, C.; Pedinotti, V.; Boone, A.; Tanimoun, B.A.; Decharme, B. Potential of satellite rainfall products to predict Niger River flood events in Niamey. Atmos. Res. 2015, 163, 162–176. [Google Scholar] [CrossRef]
  43. Stisen, S.; Sandholt, I. Evaluation of remote-sensing-based rainfall products through predictive capability in hydrological runoff modeling. Hydrol. Process. 2010, 24, 879–891. [Google Scholar] [CrossRef]
  44. Bader, J.C.; Lamagat, J.P.; Guiguen, N. Gestion du barrage de Manantali sur le fleuve Sénégal: Analyse quantitative d’un conflit d’objectifs. Hydrol. Sci. J. 2003, 48, 525–538. [Google Scholar] [CrossRef]
  45. Amoussou, E.; Tramblay, Y.; Totin, H.S.V.; Mahé, G.; Camberlin, P. Dynamique et modélisation des crues dans le bassin du Mono à Nangbéto (Togo/Bénin). Hydrol. Sci. J. 2014. (In French) [Google Scholar] [CrossRef]
  46. Le Lay, M. Modélisation hydrologique dans un contexte de variabilité hydro-climatique. Une approche comparative pour l’étude du cycle hydrologique à méso-échelle au Bénin. Thèse de Doctorat, Institut National Polytechnique de Grenoble, Laboratoire d’études des Transferts en Hydrologie et Environnement, Grenoble, France, 2006. [Google Scholar]
  47. Bodian, A.; Dezetter, A.; Dacosta, H. Apport de la modélisation hydrologique pour la connaissance de la ressource en eau: Application au haut bassin du fleuve Sénégal. Climatologie 2012, 9, 109–125. (In French) [Google Scholar]
  48. Bodian, A.; Dacosta, H.; Dezetter, A. Analyse des débits de crues et d’étiages dans le bassin versant du fleuve Sénégal en amont du barrage de Manantali. Revue du LACEEDE «Climat et développement» 2013, 15, 46–56. (In French) [Google Scholar]
  49. CSE. Etude d’impacts des feux de brousses sur l’eau, les sols et la végétation dans la partie guinéenne du bassin du fleuve Sénégal. OMVS Report, Dakar, 2006. (In French) [Google Scholar]
  50. Kane, H.; Diallo, A. Etude portant sur l’évaluation de l’état de l’environnement des ressources naturelles et des ressources en eau dans la partie guinéenne du bassin du fleuve Sénégal, en se servant du système d’indicateurs de l’Observatoire de l’environnement de l’OMVS. OMVS Report, Dakar, 2005. (In French) [Google Scholar]
  51. Rochette, C. Lebassin du Fleuve Sénégal. Monographies Hydrologiques. Edition Orstom; Office de la recherche scientifique et technique outre-mer: Paris, France, 1974. (In French) [Google Scholar]
  52. Farr, T.G.; Kobrick, M. Shuttle Radar Topography Mission produces a wealth of data. Amer. Geophys. Union Eos. 2000, 81, 583–585. [Google Scholar] [CrossRef]
  53. Werner, M. Shuttle Radar Topography Mission (SRTM), Mission overview. J. Telecom. (Frequenz) 2001, 55, 75–79. [Google Scholar] [CrossRef]
  54. Dione, O. Evolution Climatique Récente et Dynamique Fluviale dans les Hauts Bassins des Fleuves Sénégal et Gambie. Thèse de doctorat, Université Lyon 3 Jean Moulin, Lyon, France, 1996. [Google Scholar]
  55. Bodian, A.; Dacosta, H.; Dezetter, A. Caractérisation spatio-temporelle du régime pluviométrique du haut bassin du fleuve Sénégal dans un contexte de variabilité climatique. Physio-Géo. 2011, V, 116–133. (In French) [Google Scholar] [CrossRef]
  56. Daily TRMM and Others Rainfall Estimate (3B42 V7 derived) V7. Available online: http://catalog.data.gov/dataset/daily-trmm-and-others-rainfall-estimate-3b42-v7-derived-v7 (accessed on 5 March 2014).
  57. Schneider, U. The Global Precipitation Climatology Project 5GPCP) Combined Precipitation Dataset. Bull. Am. Meteorol. Soc. 1995, 78, 5–20. [Google Scholar]
  58. Huffman, G.J.; Bolvin, D.T.; Nelkin, E.J.; Wolff, D.B.; Adler, R.F.; Gu, G.; Hong, Y.; Bowman, K.P.; Stocker, E.F. The TRMM Multisatellite Precipitation Analysis (TMPA): Quasi-Global, Multiyear, Combined-Sensor Precipitation Estimates at Fine Scales. J. Hydrom. 2007, 8, 38–55. [Google Scholar] [CrossRef]
  59. Moazami, S.; Golian, S.; Kavianpour, M.R.; Hong, Y. Comparison of PERSIANN and V7 TRMM Multi-satellite Precipitation Analysis (TMPA) products with rain gauge data over Iran. Int. J. Remote Sens. 2013, 34, 8156–8171. [Google Scholar] [CrossRef]
  60. Perrin, C.; Michel, C.; Andreassian, V. Improvement of a parsimonious model for streamflow simulation. J. Hydrol. 2003, 279, 275–289. [Google Scholar] [CrossRef]
  61. Collet, L. Capacité à satisfaire la demande en eau sous contraintes climatique et anthropique sur un bassin versant méditerranéen. Thèse de doctorat, Université de MontpellierII:Montpellier, Hérault, France, 2013. [Google Scholar]
  62. Oudin, L.; Hervieu, F.; Michel, C.; Perrin, C.; Andréassian, V.; Anctil, F.; Loumagne, C. Which potential evapotranspiration input for a lumped rainfall–runoff model? Part 2—towards a simple and efficient potential evapotranspiration model for rainfall–runoff modelling. J. Hydrol. 2005, 303, 290–306. [Google Scholar] [CrossRef]
  63. Fabre, J.; Ruelland, D.; Dezetter, A.; Grouillet, B. Simulating past changes in the balance between water demand and availability and assessing their main drivers at the river basin scale. Hydrol. Earth Syst. Sci. 2015. [Google Scholar] [CrossRef]
  64. Ben Khediri, W.; Drogue, G. Quel est l’impact de l’échantillonnage spatial des précipitations et de l’évapotranspiration potentielle sur le pouvoir prédictif d’un modèle hydrologique empirique? Available online: http://lodel.irevues.inist.fr/climatologie/index.php?id=1095 (accessed on 11 April 2016). (In French)
  65. Collischonn, B.; Collischonn, W.; Tucci, C.E.M. Daily hydrological modeling in the Amazon basin using TRMM rainfall estimates. J. Hydrol. 2008, 360, 207–216. [Google Scholar] [CrossRef]
  66. Kouassi, A.M.; N’guessan Bi, T.M.; Kouame, K.F.; Kouame, K.A.; Okeringri, J.C.; Biemi, J. Application de la méthode des simulations croisées à l’analyse des tendances dans la relation pluie-débit à partir du modèle GR2M: Cas du basin versant du N’zi-Bandama (Côte d’Ivoire). C.R. Géosci. 2012, 344, 288–296. (In French) [Google Scholar] [CrossRef]
  67. Ruelland, D.; Ardoin-Bardin, S.; Collet, L.; Roucou, P. Simulating future trends in hydrological regime of a large Sudano-Sahelian catchment under climate change. J. Hydrol. 2012, 424–425, 207–216. [Google Scholar] [CrossRef]
  68. Rosenbrock, H.H. An automatic method for finding the greatest or least value of a function. Comput. J. 1960, 3, 175–184. [Google Scholar] [CrossRef]
  69. Nelder, J.A.; Mead, R.A. Simplex method for function minimization. Comput. J. 1965, 7, 308–313. [Google Scholar] [CrossRef]
  70. Nash, J.E.; Sutcliffe, J.V. River flow forecasting through conceptual models. Part I—A discussion of principles. J. Hydrol. 1970, 10, 282–290. [Google Scholar] [CrossRef]
  71. Lin, J.-Y.; Cheng, C.-T.; Chau, K.-W. Using support vector machines for long-term discharge prediction. Hydrol. Sci. J. 2006, 51, 599–612. [Google Scholar] [CrossRef]
  72. Santhi, C.; Arnold, J.-G.; Williams, J.-R.; Dugas, W.-A.; Srinivasan, R.; Hauck, L.M. Validation of the swat model on a large river basin with point and nonpoint sources. J. Am. Water Res. Assoc. 2001, 37, 1169–1188. [Google Scholar] [CrossRef]
  73. Wang, W.-C.; Chau, K.-W.; Cheng, C.-T.; Qiu, L. A comparison of performance of several artificial intelligence methods for forecasting monthly discharge time series. J. Hydrol. 2009, 347, 294–306. [Google Scholar]
  74. Legates, D.-R.; McCabe, G.-J. Evaluating the use of “goodness-of-fit” measures in hydrologic and hydroclimatic model validation. Water Resour. Res. 1999, 35, 233–241. [Google Scholar] [CrossRef]
  75. Moriasi, D.-N.; Arnold, J.-G.; Van Liew, M.-W.; Bingner, R.-L.; Harmel, R.-D.; Veith, T.-L. Model evaluation guidelines for systematic quantification of accuracy in watershed simulations. Trans. ASABE 2007, 50, 885–900. [Google Scholar] [CrossRef]
  76. Hingray, B.; Picouet, C.; Musy, A. Hydrologie 2, une science pour l’ingénieur; Presses Polytechniques et Universitaire Romande (PPUR): Lausanne, Suisse, 2009; p. 600. (In French) [Google Scholar]
  77. Vauchel, P. Hydraccess: Base de Données Hydrométriques Sous Access 2000; IRD: Dakar, Senegal, 2000. (In French) [Google Scholar]
  78. Mahé, G. Variabilité pluie-débit en Afrique de l’Ouest et Centrale au 20ème siècle : changements hydro-climatiques, occupation du sol et modélisation hydrologique; Université de Montpellier II: Montpellier, France, 2006; p. 160. (In French) [Google Scholar]
  79. Diallo, I. Caractérisation du cycle de l’eau dans le système de mousson de l’Afrique de l’Ouest et son évolution dans un contexte de changement climatique. Thèse de doctorat, Université Cheikh Anta Diop, Dakar, Senegal, 2015. [Google Scholar]
  80. Pushpalatha, R.; Perrin, C.; Le Moine, N.; Mathevet, T.; Andréassian, V. A downward structural sensitivity analysis of hydrological models to improve low-flow simulation. J. Hydrol. 2011, 411, 66–76. [Google Scholar] [CrossRef]
  81. Pushpalatha, R.; Perrin, C.; Le Moine, N.; Andréassian, V. A review of efficiency criteria suitable for evaluating low-flow simulations. J. Hydrol. 2012, 420–421, 171–182. [Google Scholar] [CrossRef]
  82. Gupta, H.V.; Kling, H.; Yilmaz, K.K.; Martinez, G.F. Decomposition of the mean squared error and NSE performance criteria: Implications for improving hydrological modelling. J. Hydrol. 2009, 377, 80–91. [Google Scholar] [CrossRef]
  83. Pulido-Velazquez, D.; Sahuquillo, A.; Andreu, J.; Pulido-Velazquez, M. An efficient conceptual model to simulate water body-aquifer interaction in Conjunctive Use Management Model. Water Resour. Res. 2007. [Google Scholar] [CrossRef]
  84. Pulido-Velazquez, D.; Sahuquillo, A.; Andreu, J. A conceptual-numerical model to simulate hydraulic head in aquifers that are hydraulically connected to surface water bodies. Hydrol. Process. 2012, 26, 1435–1448. [Google Scholar] [CrossRef]
  85. Wu, C.L.; Chau, K.W.; Li, Y.S. Methods to improve neural network performance in daily flows prediction. J. Hydrol. 2009, 372, 80–93. [Google Scholar] [CrossRef]
  86. Chen, X.-Y.; Chau, K.-W.; Busari, A.O. A comparative study of population-based optimization algorithms for downstream river flow forecasting by a hybrid neural network model. Engin. Appl. Artif. Intell. 2015, 46, 258–268. [Google Scholar]
  87. Chau, K.-W.; Wu, C.-L. A Hybrid Model Coupled with Singular Spectrum Analysis for Daily Rainfall Prediction. J. Hydroinformat. 2010, 12, 458–473. [Google Scholar]
  88. Wang, W.-C.; Chau, K.-W.; Xu, D.-M.; Chen, X.-Y. Improving forecasting accuracy of annual runoff time series using ARIMA based on EEMD decomposition. Water Resour. Manag. 2015, 29, 2655–2675. [Google Scholar] [CrossRef]
  89. Li, Z.; Yang, D.; Gao, B.; Jiao, Y.; Hong, Y.; Xu, T. Multiscale Hydrologic Applications of the Latest Satellite Precipitation Products in the Yangtze River Basin using a Distributed Hydrologic Model. J. Hydrometeorol. 2015. [Google Scholar] [CrossRef]
  90. Anagnostou, E.N.; Maggioni, V.; Nikolopoulos, E.I.; Meskele, T.; Hossain, F.; Papadopoulos, A. Benchmarking High-Resolution Global Satellite Rainfall Products to Radar and Rain-Gauge Rainfall Estimates. IEEE Trans. Geosci. Remote Sens. 2010, 48, 1667–1683. [Google Scholar] [CrossRef]
  91. Yilmaz, K.K.; Hogue, T.S.; Hsu, K.; Sorooshian, S.; Gupta, H.V.; Wagener, T. Intercomparison of rain gauge, radar, and satellite-based precipitation estimates with emphasis on hydrologic forecasting. J. Hydrom. 2005, 6, 497–517. [Google Scholar] [CrossRef]
  92. Yong, B.; Hong, Y.; Ren, L.L.; Gourley, J.J.; Huffman, G.J.; Chen, X.; Wang, W.; Khan, S.I. Assessment of evolving TRMM-based multisatellite real-time precipitation estimation methods and their impacts on hydrologic prediction in a high latitude basin. J. Geophys. Res. 2012, 117, D09108. [Google Scholar] [CrossRef]
  93. Capdevila, A.S.; Valdes, J.B.; Stakhiv, E.Z. Water Management Applications for Satellite Precipitation Products: Synthesis and Recommendations. J. Am. Water Resour. Assoc. (JAWRA) 2014, 50, 509–525. [Google Scholar] [CrossRef]
Figure 1. Location of the Senegal River upper basin, climate and hydrometric stations.
Hydrology 03 00015 g001
Figure 2. Conceptual scheme of the GR4J model [60]. UH, unit hydrograph.
Hydrology 03 00015 g002
Figure 3. Disruption in hydro-climate series: (a) standard rainfall and flow anomalies; (b) seasonal cycles of pre-/post-disruption runoffs.
Hydrology 03 00015 g003
Figure 4. Comparison between mean observed and TRMM rainfalls: (a) cumulated frequency; (b) number of rainy days; (c) monthly rainfalls; (d) annual rainfall.
Hydrology 03 00015 g004
Figure 5. Cross-calibration-validation of the hydrological model (monthly values were calculated from the daily data).
Hydrology 03 00015 g005
Figure 6. Observed and calculated discharge.
Hydrology 03 00015 g006
Figure 7. Comparison of simulated characteristic flow rates with ground and TRMM-based rainfalls against observed data.
Hydrology 03 00015 g007
Table 1. List of the chosen rainfall stations: Mean annual rainfalls from observed values; % gap = percentage of days without measurement.
StationsElevation (m)Start of RecordEnd of Record% GapsMean Annual Rainfall (mm)
Bafing Makana2391 January 19631 September 199737.51190
Dabola4381 January 19331 October 200114.61514
Dinguiraye49016 January 192216 December 200543.71375
Faléa4551 March 195631 December 200330.41433
Labé102516 January 192316 December 20060.71626
Mali146416 January 193116 December 200526.21625
Mamou7822 January 192131 December 20081.91881
Siguiri3622 January 192230 June 20071.71272
Tougué8616 January 192316 August 200422.31559
Kita3281 January 193130 September 20091.51007
Guene-Gore2401 May 195631 December 200226.81246
Sagabari3321 July 19591 September 199718.81151
Table 2. Inventory of available temperature data.
StationsElevation (m)Start of RecordEnd of Record% GapsMean Annual Temperature (°C)
Labé10255 January 193931 December 20042.222
Mamou7821 January 192431 December 20062.423
Siguiri3621 August 194328 January 20055.627
Kita3281 January 195031 December 20082.328
Kénéba1361 January 195031 December 20044.129
Table 3. The hydrological calibration criterion.
CriterionFormulaScaleIdeal Value
F agg ( 1 NSE ) + | VE | + VE m ,   + 0
NSE 1 i = 1 N ( Q sim , y , i Q obs , y , i ) 2 i = 1 N ( Q obs , i Q obs ¯ ) 2 ,   1 1
VE y = 1 N V sim , y y = 1 N V obs , y y = 1 M V obs , y ,   + 0
VE m 1 N y = 1 N | V sim , y V obs , y | V obs , y ,   + 0
Qobs,i is the observed flow at time step i; Qcalc,i is the simulated flow at time step i; Q o b s ¯ is the average flow observed; N is the total number of time steps of the simulation period; NSE is the Nash Sutcliffe coefficient; Fagg is the multi-criteria aggregating function; VE is the cumulative volume error; VEm is the yearly mean volume error; Vobs,i is the observed volume at time step i; Vsim,i is the simulated volume at time step i.
Table 4. Characteristics flow rates used.
AcronymDescription
MADFMAximum Daily Flow
CFF_10dCharacteristic Flood Flow on a 10-day period
CFF_20dCharacteristic Flood Flow on a 20-day period
CF3Characteristic Flow exceeded 3 months in the year
MedianFlows exceeded six months in the year
CF9Characteristic Flow exceeded 9 months in the year
CLF_20dCharacteristic Low Flow on a 20-day period
CLF_10dCharacteristic Low Flow on a 10-day period
MDFMinimum Daily Flow

