Article

Determination of Watershed Infiltration and Erosion Parameters from Field Rainfall Simulation Analyses

Hydrologic Sciences and Biological & Agricultural Engineering, UC Davis, Davis, CA 95616, USA
Hydrology 2016, 3(3), 23; https://doi.org/10.3390/hydrology3030023
Submission received: 5 April 2016 / Revised: 26 May 2016 / Accepted: 27 May 2016 / Published: 28 June 2016

Abstract

:
Realistic modeling of infiltration, runoff and erosion processes from watersheds requires estimation of the effective hydraulic conductivity (Km) of the hillslope soils and how it varies with soil tilth, depth and cover conditions. Field rainfall simulation (RS) plot studies provide an opportunity to assess the surface soil hydraulic and erodibility conditions, but a standardized interpretation and comparison of results of this kind from a wide variety of test conditions has been difficult. Here, we develop solutions to the combined set of time-to-ponding/runoff and Green– Ampt infiltration equations to determine Km values from RS test plot results and compare them to the simpler calculation of steady rain minus runoff rates. Relating soil detachment rates to stream power, we also examine the determination of “erodibility” as the ratio thereof. Using data from over 400 RS plot studies across the Lake Tahoe Basin area that employ a wide range of rain rates across a range of soil slopes and conditions, we find that the Km values can be determined from the combined infiltration equation for ~80% of the plot data and that the laminar flow form of stream power best described a constant “erodibility” across a range of volcanic skirun soil conditions. Moreover, definition of stream power based on laminar flows obviates the need for assumption of an arbitrary Mannings “n” value and the restriction to mild slopes (<10%). The infiltration equation based Km values, though more variable, were on average equivalent to that determined from the simpler calculation of steady rain minus steady runoff rates from the RS plots. However, these Km values were much smaller than those determined from other field test methods. Finally, we compare RS plot results from use of different rainfall simulators in the basin and demonstrate that despite the varying configurations and rain intensities, similar erodibilities were determined across a range of infiltration and runoff rates using the laminar form of the stream power equation.

1. Introduction

Modeling watershed runoff and erosion processes realistically requires field determination or model calibration estimation of surface soil infiltration rates or effective hydraulic conductivities (Km) and erosion rates because they vary with soil cover/tilth/slope conditions, and seasonally with changing water contents. The field methods often used to measure in situ saturated or effective hydraulic conductivities (Ks or Km, respectively, where Km is some fraction of Ks) include surface (e.g., disk, single/double-ring infiltrometers, and rainfall simulators), or subsurface techniques (e.g., bore-hole methods). Indirect estimates of Km and erodibilities available from NRCS soil survey information that are typically derived from soil texture information are also more often used in modeling than field measured values due to the difficulty associated with the field measurements and their variability. While each measurement method may have particular advantages depending on the intended use of the data, surface methods enable measurement of actual conditions as affected by soil tilth and surface cover while also providing insights into the effectiveness of soil restoration methods in the field. However, they are not without complications associated with surface disturbance/roughness, type and configuration of surface cover, steep slope (double-ring methods require mild slopes), disk plate hydraulic contact and estimation from rainfall minus runoff rates using rainfall simulators. Similarly, subsurface measurement techniques or Km estimation from soil texture information may miss the effect of surface layers on infiltration storage or excess leading to runoff–erosion prediction failure.
Here, we focus on determination of Km and erodibilities from rainfall simulation (RS) methods in the field as these are not limited by surface conditions, slope or soil type. Following development of an integrated infiltration and time-to-ponding/runoff equation, we use infiltration and runoff data from over 425 RS plots in the Tahoe Basin, together with simultaneous measurements of saturated hydraulic conductivity, Ks, using bore-hole or mini-disc infiltrometers at selected sites to determine what estimation method of Km yields the most consistent results. Then we consider the erosion process and soil detachment data from disturbed skirun soils to investigate the relationship between soil detachment and stream power to determine what form (laminar or turbulent) of the stream power function is most appropriate to describe overland sheet flows typical in RS test and forest soils. Finally, we consider test plot results from three different rainfall simulators used at similar locations to demonstrate application of the equations for determination of Km and erodibilities associated with RS tests having a range of raindrop impact energies.

1.1. Brief Literature Review

Rainfall simulators (RSs) are essential tools for investigating the dynamic processes of infiltration, runoff and erosion under a variety of field conditions [1,2,3,4], and information from RS test plots can provide the infiltration/runoff parameterization required for watershed modeling. Though multiple RS designs for field application exist, no single RS design (including plot runoff frame installation) has emerged as a standard. Similarly, while in RS plot tests, typically, data about rainfall, runoff and erosion rates and time to runoff are collected from which infiltration rates, or Km and erodibilities are estimated, no standard RS data analysis methodology has evolved. Despite a number of years of research into the plant/cover effects on soil erosion [5,6,7,8,9,10,11,12], it remains difficult to understand erosion processes and mechanics due to the lack of sufficiently comparable data or results [8,13]. Moreover, the differences in soil properties, slope surface conditions and vegetation types in field experiments have tended to complicate interpretations of field measurements. It is difficult, therefore, to draw meaningful comparisons between RS plot data reported in different studies [2,3,4,14,15]. In addition, there are few, if any, actual comparisons of RS performance with respect to infiltration, erosion, or soil detachment rates. For example, Lascelles et al. [16] only considered the variability in drop sizes, distributions and energies from two different RSs and speculated on implications with respect to erosion, but did not offer comparison RS plot studies. Similarly, Kinnell [17,18] completed thorough reviews of the processes associated with raindrop impacted erosion and noted that both conceptual models and measurements fail in various respects to adequately characterize field observed erosion processes from bare soils. Concerns such as these have also arisen in the Tahoe Basin, because a variety of methods for measurement of infiltration and erosion rates have been deployed, but comparisons between results of different studies remain less than definitive.

1.2. Project Hypothesis & Objectives

Data from RS field plots can be used to assess the initiation time of runoff, an indication of surface conditions (though, admittedly, from perhaps unusually large rainfall rates, or associated durations), the subsurface infiltration characteristics through determination of the infiltrated volume after a RS test time, as well as soil detachment rates or “erodibilities”. In order to develop more widely usable information/data, standardized approaches to the RS plot setups and the subsequent data analyses are needed [2]; here we focus on the latter, using RS test data from 425 plots across the Lake Tahoe Basin. We hypothesize that there exists a physically consistent set of equations that relate infiltration and erosion data collected from different RS test plots to surface soil effective hydraulic conductivity and erodibility. The primary project objectives include: (a) develop the appropriate infiltration and erosion equations applicable to field RS plots, (b) evaluate the applicability of these equations to a large RS data set, and (c) use these equations to compare RS test plot results from three different field rainfall simulators having a range of rain drop energies and rainfall configurations to both demonstrate their applicability and determine whether differences in raindrop impact energy result in significantly different Km values or erodibilities for the Tahoe Basin soils.

1.3. Theory—Infiltration Equation Development

Several infiltration equations have been derived during the past few decades and the most often used in watershed modeling revolve around time-to-ponding estimates and the ponded infiltration Green–Ampt type square-wave wetting-front formulation, among others. In RS plot studies, the applied rainfall rates are generally large and for durations that exceed that of natural rainfall so as to achieve runoff after some acceptable elapsed time after rainfall initiation. As such, there are typically a few minutes during which the plot infiltration capacity exceeds that of the applied rainfall followed by shallow ponded infiltration. Ideally, the effective hydraulic conductivity that satisfies both the time-to-ponding and ponded infiltration equations would represent the self-consistent field value that then should apply in watershed modeling. We briefly define terms and develop these equations here, eventually coupling the ponding time and Green–Ampt–type equations to allow implicit determination of Km from the RS data outlined above.
Basic definitions from Grismer [19] include:
h e   =   h d   h c  
where hd = displacement pressure head (mm), and hc = capillary pressure head (mm)
S e = S S r S m S r     h e   λ
where S = saturation, Sr = residual saturation, Sm= maximum saturation associated with infiltration, and λ = pore-size distribution index.
And the Green–Ampt infiltration equation takes the form
I = Km(H + hf + zf)/zf
where I = infiltration rate (mm/hr),
  • Km = “natural saturated hydraulic conductivity” (mm/hr) ≈ 0.5Ks,
  • H= ponding depth (mm),
  • hf = wetting front capillary pressure head (mm), and
  • zf = wetting front depth (mm).
Combining the Green–Ampt Equation (3) with the continuity equation yields
t = 1 K m { V 𝜙 ( S m   S i ) ( H   +   h f ) ln [ 1 + V φ ( S m S i ) ( H + h f ) ] }
where V = volume infiltrated per unit area (mm).
The Green–Ampt equation above is readily modified to account for air resistance to wetting flow by using β to replace the 1 at the beginning of the RHS of Equation (4) and hf within the parentheses with Hc [19]. β and Hc are defined as follows
β = 1 μ w 1 S e d 2 f w / d S e 2 [ ( k r g / μ g ) + ( k r w / μ w ) ]   d S e
where μw and μg are the water and air viscosities, respectively, similalry krw and krg are the relative permeabilities of the porous media to water and air, respectively. Se is the effective saturation and fw is the fractional flow function of water, or the ratio of water flow to total (air and water) flowrate. For all practical purposes, β takes on a value between 1.2 and 1.3 for typical λ values between 2 and 3, an index range that covers loamy to sandy soils [19]. The wetting front driving head, Hc can be determined from
H c = h d 1 h e   f w h e 2   d h e
where he is defined in Equation (1). Again for all practical purposes, Hc takes on a value between 1.12 hd – 1.08 hd for λ between 2 and 3. Substituting Equations (5) and (6) in the Green–Ampt Equation (4) to correct for air resistance or counterflow during infiltration results in [19]
t = β K m { V 𝜙 ( S m   S i ) ( H   +   H c ) ln [ 1 + V φ ( S m S i ) ( H   +   H c ) ] }
Finally, the corresponding ‘time–to-ponding’ infiltration equation that accounts for air resistance or counterflow as well is given by
t p = φ ( S m S i ) ( 1 f w ) q o H c exp [ ( q o β K m 1 ) 1 1 ] }
where qo is the rainfall rate and fw is practically zero for ponded infiltration (see Morel-Seytoux [20] discussion linking the transition of rainfall rate controlled infiltration conditions to that for ponded infiltration).
With a relationship between hd and Km together with the time-to-ponding, infiltrated depth and times from RS plot data, Equations (7) and (8) can be solved simultaneously for Km (assuming that Km = 0.5 Ks) by solving Equation (8) for φ(Sm − Si) and letting fwi = 0. Using lab column data collected to date, Grismer [19] determined that for hd in meters, the semi-empirical theoretical relationship for permeability was k (μm2) ≈ 0.84/h
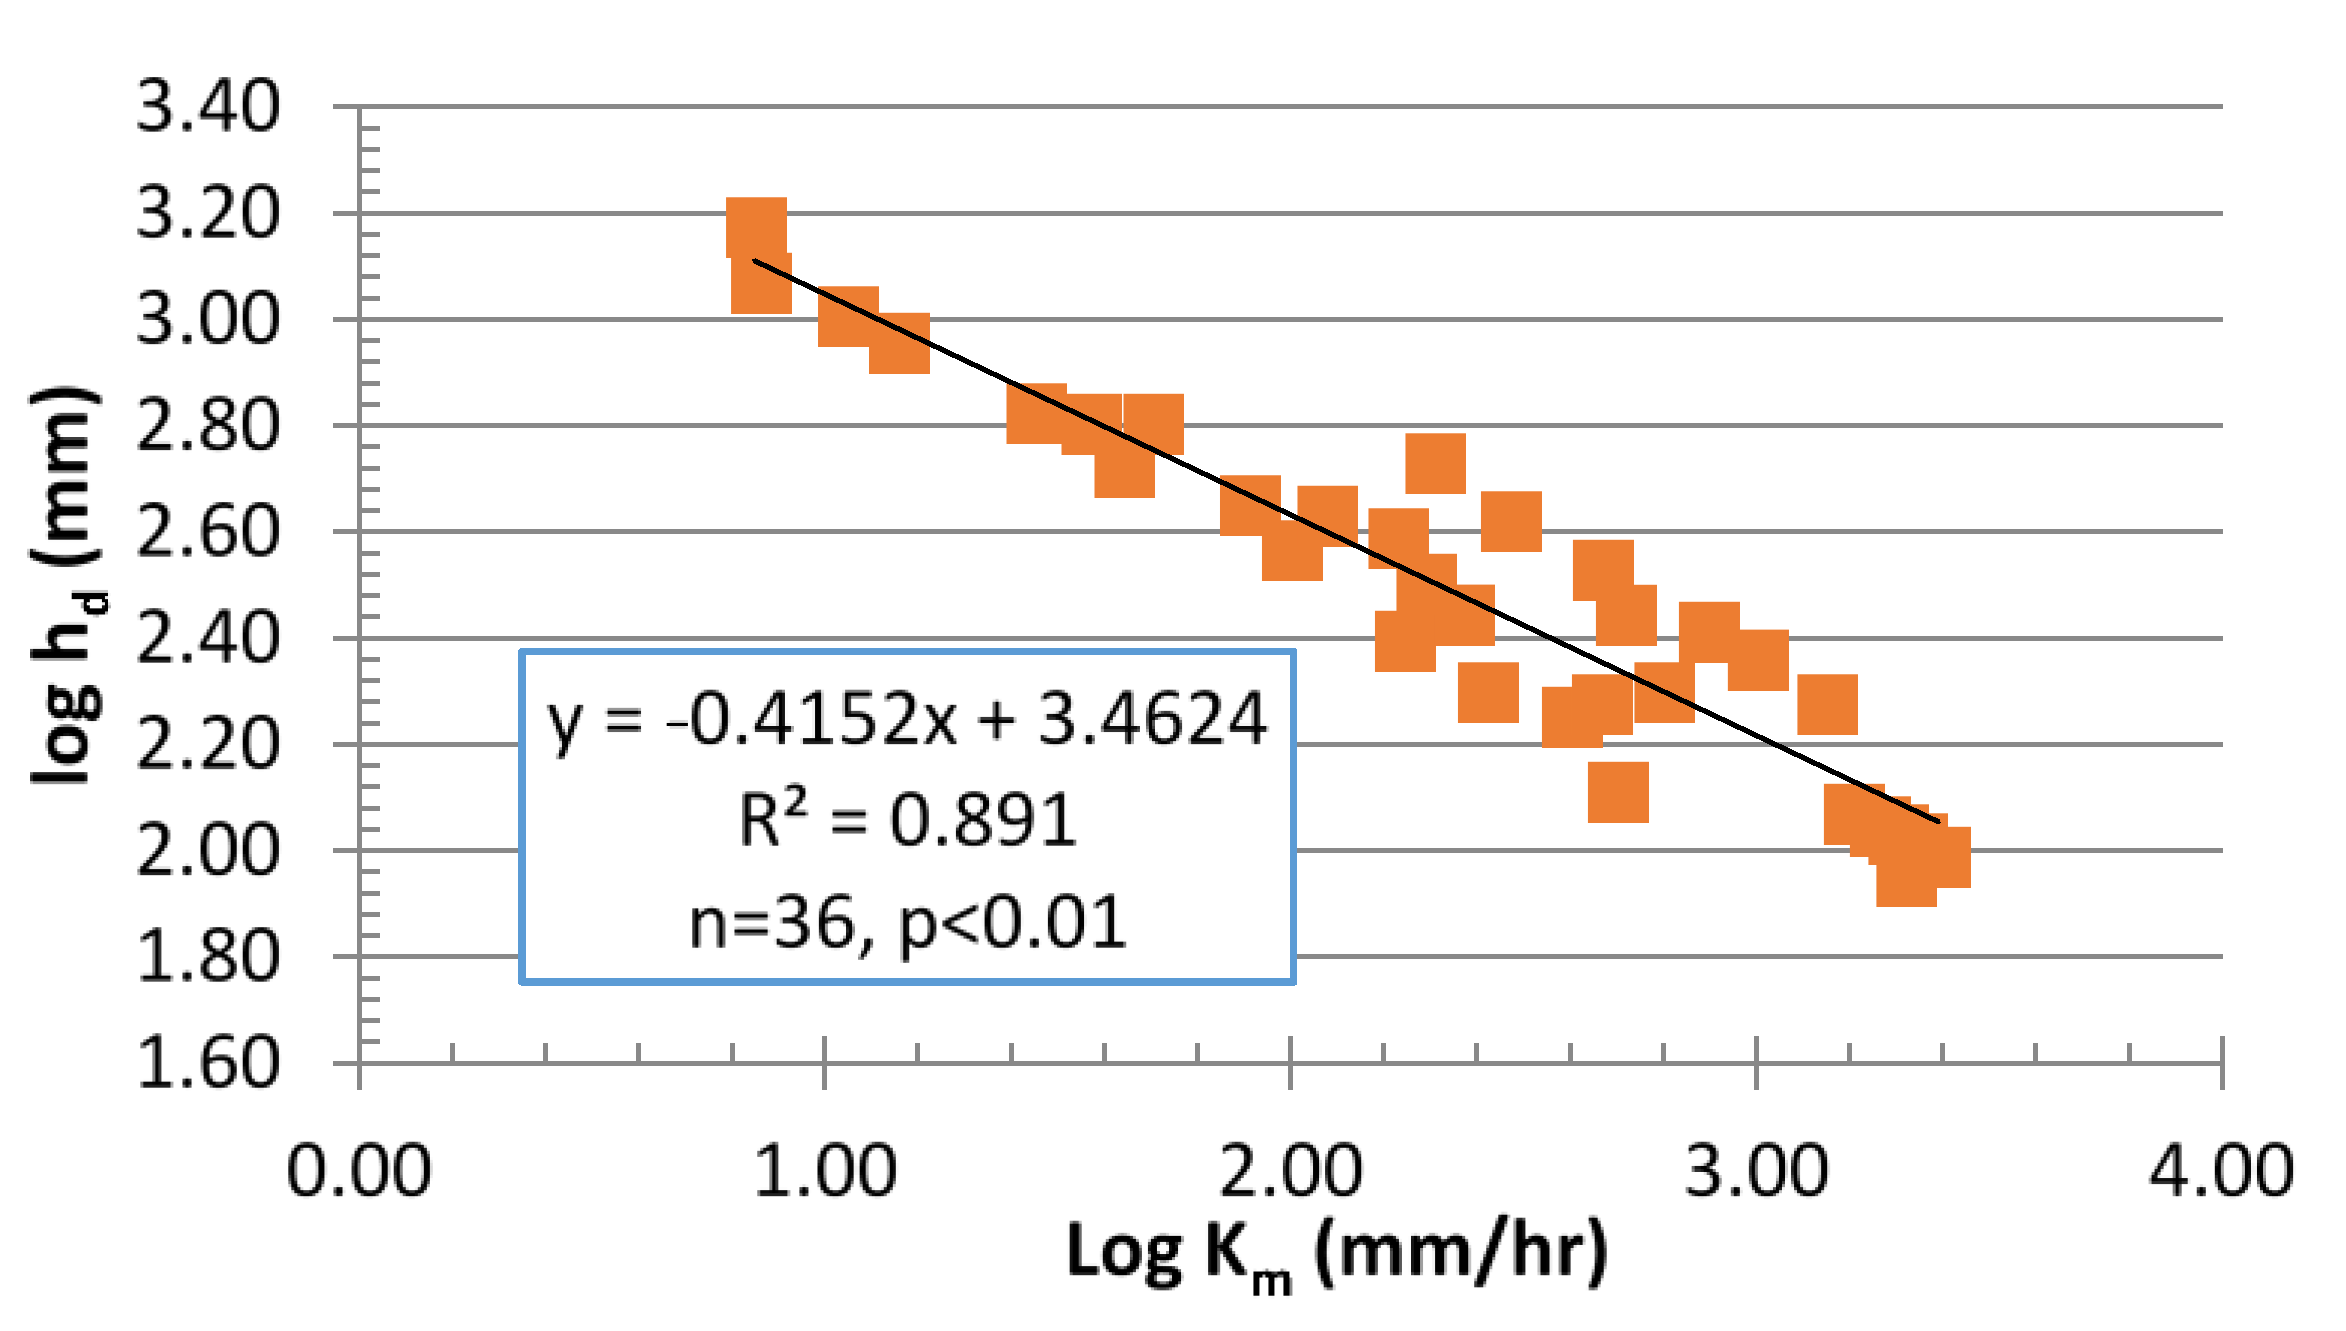
d2. Using only that lab data for sands that more closely replicate the Tahoe soils and changing to more directly applicable units, we found that Km (mm/hr) = 19.9/hd2.4 for hd (mm), as shown in Figure 1. And as noted above, taking Hc 1.1 hd, β 1.3 for λ = 3, and the ponded depth H of Equations (4) or (7) as typically assumed to be small (e.g., 1 mm as in watershed modeling, [21]), we can implicitly solve for Km from Equations (7) and (8) by re-arranging Equation (8) to solve for ∆θ = φ(Sm − Si), as shown below as Equation (9) and substituted into Equation (7).
θ = ( q o   t p / H c ) exp [ ( β q o K m 1 ) 1 1 ]
Alternatively, we can use the simpler Main–Larson equations analogous to Equations (7) and (9) below, but still accounting for air-resistance to infiltration
t p = φ ( S m S i ) H c   q o ( q o K m 1 )  
and
θ = ( q o   t p H c ) ( q o K m 1 )
Finally, we can use the estimated effective ∆θ, taken as the measured infiltrated depth compared to the visual wetting front depth, from RS plot data when no runoff occurs, combined with the infiltrated depth and RS test duration to determine K
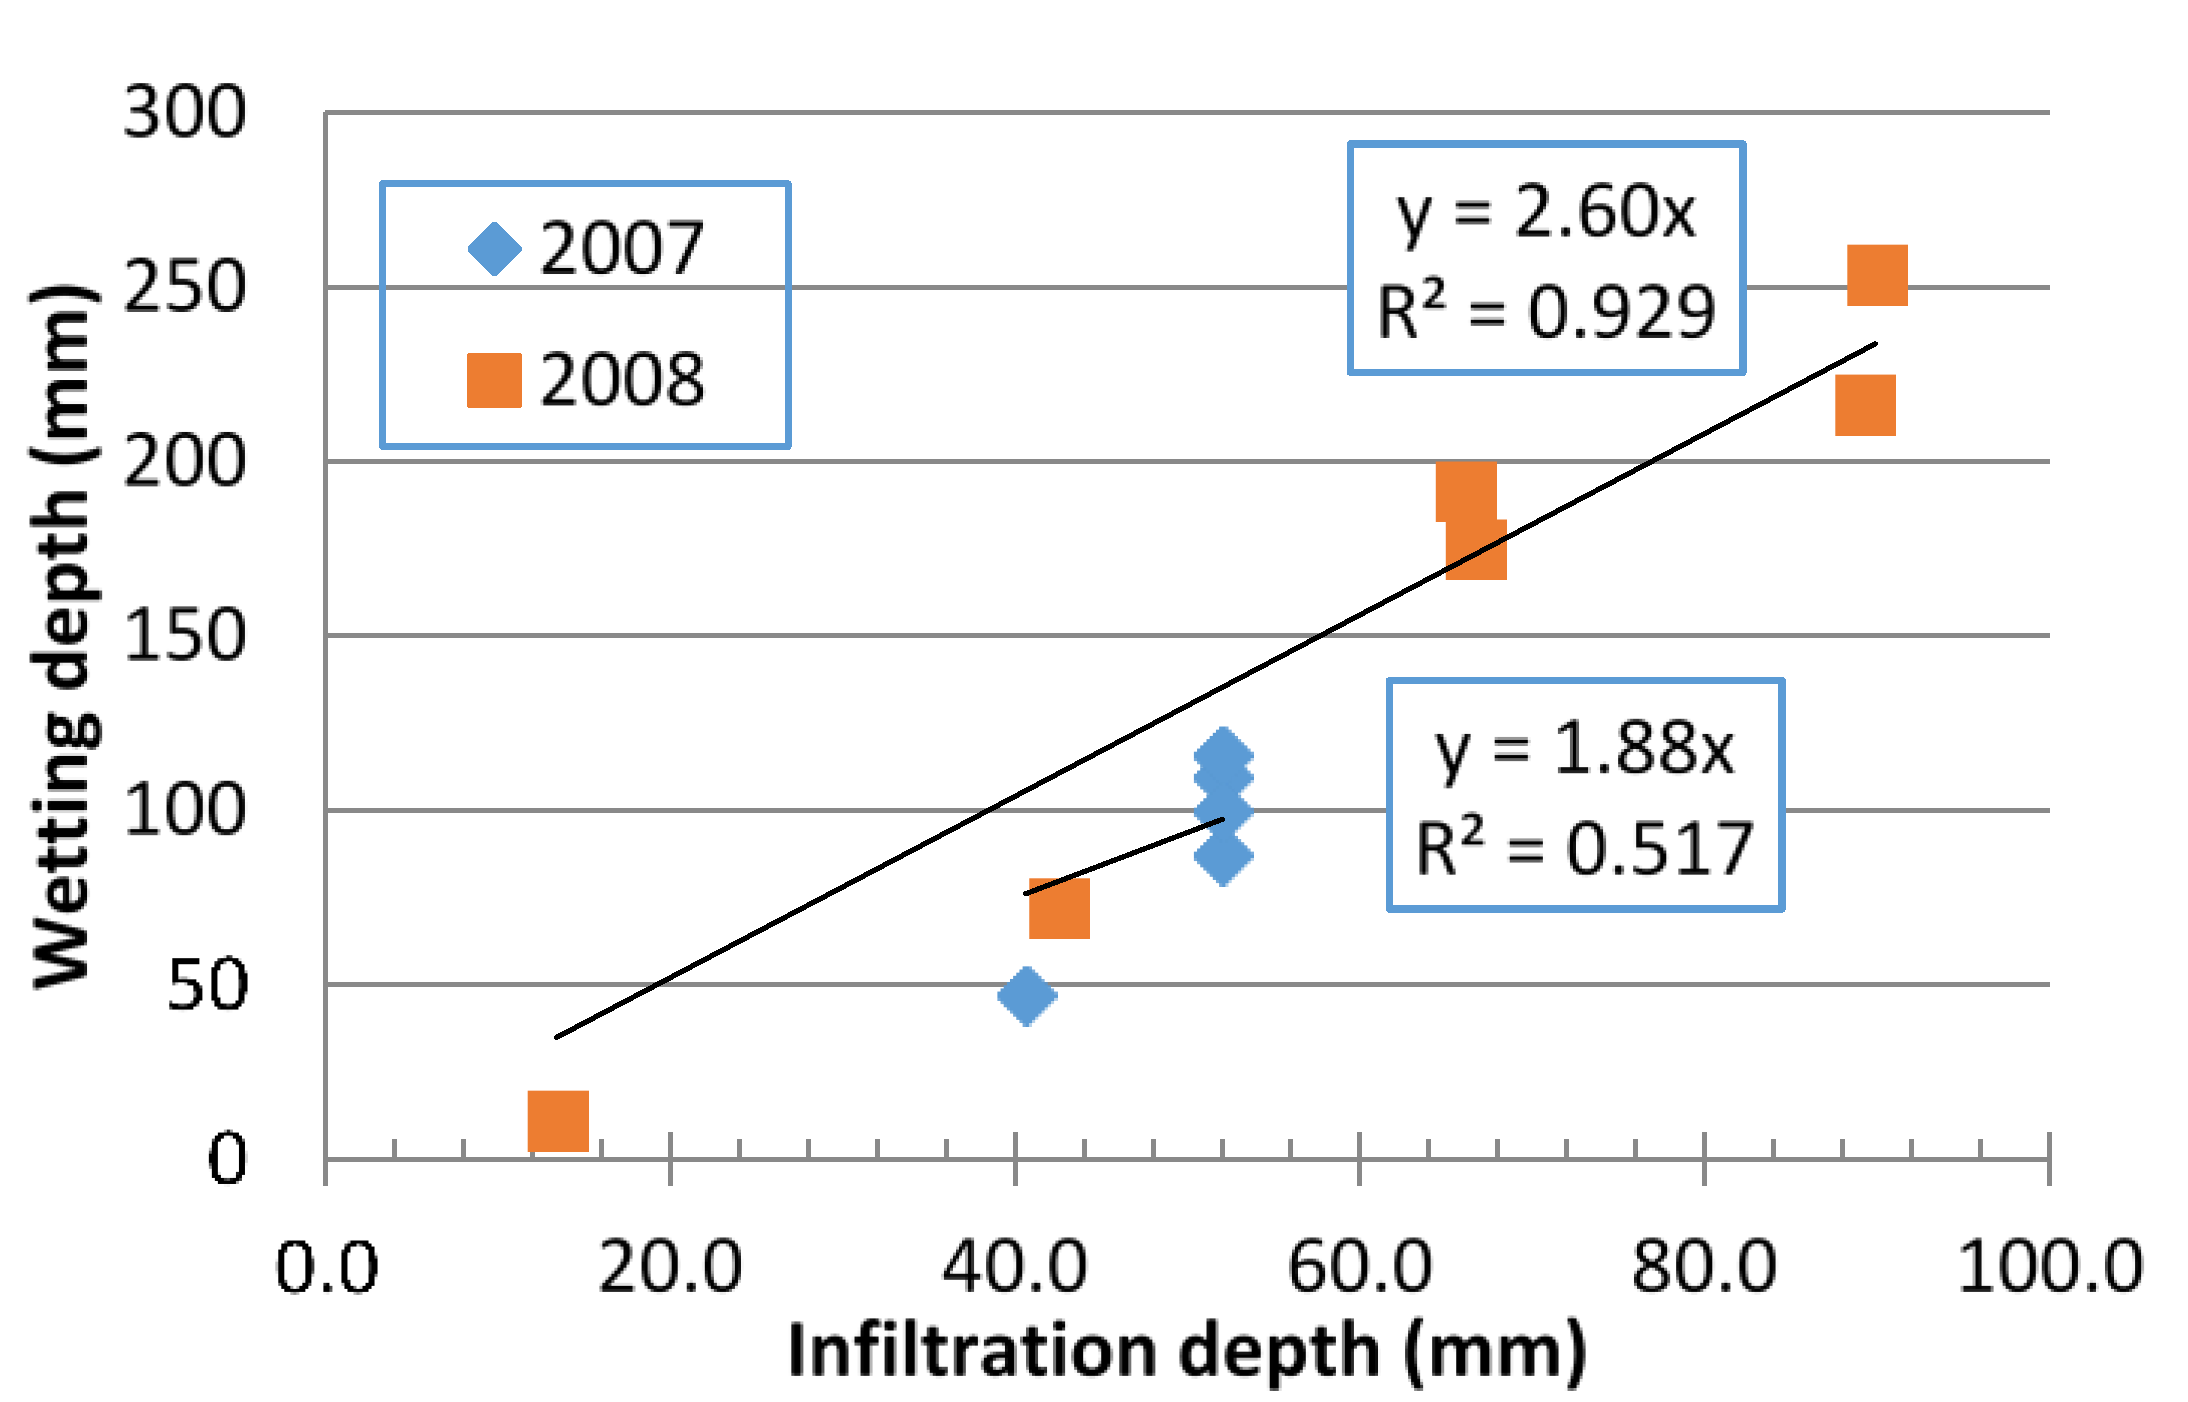
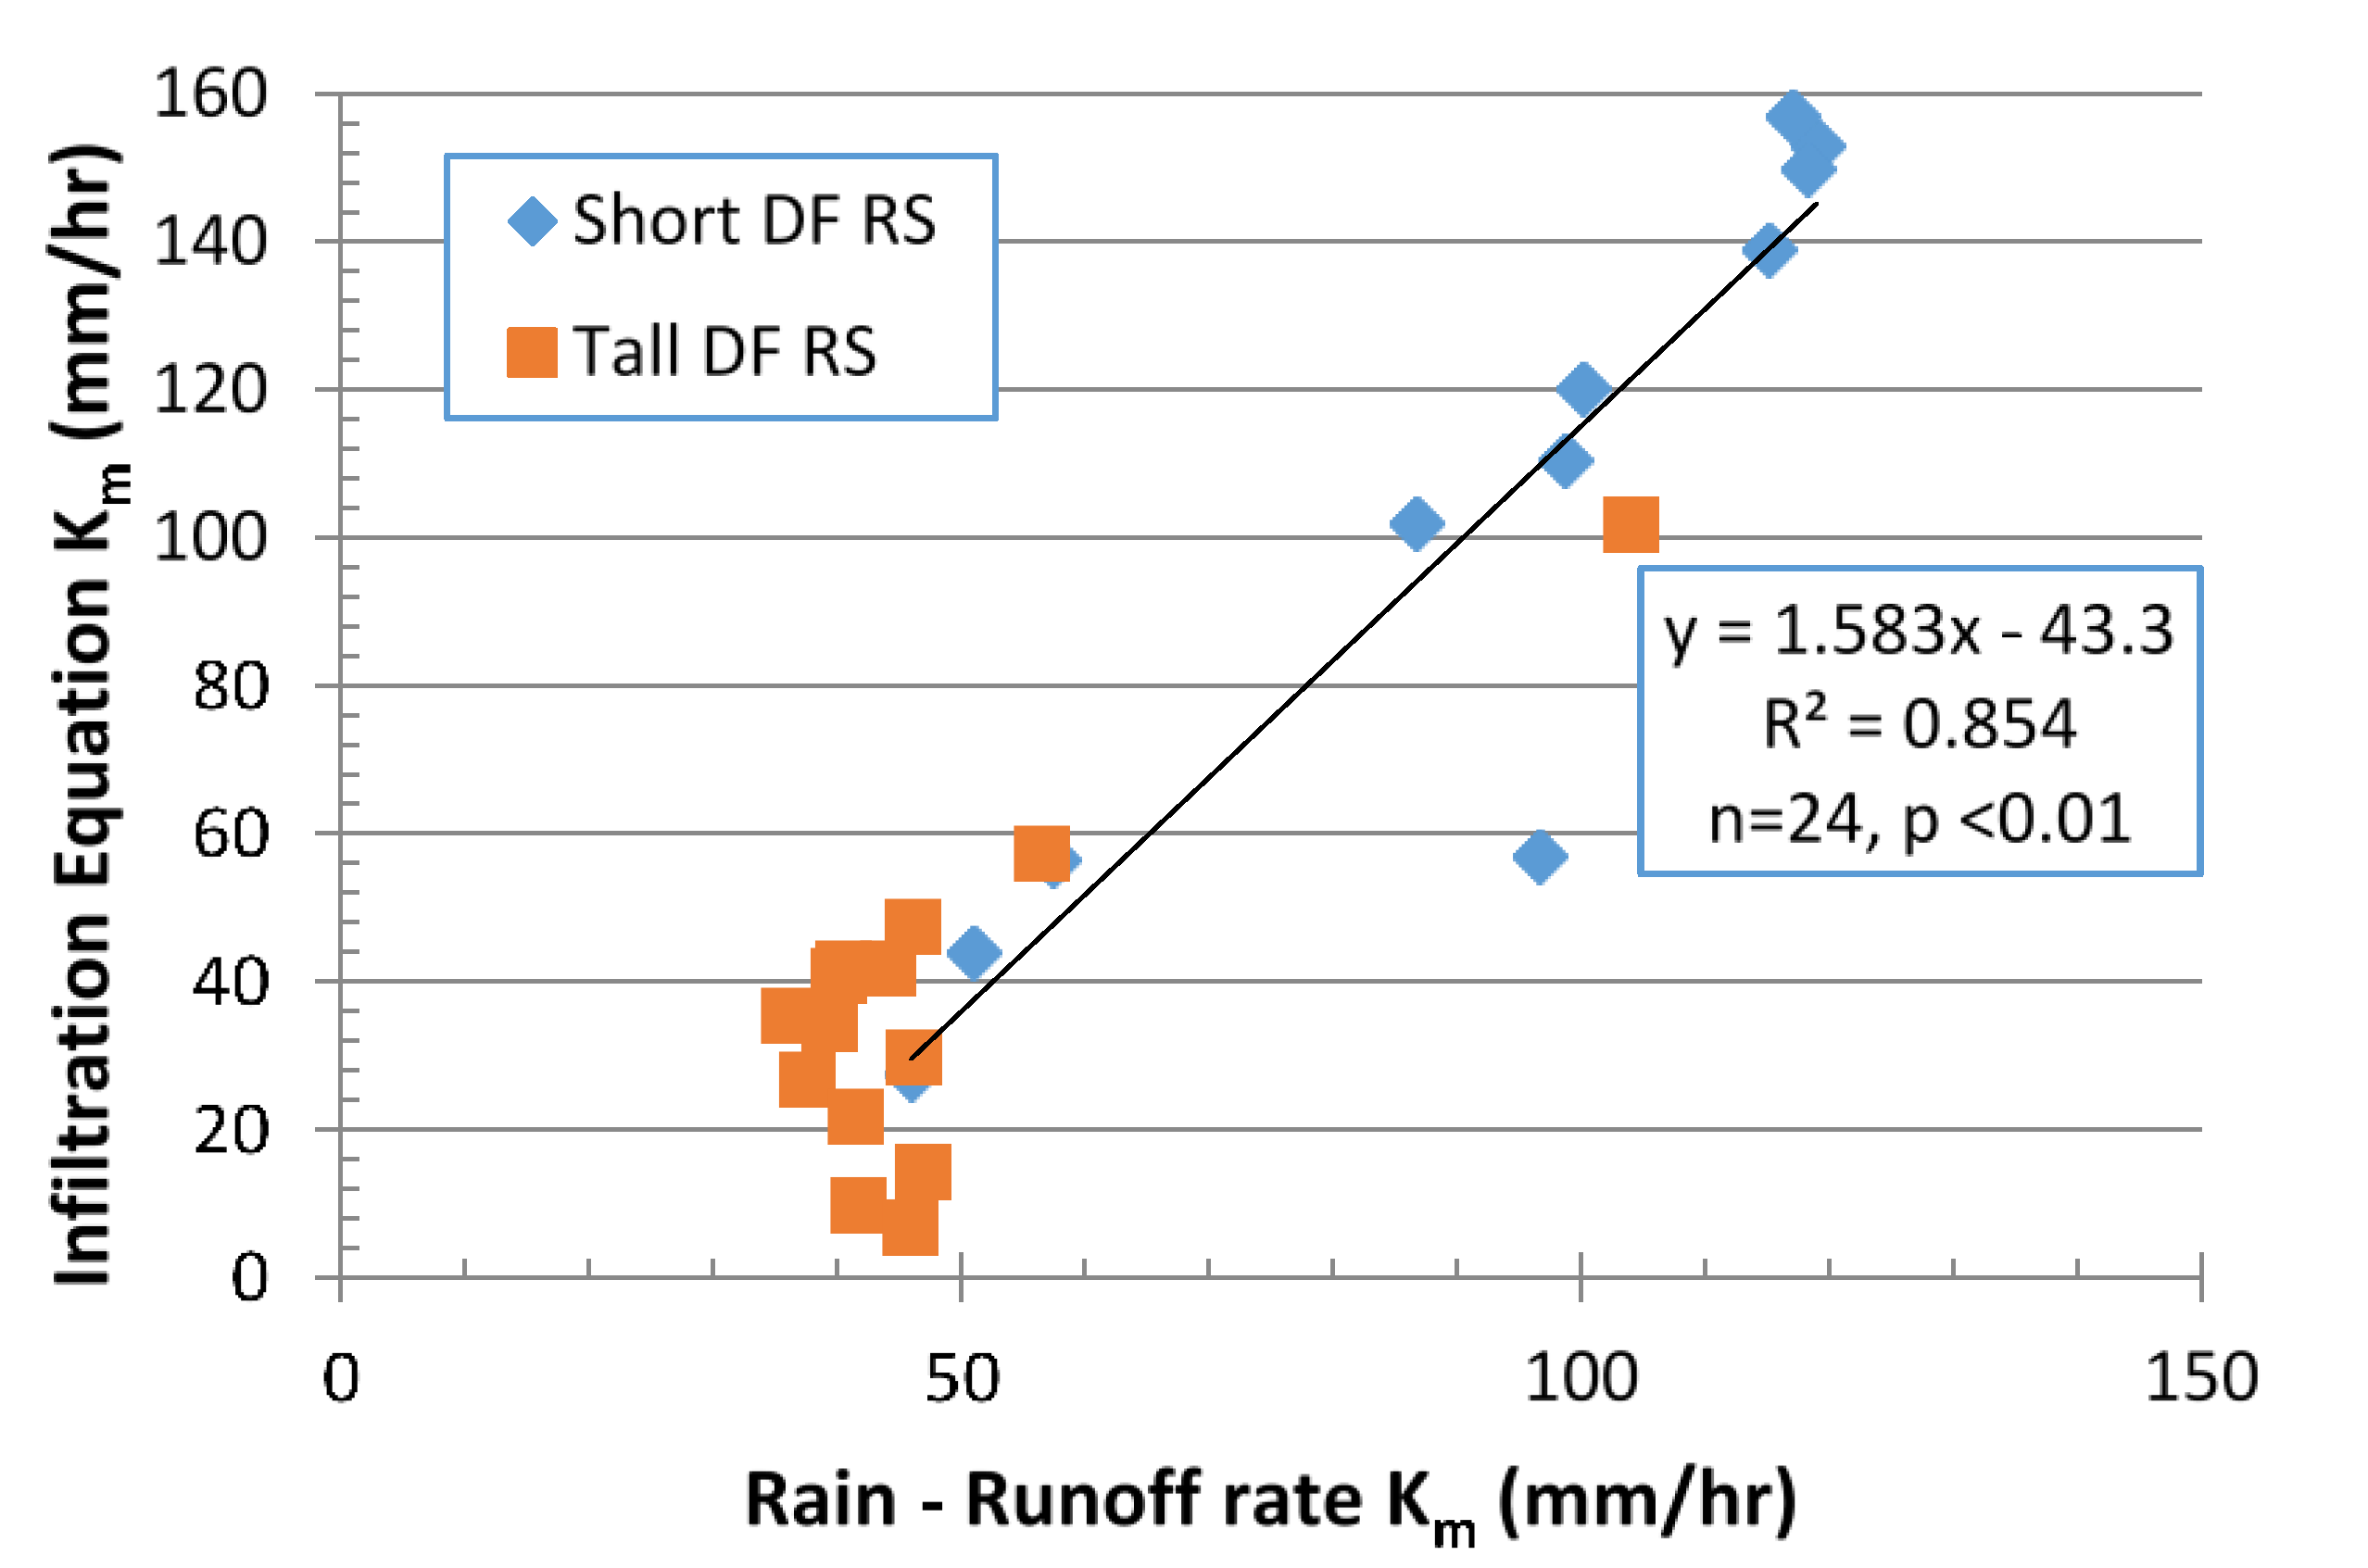
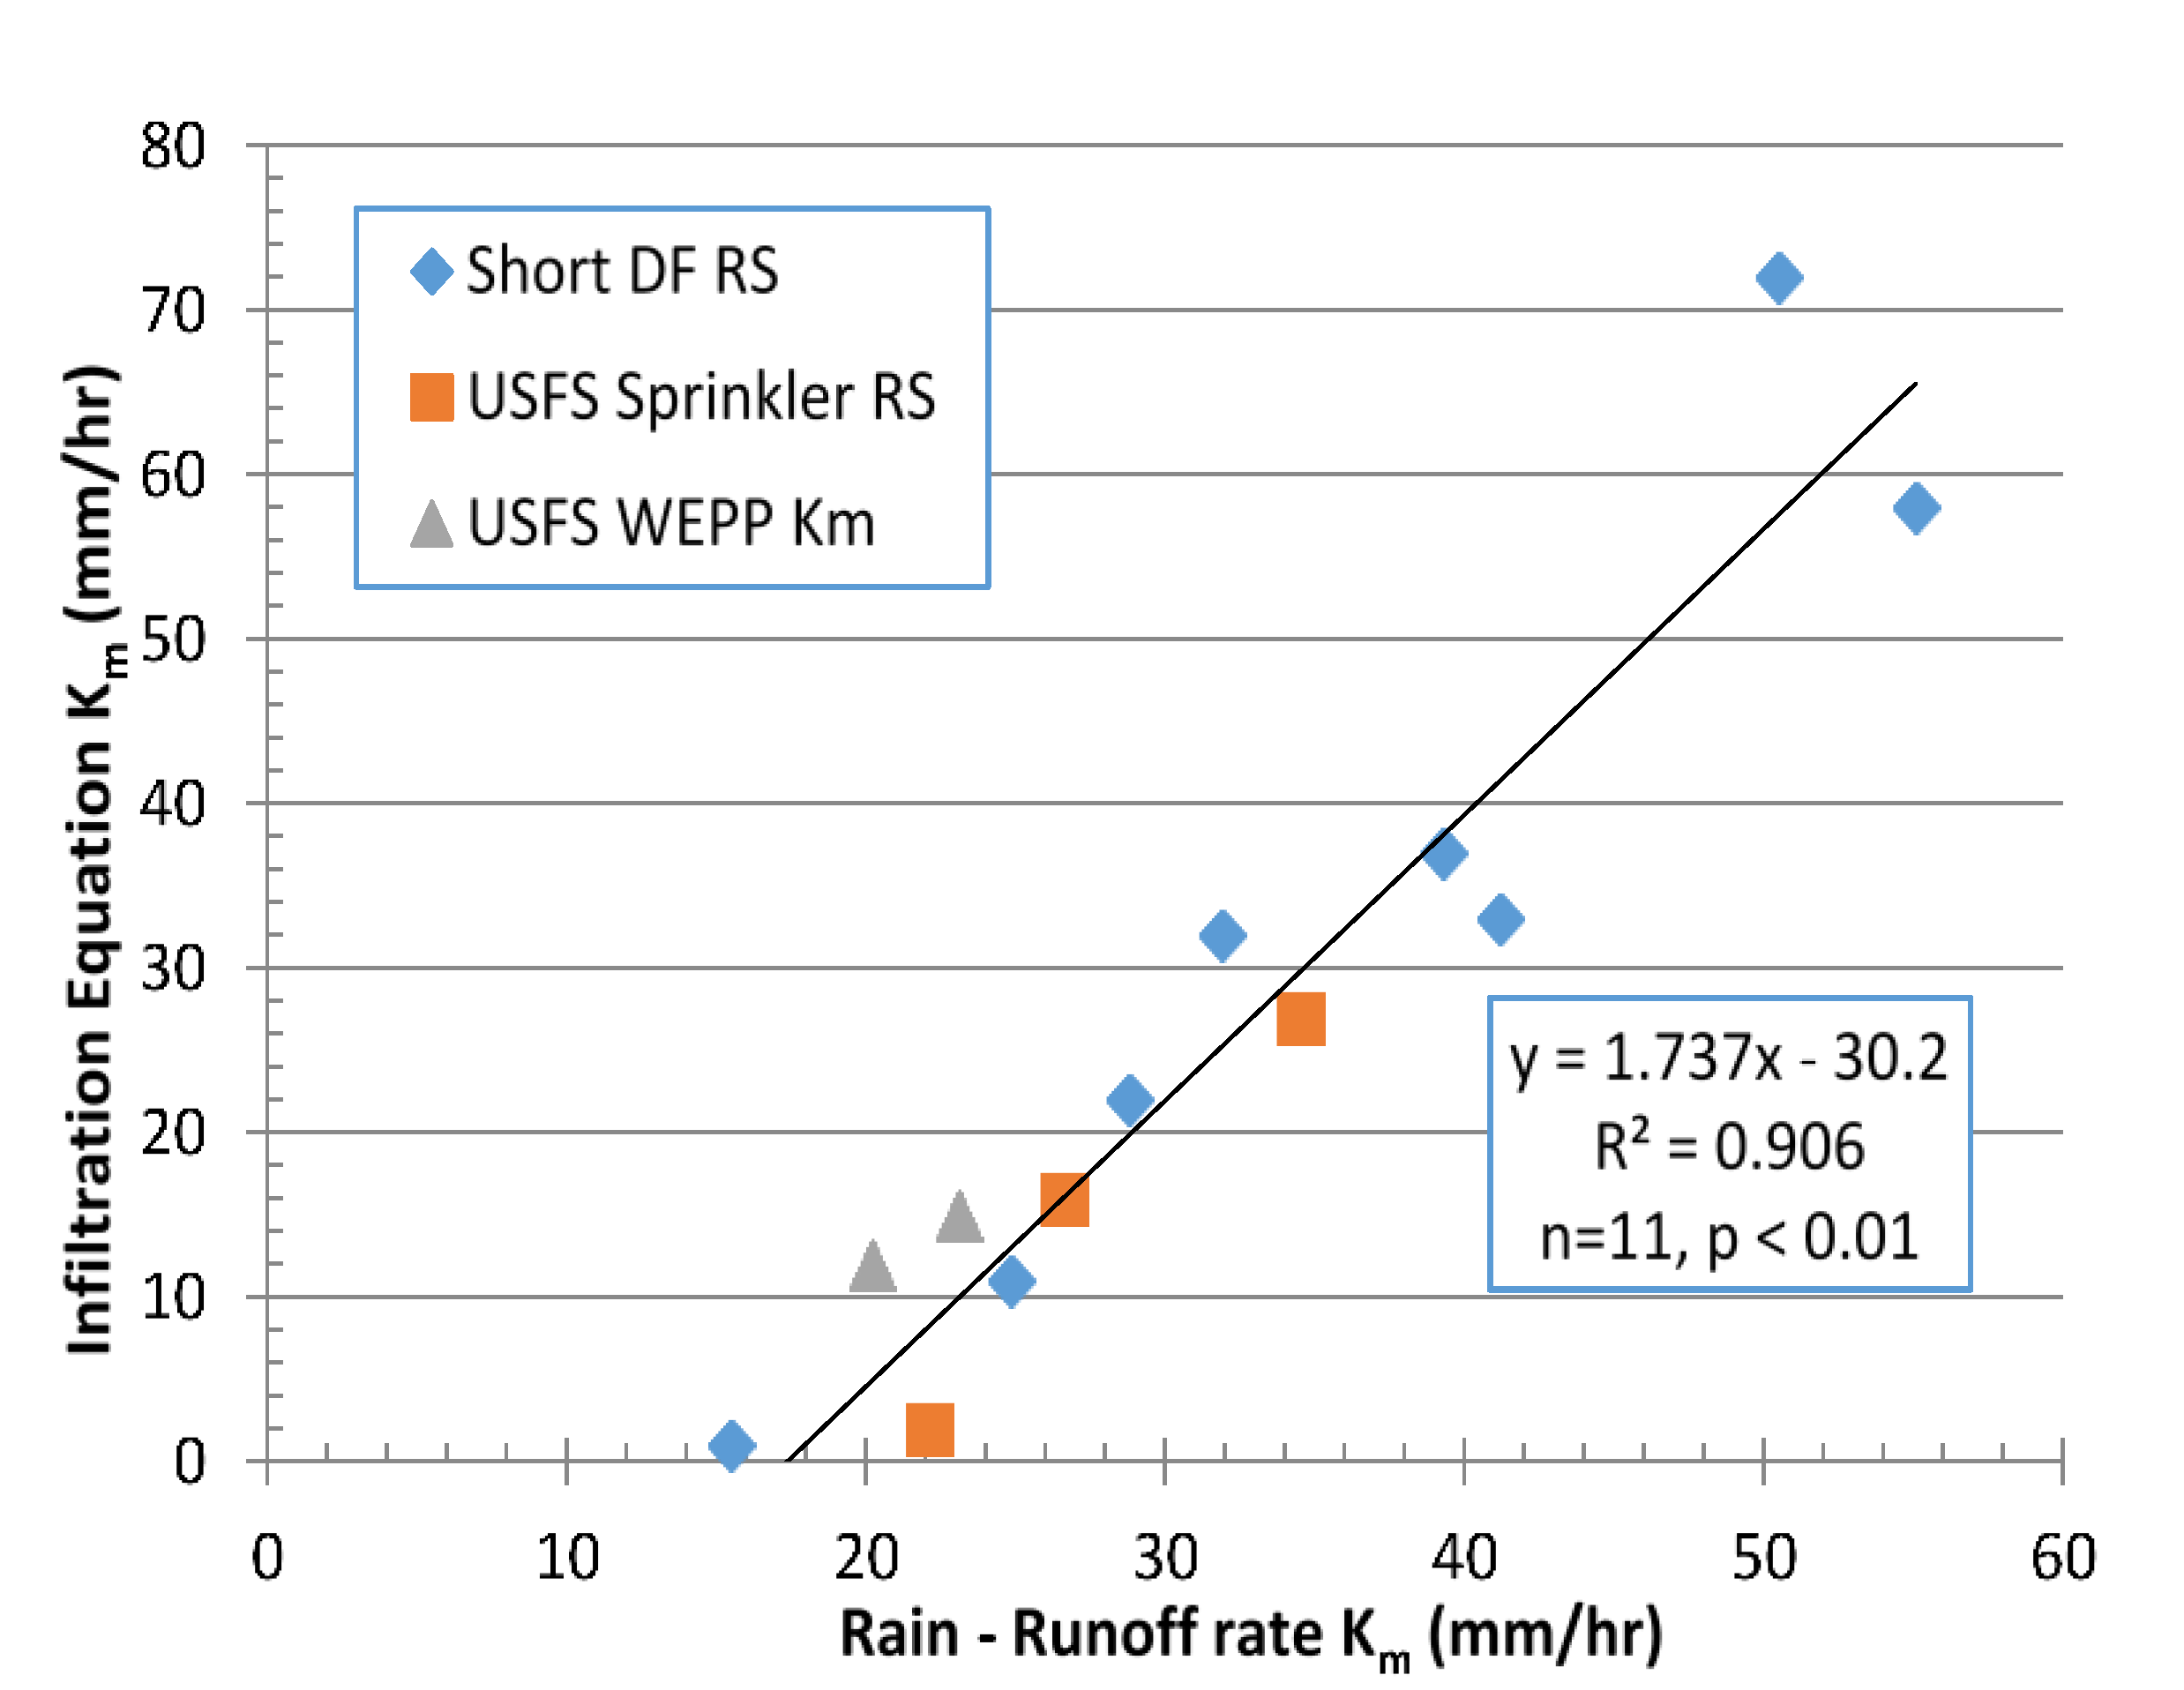
m from Equation (7). For example, 
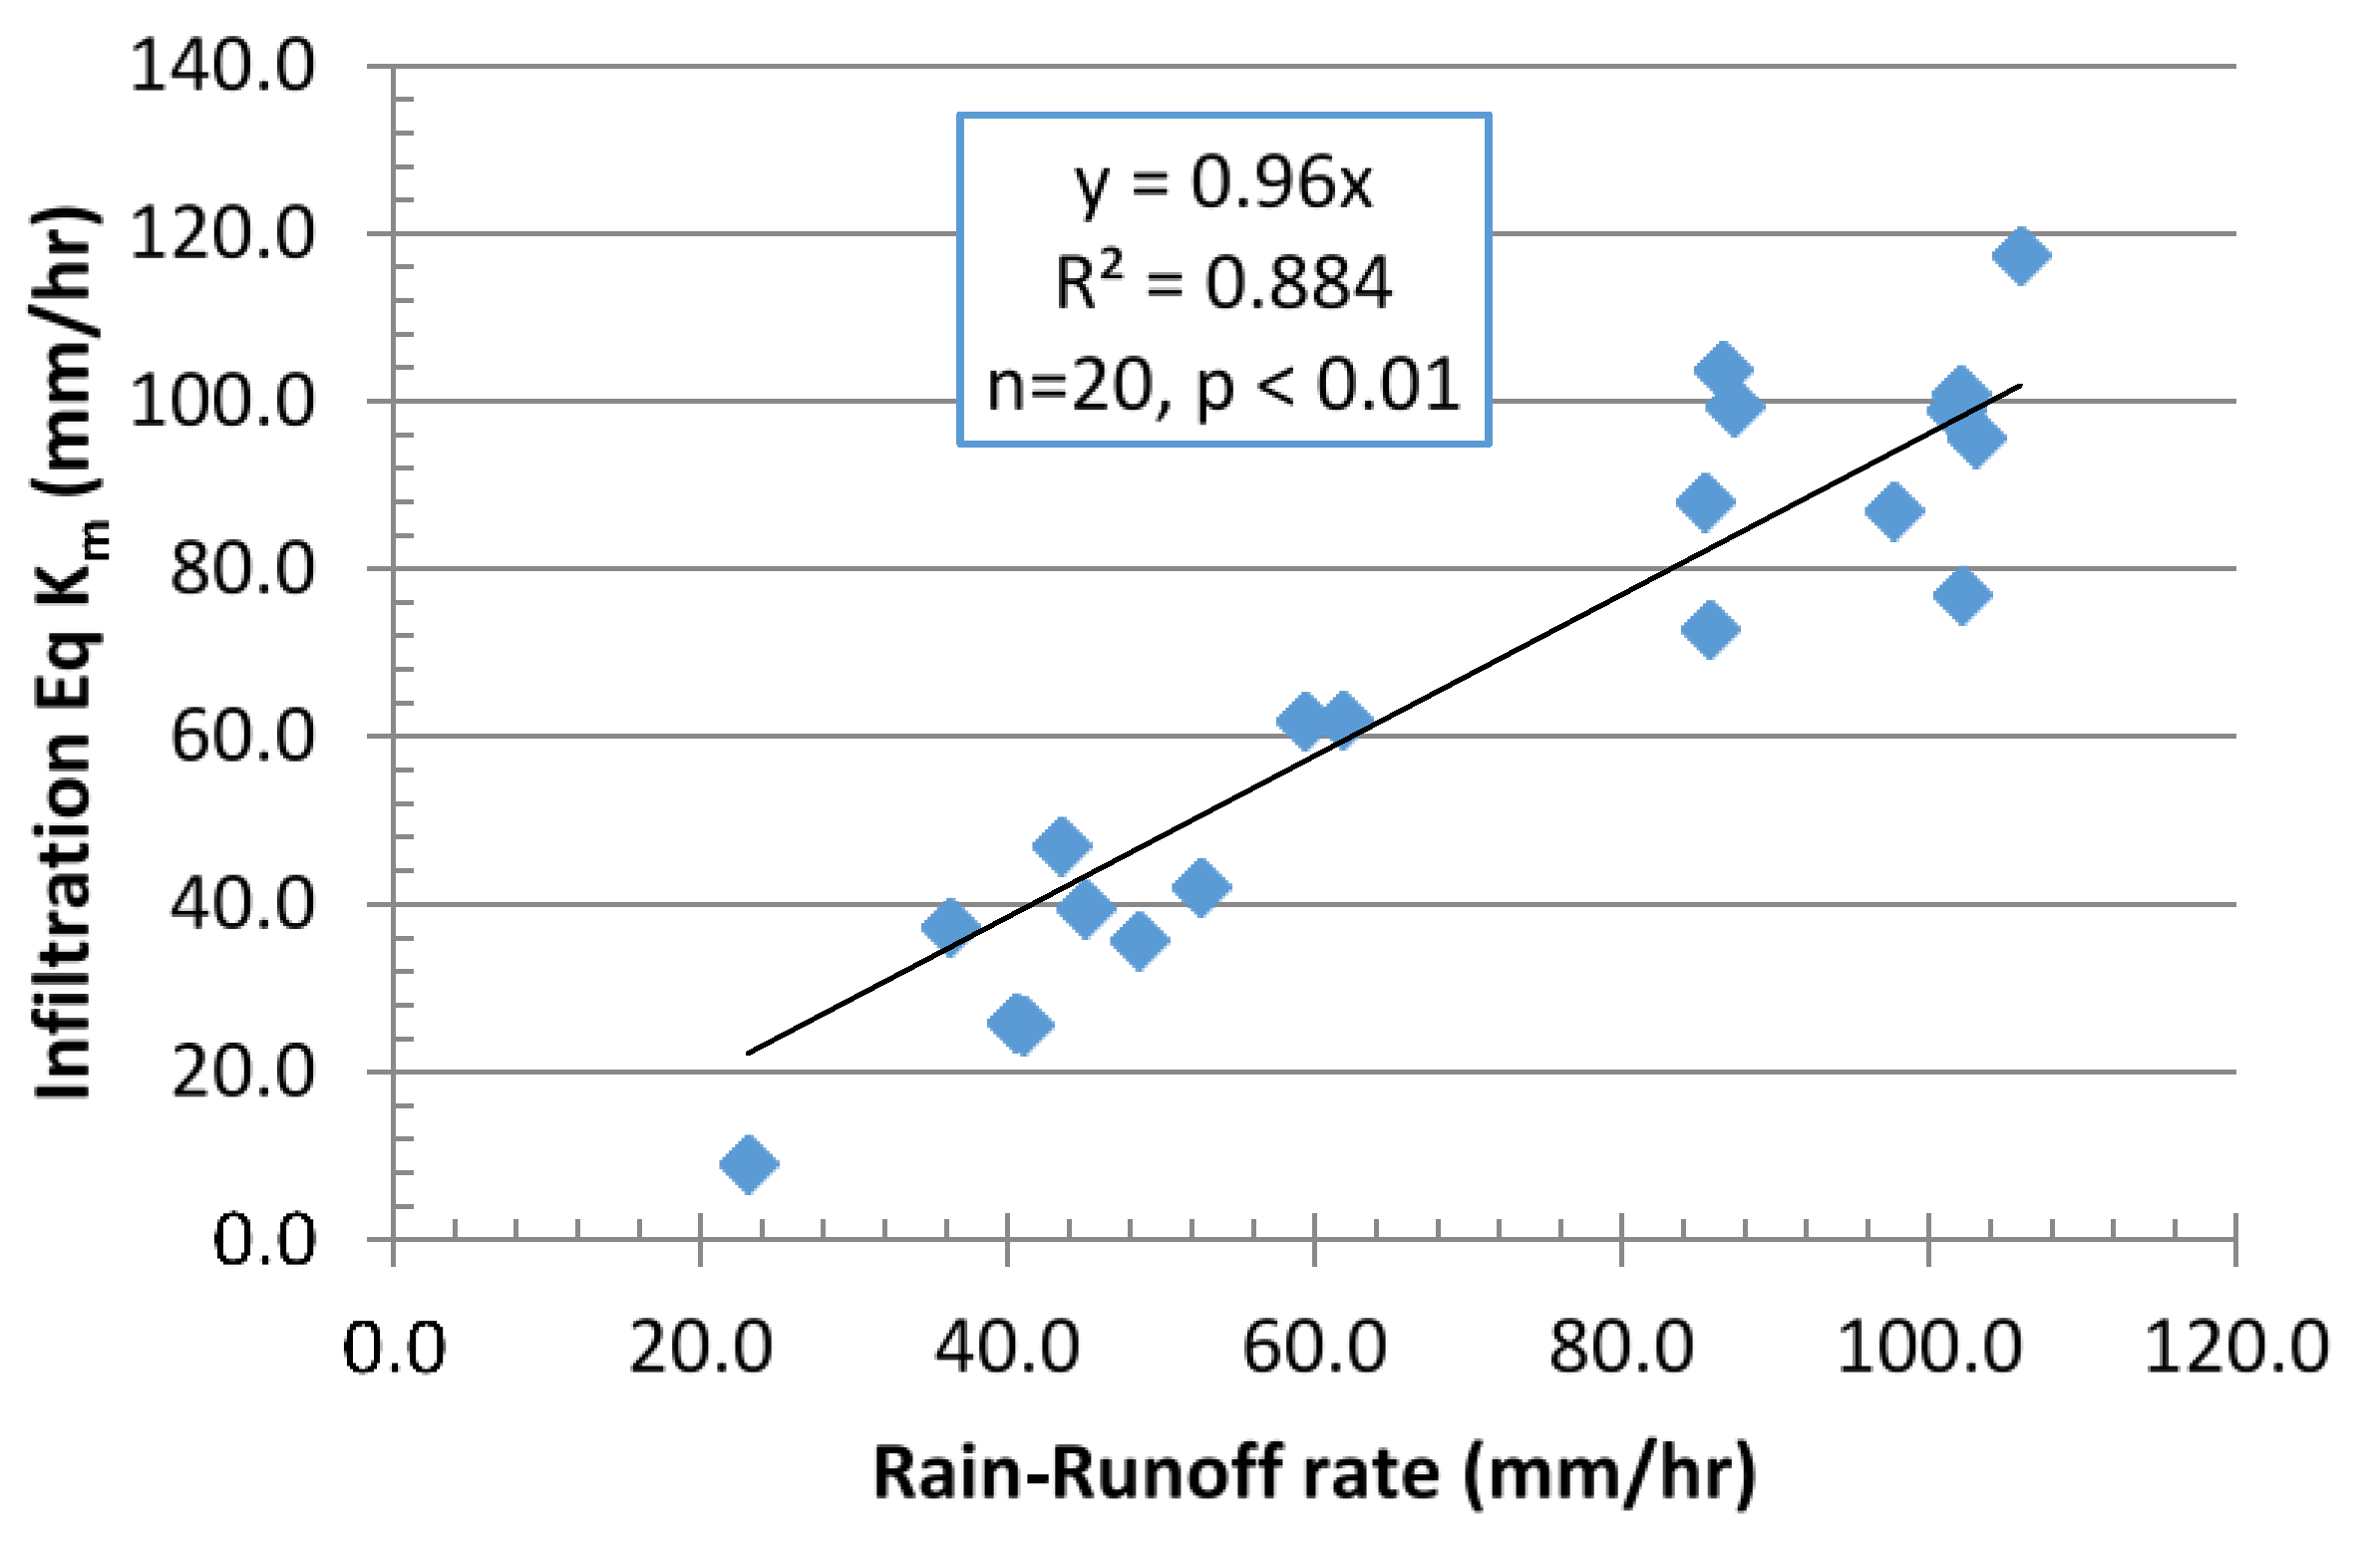
Figure 2 shows the relationship between visual wetting and infiltrated depths from the long-term monitoring site at Heavenly ski area on the coarser-textured granitic soils where the average regression slope suggests an effective ∆θ 45%.

1.4. Theory—Erosion Equation Development

Most watershed modeling efforts and associated estimation of sediment detachment or erosion rates employ the well-known Manning’s equation to relate overland or channel flowrates and velocity to flow depth and hillslope, or channel gradient. Of course, use of Manning’s equation implies that an appropriate surface roughness value, “n”, can be identified, that the driving force, or slope angle <10% and that flows are fully turbulent. The assumption of turbulent flow conditions during sheet flow across the RS plot or the landscape is questionable when flow depths are quite small and laminar flows are more likely present [21]. The general derivation of the laminar flow equation for thin films on inclined planes at any angle, α, to the horizontal requires only the assumptions of the “no-slip” boundary condition together with constant fluid properties [22]. Considering two-dimensional steady laminar flow of depth, y, down an inclined plane at angle, α, to the horizontal, the shear force as given by the fluid viscosity, μ, and the parabolic velocity function is balanced by the gravitational force (unit weight, ρg) on the fluid body in the direction of flow. That is, the flowrate Q per unit width is given by
Q = um y = (𝜌gy3/3μ)sin α
where um is the mean velocity taken as 2/3rds of the maximum velocity assuming a parabolic velocity distribution perpendicular to the inclined plane. Of course, the equivalent flowrate equation assuming turbulent flow and mild slopes (<10%) is taken from the approximation for the Chezy–Mannings equation assuming flow depths are very small compared to flow width, B,
Q = (1/n) y1.67S0.5
The flow mean velocity needed to determine shear stresses on soil particles is given by Q/y from Equations (12) or (13), depending on whether laminar or turbulent flow is assumed. Replacing the sine function with a power function approximation in Equation (14), it is apparent that under steady laminar flow conditions the mean surface flow velocity is practically proportional to the slope, S, rather than the square root of the slope, as in the mean velocity determined from Manning’s Equation (15); moreover, there is no slope limitation or need to identify the roughness value, “n”.
um = (𝜌gy2/3μ)sin α ≅ (0.7524𝜌gy2/3μ)S0.983
um = (1/n) y0.67S0.5
In RS plot studies, the runoff rate, q, is often expressed as the steady flowrate collected at the runoff lip frame divided by the area of the plot, as this allows convenient comparison to the infiltration and rainfall rates, and because rarely is the actual sheet flow depth measured or estimated so as to enable calculation of the mean, or average, overland flow velocity, um. The relationship between q and um is simply given by the mass balance
q = Byum/A,      or   um = qA/(By)
where A = runoff frame area (m2), B = the runoff lip width (m) and the other parameters are as previously defined. Solving Equation (16) for the mean velocity then requires substitution for the flow depth based on either Equation (15) for turbulent flow, or Equation (14) for laminar flow, as shown below, respectively, in Equations (17) and (18).
u m =   ( q A / B ) 0.4 S 0.3 / n 0.6 = ( A B n 1.5 ) q 0.4 s 0.3
u m =   ( q A / B ) 0.67 ( 0.7524 ρ g / 3 μ ) 0.33 S 0.328 = ( A B ) 0.67 ( 0.25 ρ g μ ) 0.33 q 0.67 S 0.328
Quantitative description of soil particle detachment or erosion processes perhaps originated with Ellison’s [23] observation that “erosion is a process of detachment and transport of soil materials by erosive agents”. These “erosive agents”, of course, include raindrop impact and overland flow. Of course, rain drop impact energy diminishes with increasing flow depth and presence of soil cover that both “absorb” the drop impact energy. Raindrop impact energy, while an erosive agent on bare soils should probably be related to the aggregate strength, that is, the energy needed to break up and mobilize surface aggregates [24,25]. Subsequent research, more or less, begins with Ellison’s paradigm of sorts that continues in concept through the soil-detachment equation review by Owoputi and Stolte [26]. Similarly, Foster and Meyer [27] interpreted results of several experiments in terms of Yalin’s equation that assumes “sediment motion begins when the lift force of flow exceeds a critical force … necessary to … carry the particle downstream until the particle weight forces it out the flow and back to the bed.” Bridge and Dominic [28] built on this concept and described the critical velocities and shears needed for single particle transport over fixed rough planar beds. Gilley et al. [29,30,31] included the Darcy–Weisbach friction factor as a measure of the resistance to flow that was eventually adopted in the WEPP model. Moore and Birch [32] combined slope and velocity and suggested that particle transport and transport capacity for both sheet (interrill) and rill flows is best derived from the unit stream power. In all these descriptions, the erodibility process essentially involves momentum transfer with an energy loss to friction. More recently, the concept of stream power as the primary factor controlling soil detachment rates has been adopted in several reviews e.g., [33,34,35,36]. Assuming turbulent and laminar flow conditions, respectively, from Equations (17) and (18), stream power, P, can be expressed as
P = ρ g u m S = ( A B n 1.5 ) 0.4 ρ g q 0.4 S 1.30
and
P =   ( A B ) 0.67 ( 0.251 μ ) 0.33 ( ρ g ) 1.33 q 0.67 S 1.328
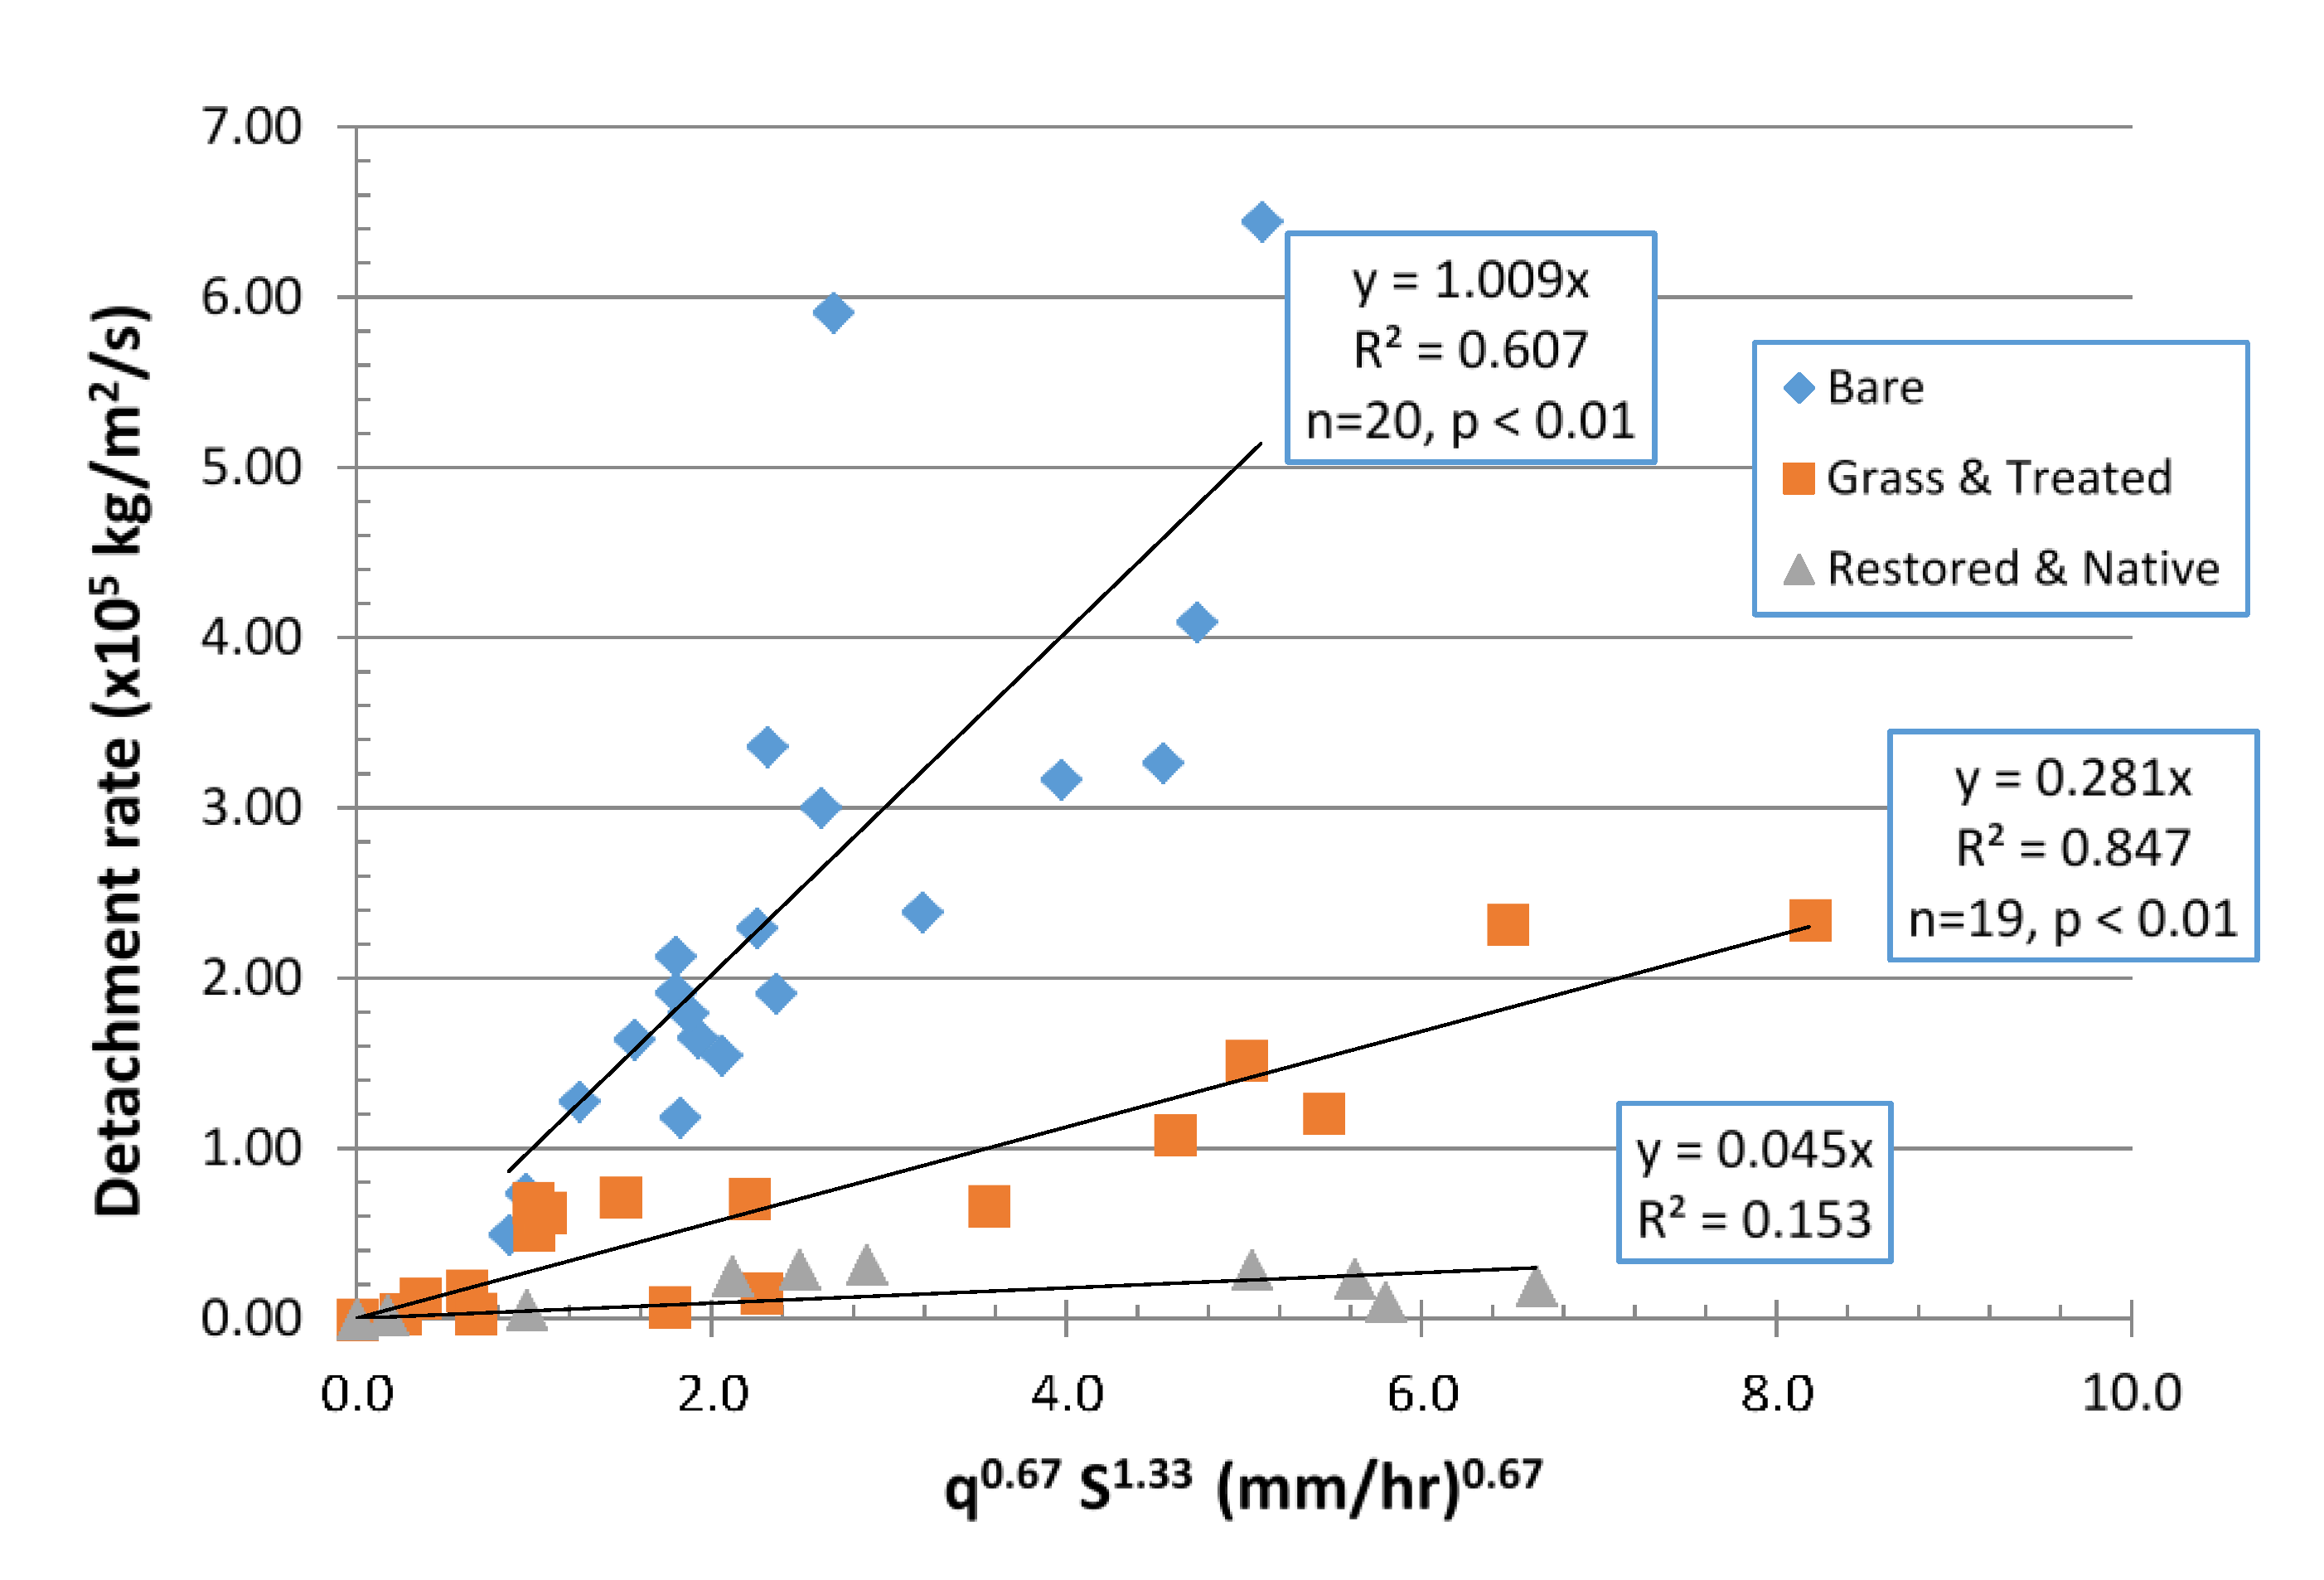
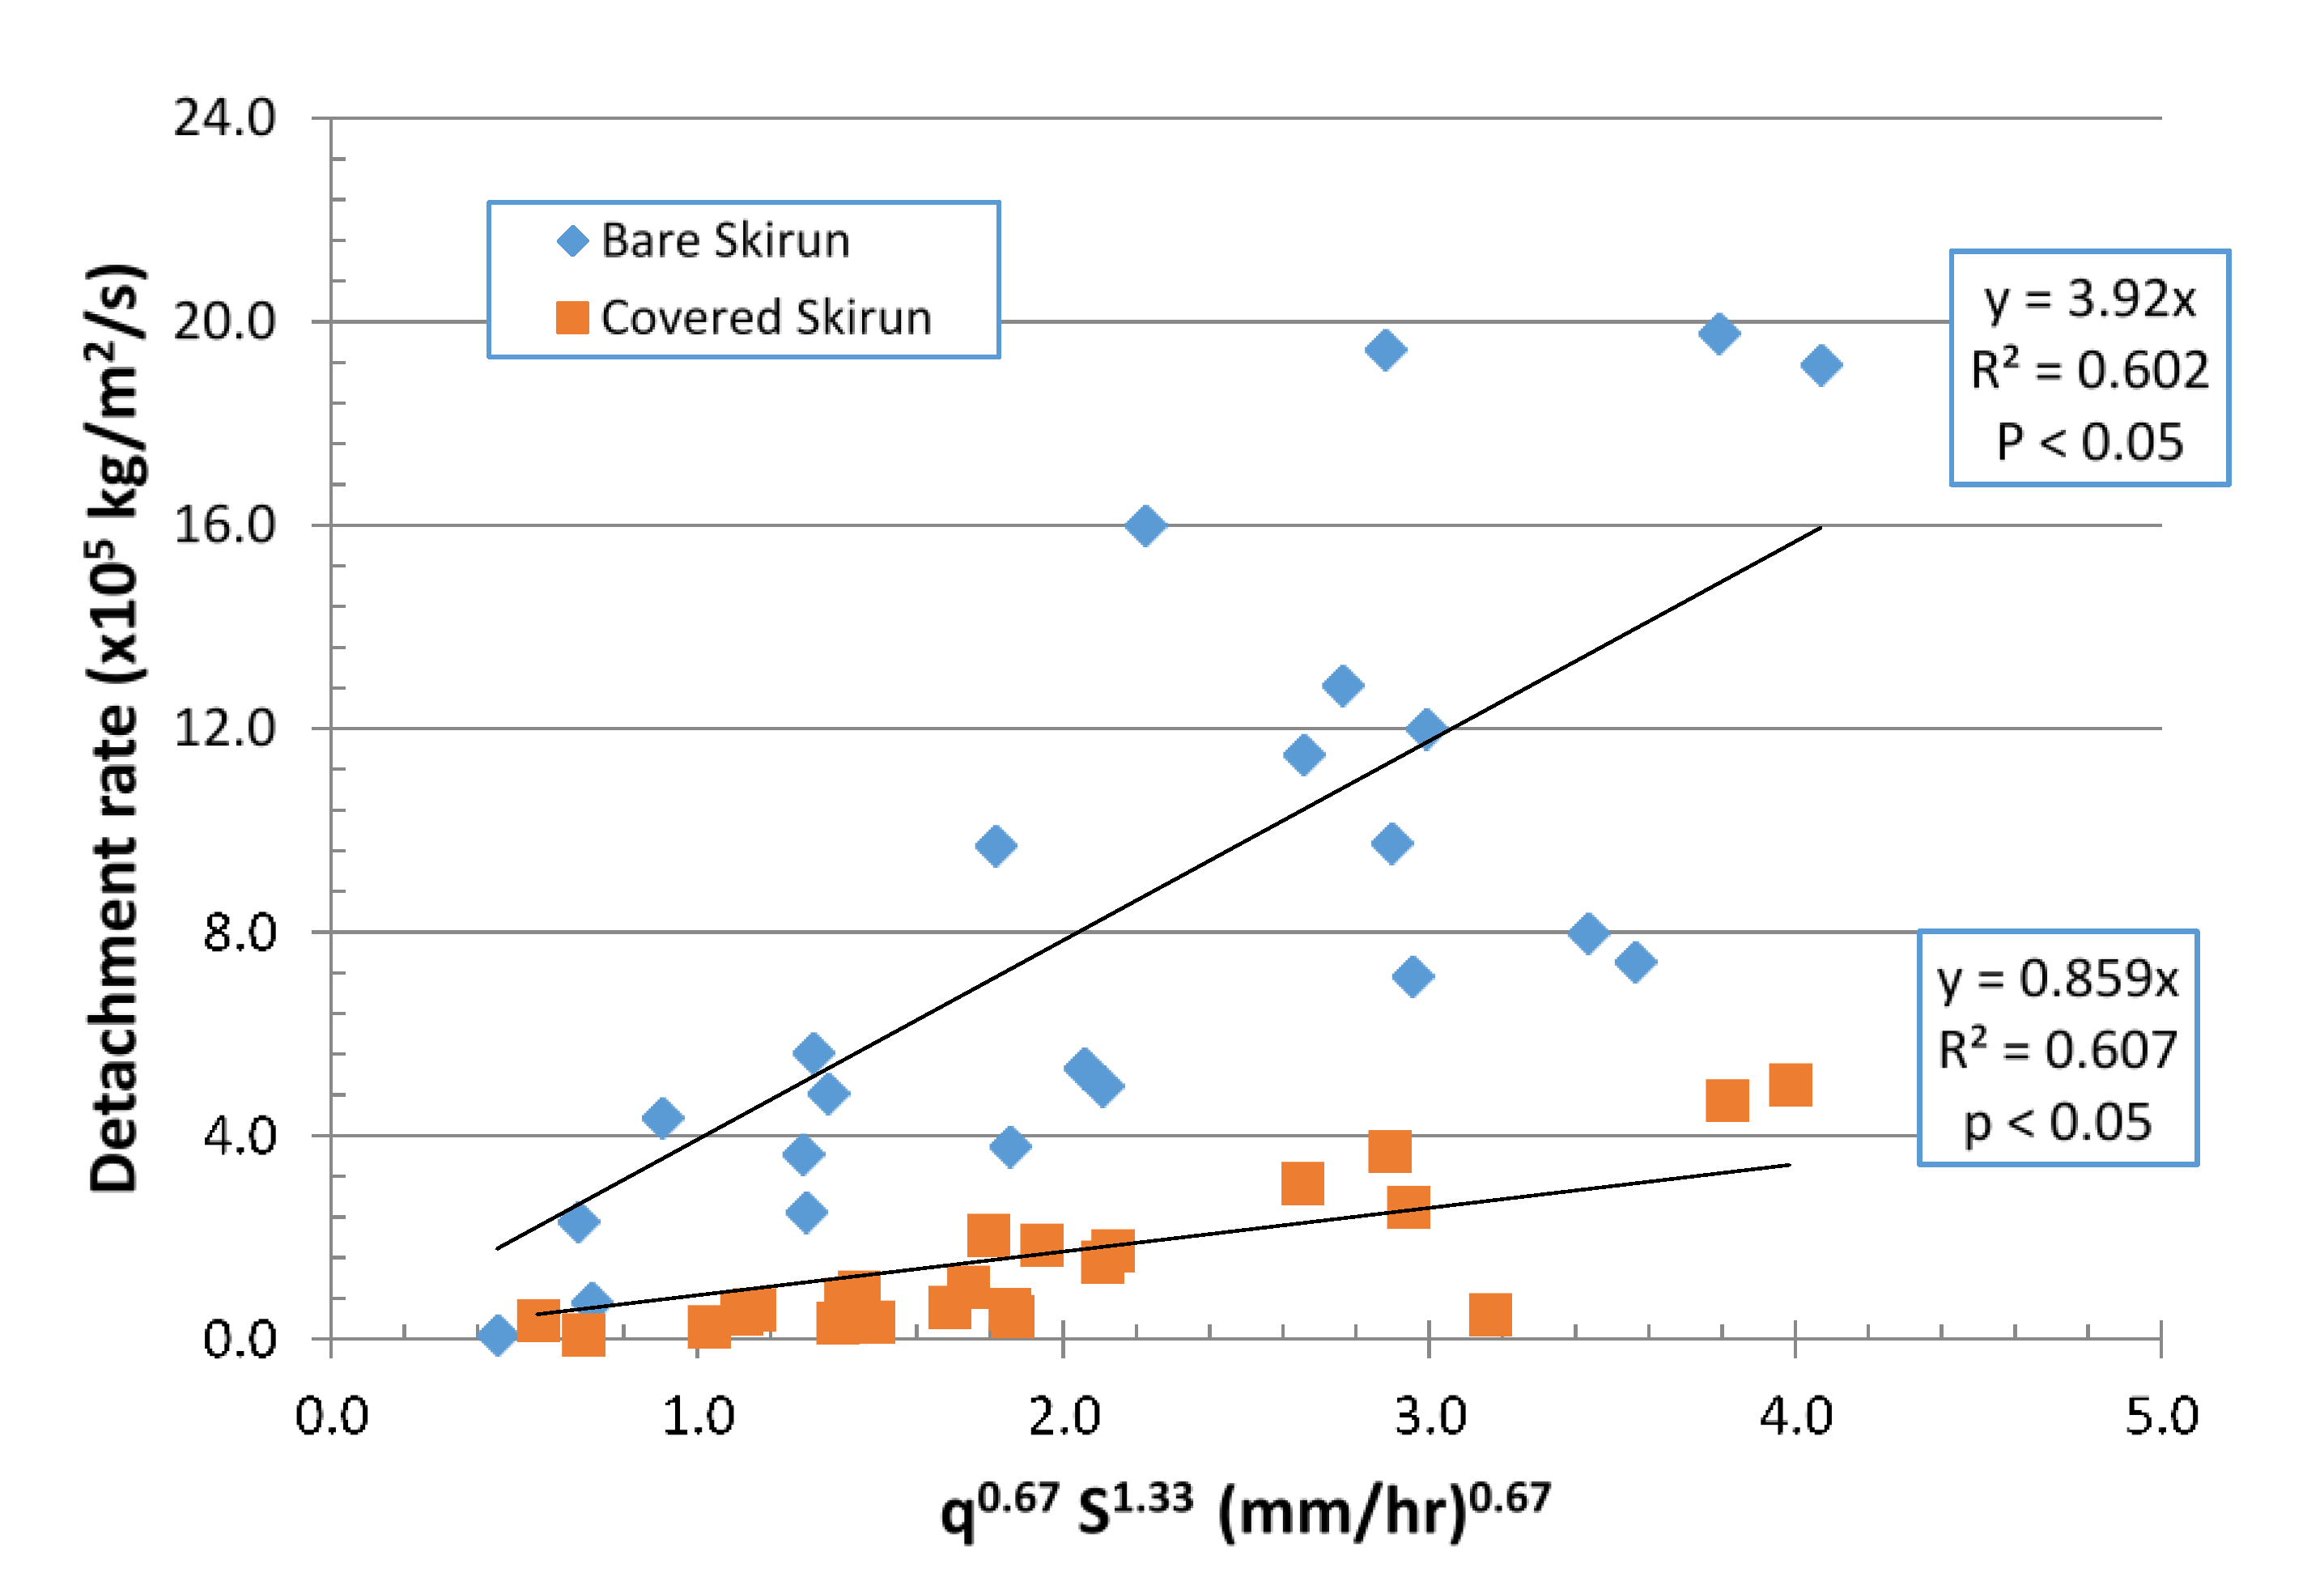
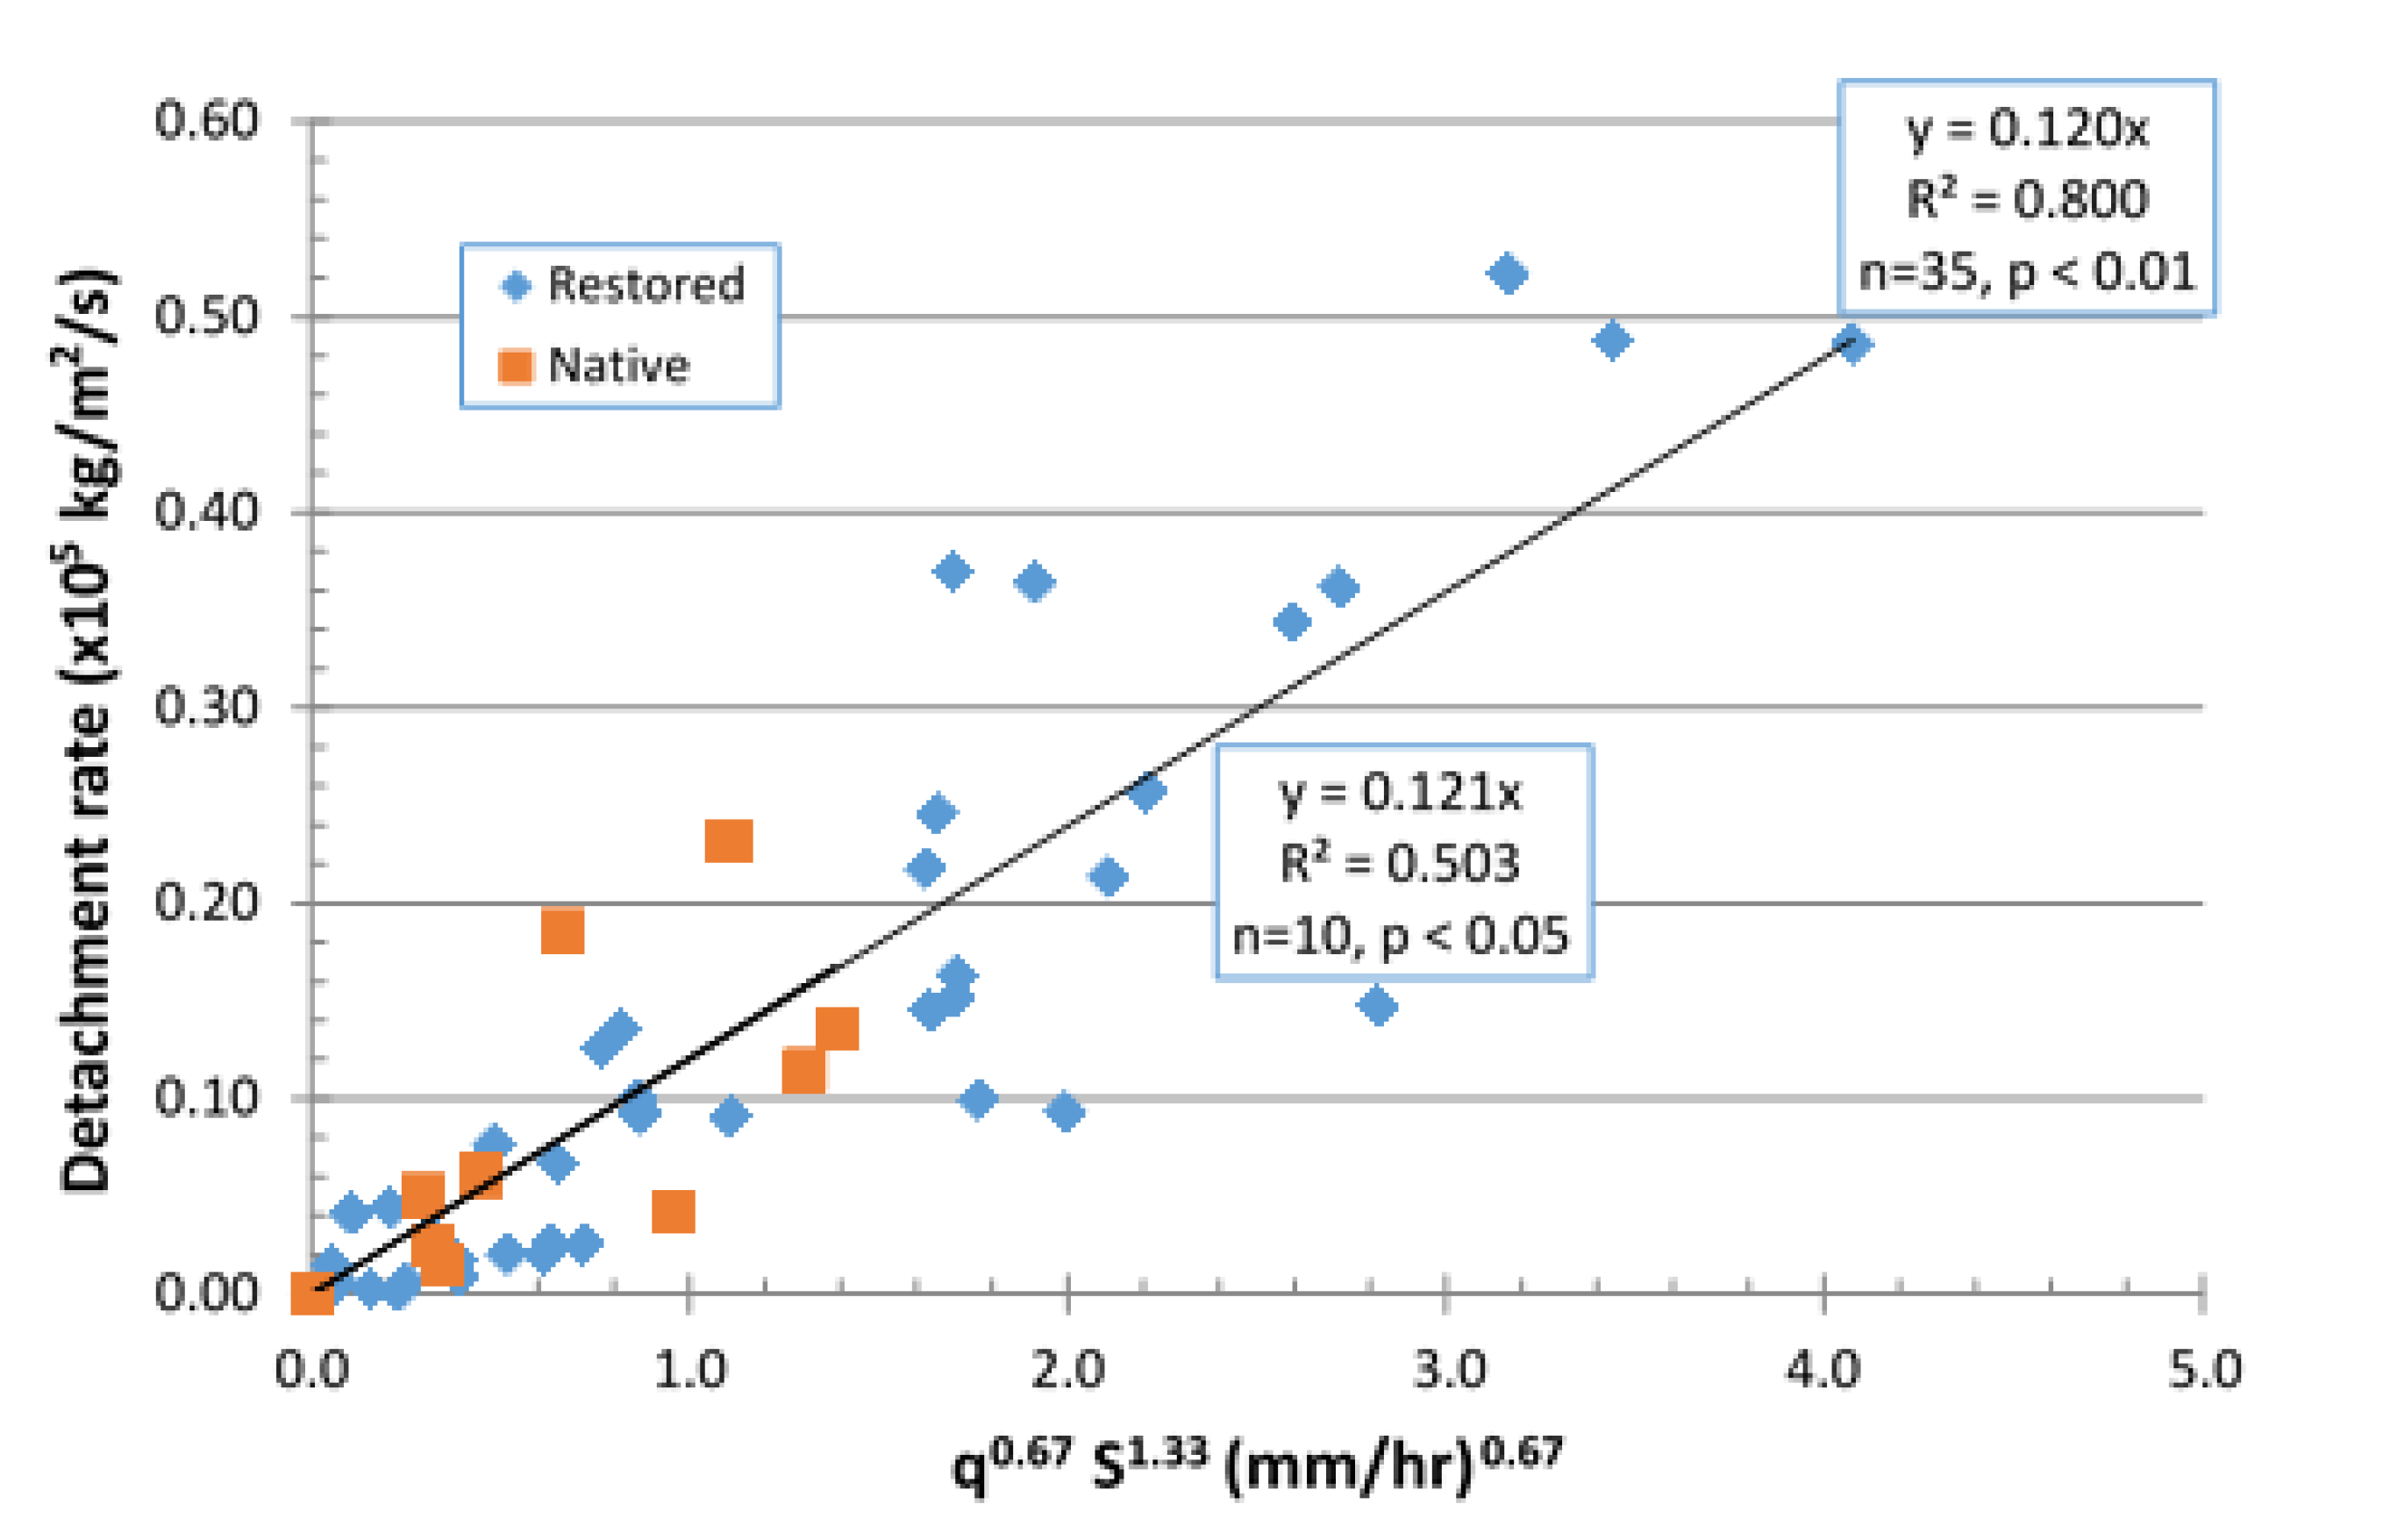
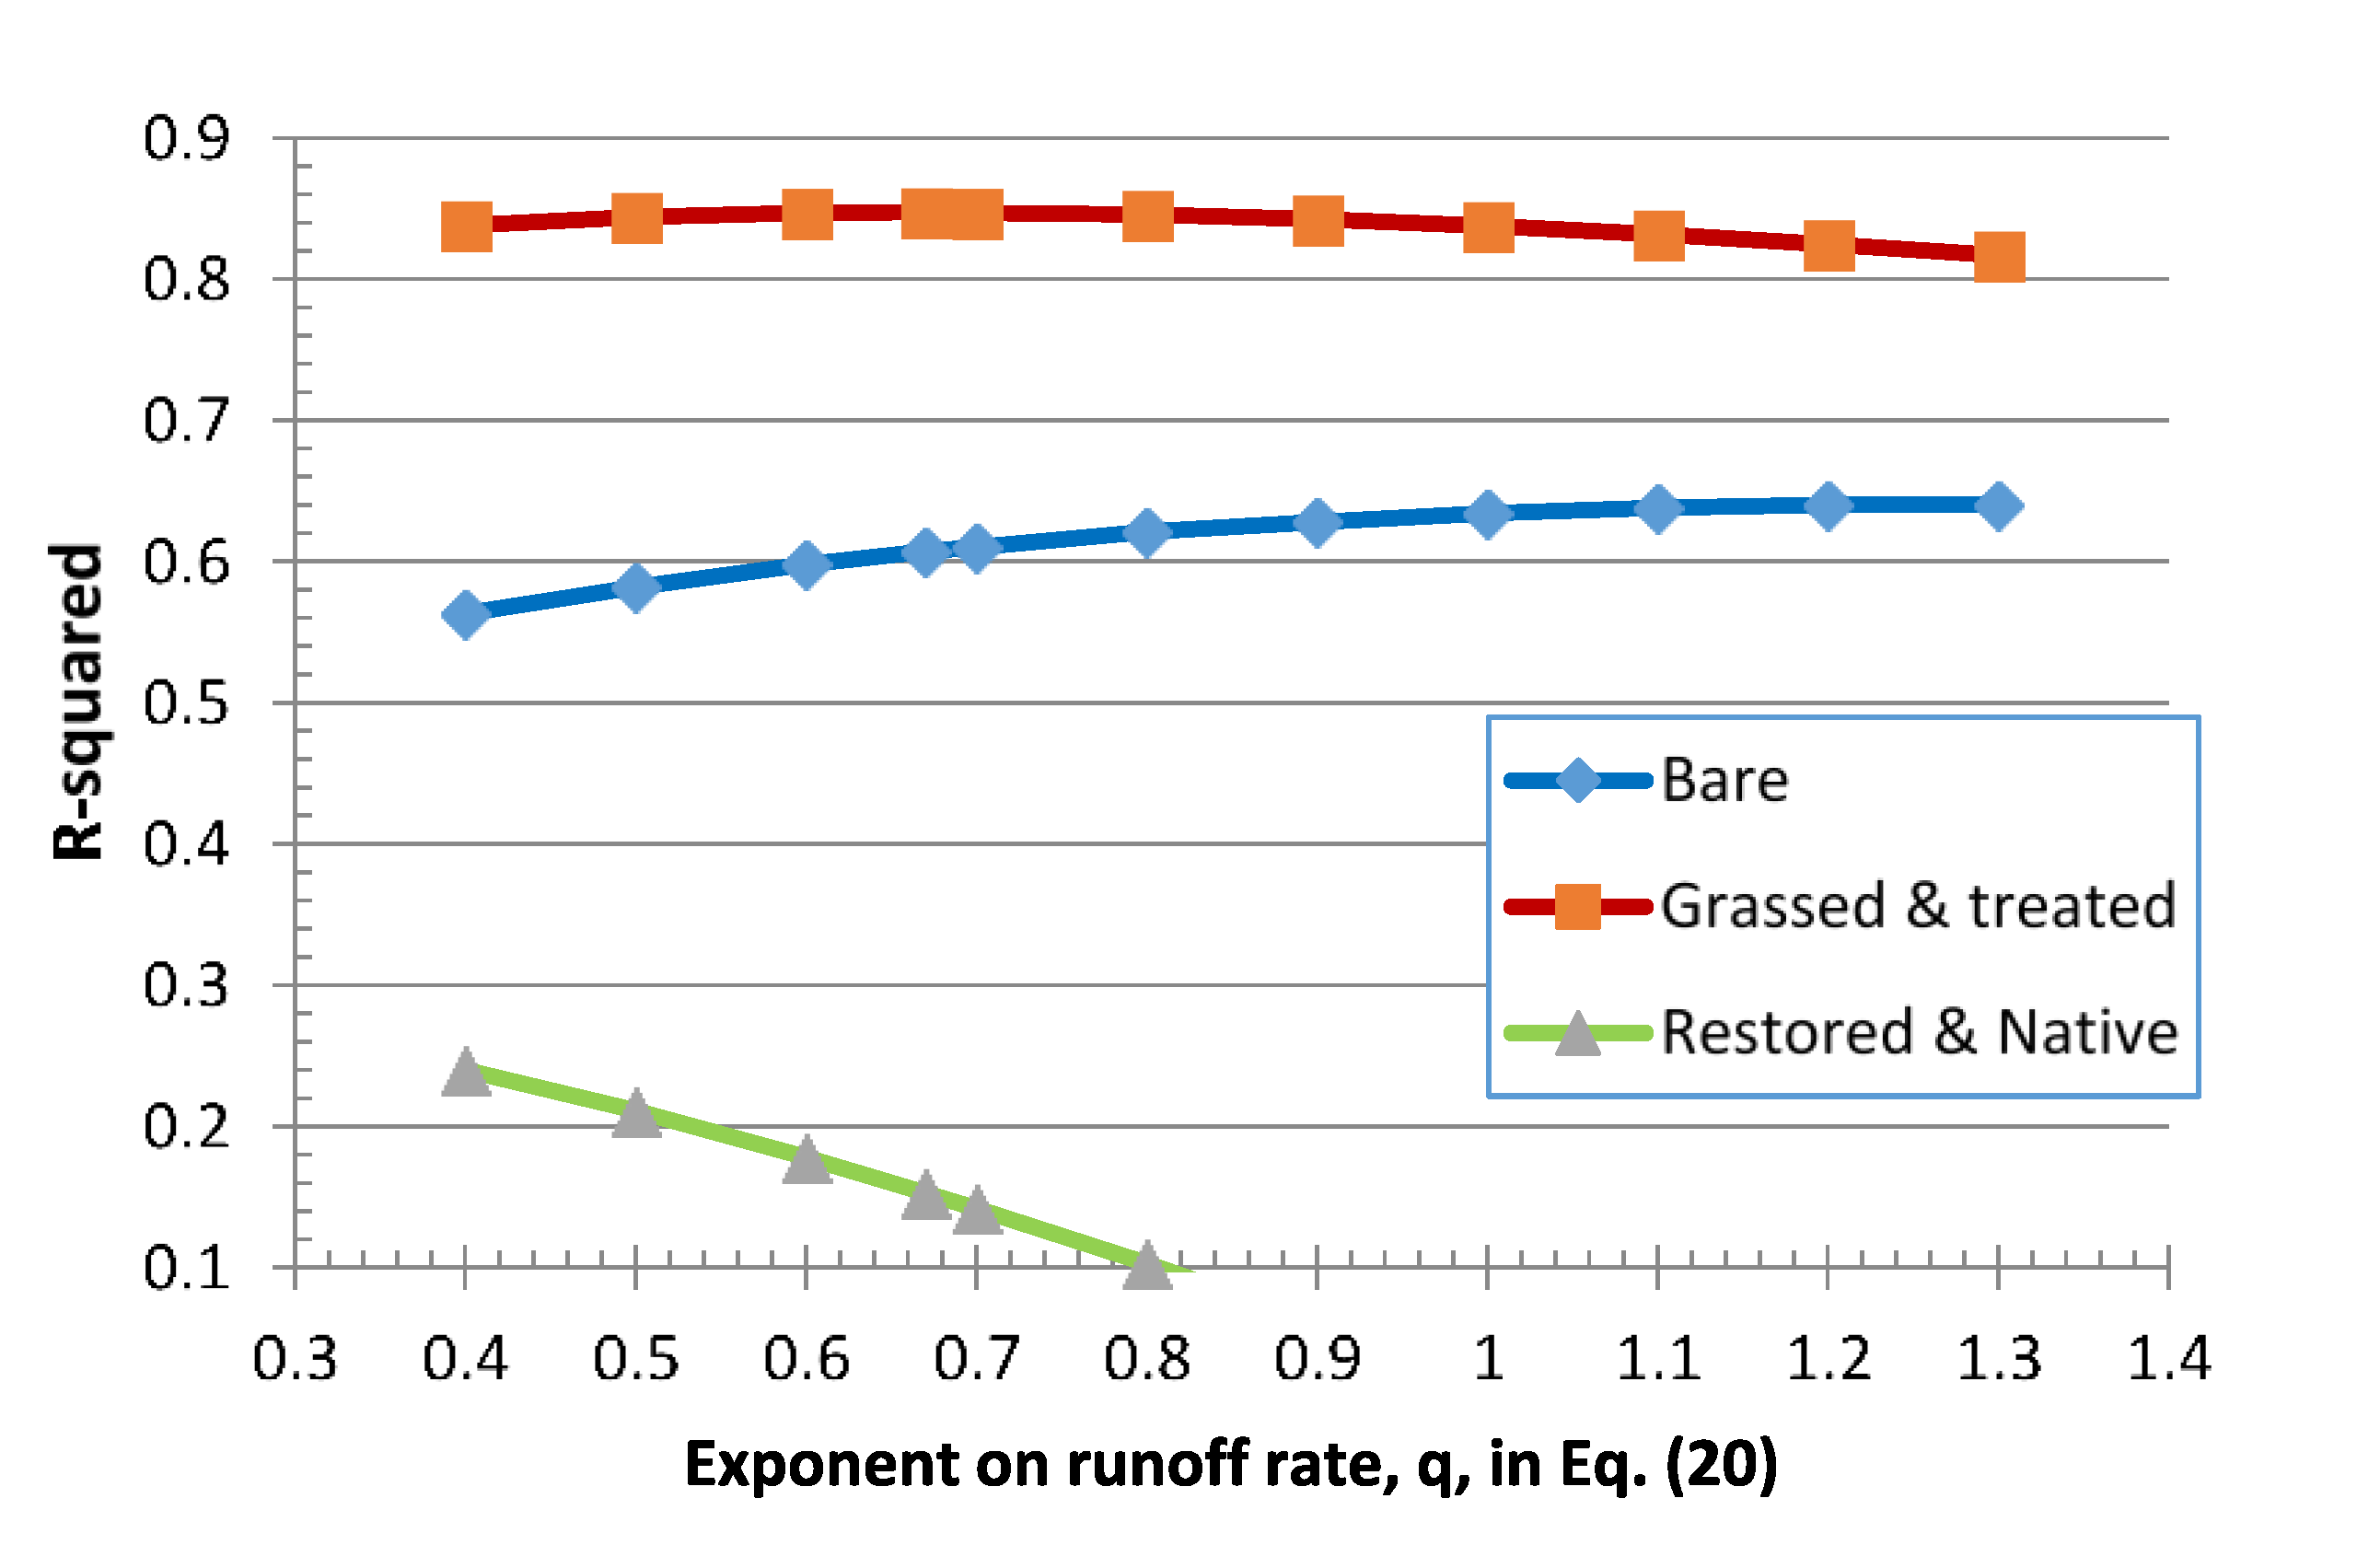
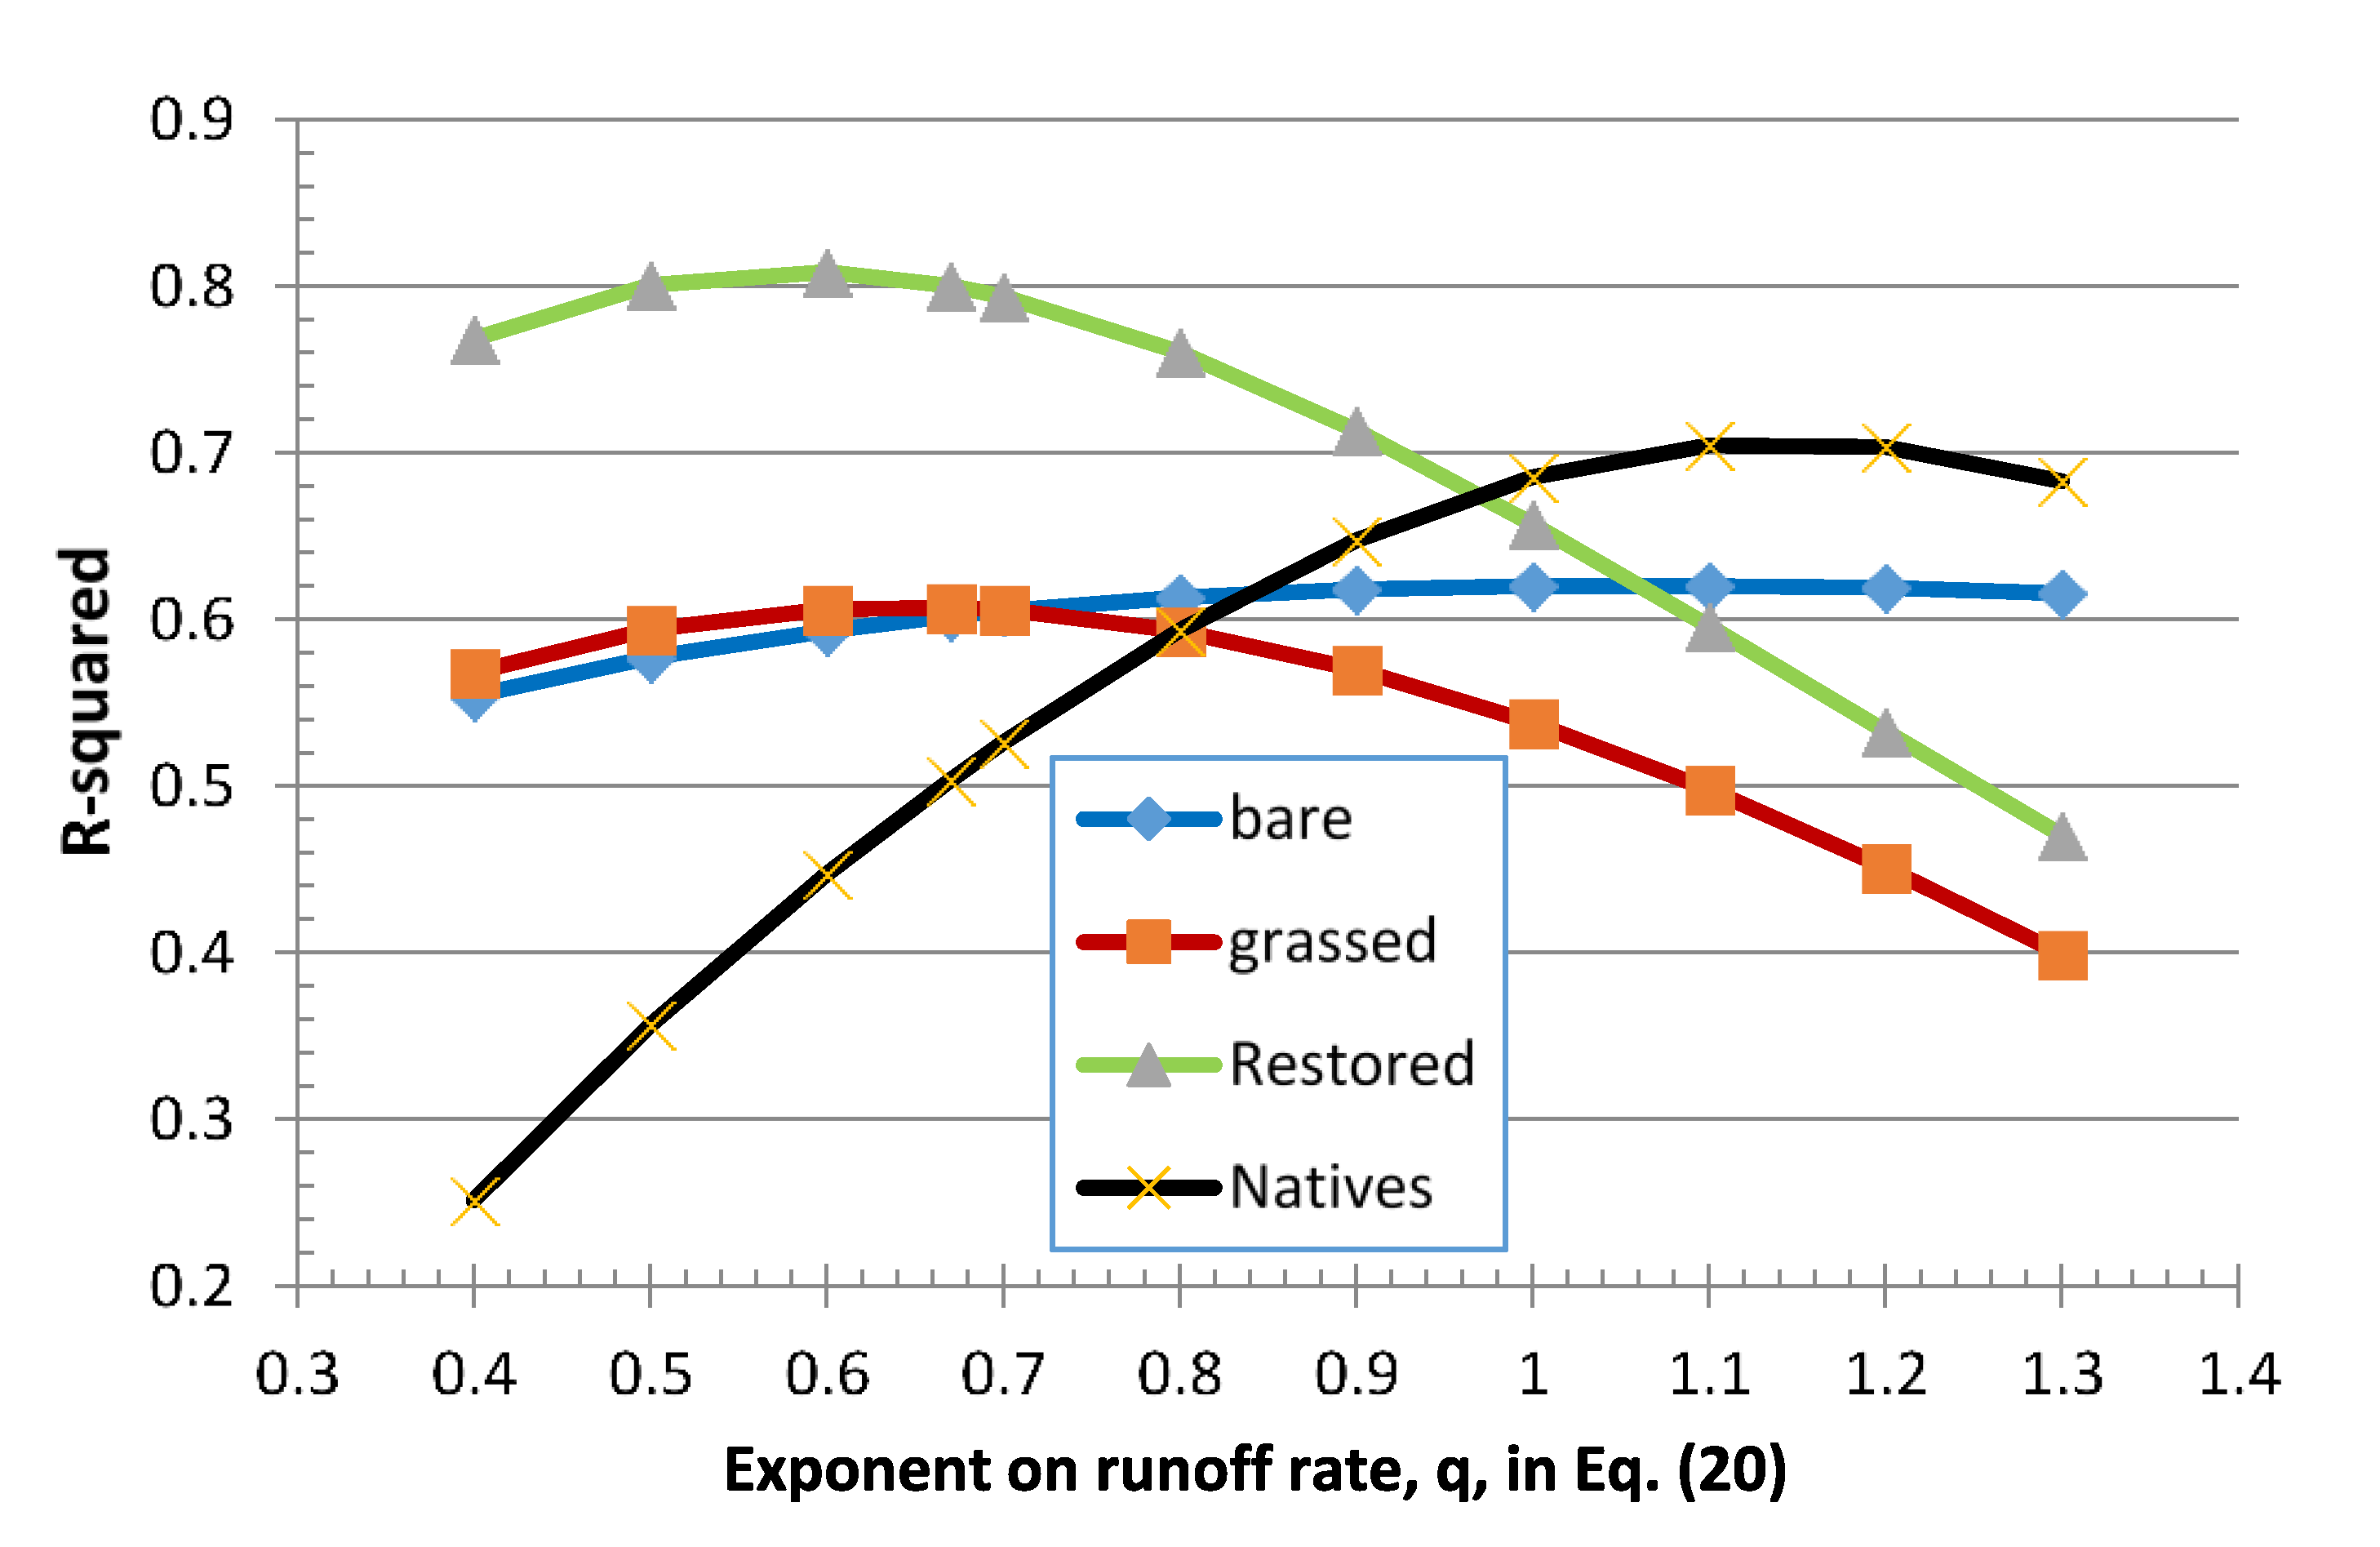
Note that in both Equations (19) and (20), slope, S, has a practically the same effect on stream power, hence detachment rate, whether the flow is laminar or turbulent; that is, P is proportional to S~1.3. However, the runoff rate under laminar flow conditions has a much greater affect than that under turbulent flow conditions (i.e., P is proportional to q0.67 as compared to q0.4), as do the unit weight and plot dimensions (though offset to some degree by ‘n’). Nonetheless, in terms of practical analyses of RS plot runoff and erosion data, when rain splash impacts are negligible, it is apparent that the soil particle detachment rate is proportional to ~S1.3 and q a , where ‘a’ takes on a value between 0.4 and 0.7.
Experimentally, the dependence of stream power on slope between laminar and turbulent flow is not well articulated. In fact, at slopes of 4%–12%, McCool et al. [37] found soil loss rates dependent on S1.37–S1.5, rather than S~1.3. In flume studies, Zhang et al. [38] found across a slope range of 3%–47% their detachment data was proportional to q2.04 S1.27 suggesting that both Equations (19) and (20) may underestimate the effects of runoff rate. At small slopes, detachment rate was more sensitive to q than S, however, as S increased, its influence on detachment rate increased. Later, Zhang et al. [39] found that for undisturbed “natural” soils across a similar slope range (9%–47%), detachment rates were most proportional to q0.89 S1.02. In contrast, on nearly flat slopes (1%–2%) with deep flow depths (~10 mm), Nearing and Parker [40] found that turbulent flow resulted in far greater soil detachment rates than did laminar flow, in part as a result of greater shear stresses. Following Gilley and Finkner [29], Guy et al. [41] examined the effects of raindrop impact on interrill sediment transport capacity in flume studies at 9%–20% slopes. Assuming a laminar flow regime, they found that raindrop splash accounted for ~85% of the transport capacity, in some contrast to earlier studies indicating that raindrop impact had little or no effect on slopes greater than about 10%. Sharma et al. [42,43,44] systematically examined rain splash effects on aggregate breakdown and particle transport in the laboratory but did not relate their results to stream power. At larger slopes, Lei et al. [45] found that both slope and runoff rate were important towards transport capacity on slopes up to about 44%, but that transport capacity increased only slightly at still steeper slopes. Zhang et al. [39] found the best linear regression quantifying soil detachment rates occurred for equations that included the square of the rainfall rate (I2) times the WEPP slope factor, or I times the runoff rate and slope, S, as compared to I times the square root of the runoff rate times S0.67. This observation of a better fit with the first two equations suggested that detachment rate is proportional to stream power. Similarly, considering soil detachment from overland flow only across a range of burned, disturbed and relatively undisturbed rangeland soils with slopes of 6%–57%, Al-Hamdan et al. [35] found that detachment rates were proportional to P1.18, but that the exponent of 1.18 did not differ significantly from unity. Gabriels [34] found that detachment rates were related to P1.3 for a range of clay fractions of 7%–41%, an exponent value consistent with that for the plot slope in Equations (19) and (20). In the RS plot studies considered here, we assume that detachment rates are proportional to S~1.3 and then determine the optimal exponent applicable to the runoff rate.

2. Experimental Methods—Infiltration–Runoff and Hydraulic Conductivity Measurements in the Field

In the analyses here, we use field data collected from 423 RS plots and associated measurements of hydraulic conductivity for which overviews of the methodologies and some results were described elsewhere [46,47,48,49,50,51]. While most of the Lake Tahoe Basin (See Figure 3) soils are of andesitic or granitic origin and of sandy textures from soil surveys (Table 1), we have found that the surface soils can be broadly classified as coarser-textured “granitics” and finer-textured “volcanics” (Table 2). In addition to the 1 m and 3 m tall drop-former (DF) type RSs used here, we also include information from the USDA-FS sprinkler RS described by Foltz et al. [52]. Table 3 summarizes the field methods and associated references used here to develop the data set considered in the infiltration and soil detachment analyses. The MDI and Precision permeameter methods both involved repeated measurements (5–10 times per hole, or MDI test) and the bore-holes used varied from 150 to 300 mm deep and 70 mm in diameter, with a static water depth of 100–120 mm.

3. Results

3.1. Infiltration–Runoff Field Data

Table 4 and Table 5 summarize the average RS plot characteristics for the granitic plots that both resulted in runoff, or not during the 30–60 min RS tests in the Tahoe Basin, respectively. Similarly, Table 6 and Table 7 summarize the average RS plot characteristics for the volcanic plots that both resulted in runoff, or not during the RS test, respectively. Table 4 and Table 5 also distinguish between non-hydrophobic and hydrophobic RS plot tests within the granitic soils. These data provide a unique opportunity to evaluate application of the combined Infiltration Equations (7) and (8) across a broad range of plot characteristics, such as initial soil moistures ranging from 2% to 12%, rainfall rates from 60–120 mm/h, RS test durations of 10–70 min, plot slopes from 6% to 72% and ponding times from 1–20 min. Also included in this analysis, were RS test plots having clearly identified hydrophobic surface soils; these plots always resulted in quite large ∆θ values. In most cases, the infiltrated depths were obtained at the end of the RS test associated with the infiltrated time to be used in Equation (7).
Finally, Table 8 lists the results of the saturated hydraulic conductivity, Ks measurements completed using the mini-disk infiltrometer (MDI) and Precision Permeameter (PP) devices at the various RS sites around the Tahoe Basin. The two Ks measurement methods yielded very similar results, in general, the average non-hydrophobic Ks values were 970 and 870 mm/h, respectively, for the granitic and volcanic soils, while the hydrophobic MDI Ks values were roughly 10%–40% of the non-hydrophobic values. The measured Ks values are 3–4 times greater than that estimated from particle-size distributions (Table 2), nearly an order of magnitude larger than the NRCS estimates (Table 1) and, as will be discussed later, an order of magnitude larger than the RS derived estimates of Km; however, they are consistent with the measured values of ~900 mm/h for a fine sand surrogate for Tahoe basin soils [21].

4. Discussion

4.1. Estimating Effective Hydraulic Conductivity Km from RS Test Plot Data

Modeling hillslope infiltration and runoff rates requires measurement or estimation of the field effective hydraulic conductivity, Km, some measure of the antecedent soil moisture and moisture retention conditions of the hillslope soils. Data collected from RS plot studies uniquely provides this information from a field-based assessment, though the data collected is used to infer both water retention and hydraulic conductivity parameters. Typically, the Km value is estimated directly from the difference between the measured steady rain and runoff rates, while the infiltrated depth, V, is related to the visual wetting depth at the end of the RS test to estimate the soil water storage capacity. Alternatively, in WEPP modeling efforts, the Km value is determined from that value which by trial and error yields the visual best-fit between the modeled runoff hydrograph assuming a single hillslope flow element and that measured during the RS test. Such a modeling fit to estimate Km that relies on the Green–Ampt formulation of the wetting process, as outlined above in Equations (1)–(4), implicitly uses the infiltrated depth values from the RS test, but not the time-to-ponding/runoff directly, as described in Equation (8). Here, we use the individual RS plot data summarized in Table 4 and Table 6 to simultaneously solve both Equations (7) and (8) using the Km approximation for hd from Figure 1 for sandy soils to determine the Km value that meets both the infiltrated depth and time-to-ponding, tp, requirements. We use time to runoff from the RS test as a conservative estimate of tp. For the data summarized in Table 5 and Table 7 for the plots not generating runoff, hence no tp values, we use the ∆θ value estimated from the visual wetting depth measurements and Equation (7), assuming a wetting hd = 50 mm to determine Km.
Table 9 and Table 10 summarize the steady rain–runoff and infiltration-equation based Km values from the RS runoff plots on granitic and volcanic soils, respectively, while Table 11 summarizes those Km values for the non-runoff RS plots on both soils. Mean Km values determined from the steady rain–runoff and infiltration equation calculations were tested for significant difference based on a two-tailed test at p < 0.01 and p < 0.05, as indicated in the tables. Mean Km value ranges were similar for both soils (10–100 mm/h in the volcanic soils and 20–120 mm/hr in granitic soils), and overall average values were several times greater than the NRCS estimates in Table 1, though 3–4 times less than the particle-size estimated K values (Table 2) and roughly an order of magnitude less than the average permeameter and MDI estimates of K (Table 8). Overall, data collected from 20% to 25% of the RS plots resulted in undeterminable Km values in the simultaneous solution of Equations (7) and (8). As the simultaneous infiltration equation solution is highly sensitive to the time-to-ponding/runoff value, this result suggests that those times estimated during about ¼ of the RS tests may be problematic.
For roughly 80% of the RS sites on both soils, the simpler rain–runoff rate estimate of Km values was essentially equivalent to that obtained from the infiltration equation solution, lending credence to use of the rain–runoff rate estimates of Km for watershed modeling purposes. Considering Km values estimated from Equation (7) for the RS plots lacking runoff, there was some agreement between the rain–runoff rate Km values from the sister plots as indicated in Table 11, but few direct comparisons were available. On the other hand, the overall soil average rain–runoff rate Km values of 73.2 and 68.9 mm/h from the granitic and volcanic runoff RS plots, respectively, were essentially equivalent to the Equation (7) estimates from the non-runoff RS plots of 72.7 and 66.4 mm/h, respectively. Thus, use of the Equation (7), combined with visual estimation of the ∆θ values (e.g., Figure 2), appears to also be a reasonable estimate of Km values for modeling purposes. Finally, to illustrate some of the variability in the comparison between both estimates of Km values as well as determining any possible bias, Figure 4 and Figure 5 show comparisons of the Km values summarized in Table 9 and Table 10, respectively. Interestingly, for the granitic soils, infiltration equation Km values appear to be a slightly greater on average (~3%) as compared to the rain–runoff rate estimates for the granitic soils, while for the volcanic soils, they are on average ~4% less, such that, overall across all RS plots, there appears to be no systematic bias or preference between the two methods of estimating Km values.

4.2. Runoff Erosion Field Data—How Are Sediment Detachment Rates Related to Stream Power?

Perhaps one of the primary purposes of RS plot studies is to estimate surface runoff transport rates of sediment and other contaminants so as to develop the required watershed parameters, or evaluate the relative success of soil restoration efforts. Using sediment detachment rates measured from the short DF RS plots on granitic roadcuts on the south west shore and volcanic soil skiruns of the north shore of Lake Tahoe, we evaluate whether turbulent or laminar flow stream power (Equations (19) or (20)) are appropriate to describe these rates. As summarized in Table 4 and Table 6, these RS test plots were on a broad range of slopes and used rainfall rates from 60 to 120 mm/h, with test durations of 30–60 min. While occasionally there was no runoff from the treated or grassed RS plots, these data were not included in the comparisons; however, multiple non-runoff plots in the restored and native soils were represented by two zero values in the analyses. The soil surface conditions included no cover (bare) to light grasses, treated soils (usually pine-needle or woodchip mulch covers), restored soils (incorporated mulches and tillage) and “native” (relatively undisturbed forest soils adjacent to RS test sites). We graph average RS plot soil detachment rates (×105 kg/m2/s) per condition (usually n = 3) as a function of q0.67S1.328 from Equation (20) to estimate the effective “erodibility” as it depends on stream power in Figure 6 for the granitic soils, and in Figure 7 and Figure 8 for the volcanic soils. Note that the soil detachment rates from the finer-textured volcanic soils are much greater than those from the granitic soils in general. Similarly, considering the linear slopes of the regressions to represent soil “erodibility”, erodibilities from the bare granitic and grassed volcanic soils were roughly equivalent, while those from restored and native (undisturbed) volcanic soils were effectively identical, though about three times greater than equivalently treated or native granitic soils. Lastly, comparing sediment detachment rates as a function of the product of the rainfall rate and stream power dramatically lowered the R2 values in all of the regressions, suggesting that at least for the rainfall rates/energies, infiltration rates and soil cover conditions considered here, rainfall rates had little impact on soil erodibility.
As a means of assessing the hypothesis that laminar flow definition of stream power by Equation (20) better describes the sediment detachment rates than that from turbulent flow assumptions using Equation (19), we examined the regression coefficient variation as it depends on the exponent of the surface runoff rate for the data shown in Figure 6, Figure 7 and Figure 8. It should be noted, of course, that soil detachment rates as determined from the RS plot runoff sediment concentrations result in a degree of self-correlation with runoff rates as both are calculated from the runoff sampling data. Considering the regression coefficient variation provides some insight into the range of stream power exponent values reported in the literature and perhaps why they range from theoretical values. Figure 9 illustrates the dependence of the linear regression R2 value on the exponent of q in Equation (20) for the granitic soils of Figure 6, while Figure 10 illustrates this same dependence for the volcanic RS test plot data shown in Figure 7 and Figure 8. For the granitic RS test plots, the greatest R2 value occurs as predicted by Equation (20) at q0.67 for the grassed and treated RS plots, and this is also near the maximum R2 value for the bare plots. In both cases, however, the R2 values at q0.67 readily exceed those for q0.4 from Equation (19), but the relative dependence of the R2 value is “flat” for exponents ranging from 0.8 to 1.3, as found by Al-Hamdan et al. [35]. The sediment detachment rates from the restored and native granitic RS test plots are so small and variable as to have little discernible dependence on stream power. In the volcanic RS test plots, the greatest R2 value again occurs as predicted by Equation (20) at q0.67 for the grassed and treated RS plots, and this is also near the maximum R2 value for the bare plots. As with the bare granitic RS plot data, the R2 value for the volcanic RS plots has little dependence on the runoff rate exponent at values greater than about 0.8, but these R2 values differ little from that associated with an exponent of 0.67. For the bare and native volcanic RS test plots, the greatest R2 values occur at an exponent of 1.1. In all volcanic RS plots, however, the R2 values at q0.67 readily exceed those for q0.4 from Equation (19), suggesting that, as with the granitic soils, the soil detachment rate is better described by laminar as compared to turbulent flows for the Tahoe soils.
Finally, defining RS plot erodibility as the linear regression slope between soil detachment rates, Di, and laminar stream power, P, or average ratio thereof, the erodibilities likely useful for watershed modeling in the Tahoe basin are summarized in Table 12 from the results shown in Figure 6, Figure 7 and Figure 8. Of course, as the values in Table 12 were derived from the runoff plots from the restored and less-disturbed forest (native) soil conditions, they are likely conservative estimates as there were numerous non-runoff RS plots for these conditions.

4.3. Results & Discussion of Rainfall Simulator Comparisons—Infiltration & Erosion Processes

With the several types of “portable” RS devices used in field plot studies that have a variety of rainfall energies applied to plot areas in the order of one square meter, comparing plot test results (infiltration, runoff and erosion rates) from these different RSs has been a recurring challenge in the literature. Having outlined above possible interpretations methods for determination of infiltration (Km) and erosion parameter averages from the entire range of RS test plots across the Tahoe Basin, here, we consider the more specific site evaluation of RS test plots using different RSs to determine how simulators with different rain energies may affect these parameters. We focus on a direct comparison of the infiltration and erosion results obtained from three RSs used in the basin that have rain drop energies of < ¼ and about ¾ of maximum values (i.e., short and tall drop-former (DF) simulators, respectively) and the greater energy sprinkler RS used by the USFS. We use RS plot data for the short and tall DF RSs at similar Northstar disturbed and treated volcanic soil sites, and likewise, we use plot data for the short DF and USFS RSs at soil forest landings on the west and east shores of the lake. First, we compare soil Km values estimated from steady rain–runoff rates and simultaneous solutions to the infiltration equations, as described above, then we consider the estimated erodibilities (Di/P) from the different RSs, as in Table 12 for the same sites.
In the Northstar area, there were several skirun, or adjacent sites, that included RS tests with both the original tall DF RS and the short DF RS on bare and treated soils from different years. The average plot information for the Northstar sites is in Table 6 for the runoff plots, while the plot-specific erosion information is summarized in Table 13. Overall, the average plot slopes for both DF RS plots were similar, however, the short DF RS plots were subject to rain rates twice as great (120 vs. 60 mm/h) as that for the tall DF RS plots, though with about 30% less impact energy. The average of the 14 Km values estimated from the bare and treated soil plot data for the tall DF RS was, surprisingly, roughly half that for the 11 short DF RS test plots subjected to the much greater rain rate. However, the comparison between infiltration equation and rain–runoff rate estimates are functionally the same, as shown in Figure 11.
Despite the much greater rain impact energies and greater runoff rates from the tall versus short DF RSs, erodibilities expressed as Di/P were only slightly greater for the tall RS plots, though practically the same for these bare volcanic skirun soils (19 × 10−5 vs. 16 × 10−5 s2/m). Similarly, for the lightly covered plots, the short DF RS plots at the Northstar specific site were greater than at the skirun average (~4 × 10⁻⁵ vs. ~2 × 10⁻⁵ s2/m), perhaps due to varying coverages. While mean erodibility values from the tall DF RS for the “treated” plots were twice as great as those from the short DF RS plots (0.53 × 10⁻⁵ vs. 0.27 × 10⁻⁵ s2/m), these values ranged on either side of that mean in Table 12 (0.4 × 10⁻⁵ s2/m) for the short DF RS plots. Moreover, the difference between the means was similar to the variability in values between individual RS plots from either RS, and may have reflected the different years of RS tests or variability in treatments. We note that the average runoff organic matter fraction (OM%) from the treated RS plots was ~25%, suggesting presence of some non-mineral soil cover.
In a more direct comparison of results from different RSs, the short DF RS and the USFS sprinkler RS were used on compacted soil forest landing sites near Ward Creek (volcanic soil) and at Round Hill (granitic soil) using randomly selected plots from within the same area and conducting the RS tests on the same days. The average plot information for these sites is in Table 4 and Table 6 for the runoff plots while the plot-specific erosion information is summarized in Table 14. Overall, the RS plot slopes for the DF RS were about half that for the USFS RS, and the DF RS rain rates were also 10–20 mm/h less, as well as having much smaller rain impact energies as compared to the sprinkler RS. As a result, times-to-runoff and runoff rates from the DF RS plots were smaller than those from the sprinkler RS. Finally, one USFS plot at Round Hill responded completely differently than its sister plots and was not included in the erosion analysis.
When considering Km estimates developed from all RS plot data collected from the two forest landing sites, we found that of the seven USFS RS plots, only three yielded data that enabled computation of Km from the combined infiltration equations, while eight of the nine short DF RS plots yielded calculable Km values. At the Round Hill site, the average Km values from both calculation methods were the same, at about 23 mm/hr. At the volcanic soil Ward Creek site, the DF RS plot average Km values were more than twice that obtained from the neighboring USFS RS plots. Following the same format as in Figure 4 and Figure 5, the forest landings Km values are graphed in Figure 12. Both types of RSs resulted in infiltration equation versus rain–runoff rate estimated Km values fitting the same line as well as being consistent with the WEPP based Km values. Similarly, despite the differing rain impact energies from the two RSs, erodibilities expressed as Di/P were practically the same for the bare granitic soils (~20 × 10−5 s2/m) and the lightly covered plots (~15 × 10−5 s2/m). Erodibility values for the better covered RS plots were approximately 1.9 × 10⁻⁵ s2/m, consistent with the “grass/treated soils” value in Table 12. On the volcanic soils, the bare plot erodibilities differed between the two RSs (~24 × 10−5 vs. 34 × 10−5 s2/m), but well within the variability range encountered in replicate plots results. These erodibility values were roughly two times greater than that from the bare skiruns in Table 12, likely reflecting the greater soil compaction at the forest landings. The one tilled-in mulch plot yielded an erodibility value equal to that average found for the “treated/restored” volcanic skirun soils (Table 12). This treated soil plot suggests the possibility that even the compacted forest landing soils may be “treatable” to the point of returning them to something like native forest soil functionality with respect to infiltration and erosion. Finally, we note that the OM% of the runoff from the DF RS plots were quite high (30%–50%), suggesting that visual assessment of the surface conditions as “bare” or “light coverage” likely overlooked the possibility of an apparent fine mulch/duff organic layer integrated with the mineral soil surface.

5. Summary & Conclusions

A key component of modeling watershed runoff and erosion processes is estimation of surface soil infiltration rates or effective hydraulic conductivities (Km) and erosion rates, as they vary with soil cover/tilth/slope conditions, and seasonally with changing water contents. Portable rainfall simulators (RSs) are essential tools for measuring infiltration, runoff and erosion under a variety of field conditions, and information from RS test plots can provide the infiltration/runoff parameterization required for watershed modeling. Though multiple RS designs for field application exist, no single RS design (including plot runoff frame installation) has emerged as a standard. Here, we develop a simultaneous solution of time-to-ponding/runoff and Green–Ampt type infiltration equations to determine Km, as well as developing a laminar flow-based description of stream power that can be used to determine erodibilities and then apply these analyses to data from 423 RS plots across the Tahoe Basin. Finally, we provide direct infiltration and erosion analysis comparisons of results from three RSs that have different rainfall energies. The overall goal of the analyses was to develop a common assessment method, or approach, to evaluating RS plot data for use in watershed modeling efforts.
With respect to estimation of Km values, the simpler-to-calculate steady rain–runoff rate value was equivalent for all practical purposes to that estimated from infiltration equations. It was possible to calculate infiltration equation based Km values from ~80% of the RS plot data that spanned a wide range of rain rates (60–120 mm/h), runoff rates (2–70 mm/h) and times-to-ponding (1–20 min). However, this effective conductivity, though assumed to be half of the saturated value, was as much as an order of magnitude less than Ks values derived from other field test methods. In terms of developing comparable “erodibilities”, defined here as simply the ratio of sediment detachment rates to stream power, it appears that the laminar flow derived stream power results in a better fit between detachment rate and stream power than that derived from turbulent flow assumptions, and eliminates the need to define ‘n’ and the restriction to <10% slopes associated with the Mannings equation. Applying the laminar flow stream power derivation to the determination of erodibilities enabled comparison of data from RS test plots having a wide range of slopes and runoff rates, as well as from simulators having different rainfall energies. While rain drop impact energy did not appear to be a factor in these analyses, this may stem from the presence of some cover materials, the very high infiltration rates and the lack of aggregation of the Tahoe surface soils. We suggest, as Grismer [50] did, that RS plot studies include measurements of particle sizes and OM% in the runoff collected in order to provide more useful data from which to understand erosional processes and soil restoration efforts.

Conflicts of Interest

The authors declare no conflict of interest.

References

  1. Amerman, C.R. Rainfall simulation as a research tool in infiltration. In Proceedings of the Rainfall Simulator Workshop, Tuscon, AZ, USA, 7–9 March 1979.
  2. Grismer, M.E. Standards vary in studies using rainfall simulators to evaluate erosion. Calif. Agric. 2012, 66, 102–107. [Google Scholar] [CrossRef]
  3. Grismer, M.E. Rainfall Simulation Studies—A Review of Designs, Performance and Erosion Measurement Variability. Review for the Tahoe Science Consortium. 2011, 110. Available online: http://ucanr.org/sites/californiaagriculture/files/145682.pdf (accessed on 1 June 2016).
  4. Iserloh, T.; Ries, J.B.; Arnáez, J.; Boix-Fayos, C.; Butzen, V.; Cerdà, A.; Echeverría, M.T.; Fernández-Gálvez, J.; Fister, W.; Geißler, C.; et al. European small portable rainfall simulators: A comparison of rainfall characteristics. Catena 2013, 110, 100–112. [Google Scholar] [CrossRef] [Green Version]
  5. Gallart, F.; Llorens, P.; Latron, J.; Regüés, D. Hydrological processes and their seasonal controls in a small Mediterranean mountain catchment in the Pyrenees. Hydrol. Earth Syst. Sci. 2002, 6, 527–537. [Google Scholar] [CrossRef] [Green Version]
  6. Hessel, R. Modelling soil erosion in a small catchment on the Chinese Loess Plateau: applying LISEM to extreme conditions. Neth. Geogr. Stud. 2002, 307, 1–21. [Google Scholar]
  7. García-Ruiz, J.M.; Lana-Renault, N.; Beguería, S.; Lasanta, T.; Regüés, D.; Nadal-Romero, E.; Serrano-Muela, P.; López-Moreno, J.I.; Alvera, B.; Martí-Bono, C.; et al. From plot to regional scales: Interactions of slope and catchment hydrological and geomorphic processes in the Spanish Pyrenees. Geomorphology 2010, 120, 248–257. [Google Scholar] [CrossRef] [Green Version]
  8. Pan, C.; Shangguan, Z. Runoff hydraulic characteristics and sediment generation in sloped grassplots under simulated rainfall conditions. J. Hydrol. 2006, 331, 178–185. [Google Scholar] [CrossRef]
  9. Pardini, G.; Gispert, M.; Dunjo, G. Relative influence of wildfire on soil properties and erosion processes in different Mediterranean environments in NE Spain. Sci. Total Environ. 2004, 328, 237–246. [Google Scholar] [CrossRef] [PubMed]
  10. Seeger, M. Uncertainty of factors determining runoff and erosion processes as quantified by rainfall simulations. Catena 2007, 71, 56–67. [Google Scholar] [CrossRef]
  11. Boer, M.; Puigdefábregas, J. Effects of spatially structured vegetation patterns on hillslope erosion in a semiarid Mediterranean environment: a simulation study. Earth Surf. Process. Landf. 2005, 30, 149–167. [Google Scholar] [CrossRef]
  12. Nadal-Romero, E.; Lasanta, T.; Regüés, D.; Lana Renault, N.; Cerdá, A. Hydrological response and sediment production under different land cover in abandoned farmland fields in a Mediterranean mountain environment. Bull. Assoc. Spanish Geogr. 2011, 55, 303–323. [Google Scholar]
  13. Stoffel, M.; Wilford, D.J. Hydrogeomorphic processes and vegetation: Disturbance, process histories, dependencies and interactions. Earth Surf. Process. Landf. 2012, 37, 9–22. [Google Scholar] [CrossRef]
  14. Battany, M.C.; Grismer, M.E. Development of a portable field rainfall simulator system for use in hillside vineyard runoff and erosion studies. Hydrol. Proc. 2000, 14, 1119–1129. [Google Scholar] [CrossRef]
  15. Battany, M.C.; Grismer, M.E. Rainfall runoff, infiltration and erosion in hillside vineyards: Effects of slope, cover and surface roughness. Hydrol. Proc. 2000, 14, 1289–1304. [Google Scholar] [CrossRef]
  16. Lascelles, B.; Favis-Mortlock, D.T.; Parsons, A.J.; Guerra, A.J.T. Spatial and temporal variation in two rainfall simulators: Implications for spatially explicit rainfall simulation experiments. Earth Surf. Process. Landf. 2000, 25, 709–721. [Google Scholar] [CrossRef]
  17. Kinnell, P.I.A. Raindrop-impact-induced erosion process and prediction: a review. Hydrol. Proc. 2005, 19, 2815–2844. [Google Scholar] [CrossRef]
  18. Kinnell, P.I.A. Simulations demonstrating interaction coarse and fine sediment loads in rain-impacted flow. Earth Surf. Process. Landf. 2006, 31, 355–367. [Google Scholar] [CrossRef]
  19. Grismer, M.E. Pore-size distribution and infiltration. Soil Science 1986, 141, 249–260. [Google Scholar] [CrossRef]
  20. Morel-Seytoux, H.J. Application of infiltration theory for determination of excess rainfall hyetograph. Water Resources Bulletin. Am. Water Resour. Assoc. 1981, 17, 1012–1022. [Google Scholar] [CrossRef]
  21. Grismer, M.E. Runoff simulations and watershed modeling. Hydrology 2016, 3, 18–30. [Google Scholar] [CrossRef]
  22. Benjamin, T.B. Wave formation in laminar flow down an inclined plane. J. Fluid Mech. 1957, 2, 554–574. [Google Scholar] [CrossRef]
  23. Ellison, W.D. Soil erosion studies. Part I. Agric. Eng. 1947, 28, 145–146. [Google Scholar]
  24. Fristensky, A.; Grismer, M.E. A modeling approach for ultrasonic soil aggregate stability assessment. Catena 2008, 74, 153–164. [Google Scholar] [CrossRef]
  25. Fristensky, A.; Grismer, M.E. Evaluation of ultrasonic aggregate stability and rainfall erosion resistance of disturbed and amended soils in the Lake Tahoe Basin, USA. Catena 2009, 79, 93–102. [Google Scholar] [CrossRef]
  26. Owoputi, L.O.; Stolte, W.J. Soil detachment in the physically based soil erosion process: A review. ASAE Trans. 1995, 38, 1099–1110. [Google Scholar] [CrossRef]
  27. Foster, G.R.; Meyer, L.D. Transport of soil particles by shallow flow. ASAE Trans. 1972, 15, 99–102. [Google Scholar] [CrossRef]
  28. Bridge, J.S.; Dominic, D.F. Bed load grain velocities and sediment transport rates. Water Resour. Res. 1984, 20, 476–490. [Google Scholar] [CrossRef]
  29. Gilley, J.E.; Finkner, S.C. Estimating soil detachment caused by raindrop impact. ASAE Trans. 1985, 26, 140–146. [Google Scholar] [CrossRef]
  30. Gilley, J.E.; Woolhiser, D.A.; McWhorter, D.B. Interrill soil erosion—Part I: Development of model equations. ASAE Trans. 1985, 26, 147–153. [Google Scholar] [CrossRef]
  31. Gilley, J.E.; Woolhiser, D.A.; McWhorter, D.B. Interrill soil erosion—Part II: Testing and use of model equations. ASAE Trans. 1985, 26, 154–159. [Google Scholar] [CrossRef]
  32. Moore, I.D.; Burch, G.J. Sediment transport capacity of sheet and rill flow: Application of unit stream power theory. Water Resour. Res. 1986, 22, 1091–1107. [Google Scholar] [CrossRef]
  33. Grismer, M.E. Soil Restoration and Erosion Control: Quantitative Assessment in Rangeland and Forested areas. ASABE Trans. Soil Water Centen. Collect. 2007, 50, 1619–1626. [Google Scholar] [CrossRef]
  34. Gabriels, D.M. The Stream Power Concept in Estimating Sediment Transport. Available online: http://indico.ictp.it/event/a12165/session/37/contribution/30/material/0/0.pdf (accessed on 1 June 2016).
  35. Al-Hamdan, O.Z.; Pierson, F.B.; Nearing, M.A.; Williams, C.J.; Stone, J.J.; Kormos, P.R.; Boll, J.; Weltz, M.A. Concentrated flow erodibility for physically based erosion models: Temporal variability in disturbed and undisturbed rangelands. Water Resour. Res. 2012. [Google Scholar] [CrossRef]
  36. Zhang, F.-B.; Wang, Z.-L.; Yang, M.-Y. Validating and Improving Interrill Erosion Equations. PLoS ONE 2014. [Google Scholar] [CrossRef] [PubMed]
  37. McCool, D.K.; Brown, L.C.; Foster, G.R.; Mutchler, C.K.; Meyer, L.D. Revised slope steepness factor for the universal soil loss equation. ASAE Trans. 1987, 30, 1387–1396. [Google Scholar] [CrossRef]
  38. Zhang, G.H.; Liu, B.Y.; Nearing, M.; Zhang, K.L. Soil detachment by shallow flow. ASAE Trans. 2002, 45, 351–357. [Google Scholar]
  39. Zhang, G.H.; Liu, B.Y.; Liu, G.B.; He, X.; Nearing, M. Detachment of undisturbed soil by shallow flow. Soil Sci. Soc. Am. J. 2003, 67, 713–719. [Google Scholar] [CrossRef]
  40. Nearing, M.A.; Parker, S.C. Detachment of soil by flowing water under turbulent and laminar conditions. Soil Sci. Soc. Am. J. 1994, 58, 1612–1614. [Google Scholar] [CrossRef]
  41. Guy, B.T.; Dickinson, W.T.; Rudra, R.P. The roles of rainfall and runoff in the sediment transport capacity of interrill flow. ASAE Trans. 1987, 30, 1378–1386. [Google Scholar] [CrossRef]
  42. Sharma, P.P.; Gupta, S.C.; Foster, G.R. Predicting soil detachment by raindrops. Soil Sci. Soc. Am. J. 1993, 57, 674–680. [Google Scholar] [CrossRef]
  43. Sharma, P.P.; Gupta, S.C.; Foster, G.R. Raindrop-induced soil detachment and sediment transport from interrill areas. Soil Sci. Soc. Am. J. 1995, 59, 727–734. [Google Scholar] [CrossRef]
  44. Sharma, P.P.; Gupta, S.C.; Rawls, W.J. Soil detachment by single raindrops of varying kinetic energy. Soil Sci. Soc. Am. J. 1991, 55, 301–307. [Google Scholar] [CrossRef]
  45. Lei, T.W.; Zhang, Q.W.; Zhao, J. A laboratory study on sediment transport capacity in the dynamic process of rill erosion. Trans. ASAE 2001, 44, 1537–1542. [Google Scholar]
  46. Grismer, M.E.; Hogan, M.P. Evaluation of Revegetation/Mulch Erosion Control Using Simulated Rainfall in the Lake Tahoe Basin: 1. Method Assessment. Land Degrad. Dev. 2004, 13, 573–588. [Google Scholar] [CrossRef]
  47. Grismer, M.E.; Hogan, M.P. Evaluation of Revegetation/Mulch Erosion Control Using Simulated Rainfall in the Lake Tahoe Basin: 2. Bare Soil Assessment. Land Degrad. Dev. 2005, 16, 397–404. [Google Scholar] [CrossRef]
  48. Grismer, M.E.; Hogan, M.P. Evaluation of Revegetation/Mulch Erosion Control Using Simulated Rainfall in the Lake Tahoe Basin: 3. Treatment Assessment. Land Degrad. Dev. 2005, 16, 489–501. [Google Scholar] [CrossRef]
  49. Grismer, M.E.; Ellis, A.L.; Fristensky, A. Runoff Sediment Particle-sizes associated with Soil Erosion in the Lake Tahoe Basin, USA. Land Degrad. Dev. 2008, 19, 331–350. [Google Scholar] [CrossRef]
  50. Grismer, M.E.; Shnurrenberger, C.; Arst, R.; Hogan, M.P. Integrated Monitoring and Assessment of Soil Restoration Treatments in the Lake Tahoe Basin. Environ. Monit. Assess. 2009, 150, 365–383. [Google Scholar] [CrossRef] [PubMed]
  51. Rice, E.C.; Grismer, M.E. Dry-season soil-water repellency effects on infiltration rates in the Tahoe Basin. Calif. Agric. 2010, 64, 141–148. [Google Scholar] [CrossRef]
  52. Foltz, R.B.; Luce, C.H.; Stockton, P. The Kinetic Energy Field Under a Rainfall Simulator. In Watershed Management Planning for the 21st Century; Committee on the Water Resources Engineering Division/ASCE: San Antonio, TX, USA, 1995. [Google Scholar]
  53. NRCS, Soil Survey Staff, USDA. Soil Survey of the Tahoe Basin Area, California and Nevada, 2007. Available online: www.websoilsurvey.nrcs.usda.gov (accessed on 7 June 2016).
  54. Robichaud, P.R.; Lewis, S.A.; Ashmun, L.E. New Procedure for sampling infiltration to assess post-fire soil water repellency; U.S. Department of Agriculture, Forest Service, Rocky Mountain Research Station: ReFort Collins, CO, USA; p. 14. 2008.
  55. Johnson, L.K. Precision Permeameter Manual; Measuring saturated hydraulic conductivity of earthen materials in the vadose zone. Unpublished material. 2001. [Google Scholar]
  56. Zangar, C.N. Theory and Problems of Water Percolation; United States Bureau of Reclamation: Washington, DC, USA, 1953.
Figure 1. Relationship between field-saturated hydraulic conductivity, Km, and displacement pressure head, hd, for fine sands (data taken from Grismer, [19]).
Hydrology 03 00023 g001
Figure 2. RS (rainfall simulation) plot infiltrated vs. visible wetting depths at Heavenly LT site (granitic soils).
Hydrology 03 00023 g002
Figure 3. Lake Tahoe basin map (http://www.americansouthwest.net).
Hydrology 03 00023 g003
Figure 4. Dependence of Infiltration Equation Km values on Rain–Runoff rates for granitic soil RS plots having runoff.
Hydrology 03 00023 g004
Figure 5. Dependence of Infiltration Equation Km values on Rain–Runoff rates for volcanic soil RS plots having runoff.
Hydrology 03 00023 g005
Figure 6. Comparison between and stream power variables for granitic RS plots on the southwest shore of Lake Tahoe.
Hydrology 03 00023 g006
Figure 7. Comparison between and stream power variables for bare and grass-covered volcanic RS plots on the northwest shore of Lake Tahoe.
Hydrology 03 00023 g007
Figure 8. Comparison between and stream power variables for bare and grass-covered volcanic RS plots on the northwest shore of Lake Tahoe.
Hydrology 03 00023 g008
Figure 9. Dependence of linear regression R2 values on exponent of runoff rate in stream power function when related to soil detachment rates from granitic RS plots.
Hydrology 03 00023 g009
Figure 10. Dependence of linear regression R2 values on exponent of runoff rate in stream power function when related to soil detachment rates from volcanic RS plots.
Hydrology 03 00023 g010
Figure 11. Dependence of Infiltration-equation Km values on Rainfall–Runoff rates for the short and tall DF type RS at Northstar ski area (volcanic soils).
Hydrology 03 00023 g011
Figure 12. Dependence of Infiltration equation Km values on Rainfall-Runoff rates for the short DF and Sprinkler type RSs from tests plots at Ward Creek and Round Hill forest landings.
Hydrology 03 00023 g012
Table 1. Typical Tahoe soils encountered in the field measurements [53].
RS SitesSoil SeriesTaxonomic ClassificationSurface TexturepHConductivity (mm/h)
Bliss SP & Rubicon—graniticMeeksSandy-skeletal, mixed, frigid Humic Dystroxereptsvery stony loamy coarse sand6.1–6.516–51
Blackwood Cyn—volcanicWacaMedial-skeletal, amorphic, frigid Humic Vitrixerandscobbly coarse sandy loam5.6–6.55.1–16
Brockway & Dollar Hill—volcanicJorge-TahomaFine-loamy, isotic, frigid Ultic or amorphic, frigid Ultic Haploxeralfsvery stony sandy loam5.1–6.05.1–16
Table 2. Summary of sieved particle-size distribution measurements for the Tahoe Basin disturbed soils (>63 μm size fraction) and estimated Ksat values. From Grismer and Hogan [46].
Soil TypenD10 (μm)D30 (μm)D60 (μm)a Cub Ksat (mm/hr)
Graniticmean33117.1322.5946.48.23332
Std. Deviation (c CV %)3320.4 (17.4)73.9 (22.9)208 (22.0)1.96 (23.8)116 (34.8)
Volcanic—mean56100278132013.6248
Std. Deviation (CV %)5623.2 (23.2)120 (43.3)568 (48.5)6.58 (53.1)125 (50.4)
a Cu is the Coefficient of Uniformity = D60/D10; in geotechnical engineering, Cu > 4 indicates “well-graded” (i.e., broad range) of particles sizes; b Ksat = (Constant)xD102 from Harleman et al. [53]; c CV = Standard Deviation/Mean.
Table 3. Summary of field measurement methodologies used to develop the datasets considered in the infiltration, soil detachment and RS comparisons analyses.
Device/MethodDescriptionParameters MeasuredReference
1 m Tall Drop–Former RS
(~21% of terminal velocity raindrops)
1 m2 Needle tank RS raining on 0.8 × 0.8 m2 plotRain rate, wetting depth, soil moisture, time-to-ponding, runoff rate, runoff particle size distributions and sediment & OM concentrationsGrismer & Hogan [46]
3 m Tall Drop–Former RS
(~70% of terminal velocity raindrops)
1 m2 Needle tank RS raining on 0.8 × 0.8 m2 plotRain rate, surface roughness, time-to-ponding, runoff rate, runoff sediment concentrationsBattany & Grismer [14,15]
Grismer & Hogan [46]
Modified Purdue sprinkler RS (USDA–FS)Single oscillating VeeJet nozzle RS raining on 1 m2 plotRain rate, time-to-ponding, runoff rate, runoff sediment concentrationsFoltz et al. [52]
Decagon Mini-Disk Infiltrometer (MDI)Surface infiltrometer with ceramic diskSaturated conductivity (Ks) with & without surfactantsRobichaud et al. [54] Rice & Grismer [51]
Precision PermeameterBore-hole method using mariotte siphon on graduated cylinderSaturated conductivity (Ks) of near surface soilsJohnson [55]
Glover solution in Zanger [56]
Table 4. Summary of RS plot setting data averages for granitic soil plots generating runoff.
Granite Soil Site Descriptions—Non-Hydrophobic PlotsnRain Rates (mm/h)Initial Moisture (%)Average Slope (%)Mean Time to Runoff (min)Infilt Depth (mm)Infilt Time (min)Mean ∆θSt.Dev. ∆θ
Bliss SP RC—bare460ND64.33.513.6815NDNA
Bliss SP RC—treated360ND57.51414.815NDNA
CalTrans BS Plots372–120ND30.210.928.918.0NDNA
Cave Rock/Incline Village RC10602.359.27.035.737.80.200.13
Heavenly CAN LT—2005472–1202.316.95.345.330.0NDNA
Heavenly CAN LT—20061120ND17.15.725.830.00.49NA
Heavenly CAN LT—2007672–120ND18.12.961.330.00.420.10
Heavenly GB MSR & OLB 171204.025.38.169.936.20.360.16
Heavenly LRR 61204.225.86.690.746.5NDNA
Heavenly LT—2006372–902.422.93.237.528.3NDNA
Heavenly PON/MCD572–1204.223.54.627.323.00.410.16
Heavenly STC51204.435.83.439.521.50.930.23
Luther Pass RC1260ND51.52.6412.415NDNA
Mammoth71204.834.97.150.727.70.300.14
Meyers RC772–1202.330.03.981.822.0NDNA
Roundhill landing565–701.06.26.933.652.90.380.14
Roundhill landing—USFS4861.015.63.026.260.0NDNA
Rubicon RC, treated & native1260ND49.310.314.215.0NDNA
Truckee Bypass672–1201.026.216.344.531.10.370.09
Upper Cutthroat 1D & 2T772–902.76.06.530.822.60.280.04
Upper Cutthroat 3T41202.75.117.789.946.10.540.33
Upper Cutthroat 4T & 6T41206.69.819.478.743.70.630.34
Upper Cutthroat 7T31202.07.35.136.925.90.370.09
Upper Cutthroat 8T61206.312.74.833.821.50.230.09
Angora Fire 872ND17.68.225.520.31.190.35
Bliss SP & Meyers RC—water61202.412.72.591.060.06.234.32
Heavenly LT—Natives—2006 3722.227.31.46.88.6NDNA
Upper Cut. 10T & 11T 31204.46.414.3110.055.81.280.69
Upper Cut. 3N—natives 472–1204.84.81.39.922.21.120.70
ND = No Data and NA = Not Applicable.
Table 5. Summary of RS plot setting data averages for granitic soil plots not generating runoff.
nRain Rates (mm/h)Initial Moisture (%)Avg. Slope (%)Infilt Depth (mm)Infilt Time (min)Mean ∆θSt.Dev. ∆θ
Granite Soil Site Descriptions—Non-Hydrophobic Plots
CalTrans OP Plots372–120ND37.452.330.0NDNA
Cave Rock–Inc. Village RCs4601.2953.130.030.00.59NA
Heavenly CAN LT 1072–1201.7014.982.439.3NDNA
Heavenly CAN LT 1372–120ND17.9102.951.40.430.11
Heavenly GB MSR & OLB 11203.5634.792.046.0NDNA
Heavenly STC11204.027.890.045.00.39NA
Mammoth21204.3938.490.045.00.590.08
Meyers RC490–1202.528.748.830.0NDNA
Roundhill landing1551.06.750.455.00.25NA
Truckee Bypass972–1202.728.557.330.00.270.07
Upper Cutthroat 3T2725.386.869.858.20.470.05
Upper Cutthroat 4T & 6T11205.65.990.045.00.80NA
Upper Cutthroat 8T41205.779.6105.658.60.530.28
Granite Soil Site Descriptions—Hydrophobic plots
Bliss SP & Meyers RC—surfactant61202.6012.6120.060.00.820.30
Angora Fire172ND21.372.060.01.29NA
Upper Cut. 10T & 11T61205.057.576.838.41.500.59
ND = No Data and NA = Not Applicable.
Table 6. Summary of RS plot setting data averages for volcanic soil plots generating runoff.
Volcanic Soil Site DescriptionsnRain Rates (mm/h)Initial Moisture (%)Average Slope (%)Mean Time to Runoff (min)Infilt Depth (mm)Infilt Time (min)Mean ∆θSt.Dev. ∆θ
Blackwood Canyon–Truckee (hydrophobic)81201.8912.518.2105.960.00.680.16
Brockway Summit—20061729.5042.118.235.030.80.40NA
Brockway Summit—2003660ND51.03.512.315NDNA
Dollar Hill—Tall RS46111.4652.24.1513.8315NDNA
Homewood #31 Rd4725.518.54.825.322.70.240.03
Homewood LL A&B Rd 61205.037.55.143.022.80.260.02
Homewood MAR Rd91203.0030.73.633.518.80.280.13
Homewood SCD RD&BK Rd91205.328.55.043.820.40.320.09
Homewood WDG Rd81209.922.53.217.59.80.400.19
Northstar—small RS2604.7549.28.024.226.50.25NA
Juniper Mtn Skirun560–754.2036.44.415.415.80.470.07
Juniper Mtn Skirun—WCs3100–1258.6735.49.341.022.81.580.40
Northstar—Tall RS7607.653.35.621.121.60.200.04
Northstar—bare ski Tall RS1360NA35.85.214.116.80.230.06
Homewood—Tall RS18603.742.59.619.522.40.140.13
Northstar BP CON plots 21203.9519.417.479.640.80.36NA
Northstar LT1272–1202.934.48.535.623.8NDNA
Northstar STA plots 31205.342.62.723.112.60.480.06
Northstar Unit 721203.7539.74.444.823.8NDNA
Ward Cr. Landing—IERS47010.07.46.438.344.20.490.15
Ward Cr. Landing—USFS39110.018.12.126.160.0NDNA
ND = No Data and NA = Not Applicable.
Table 7. Summary of RS plot setting data averages for volcanic soil plots not generating runoff.
Volcanic Soil Site Descriptions–nRain Rates (mm/h)Initial Moisture (%)Mean Slope (%)Infilt Depth (mm)Infilt Time (min)Mean ∆θSt.Dev. ∆θ
Blackwood–Truckee (Surf)41201.7012.5120.060.00.620.21
Brockway Summit plots51202.2145.651.226.70.340.01
Northstar—Short RS5606.953.230.829.50.480.18
Northstar—Tall RS7608.955.739.638.20.300.08
Homewood—Tall RS260ND20.941.041.00.12NA
Juniper Mtn Skirun1660–1257.4638.742.430.0NDNA
Northstar BTD & BP CON41202.6119.690.045.00.340.03
Northstar LT672–1202.332.444.030.0NDNA
Northstar Unit 7—Short RS975–1203.8140.654.330.0NDNA
ND = No Data and NA = Not Applicable.
Table 8. Summary of hydraulic conductivity measurements associated with RS plots.
DeviceRS Test Runoff?Mean Ks (mm/h)CoV Ks (%)
RS Sites—Granitic Soil
Bliss SPPPYes8968.7
Luther PassPPYes82812.1
RubiconPPYes62727.5
Bliss/Meyers—w/surfactantMDINo138644.5
Angora Fire—w/ surfactantMDINo109342.9
Bliss/Meyers hydrophobicMDIYes376118
Heavenly LT—hydrophobicMDIYes14343.4
RS Sites—Volcanic Soil
Blackwood Cyn -Truckee –hydrophobic plotsMDIYes412125
Brockway Summit—2006PPYes72943.1
Brockway Summit—2003PPYes55824.1
Dollar Hill—Tall RSPPYes8839.64
Northstar—Tall RSPPYes90732.3
Homewood—Tall RSPPYes80327.7
Northstar—Tall RSPPNo97823.1
Homewood—Tall RSPPNo76222.0
Blackwood–Truckee—w/surf.MDINo87134.3
Brockway—w/surfactantMDINo131142.4
Table 9. Summary of steady Rain–Runoff and Infiltration Eq. Km values for granitic RS plots having runoff.
Non-hydrophobic PlotsRain—Runoff Km (mm/h)CoV Km (%)Infilt-Eq. Km (mm/hr)CoV Km (%)# of UD a Km
Bliss SP RC—bare 47.1 c7.2140.285.10
Bliss SP RC—treated55.48.7054.6NA b2
CalTrans BS Plots89.921.5UDNA3
Cave Rock/Incline Village RC49.917.056.430.90
Heavenly CAN LT—2005 83.7 d27.210136.70
Heavenly CAN LT—200695.9NAUDNA1
Heavenly CAN LT—200796.923.897.6NA5
Heavenly GB MSR & OLB97.021.999.262.77
Heavenly LRR 1105.010855.11
Heavenly LT—200679.910.897.09.20
Heavenly PON/MCD60.445.757.244.80
Heavenly STC99.39.510433.30
Luther Pass RC43.216.743.519.20
Mammoth1089.710844.11
Meyers RC81.818.182.933.70
Roundhill landing- 26.539.019.183.21
Roundhill landing—USFS20.247.227.2NA3
Rubicon RC, treated & native48.417.752.810.11
Truckee Bypass72.516.848.5NA4
Upper Cutthroat 1D & 2T67.342.190.624.83
Upper Cutthroat 3T1077.685.212.70
Upper Cutthroat 4T & 6T10622.711051.42
Upper Cutthroat 7T81.77.687.324.90
Upper Cutthroat 8T98.722.511025.62
Angora Fire62.530.635.382.63
Hydrophobic plots
Bliss SP & Meyers RC91.018.7210724.60
Heavenly LT’06—Natives37.038.717.795.50
Upper Cut. 10T & 11T1191.11491.21
Upper Cut. 3N—Natives54.013.141.455.40
a: UD = UnDefined values; no real solution for Km; b: NA = Not Applicable usually because n < 3; c: Mean values highlighted in RED do not differ significantly (p < 0.01); d: Mean values highlighted in BLUE do not differ significantly (p < 0.05).
Table 10. Summary of the steady Rain–Runoff and Infiltration Equation based Km values associated with volcanic RS plots having runoff.
Site DescriptionsRain–Runoff Km (mm/h)CoV Km (%)Infilt. Equation Km (mm/h)CoV Km (%)# of UD a Km
Blackwood Cyn–Truckee 106 c12.611724.92
Brockway Summit—200659.3NA b62.0NA0
Brockway Summit—200336.225.337.442.80
Dollar Hill—Tall RS45.02.239.647.50
Homewood #31 Rd61.81.762.153.00
Homewood LL A&B Rd 1028.910142.80
Homewood MAR Rd86.510.610425.42
Homewood SCD RD&BK Rd85.715.972.9 d67.55
Homewood WDG Rd85.417.288.116.14
Northstar—Short RS48.5NA35.8NA0
Juniper Mtn Skirun40.519.226.0073.10
Juniper Mtn Skirun—WCs10317.095.737.10
Northstar—Tall RS52.544.842.275.80
Northstar—Bare ski Tall RS37.716.928.148.35
Homewood—Tall RS41.024.625.748.311
Northstar BP CON plots 97.6NA87.0NA1
Northstar LT87.326.999.551.43
Northstar STA plots 1026.899.027.50
Northstar Unit 7 102NA77.0NA0
Ward Cr. Landing43.427.247.146.40
Ward Cr. Landing—USFS23.113.79.2NA1
a: UD = UnDefined values; no real solution for Km; b: NA = Not Applicable usually because n < 3; c: Mean values highlighted in RED do not differ significantly (p < 0.01); d: Mean values highlighted in BLUE do not differ significantly (p < 0.05).
Table 11. Summary of Infiltration Equation Km values associated with RS plots not having runoff.
Infilt. Equation Km (mm/h)CoV Km (%)
Granite Soil Sites—Non-Hydrophobic Plots
CalTrans OP Plots79.738.6
Cave Rock—Inc. Village RCs36.3NA a
Heavenly CAN LT 42.429.9
Heavenly CAN LT 63.632.6
Heavenly GB MSR & OLB 97.3NA
Heavenly STC89.6NA
Mammoth96.7NA
Meyers RC58.423.0
Roundhill landing- IERS35.7NA
Truckee Bypass84.918.1
Upper Cutthroat 3T51.90.1
Upper Cutthroat 4T & 6T86.2NA
Upper Cutthroat 8T 91.7 b10.5
Granite Soil Sites—Hydrophobic plots
Bliss SP & Meyers RC—surf115NA
Angora Fire 50.8NA
Upper Cut. 10T & 11T 83.37.0
Volcanic Soil Sites
Blackwood–Truckee (Surf)101NA
Brockway Summit plots97.5NA
Northstar—Short RS40.513.6
Northstar—Tall RS37.212.0
Homewood—Tall RS50.7NA
Juniper Mtn Skirun42.950.4
Northstar BTD & BP CON97.5NA
Northstar LT55.241.3
Northstar Unit 7—Short RS75.224.9
a: NA = Not Applicable usually because n < 3; b: Mean values highlighted in RED between sister runoff plots do not differ significantly (p < 0.01).
Table 12. Summary of stream power (Equation (20)) derived soil erodibility for granitic and volcanic soil RS plots from the southwest and north shores of Lake Tahoe, respectively.
Soil TypeErodibilities for Soil Condition = Di/P (s2/m)
BareGrass CoverTreatedRestored/Native
Granitic3.35 × 10−50.93 × 10−50.15 × 10−5
Volcanic16.0 × 10−52.20 × 10−50.40 × 10−5
Table 13. Summary of plot data for stream power derived soil erodibility for volcanic bare and treated soil RS plots using the tall and short DF type RSs at Northstar ski area.
Soil Condition (Short or Tall DF RS)Slope (%)Steady q (mm/h)SY a (gm/mm)Di × 105 (kg/m2/s)Di/P (s2/m)
Bare soils (Tall DF)60.719.623.219.81.73 × 10−4
42.126.916.619.52.24 × 10−4
37.023.615.616.02.39 × 10−4
31.723.79.49.711.78 × 10−4
25.622.45.85.641.42 × 10−4
Averages39.423.314.114.119 × 10−5
Treated b soils (Tall DF)27.610.90.350.166.07 × 10−6
27.316.20.200.144.04 × 10−6
35.010.90.600.287.64 × 10−6
35.05.70.300.083.12 × 10−6
36.416.70.400.295.55 × 10−6
Averages32.312.10.370.190.53 × 10−5
Light grass soil covers (Short DF)47.724.43.623.823.99 × 10−5
51.015.96.254.335.48 × 10−5
47.920.12.892.522.97 × 10−5
Averages48.920.14.253.564.15 × 10−5
Treated soils (Short DF)34.524.60.160.172.72 × 10−6
31.15.30.160.041.88 × 10−6
32.919.10.260.224.38 × 10−6
31.922.60.150.152.84 × 10−6
35.56.30.140.041.44 × 10−6
35.912.60.160.092.09 × 10−6
33.910.00.260.113.42 × 10−6
Averages33.714.40.190.120.27 × 10−5
a: SY = Sediment yield expressed as mass of sediment per mm of runoff determined from slope of accumulated sediment versus accumulated runoff from the RS plot (Grismer & Hogan, 2004); b: Various combinations of tilled compost, pine needle mulch and wood chips plot covers.
Table 14. Summary of plot data for stream power derived soil erodibility for granitic and volcanic soil forest landing RS plots for short DF RS and USFS sprinkler RS.
Site (DF or USFS RS)Soil ConditionSlope (%)Steady q (mm/h)SY a (gm/mm)Di × 105 (kg/m2/s)Di/P (s2/m)
Round Hill (DF)Bare3.451.10.410.9119.3 × 10−5
Light PN mulch cover6.523.80.981.0115.1 × 10−5
PN mulch cover, grass10.438.10.200.331.93 × 10−5
PN Mulch & WC cover4.754.50.060.141.87 × 10−5
Tilled PNM b & WC cover6.145.20.020.040.42 × 10−5
Round Hill (USFS)Bare17.169.34.538.7220.5 × 10−5
Light PN mulch cover14.269.62.935.6617.0 × 10−5
Light PN mulch cover22.171.93.517.0111.4 × 10−5
Ward Cr. (DF)Bare ~5% mulch cover6.741.21.933.4534.3 × 10−5
PN Mulch & WC cover7.019.50.170.142.23 × 10−5
PN Mulch & WC cover7.014.90.190.122.28 × 10−5
PN Mulch & WC cover8.730.70.180.242.05 × 10−5
Ward Cr. (USFS)Bare ~5% mulch cover10.362.32.864.94924.4 × 10−5
Light PN mulch cover21.271.02.374.6748.11 × 10−5
Light PN mulch cover22.871.61.673.3215.20 × 10−5
a: SY = Sediment yield expressed as mass of sediment per mm of runoff determined from slope of accumulated sediment versus accumulated runoff from RS plot [46]; b: PNM = Pine needle mulch, WC = wood chips plot covers.

