Article

Runoff and Soil Erosion Assessment on Forest Roads Using a Small Scale Rainfall Simulator

Department of Geography, Institute for Integrated Natural Sciences, University Koblenz-Landau, Universitätsstr. 1, D-56070 Koblenz, Germany
Hydrology 2016, 3(3), 25; https://doi.org/10.3390/hydrology3030025
Submission received: 12 February 2016 / Revised: 29 May 2016 / Accepted: 15 June 2016 / Published: 1 July 2016

Abstract

:
Forestry operations can significantly alter hydrological and erosional processes in a catchment. In the course of developing timberland, a network of persistent roads and skid trails causing soil compaction is usually established. Hereby, the infiltration rate of the soil is distinctly reduced, which leads to the generation of overland flow—this may also cause soil erosion. In this study, a small-scale rainfall simulator is used to investigate hydrological and erosional processes on forest roads and skid trails. The results show increased runoff rates on forest roads, up to 25 times higher than on undisturbed forest topsoil. On skid trails, the runoff rates were altered especially in rutted areas (16 times higher) while unrutted parts showed a lesser change (four times higher). With sufficient overland flow, soil erosion rates also rose, particularly when the vegetation cover of the surface was removed: bare road surfaces featured higher mean erosion rates (195 g·m−2) than partly or completely vegetated skid trails (13 g·m−2) and undisturbed sites (5 g·m−2). The findings presented in this study indicate the need for the use of compaction reducing technology during forestry operations and a revegetation of road surfaces in order to minimize the detrimental factor of roads and skid trails on water retention and soil conservation.

1. Introduction

Forestry operations usually go along with the construction of a more or less dense forest road network. These forest roads feature soil properties that differ significantly from adjacent undisturbed topsoil. In the course of establishing a sufficient trafficability, different actions are taken to ensure a stable and durable road surface. The most commonly realized method of forest road construction is a simple grading, which produces a solid surface out of the in-situ soil without the addition of other construction material. If there is a need for a more stable road surface, for instance because of heavy traffic or on steep road segments, an additional fortification is often used. In most cases, a subgrade made out of chippings or gravel is built to increase the surface stability [1,2,3].
In both cases, the soil bulk density is increased and the pore system is heavily disturbed. Because of this soil compaction, infiltration rates and capacities are significantly reduced, causing a much higher tendency towards the generation of Hortonian overland flow (HOF), when rainfall intensities exceed the infiltration rate of the road surface [4,5,6,7].
This process-related interaction also occurs on skid trails, where no grading or fortification takes place. Here, the soil compaction is caused by the direct overpassing of previously undisturbed topsoil with forestry equipment. Therefore, especially the rutted areas of the skid trail show a severe soil compaction, whereas the unrutted areas are less affected [8,9].
Beyond that, the influence of traffic induced soil compaction on skid trails is a comparatively long-lasting effect. An increased soil bulk density was measured in former rutted parts of skid trails even years after the last overpassing [10,11]. Thus, the reduced infiltration rate of these sites as a consequence of soil compaction is almost irreversible and can considerably affect the hydrological processes, foremost the generation of overland flow, in a forested catchment [12,13,14,15,16,17].
Besides altered hydrological processes, soil erosion by water is also a possible consequence of constructing a forest road network. Undisturbed forest topsoil normally shows only minimal tendencies of generating a noticeable soil loss, because the most important erosional processes are diminished. Soil erosion by water can be divided into three main processes, detachment, transport and deposition [18]. Particle detachment is caused by both raindrop impact (splash-erosion) and superficially flowing water. The latter rarely occurs at all under undisturbed conditions as high infiltration rates cause minimal amounts of overland flow. Splash erosion on the other hand is caused by the kinetic energy of the raindrop impact and could potentially affect any bare surface. In case of forested sites, it is mainly the understory vegetation that covers most of the surface and simultaneously reduces splash-erosion by intercepting the rainfall kinetic energy [19]. Traffic and grading or fortifying in the course of establishing a road surface, however, leads to an almost complete removal of vegetation. Therefore, the topsoil is unprotected against splash-erosion, which conditions an increase of soil detachment and—as a direct consequence—particle transport rates. Once detached, soil particles are transported either as a suspension of splash water and soil or by superficially flowing water. The transport rates by flowing water are normally much higher than those by splash-erosion processes, caused by the higher amount of available kinetic energy [18]. As forest road surfaces are prone to generate overland flows, the combination of reduced infiltration rates and removed understory vegetation leads to measurably higher soil erosion rates [4,5,7,20,21,22].
A portable small-scale rainfall simulator was used to investigate the effects of a forest road and skid trail network on hydrological and erosional processes in catchments located in Western Germany. Rainfall simulation is a widely used tool for investigating runoff and soil erosion processes [4,23,24,25,26,27,28,29,30,31]. It offers a high methodical flexibility, as storm events with almost any desired intensity and duration can be generated. In general, rainfall simulators represent a combination of field measurements and well adjustable boundary conditions, thus allowing collecting data in-situ with simultaneously almost thoroughly controllable rainfall characteristics.
Studies that observe explicitly the influence of roads and skid trails on a processual and small-scaled level with the help of rainfall simulation are scarce [4,5,15,26,32,33,34,35,36,37] compared to publications with other approaches like long-time erosion plot gauging [38,39,40,41] or mapping of erosional features [22,42], that address the detrimental influence of roads on water retention [14,16,17,43], water quality [21,44,45,46] and soil preservation [35,38,45,46,47,48,49,50,51], potentially leading to ecological harm [52,53]. Furthermore, a direct transfer of the described effects to European catchments is difficult, as the majority of the studies highlight sites that are not comparable to Central European catchments regarding their climatic conditions [54,55,56,57,58,59]. Nevertheless, the few existent studies for Central European catchments clearly show higher runoff rates and potentially severe soil erosion rates caused by roads and skid trails [5,15,30].
The presented study is one of the first attempts to describe altered runoff and erosion processes caused by road networks not only in a high spatial but also in a high temporal resolution and differentiated between road types in a Central European catchment. The aims of this study include the following: (a) quantifying the effect of roads and skid trails on runoff generation in forested catchments in a high spatio-temporal resolution; (b) quantifying the linked soil erosion processes; and (c) elaborating dependencies between plot characteristics, runoff generation and soil erosion.

2. Material and Methods

2.1. Study Areas

The rainfall simulations were carried out in two different forested headwater catchments in Rhineland-Palatinate, Western Germany, located in the nature reserve Laacher See (50°25′47.4″N; 7°15′49.1″E) and the national park Hunsrück-Hochwald (49°43′47.0″N; 7°5′23.0″E) (Figure 1).
Both catchments are situated within the Rhenish Massif and feature mostly slate and quartzite bedrock with dominant quartzite in the national park Hunsrück-Hochwald. As the Laacher See catchment is located in the East-Eifel volcanic field and in direct vicinity of the Laacher See caldera and numerous quaternary basaltic volcanoes, Laacher See tephra (LST) and basaltic vulcanites dominate its local geology. Nevertheless, both study areas show similar USDA soil textures (Table 1), basing upon a total of 447 soil samples, which were taken at the rainfall simulation sites and during several soil sampling campaigns in both catchments. Regarding their land use, the catchments are characterized by forested land, which, as a consequence, involves frequent traffic on dense road and skid trail networks.

2.2. The Portable Rainfall Simulator

A nozzle type rainfall simulator was designed based on the structural design of [27] for measuring interrill erosion (Figure 2). The nozzle was attached to a 1 m2 square aluminum frame at a height of 2 m. Four adjustable telescoping aluminum legs allowed a horizontal alignment of the frame and a windshield was attached to the legs to minimize the influence of wind during the experiments. The water flow was driven by a battery powered electric bilge pump, while the flow rate was controlled using a small gate valve. Artificial raindrops were generated using a Lechler 406.608 full cone nozzle, which is stated to produce a good replication of natural rainfall characteristics in numerous publications [27,28,29]. As a second flow control mechanism, a manometer was installed near the nozzle to ensure a constant water pressure at the drop height of 2 m.
The observed plot surface was limited by a 0.64 m2 square frame made of stainless steel, which was driven into the topsoil. It also featured a runoff apron that allowed a safe sampling of generated overland flow and eroded soil by attaching wide neck bottles to the outlet.

2.3. Calibration of the Rainfall Simulator

To ensure that the simulated rainfall replicates natural rainfall characteristics as closely as possible, a wide range of calibration methods was used. First of all, the spatial rainfall distribution and the intensity were measured to identify an operating pressure with an acceptable trade-off of both spatial homogeneity and desired intensity. The low drop height of 2 m conditioned a diminished terminal fall velocity of the artificial raindrops compared to natural rainfall. Therefore, a comparatively high intensity >40 mm·h−1 was planned, to ensure kinetic energy values high enough to mobilize soil particles, as the rainfall kinetic energy is a product of mass (respectively intensity) and fall velocity [27,60].
An increase of intensity was obtained by reducing the operation pressure which caused on the other hand a more and more inhomogeneous rainfall distribution because of the nozzle specifications: Lechler specifies a minimum pressure of 0.5 bar for operating the type-460 nozzles with a symmetrical spray cone. Thus, only a narrow range of viable pressures was given to produce a homogenous and erosive rainfall. To measure both intensity and spatial homogeneity, 263 collectors were set up beneath the rainfall simulator, covering the base area of 1 m2. After a rainfall exposure of 15 min, each collector was weighed to determine the quantity of the collected rainfall at the respective plot position. With the aid of the given collector area, the rainfall intensity was calculated. The obtained dataset was used to interpolate the rainfall intensity across the plot and beyond that to calculate the spatial homogeneity using the Christiansen-Coefficient (CU) presented in [61]. Interpolations were conducted with the help of a variogram-based kriging, using Golden Software Surfer 8.
An operation pressure of 0.09 bar, resulting in a mean intensity of 45 mm·h−1 (equals 0.48 L·min−1 applied to the plot surface of 0.64 m2) showed the best results of both CU and desired intensity (Table 2). Using the determined operation pressure, the drop size distribution and fall velocity was measured using a Laser Precipitation Monitor (LPM) by Thies© (Göttingen, Germany) which allowed a contactless real-time measurement at single-drop resolution. The LPM was placed at 9 different positions beneath the rainfall simulator, with a measurement time of 15 min per position. Amongst others, the most important rainfall characteristics, median drop diameter (d50) and kinetic rainfall energy (KE) were derived from the LPM-measurements. The latter were calculated based on [27,60].

2.4. Experimental Setup

The rainfall characteristics during the simulation runs are presented in Table 2.
The chosen intensity represents heavy rainfall events of 30 min with a return period of approximately 5 years for the NPHH catchment [5]. Due to a lack of reliable data for the LS catchment, the return period can only be assumed. The catchment shows basically comparable precipitation patterns, with the only difference that convective precipitation events during the summer months occur more frequently [62]. As those events usually exhibit high rainfall intensities, a slightly shorter return period than 5 years seems to be probable.
Each run consisted of a sequence of three rainfall events with a duration of 30 min separated by a pause of 5 min, similar to the rainfall pattern presented in [4], where a comparable experimental setup regarding plot characteristics and research question was at hand. The separations allowed evaluating the changing infiltration patterns at the beginning of each event caused by the gradually higher antecedent soil moisture. Infiltration volumes were derived indirectly by subtracting measured runoff volumes from the amount of rainfall input in the same time interval.
The rainfall intensity for each simulation run was quantified at the beginning and the end of every 30-min event by measuring the output of the simulator directly at the nozzle. Additionally, the operating pressure of 0.09 bar was constantly checked throughout the rainfall events. Because of the fact that in-situ experiments are difficult to control perfectly, a certain degree of inconstant intensity was expected. To overcome those uncertainties, experiments on forest roads were used to calculate possible deviations. A complete saturation of the compacted topsoil—and therefore saturation flow conditions with P ≈ Q—was assumed, if: (a) the coefficient of variation (CV) of the runoff volumes in the last 5 min of the experiment was <5%, indicating stable runoff conditions; and (b) the mean runoff sum in the last 5 min of the experiment was 100% ± 10% of the desired intensity. A similar approach was used by [4] to address saturated conditions during rainfall simulations. After this, the mean runoff sum of the same time interval was calculated to obtain the range of potential deviation from the targeted rainfall intensity.
Overland flow and sediment yield were collected in a high temporal resolution of one minute. Therefore, it was possible to generate precise datasets of hydrological characteristics and soil erodibility over a rainfall event. Foremost, runoff volumes for each minute of the simulated rainfall events were measured directly. With known rainfall intensity, it was also possible to calculate the runoff-coefficient (C), the percentage of runoff related to the amount of rainfall for any desired time-interval greater or equal 1 min. Additionally, the suspended sediment load was measured for each minute of the simulations. Detailed sediment graphs with a high temporal resolution of one minute can be found in [63]. As eroded particles often settled out of the flowing water at the plot apron and were collected after each simulation run, only the single event based values with a temporal resolution of 30 min are presented within this article. All of the obtained results are displayed normalized for an area of 1 m2 in order to allow a better comparability with other studies using the same normalization [4,5,33,34,35].
To elaborate the differences between each road type, a road categorization was established. A first distinction was made between forest roads and skid trails, as there are major differences concerning their constructional layout and persistence (Figure 3).
Forest roads were subdivided into fortified (graveled) and unfortified (graded) roads, as the absence of a base course in case of unfortified roads was believed to have a noticeable influence on hydrological and erosional processes. Because of the small plot size, even rutted and unrutted areas on the road surface could be distinguished. Especially skid trail surfaces were divided into rutted and unrutted areas as the main traffic induced soil compaction was assumed to be present in forestry equipment tracks. This assumption was proved right, as the results obtained on persistent forest roads featured only minor differences between rutted and unrutted areas. Thus, the respective results are displayed aggregated for both rutted and unrutted parts of the road. In contrast, soil compaction conditioned a clear pattern on skid trails: Here, especially the rutted parts showed higher rates of runoff generation than unrutted areas. As a consequence, both are displayed separately.
Regarding the plot characteristics (Table 3), the soil moisture of the plot was measured before and after the simulation run by collecting sample ring probes with a volume of 0.1 dm3, which were taken in direct vicinity of (before) and on the plot surface (after). In the course of this sampling the bulk density (ρ) and gravel content could also be derived. Additionally, the vegetation cover of the plot surface was determined, as it is a major control factor for soil erosion processes [30,35,64,65,66]. For this purpose, digital photographs of the plot surfaces were analyzed by marking covered areas with a mask tool and calculating the percentage of vegetation covered pixels. At last, hydrophobicity of the topsoil was measured using a classification basing on the Water Drop Penetration Time (WDPT) method as presented in [5,67], since soil hydrophobicity may additionally trigger overland flow generation [5]. The WDPT method evaluates the hydrophobicity on the basis of how long it takes to infiltrate a single drop of water that is applied to the surface. WDPT classes range from 0 (no noticeable water repellency, infiltration time <5 s) to 6 (severe water repellency, infiltration time >300 s).

2.5. Statistical Analysis

The plot characteristics and the category based mean values of runoff and eroded sediment were described statistically according to [5], as this publication represents one of the few existent studies that provide datasets for runoff generation and soil erosion on skid trails in a European catchment. IBM SPSS 23 was used to calculate the required statistical parameters. With the help of the Kolmogorov–Smirnov test, it was confirmed, that the datasets were not normally distributed. Therefore, only non-parametric tests were performed. In respect thereof, the same statistical basic conditions as in [5] were on hand. Then, boxplots for each surface category were plotted and the Kruskal–Wallis test was performed for independent samples to verify if the categories showed significant differences. Finally, using the surface categories, a paired Mann–Whitney test was conducted to show significant differences between them. As the Mann–Whitney test focuses mainly on the median of the dataset, it was suitable for the rather small number of simulations for each surface category [68]. To test if runoff and erosion results and certain plot characteristics correlate, Spearman-Rho correlation matrices were also calculated.

3. Results and Discussion

3.1. Overland Flow

Table 4 shows the runoff values of each simulation, separated by the single rainfall events. Additionally, the calculated runoff-coefficients are specified.
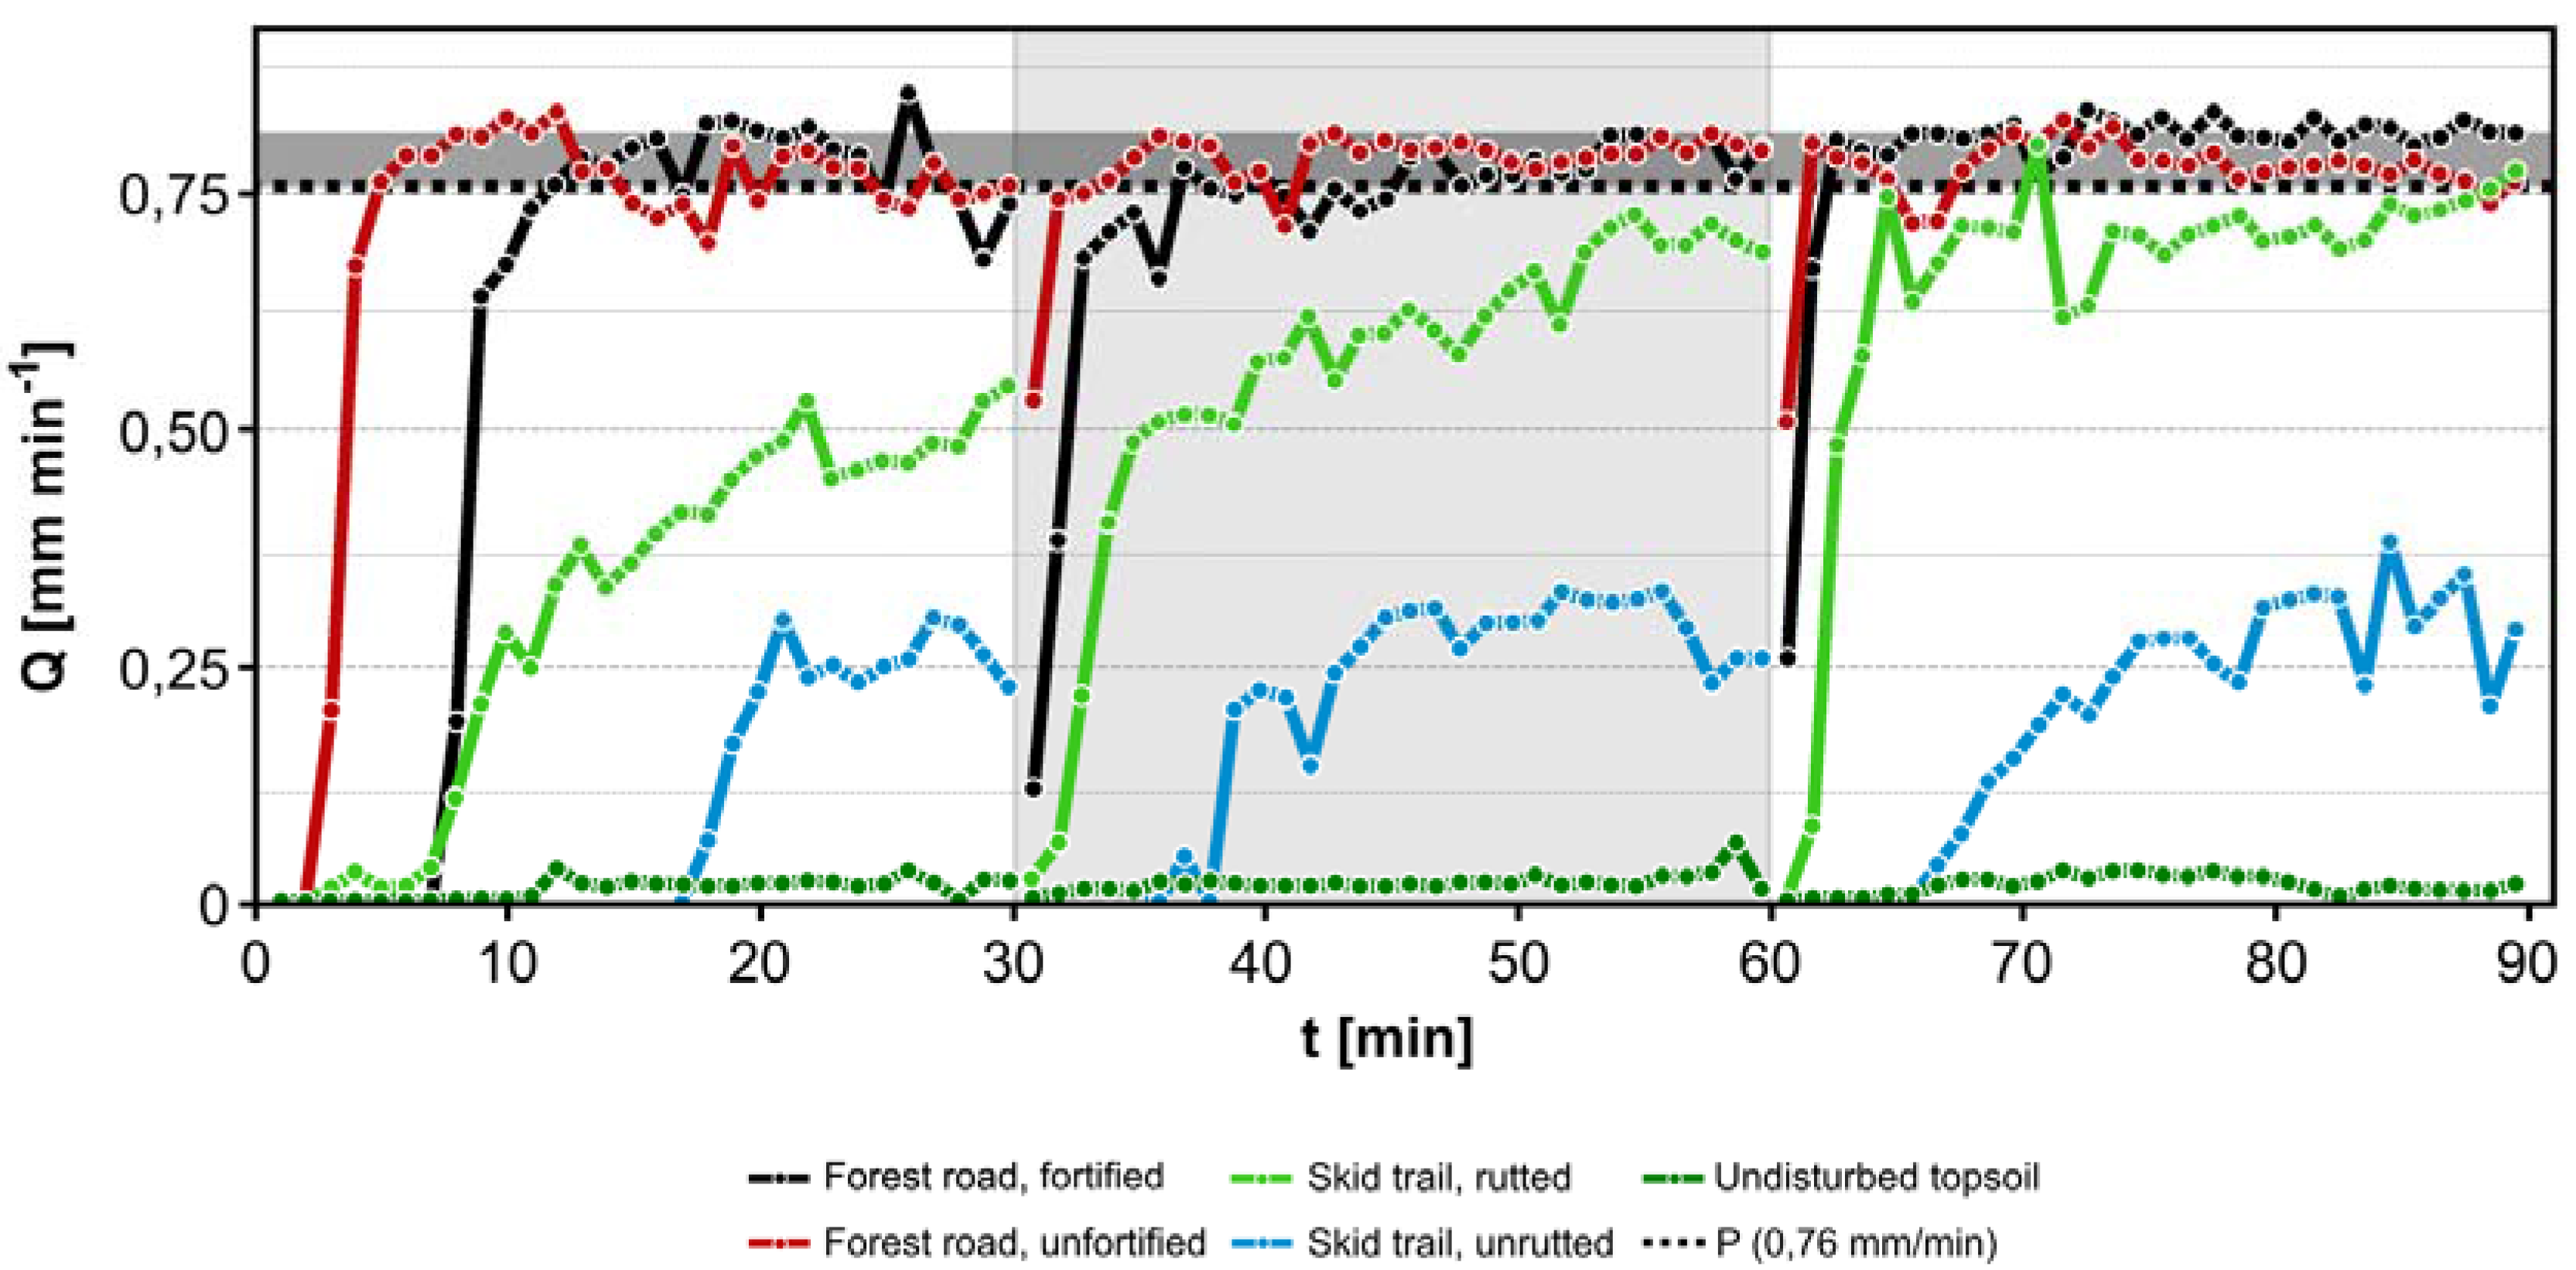
Detailed hydrographs were plotted as a result of the high-resolution sampling method. Exemplary hydrographs basing upon simulation runs on different surfaces (simulations #2, #6, #10, #14 and #19) give an insight in unprocessed datasets (Figure 4). They show typical runoff patterns of the respective surface category.
Both fortified and unfortified forest roads show runoff rates that are significantly different compared to undisturbed forest topsoil. After only a few minutes into the first rainfall event, both surfaces show an almost instantaneous shift from no measurable runoff to flow rates in the range of the rainfall input. By comparison, the unfortified road tends to generate high runoff amounts earlier during the first minutes of each rainfall event.
The rutted skid trail shows the most apparent pattern of successive topsoil saturation. During rainfall Event 1, the first runoff is already measured after 3 min—presumably because of the hydrophobicity of the soil (WDPT class 2)—and an increased amount of runoff generation starts at 7 min. Towards the end of the second rainfall event, the rutted skid trail already shows runoff comparable to the rainfall input. A fast saturation at the beginning of Event 3 is clearly visible. After this response time, runoff volumes level off at rainfall input rates, representing an assumed 100% saturation of the topsoil leading to saturation flow conditions.
On the unrutted skid trail, no runoff was measured until Minute 18, which indicates a comparatively high infiltration rate of the topsoil. Even the following rainfall events show a distinct saturation stage, as there are 4 (Event 2) and 6 (Event 3) min without any runoff at the beginning of each event.
The undisturbed forest soil shows a stable but almost negligible overland flow. There is no noticeable pattern of rising runoff rates, which shows that even after 90 min rainfall with a rainfall intensity of 45 mm·h−1 and 43.6 L rainfall applied to the plot surface, the infiltration capacity is not exceeded. The measured runoff volumes represent only a small amount of HOF that occurs because of the high rainfall intensity.
The hydrographs also show an example for calculating the possible deviation of rainfall intensity during the simulations: There are data points that indicate more runoff than applied rainfall, especially when looking at the third event on fortified and unfortified roads. For example, the deviation for simulation #2, conducted on a fortified road is displayed in Figure 4 as grey area above the indicated amount of rainfall. The CV of the runoff in the last 5 min was 1.2%, implying stable runoff conditions with a mean C of 107%—therefore, a deviation of 7% was assumed.
The largest deviation in the whole dataset was observed during simulation #5 with a mean C of 109% and a CV of 2.2% during Minutes 85–90. Because of that, a possible general error of 10% was accounted for all of the experiments and integrated in Figure 6 which shows the aggregated volumes of runoff and infiltration for each surface category. Nevertheless, all of the simulations showed a total C of <100% (
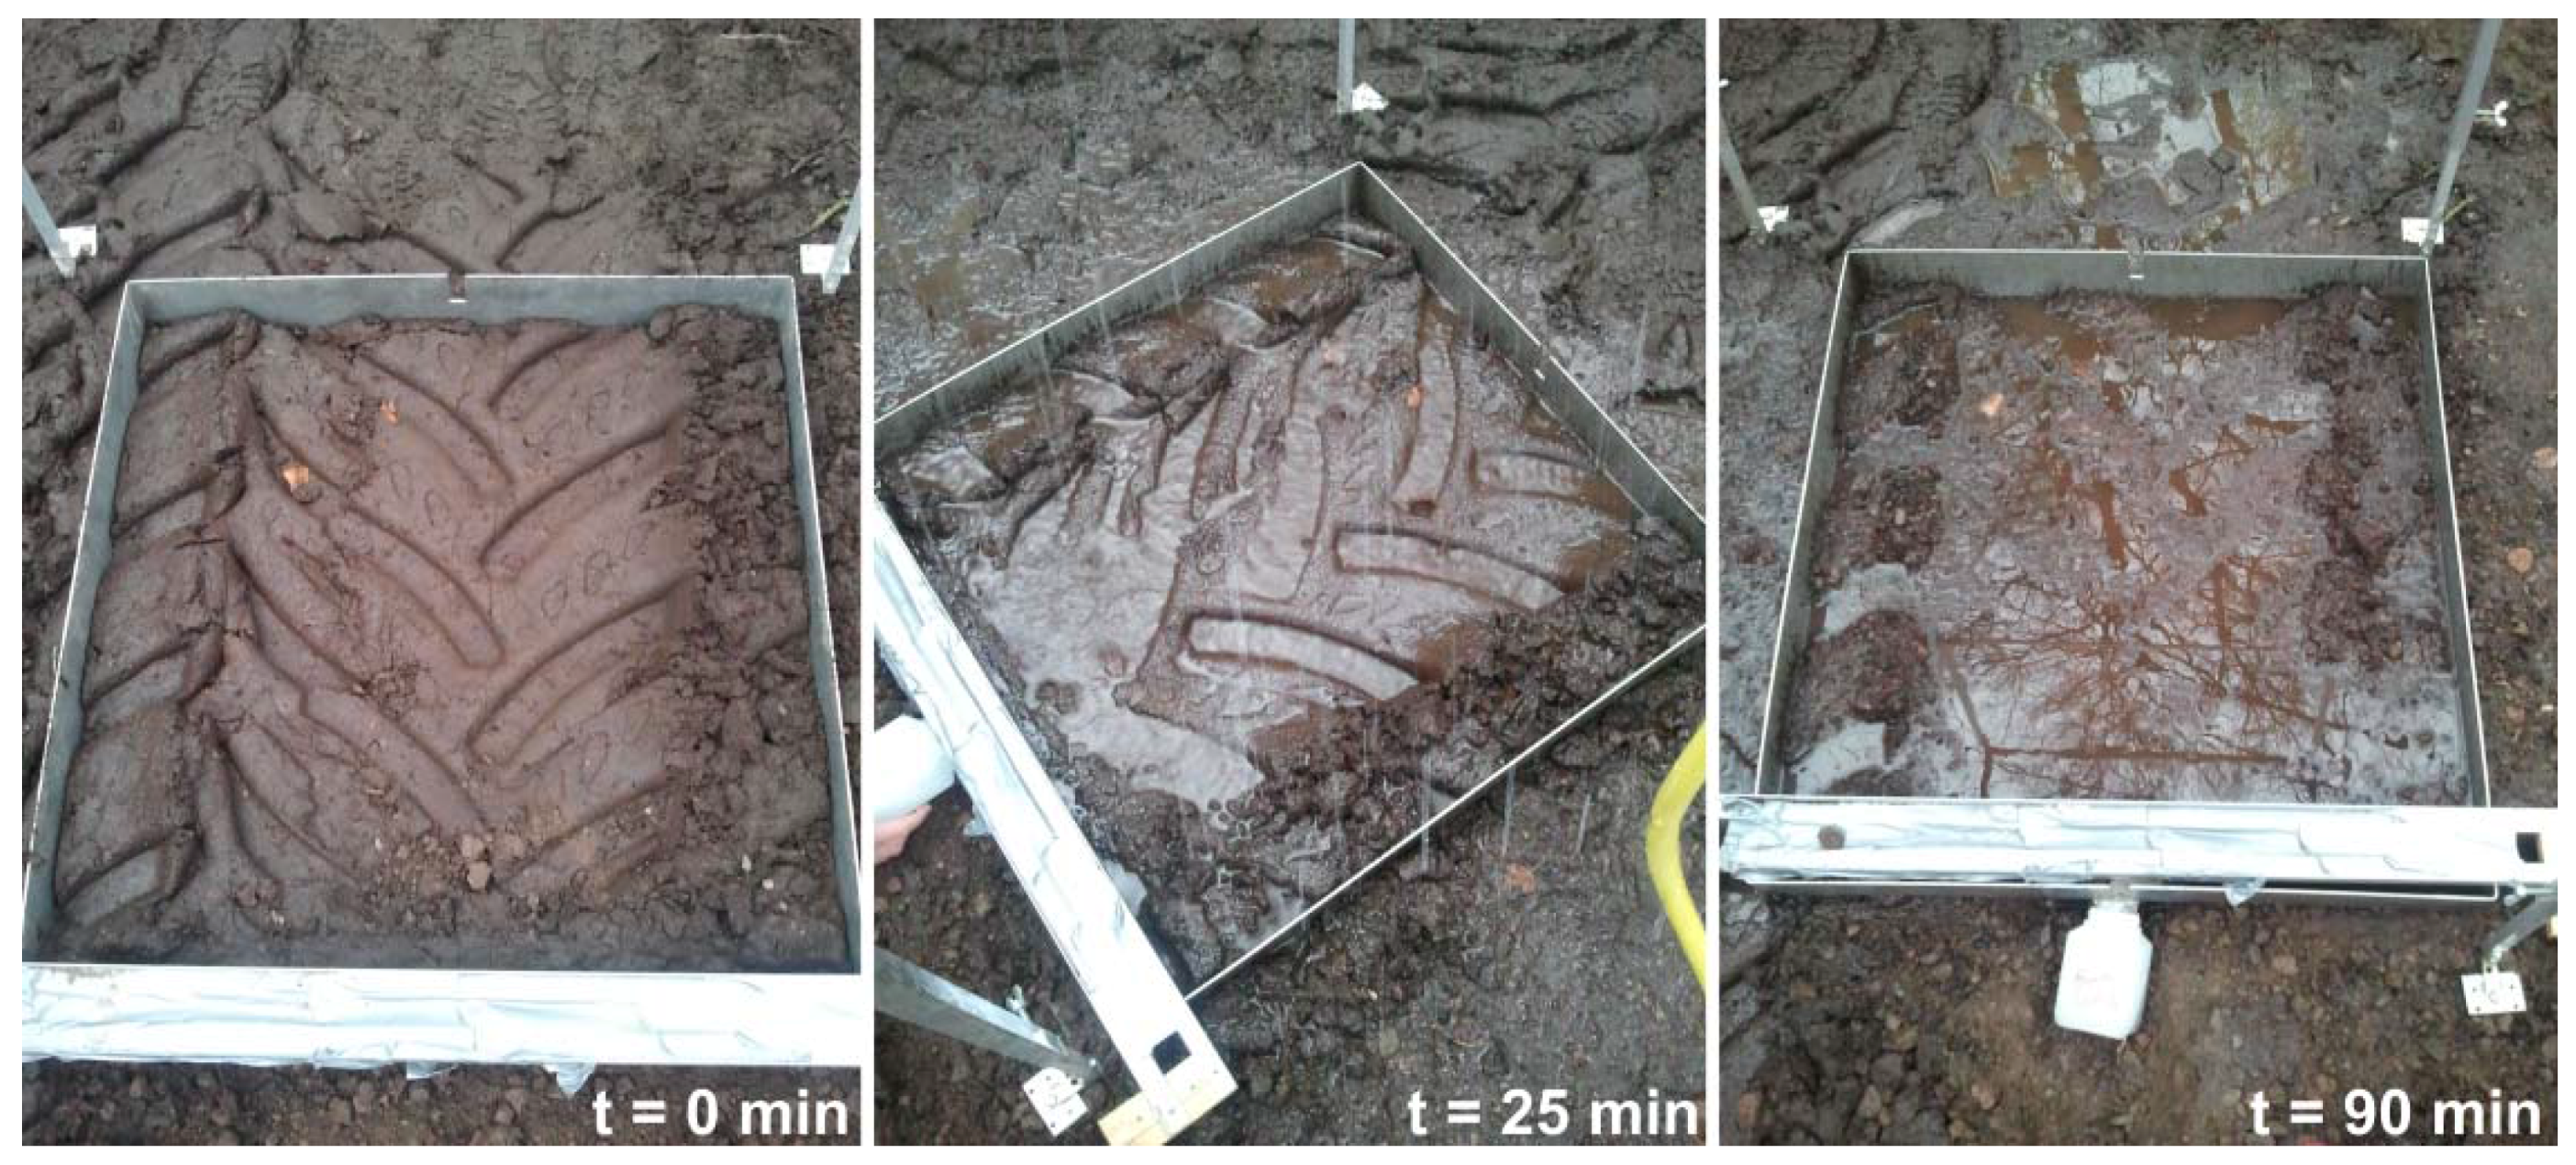
Table 4). Besides the possibility of deviating rainfall intensities, a partial retention of the superficially flowing water caused by irregularities on the plot surface, for example imprinted tire treads, may also have caused higher C-values towards the end of the simulations. In those imprints, small pools of water were built up, which were drained when the structures were eroded by splash and flowing water. Figure 5 provides an example observed on a rutted forest road.
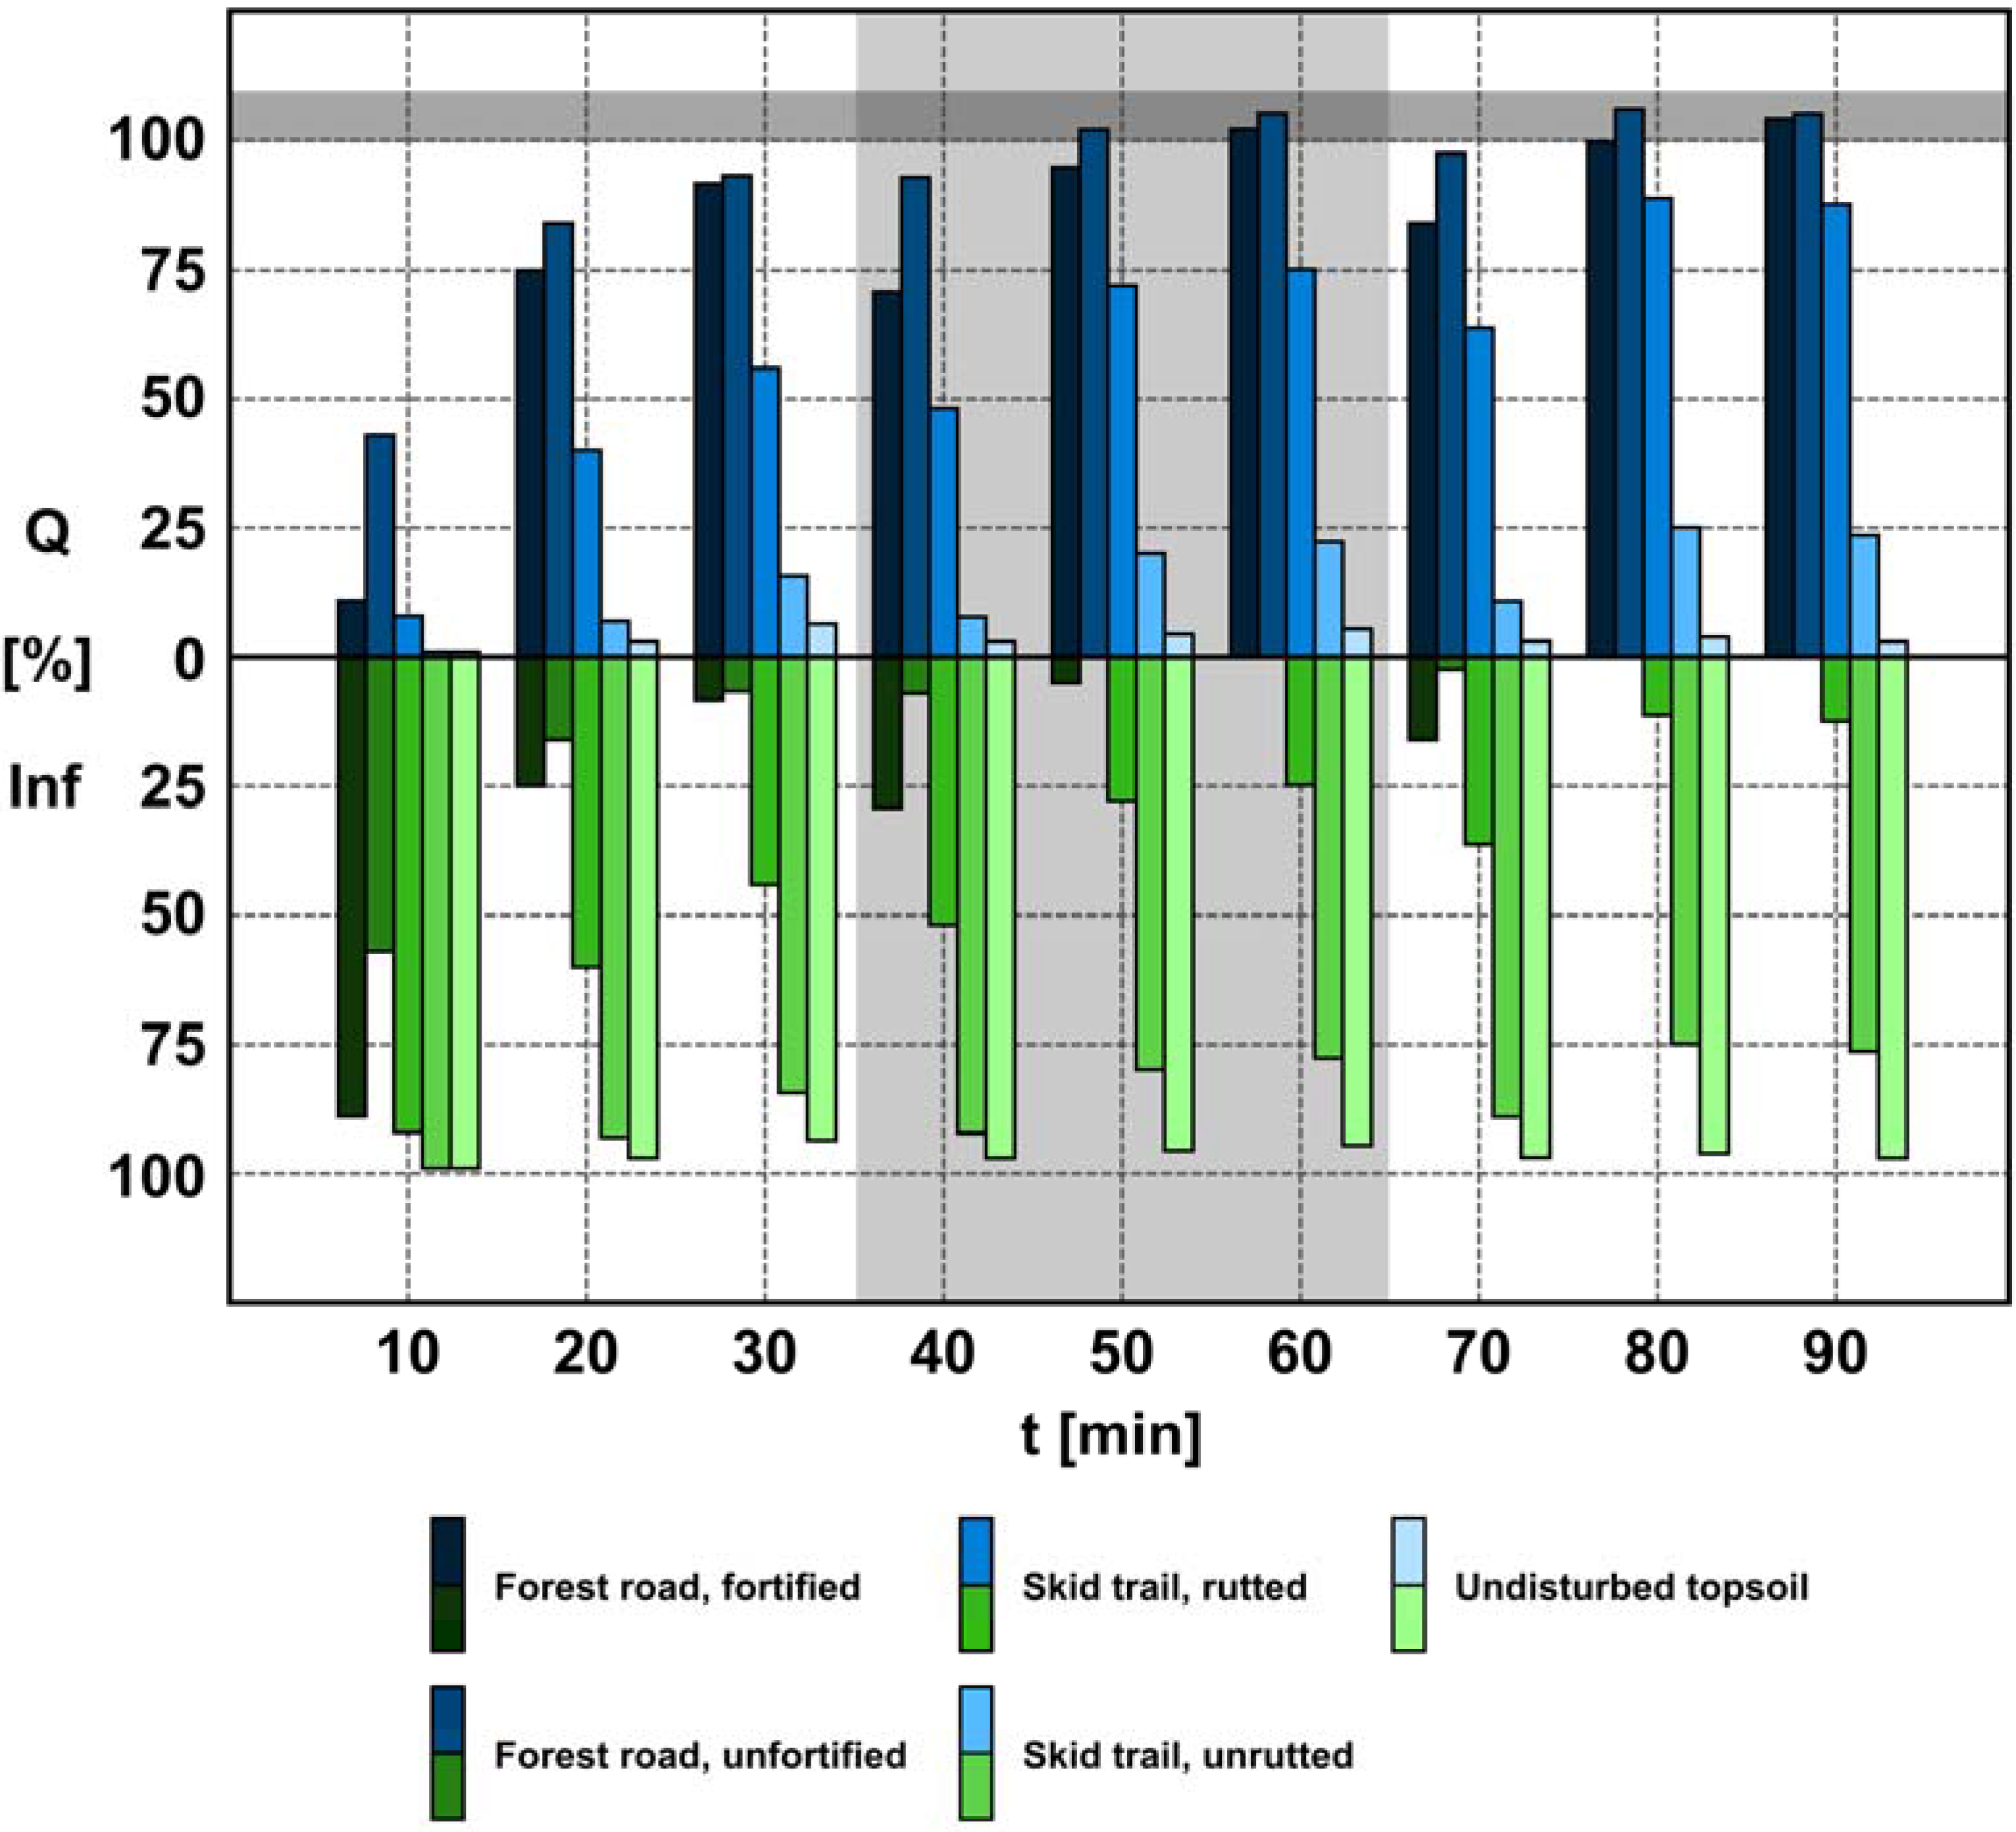
The described runoff patterns also apply to the mean values of each category. These datasets are displayed as processed datasets, the mean percentages of runoff and infiltration for each surface category with a time interval of 10 min (Figure 6).
Again, forest roads produce the highest runoff of all surface types. Only during the first 10 min of rainfall Event 1 both surfaces show higher infiltration than runoff. Hereafter, the mean runoff volumes are permanently higher. When looking at the mean runoff volumes of all simulation runs (Table 5), the fortified surfaces show lower runoff volumes than unfortified roads. Both surfaces are compacted but there is a constructional difference between them that causes the deviating runoff patterns. Most likely it can be assumed that the base course featured on fortified roads led to, on average, larger soil pores compared to graded unfortified roads, as the coarse material stabilizes the matrix and therefore the pore system to a certain degree. Fine material between the crushed stones is not compacted that much compared to graded surfaces where the whole topsoil is affected thoroughly and an almost complete loss of pore volume has to be stated. Additionally, fortified roads feature higher percentages of sand, presumably because of the insertion of extraneous material, which again leads to a higher porosity of the topsoil.
The skid trails showed comparatively great differences between rutted and unrutted areas. According to the findings presented on the basis of Figure 4, the saturation of the soil successively proceeds over the three rainfall events leading to only minor infiltration volumes in case of rutted surfaces.
Here, the mean runoff percentage of rainfall Event 3 exceeds the values of rainfall Event 1 on forest roads. It is assumable, that the saturation of the topsoil would proceed and eventually cause a runoff pattern similar to forest roads if the duration of the simulated rainfall was prolonged. As the road surfaces represent a certain reference point for the generation of HOF over time, an almost completely saturated soil has to be expected within additional 60 min. This tendency is not expectable for unrutted surfaces, as they merely reach runoff percentages of 25% within rainfall Event 3.
Undisturbed topsoil shows only minimal runoff percentages. Also, the variation between each rainfall event is minimal. This indicates a stable infiltration rate, which leads to almost no notable HOF; therefore, the topsoil was not saturated.
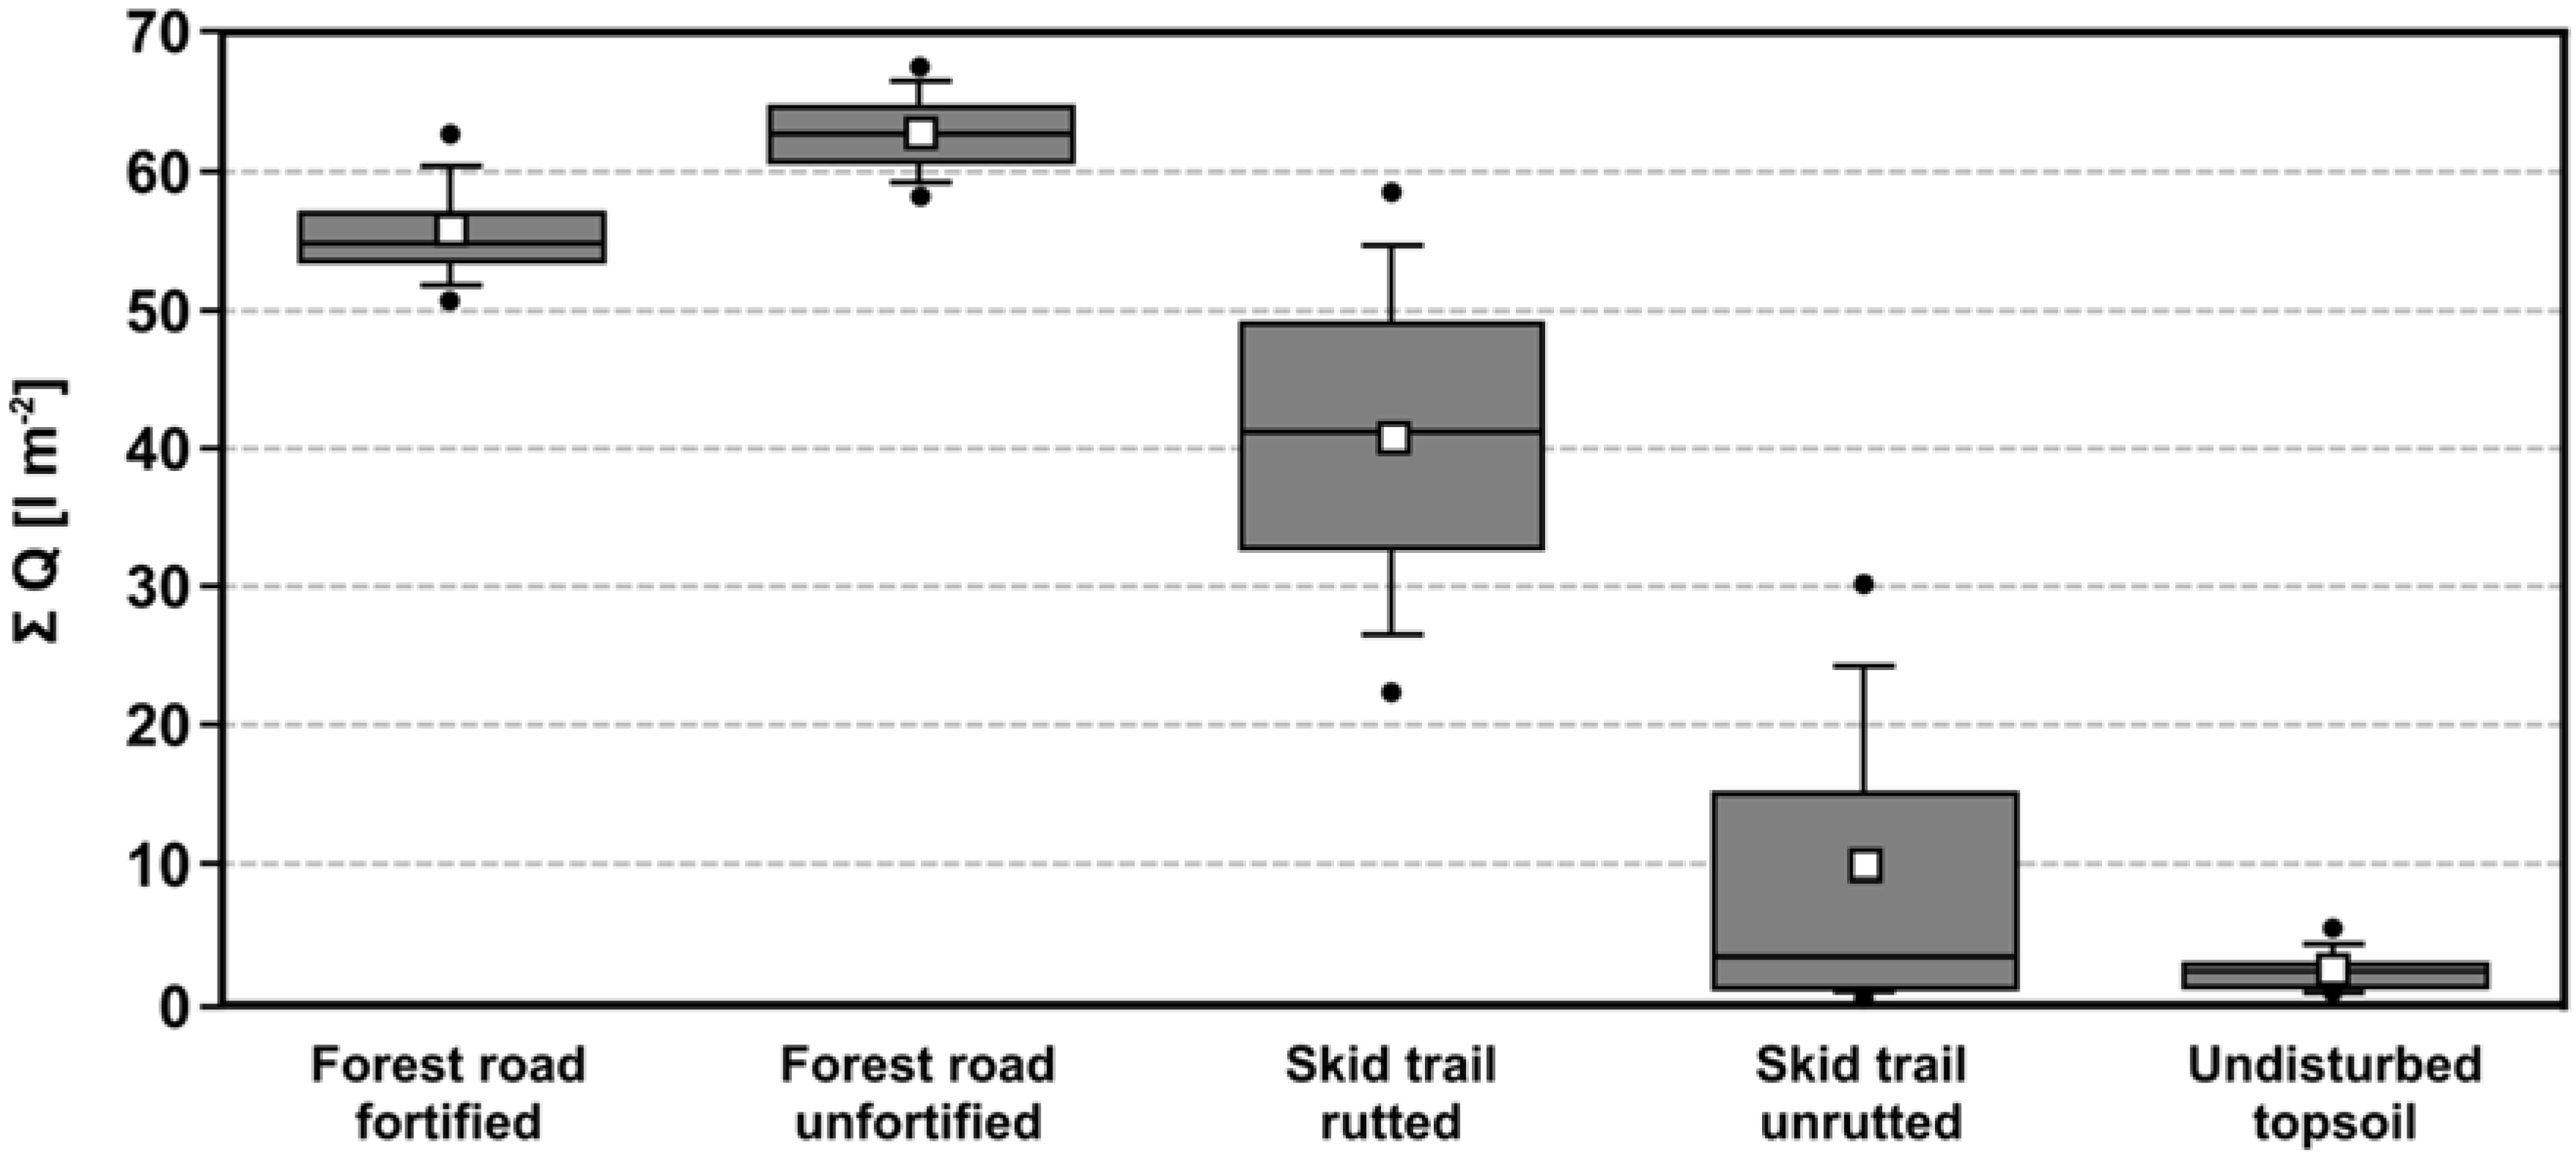
In addition to the study of the temporal changes in runoff and infiltration, a statistical analysis of the mean values for each category provides a better insight and allows addressing significant differences between surface types. Figure 7 shows the boxplots for each surface category, Table 5 the mean total runoff volumes and resulting runoff coefficients.
As expected, both forest road types show high C-values because of soil compaction resulting from constructional measures. Comparatively fast topsoil saturation in case of graded road surfaces is reflected in a slightly higher runoff-coefficient. The most noticeable result was achieved on rutted skid trails. Even though no fortification was existent and only the weight of forestry equipment caused a soil compaction, the mean runoff-coefficient lies clearly above the mean C-values of undisturbed forest topsoil, showing a 16-times higher percentage of overland flow. This increase does not only occur on rutted skid trails but also on unrutted parts. Here, the mean runoff-coefficient is noticeably lower than on rutted surfaces but it is still four times higher than the mean values of undisturbed soil, indicating a compacted soil.
In an additional step, differences between surface categories were tested regarding their significance (Table 6). As expected, the Mann–Whitney test showed significant differences between among road categories, unrutted skid trails and undisturbed topsoil. Apart from that, rutted skid trails showed no significant difference from forest roads, indicating the increased runoff volumes due to topsoil compaction. In contrast, unrutted skid trails show a strong similarity with undisturbed topsoil.
To investigate, if plot characteristics influenced the runoff generation, Spearman-Rho coefficients were calculated (Table 7).
There are identifiable significant correlations between the mean runoff sum and cover, gravel content and WDPT class when observing all conducted experiments. These strong correlations have to be relativized, as vegetation cover, gravel content and WDPT class differ depending on the constructional layout of the road surface. To avoid a spurious relationship, it is helpful to consider category-based values. Because of the rather small population in each surface category, only few significant correlations were achieved. The most noticeable correlations were found for rutted skid trails; here, a strong negative correlation between vegetation cover and mean runoff volume is existent. A strong positive correlation between WPDT class and mean runoff volume was also confirmed, indicating higher runoff volumes with severer water repellency.
Compared to existent studies discussing the influence of roads and skid trails in Central Europe, the findings presented in this study show similar results. Rainfall simulations with a comparable intensity conducted by [5] showed a median runoff-coefficient of 78.6% on skid trails and harvester tracks. In contrast, a median of only 0.2%–1.3% was measured on undisturbed topsoil. Therefore, an even higher influence of skid trails was determined, making the presented results appear plausible—related results were also confirmed by [15,32]. Along with skid trails, forest roads are characterized as a potential source of overland flow, endangering the water retention potential in forested catchments [69]. This finding could be confirmed by the conducted rainfall experiments. Reported increases of overland flow due to forest roads and soil compaction on skid trails for catchments outside Central Europe and obtained by rainfall simulations with divergent intensities also confirm these findings [4,6,17,24,26,33,34,35,55]: Here, for example, a faster generation of overland flow on forest roads was proven, most likely caused by soil compaction [4,33,34,35]. Despite covering only a small percentage of a catchment, road surfaces were accounted for a runoff increase of 10% in selected catchments [6]. Especially the parts of the road lacking a vegetation cover were addressed as areas showing noticeably higher runoff coefficients [33,34,35]. One of the few studies that explicitly compare undisturbed sites with skid trails showed with the help of comparably large runoff plots (2 × 15 m and 2 × 10 m) that skid trails generated a mean of 11.99 L·m−2 over a period of two months. In contrast, undisturbed sites only generated 0.13 L·m−2 [55].

3.2. Soil Erosion

As a consequence of the generated overland flows, the expected soil erosion processes developed. Table 8 shows the eroded sediment sums for every simulation and rainfall event.
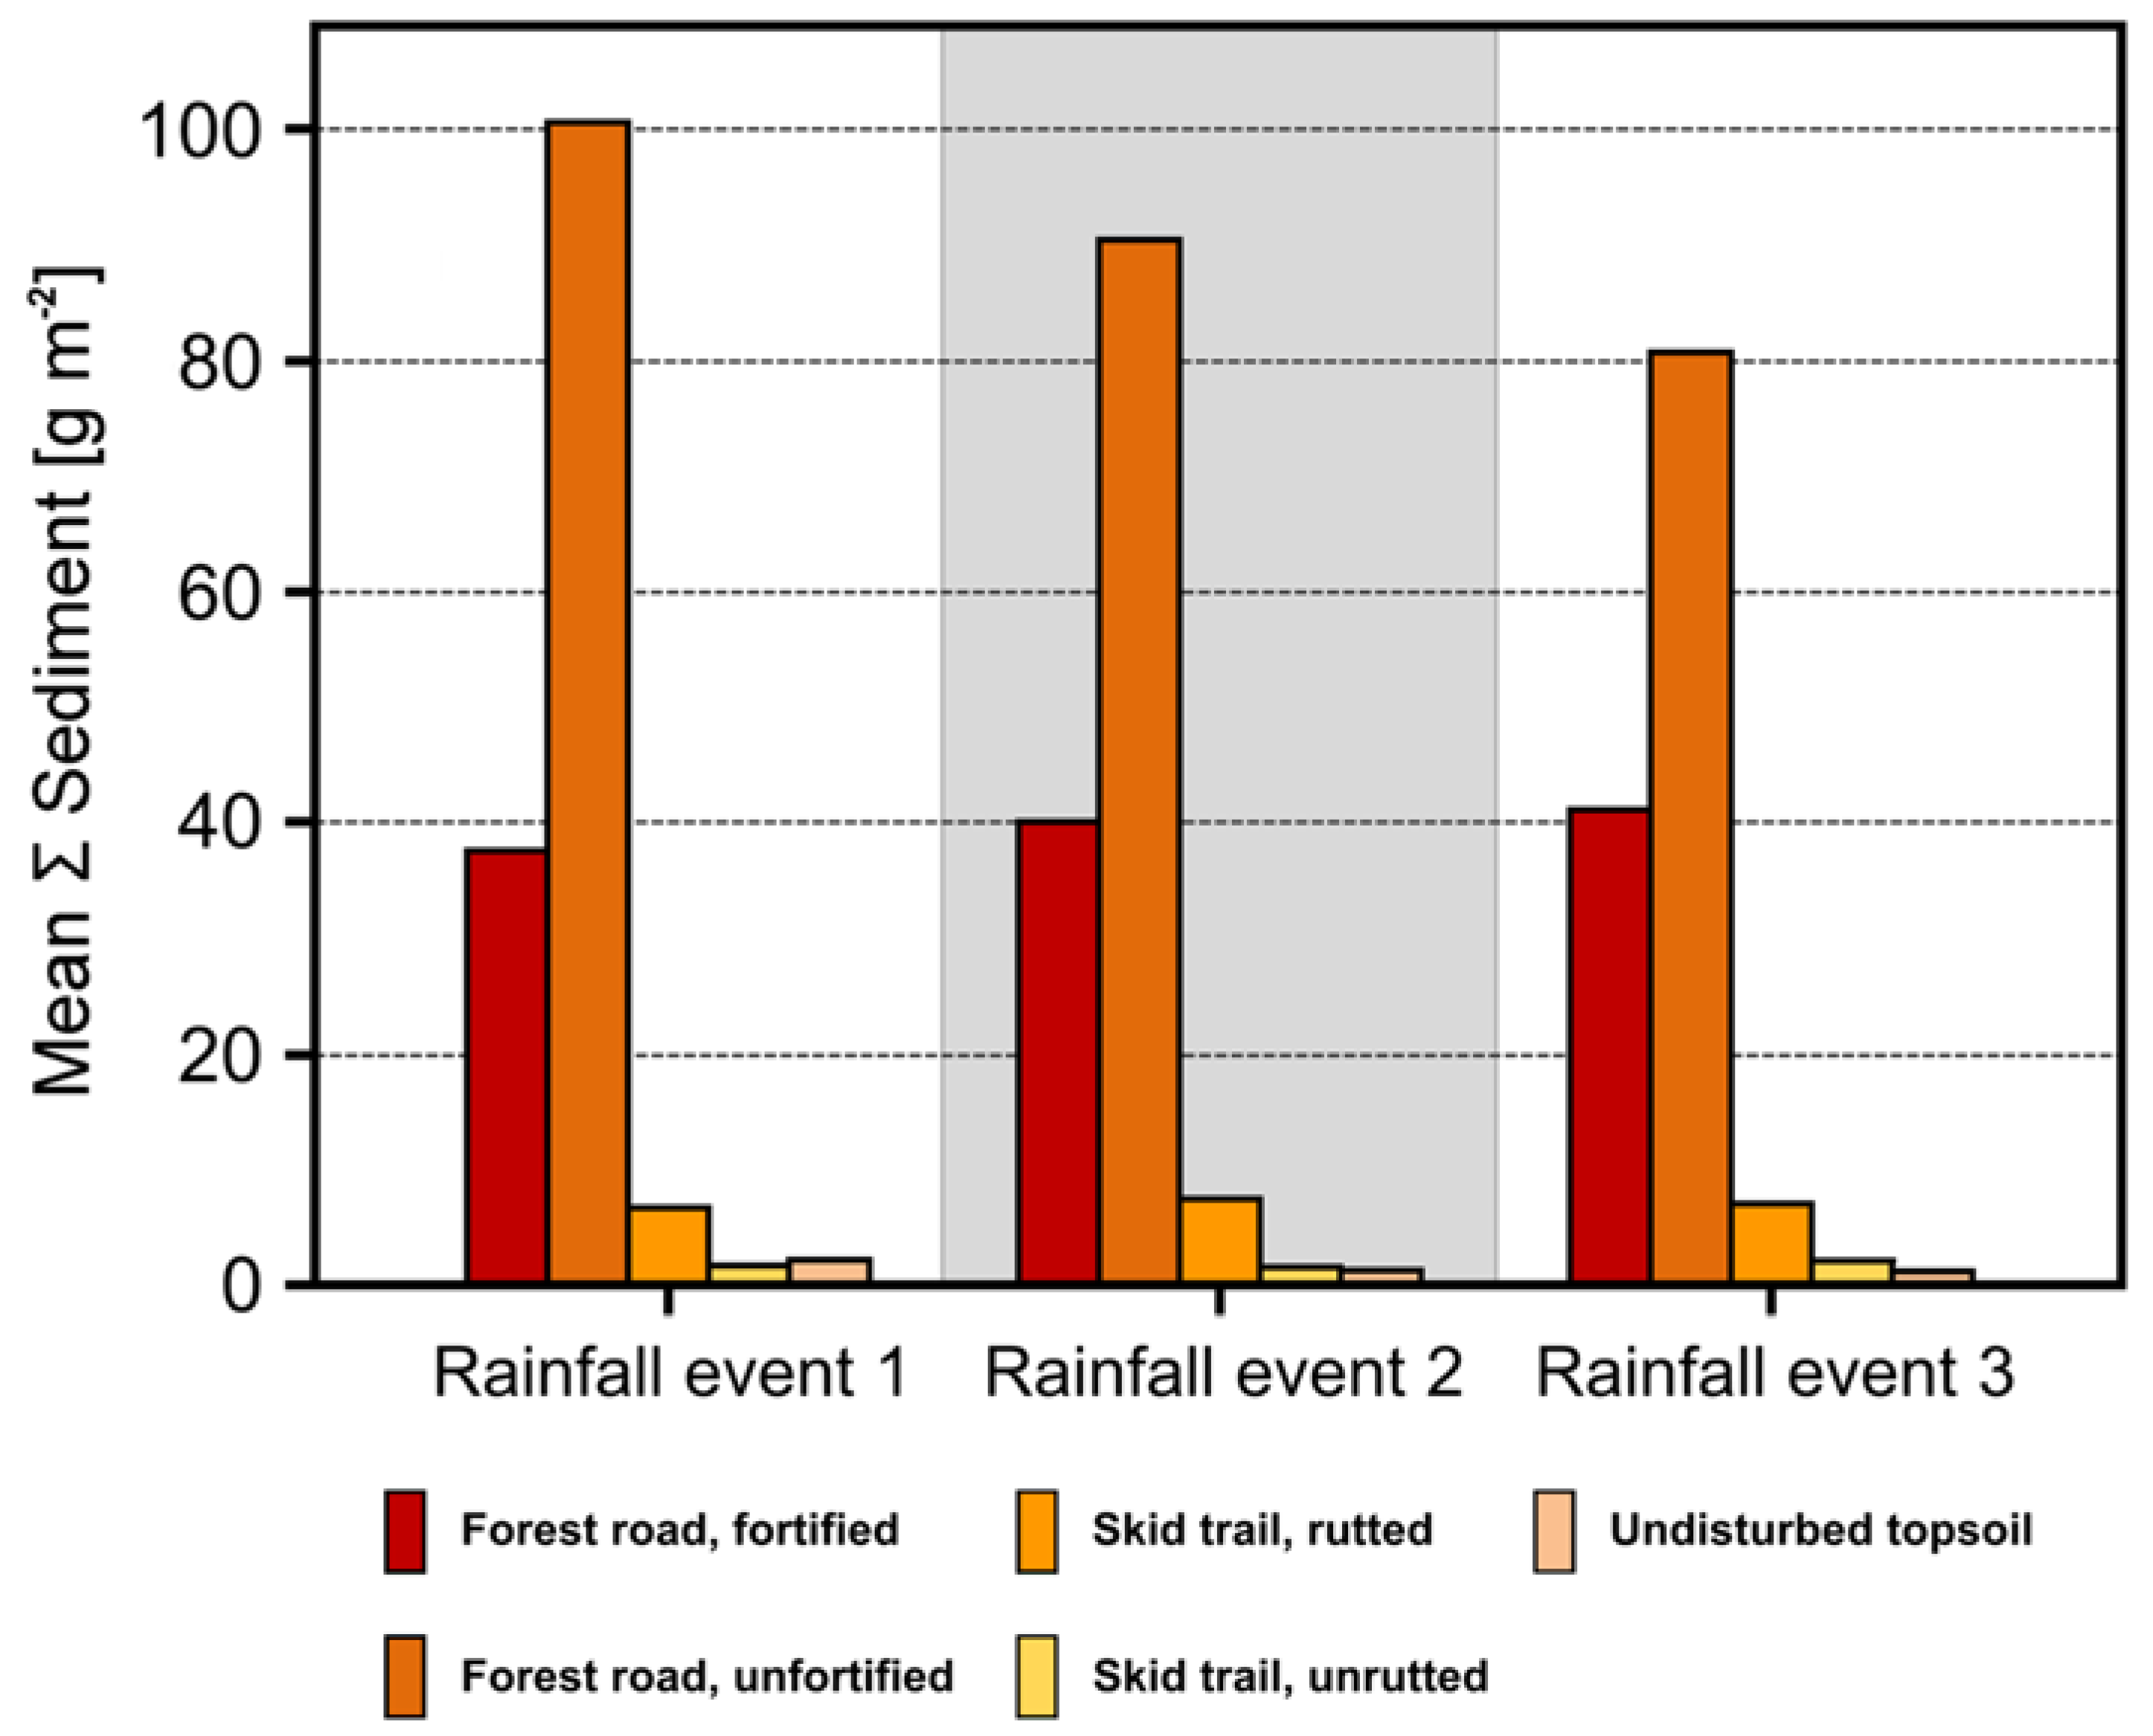
Regarding the mean total eroded sediment for each rainfall event, it is clearly visible, that forest roads showed the highest erosion rates during the simulation runs, whereas on skid trail surfaces and undisturbed topsoil virtually negligible amounts of sediment were eroded (Figure 8).
Forest roads generated the highest sums of eroded sediment because of two main reasons: On the one hand, an overland flow sufficient for erosional processes was generated in the first place. On the other hand, the vegetation cover was removed due to grading and compaction of the road surface. Beyond that, pioneer flora that could trigger an ecological succession was repeatedly removed because of the continuous use of the road by forestry vehicles.
The bare surfaces are much more vulnerable to erosion processes induced by rainfall and overland flow than skid trail surfaces and forest topsoil, where interception by vegetation and forest floor occurs. Thus, not only the incoming rainfall is retained; since the first impact of the raindrops occurs on understory vegetation or litter, the effect of splash erosion is significantly diminished.
Erosion rates on forest roads were significantly higher than those measured on undisturbed soil and skid trails. Mean sediment sums of fortified and unfortified roads were 36- and 68-times higher than on forest topsoil, respectivly. In the course of the simulation, forest roads showed erosion rates that even exceeded literature values for agricultural land in Central Europe [70].
A closer look at the different surface types reveals that fortified forest roads produced an almost constant sediment yield during all rainfall events, while the unfortified road surfaces yielded decreasing amounts of sediment (Table 9).
This temporal pattern is directly linked to the missing fortification on graded roads. Here, the surface is compacted to ensure the trafficability, but the lack of a base course that stabilizes the whole roadway allows tire treads to dig deep into the surface and to detach entire soil aggregates. This material is now prone to soil erosion processes as it is no longer embedded in the compacted matrix. During the three rainfall events, recently detached particles were gradually eroded, leading to a more and more decreasing erosion rate as the percentage of already transportable soil was diminished and particles at first had to be detached by splash and flowing water.
In contrast, fortified roads showed a comparatively high soil erosion rate because of the bare surface, but because of the stabilized roadbed there was only a certain kind of base value that could be eroded from the topmost soil layer. In this case, constant rainfall kinetic energy and intensity limited the amount of detached and eroded sediment. It is assumable, that unfortified roads would eventually show similar erosion rates, once all of the previously traffic-detached material is washed off the plot surface.
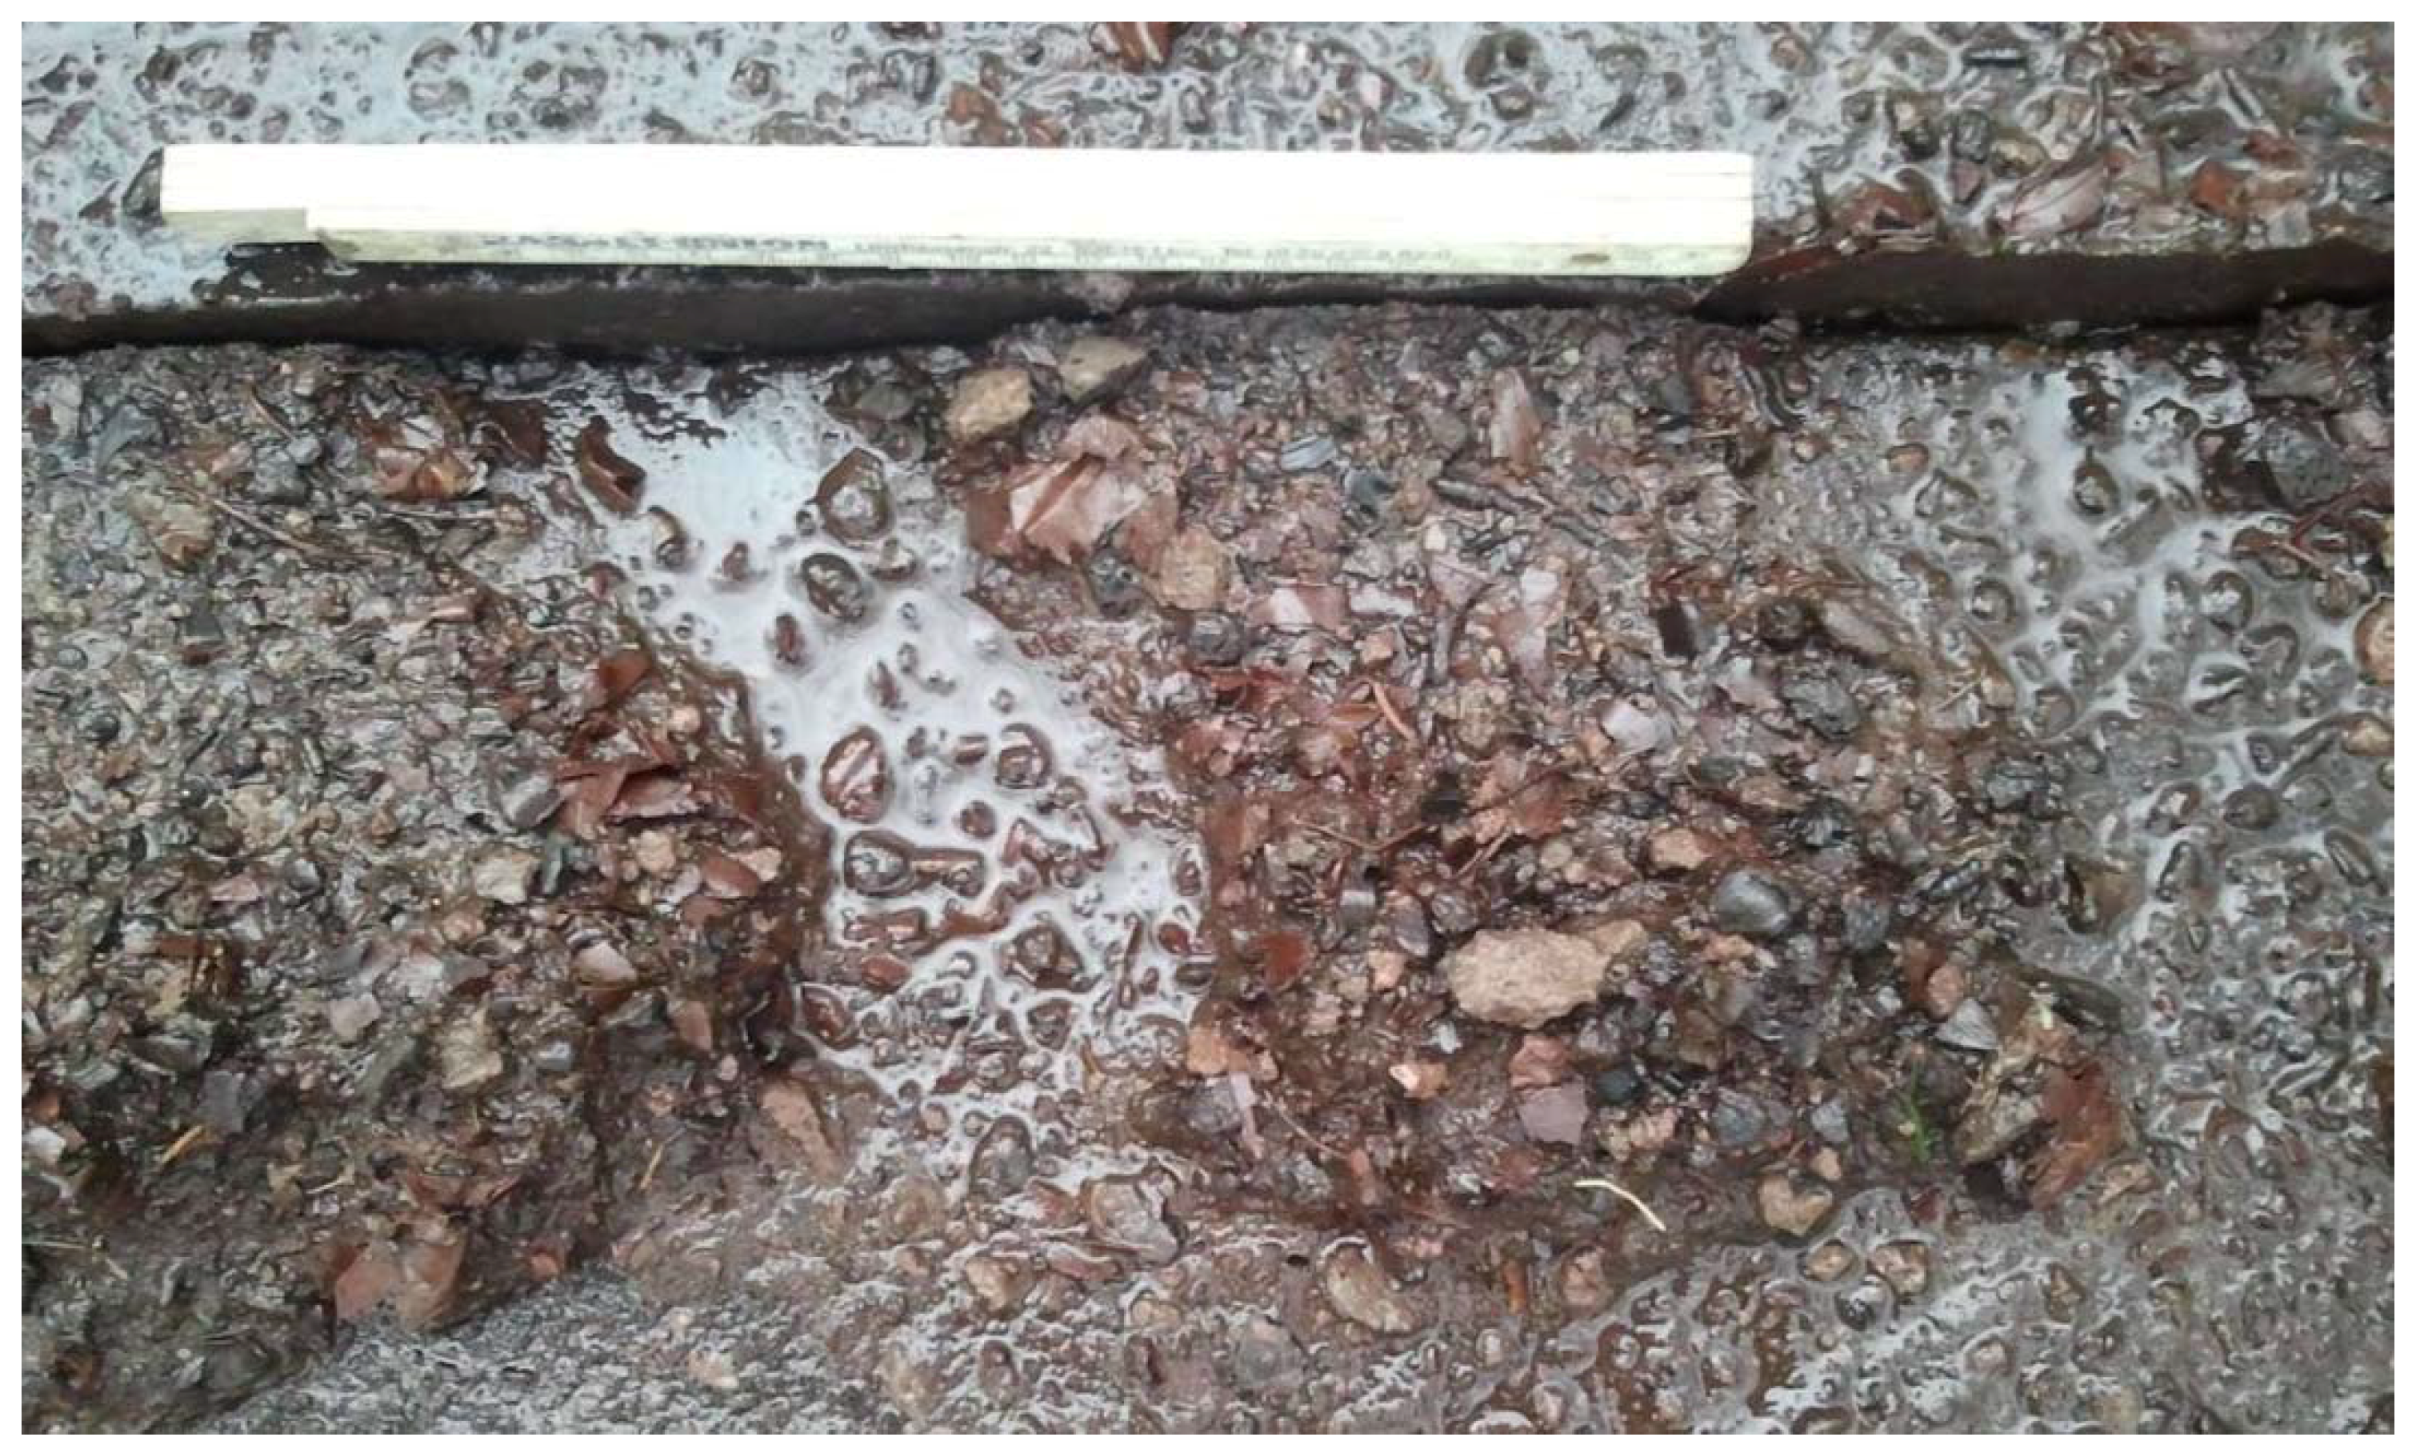
Another simultaneously observable process that potentially limits the soil erosion rates over time is selective soil erosion. Splash detachment and particle transport by flowing water particularly affects high erodible grain sizes like fine sand and silt. Therefore, these grain fractions are transported away from the surface leaving mainly coarse fractions like larger sand and gravel. Over time, these coarse grains function as an armoring layer, a stone mulch preventing the erosion of finer soil particles beneath them or in their immediate vicinity. If the kinetic energy of the applied rainfall is insufficient for detaching the armoring layer, a decreasing soil erosion rate has to be expected. After 90 min of artificial rainfall, however, an enrichment of coarse material was observed (Figure 9).
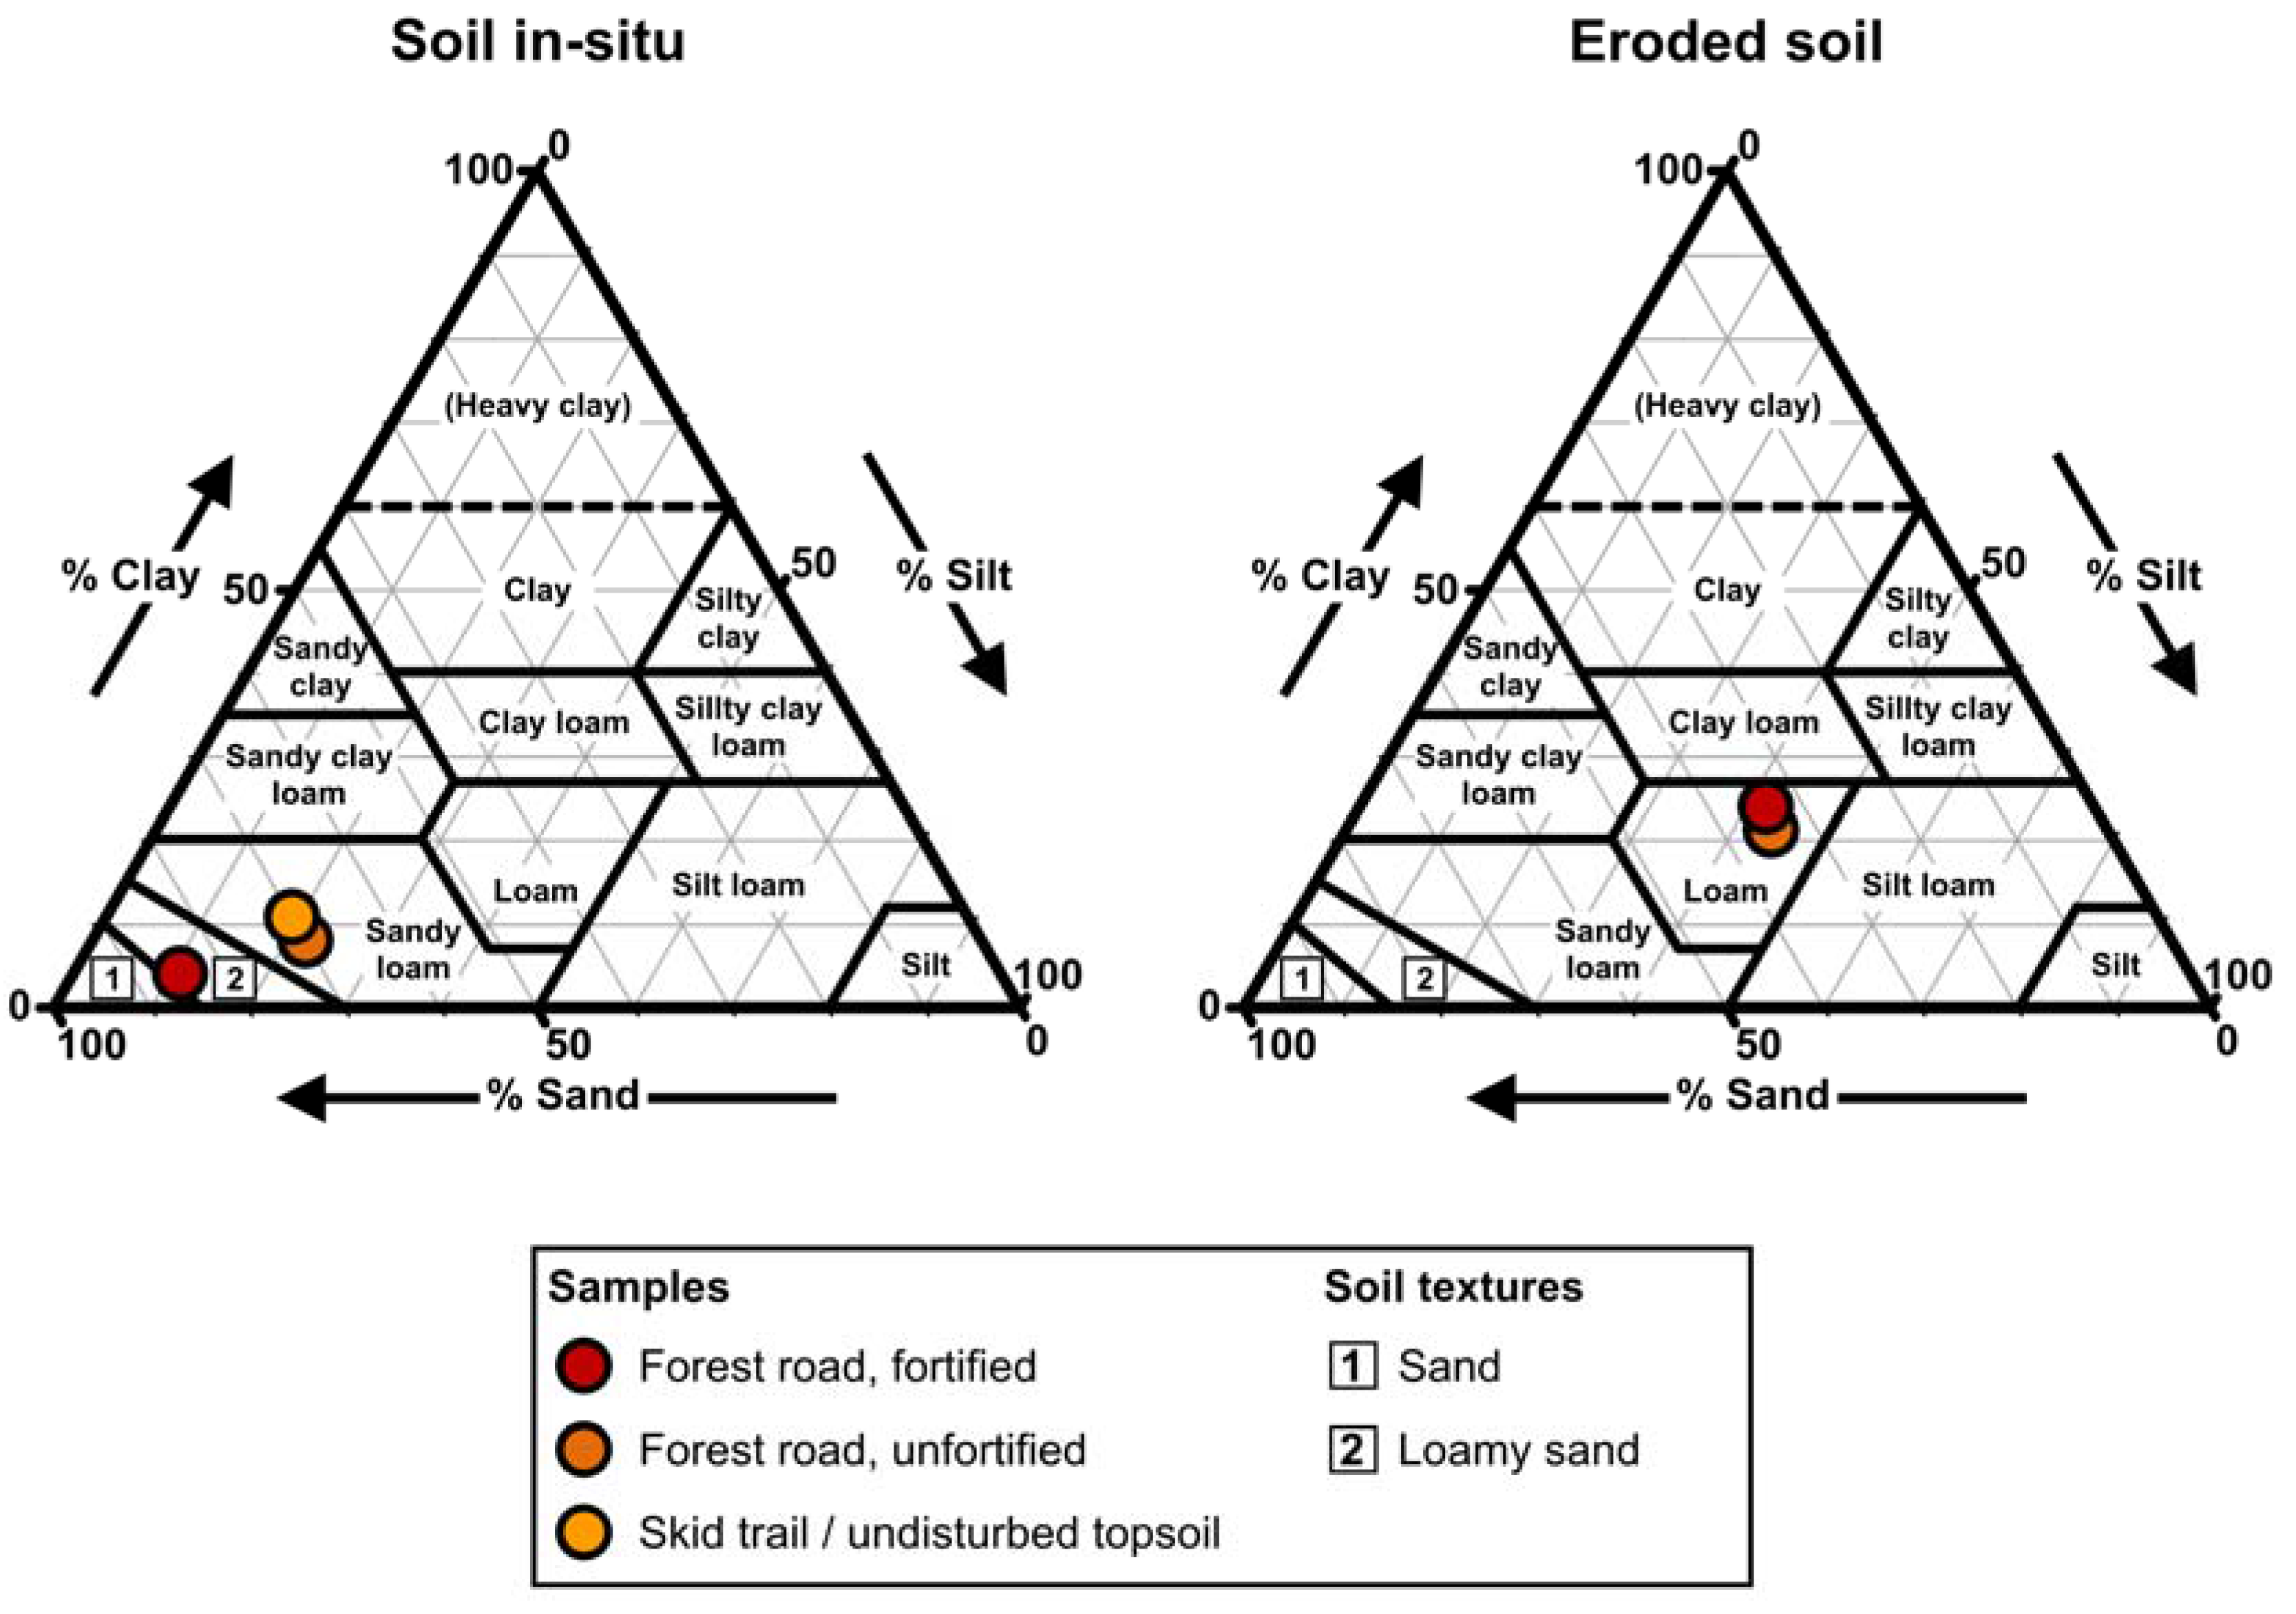
A concluding analysis of the particle-size-distribution using sedimentation was conducted to specify the soil properties of the irrigated plots and to evaluate the possible differences between the initial particle-size-distribution and the grain size composition of the eroded material. As skid trails and forest soils did not generate sufficient erosion to obtain enough material for sedimentation analysis, only samples of forest roads were examined.
Figure 10 features the results of both plot surfaces and mean values for different surfaces. On the basis of the grain-size-distribution, it is clear to see that the unfortified, graded roads show soil textures akin to skid trails and undisturbed topsoil. Both were classified as sandy loam according to USDA soil taxonomy. Again, this indicates that no alteration of the soil texture by any fortification was existent. In contrast to that, fortified roads showed higher percentages of sand, even leading to a classification as another soil type, loamy sand.
Compared to these results, fortified and unfortified roads showed almost identical grain-size-distributions of the eroded material. Both mean soil textures are distinctly finer than their reference specimen. This result is related to the constant rainfall characteristics, which limited the maximum grain size erodible by splash and flowing water. Therefore, both particle-size distributions approximate each other. In this connection, the mean results provide a strong evidence for constant rainfall characteristics during all simulated rainfall events. Beyond that, a selective erosion of fine particles is evident.
Additionally, Table 10 shows the percentage of gravel (particles >2 mm). Mixed samples of fortified roads were intentionally taken exclusive of base course material to examine only the topmost layer that was affected by erosional processes. Again, the limited kinetic rainfall energy caused a distinct difference between eroded soil and the mixed samples of the plot surfaces. While the roads featured almost 50% gravel, only 0.5% and 1.1% of gravel, respectively, was eroded. As explained with the aid of Figure 9, this shows the selective soil erosion observed during the simulation runs.
Still, the results show another allusion to selective erosion considering the results of the mixed samples. The increased percentage of gravel of unfortified forest roads compared to skid trails und forest topsoil most likely indicates an already lacking part of finer particles that was already eroded when the sample was taken.
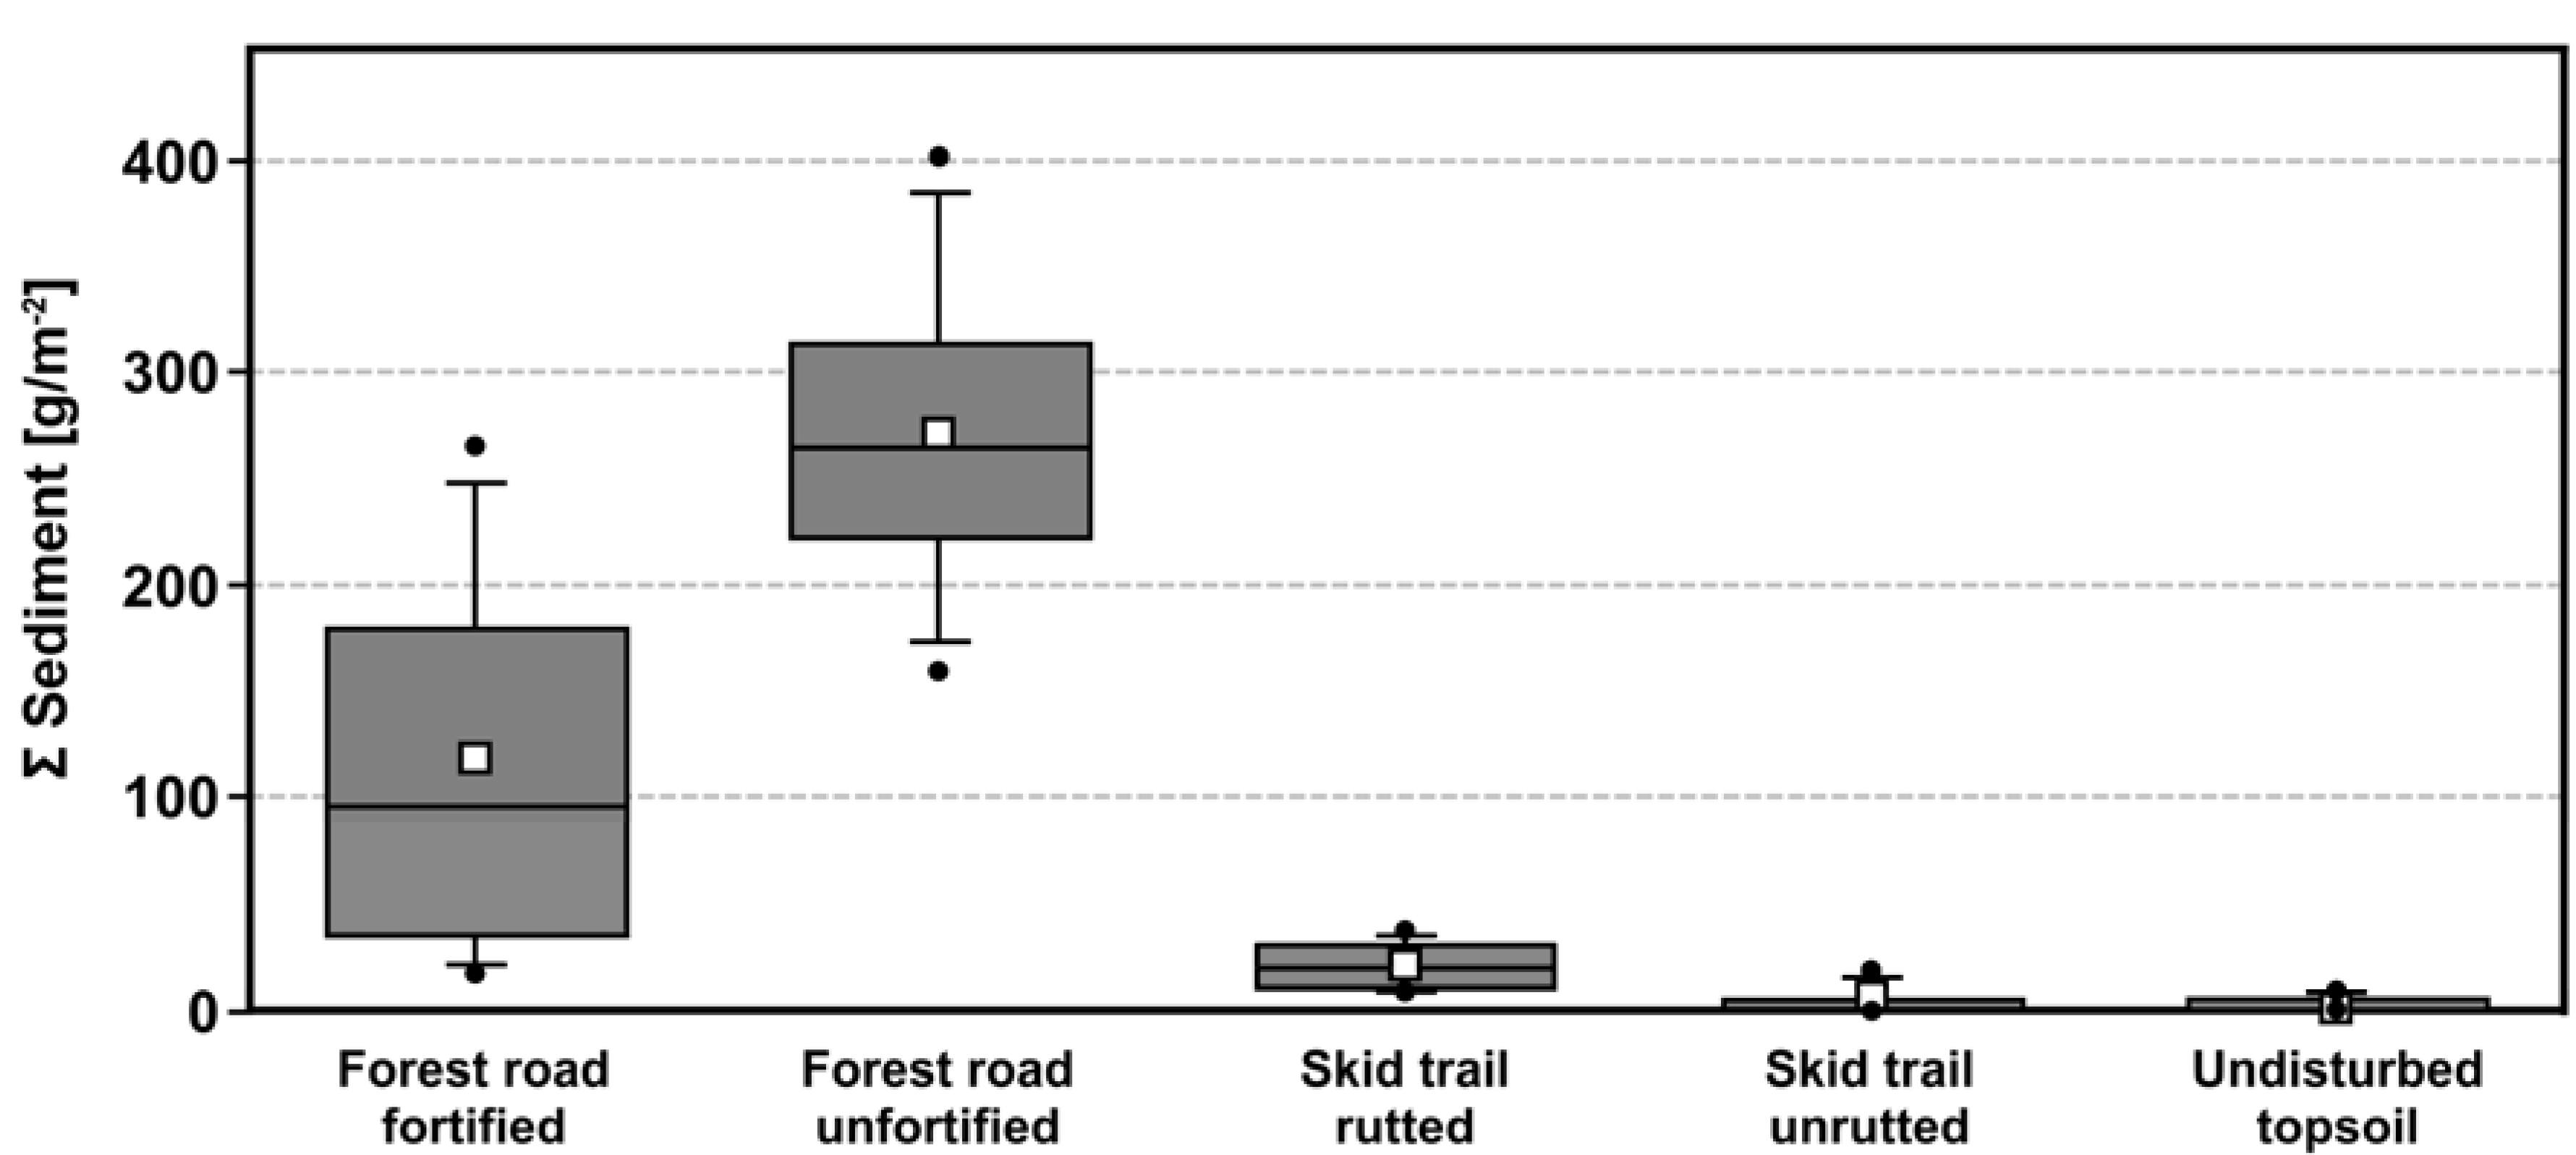
Soil erosion processes were also investigated on a statistical basis. With the help of Boxplot-Diagrams of the mean erosion sums for each surface category, the distinct difference between mostly bare road surfaces and predominantly vegetated skid trails and undisturbed sites is clearly visible (Figure 11).
The Mann–Whitney test (Table 11) shows significant similarities between fortified and unfortified forest roads as well as between unrutted skid trails and undisturbed sites. Rutted skid trails are only similar to fortified roads, indicating a transitional stage between heavily disturbed road surfaces and mostly undisturbed sites.
Again, Spearman-Rho correlations were calculated to investigate, if there were any significant correlations between plot characteristics and soil erosion processes. Only vegetation cover, plot sloping, soil bulk density and gravel content were examined, as soil moisture and WDPT class were not believed to have a direct influence. In exchange, the mean runoff sum was included into the correlation matrix (Table 12).
Throughout the surface categories, there is a strong correlation between mean runoff volume and eroded sediment sum. There is only one exception, unfortified road surfaces. Here, lacking fortification and bare surfaces condition high erosion rates, irrespective of the amount of superficially flowing water. There is also a strong correlation between vegetation cover and sediment yield that tends to be less distinctive with decreasing anthropogenic disturbance. On undisturbed sites, there is still a negative correlation (−0.101), but it is only a fraction of the correlation observed on fortified road surfaces (−0.949).
Studies investigating soil erosion on forest roads and skid trails concordantly state, that the vegetation cover is one of the most important control factors for soil erosion processes. There are numerous studies showing that erosion rates increase significantly with the absence of ground covering vegetation or an artificially applied mulch cover [30,35,40,64,65,66,71,72]. These findings were also confirmed during the presented rainfall simulations. As described, the only exception to this rule is mainly uncompacted sites, were the high infiltration rates impede runoff generation. Thus, no eroding or transporting agent was present, limiting erosion processes only to splash effects.
Regarding the quantities of eroded sediment, [5] again gives a reference for comparable surrounding conditions. Here, a median soil erosion of 41.1 g·m−2 on skid trails and 0.3–0.4 g·m−2 on undisturbed sites is stated, indicating up to 10 times higher erosion rates on skid trails. Converted, the findings presented in this study, show a median of 20.02 g·m−2 on rutted skid trails and 4.64 g·m−2 on undisturbed sites. Given the fact, that the runoff volumes on skid trails presented in [5] were higher than in this study, it seems plausible that the erosion rates are also higher. Nevertheless, there is still a comparable pattern when comparing skid trail surfaces and undisturbed sites, as both studies show a clear increase of soil erosion rates on skid trails. Forest roads were not included in [5]; concerning this study at hand, they featured a median of 96.05 g·m−2 (fortified) and 263.51 g·m−2 (unfortified), showing distinctly higher values than skid trails presented in [5].

4. Conclusions

As there are only very few studies on this subject in Europe, the objective of this study was to investigate the effects of roads and skid trails on runoff generation, water retention and soil erosion processes in forested catchments. Regardless of the type of construction, persistent forest roads caused noticeably increased runoff volumes and soil erosion rates.
Compared to undisturbed sites, where the mean runoff coefficient during 43.6 l of rainfall applied to the plot surface (I = 45 mm·h−1) was 3.7%, forest roads showed mean runoff coefficients up to 92.1%. While undisturbed forest soil showed only negligible erosion rates (4.7 g·m−2 of eroded soil after 90 min of simulated rainfall), distinctly higher rates were measured on forest roads (118.5–272.2 g·m−2).
Skid trails on the other hand also showed increased runoff coefficients, but mainly in the compacted, rutted parts. Here the mean runoff coefficient was 59.9%, while it was only 14.8% in the unrutted parts. Despite the increased runoff coefficients, there was no clearly detectable rise of soil erosion rates, as rutted skid trails only showed a mean sum of eroded sediment of 21.4 g·m−2 and unrutted skid trails a mean sum of 5.1 g·m−2 after 90 min of artificial rainfall.
Considering the dependency between plot characteristics, runoff generation and soil erosion processes, soil compaction most likely triggers overland flow processes. This could be observed especially on skid trails. As usual in soil erosion processes, a vegetation cover seems to have the most important influence as it prevents particles from being detached by splash erosion and retards the generation of overland flow by interception.
In summary, the obtained results indicate that not only forest roads but also skid trails have a massive influence on hydrological properties. This finding leads to potentially severe consequences: while forest road networks are clearly identifiable, skid trails tend to become less clearly visible when they are not used over a longer period. Nevertheless, soil compaction and therefore altered hydrological properties still remain effective. Consequently, there might be an underestimated percentage of forest soils on which significantly altered runoff processes take place when extreme rainfall events occur. Runoff generated on forest roads can be channeled quite easily by lateral ditches, which allow a certain regulation of flowing water. On skid trails, in contrast, such measures are very rarely realized.
Another aspect of this set of problems is the high density of forest road networks. Often, road network densities greater than 100 m·ha−1 can be observed. With an increasing network density, water retention in forested catchments is more and more endangered. Therefore it has to be ensured that road networks are planned in a preferably low density and that soil compaction due to traffic is minimized.
Concerning the findings of the soil erosion assessment, high erosion rates only occurred on bare surfaces and especially on surfaces that were not sufficiently fortified. There are two possibilities to minimize soil erosion on roads. First and foremost, a vegetation cover has to be established, for example on the median strip, to reduce the erosional effects of splash and flowing water. Secondly, if there is a need for the construction of a new forest road, a fortification has to be considered, as it eventually may cause less environmental impact in the long run.

Acknowledgments

I would like to thank the working group of Johannes B. Ries (University Trier) for providing the LNM; Chemical-Technical-Assistant Ulli Bange for his assistance during fieldwork and in the laboratory; and Dieter König (University Koblenz) for his helpful suggestions during the research activities.

Conflicts of Interest

The author declares no conflict of interest.

References

  1. B.C. Ministry of Forests. Forest Road Engineering Guidebook, 2nd ed.Forest Practices Code of British Columbia, B.C. Ministry of Forests: Victoria, BC, Canada, 2002.
  2. Dietz, P.; Knigge, W.; Löffler, H. Walderschließung. Ein Lehrbuch für Studium und Praxis unter Besonderer Berücksichtigung des Waldwegebaus, 2nd ed.; Verlag Kessel: Remagen-Oberwinter, Germany, 2011. [Google Scholar]
  3. Swift, L.W., Jr. Forest Access Roads: Design, Maintenance, and Soil Loss. In Forest Hydrology and Ecology at Coweeta; Swank, W.T., Crossley, D.A., Jr., Eds.; Springer-Verlag: New York, NY, USA, 1988; pp. 313–324. [Google Scholar]
  4. Foltz, R.B.; Copeland, N.S.; Elliot, W.J. Reopening abandoned forest roads in northern Idaho, USA: Quantification of runoff, sediment concentration, infiltration, and interrill erosion parameters. J. Environ. Manag. 2009, 90, 2542–2550. [Google Scholar] [CrossRef] [PubMed]
  5. Butzen, V.; Seeger, M.; Wirtz, S.; Huemann, M.; Mueller, C.; Casper, M.; Ries, J.B. Quantification of Hortonian overland flow generation and soil erosion in a Central European low mountain range using rainfall experiments. Catena 2014, 113, 202–212. [Google Scholar] [CrossRef]
  6. La Marche, J.L.; Lettenmaier, D.P. Effects of Forest Roads on Flood Flows in the Deschutes River, Washington. Earth Surf. Process. Landf. 2001, 26, 115–134. [Google Scholar] [CrossRef]
  7. Zemke, J.J.; König, D. Abflussbildung und Bodenerosion auf Forstwegen. Geogr. Rundsch. 2016, 68, 46–53. [Google Scholar]
  8. Horn, R.; Vossbrink, J.; Becker, S. Modern forestry vehicles and their impacts on soil physical properties. Soil Tillage Res. 2004, 79, 207–219. [Google Scholar] [CrossRef]
  9. Dickerson, B.P. Soil compaction after tree-length skidding in Northern Mississippi. Soil Sci. Soc. Am. J. 1976, 40, 965–966. [Google Scholar] [CrossRef]
  10. Froehlich, H.A.; Miles, D.W.R.; Robbins, R.W. Soil bulk density recovery on compacted skid trails in central Idaho. Soil Sci. Soc. Am. J. 1985, 49, 1015–1017. [Google Scholar] [CrossRef]
  11. Thorud, D.B.; Frissell, S.S. Time Changes in Soil Density Following Compaction under an Oak Forest; No. 25; Minnessota Forest Research Notes; University of Minnesota: Minneapolis, MN, USA, 1976. [Google Scholar]
  12. Luce, C.H. Hydrological processes and pathways affected by forest roads: What do we still need to learn? Hydrol. Process. 2002, 16, 2901–2904. [Google Scholar] [CrossRef]
  13. Jones, J.A.; Achterman, G.L.; Augustine, L.A.; Creed, I.F.; Ffolliott, P.F.; MacDonald, L.; Wemple, B.C. Hydrologic effects of a changing forested landscape—Challenges for the hydrological sciences. Hydrol. Process. 2009, 23, 2699–2704. [Google Scholar] [CrossRef]
  14. Luce, C.H.; Wemple, B.C. Introduction to special issue on hydrologic and geomorphic effects of forest roads. Earth Surf. Process. Landf. 2001, 26, 111–113. [Google Scholar] [CrossRef]
  15. Backes, C.; Gallus, M.; Schubert, D.; Schüler, G.; Vasel, R. Entschärfung von linearen Abflüssen durch vorsorgende Waldwegebautechnik. In Dezentraler Wasserrückhalt in der Landschaft durch Vorbeugende Maßnahmen der Waldwirtschaft, der Landwirtschaft und im Siedlungswesen. Mitteilungen aus der Forschungsanstalt für Waldökologie und Forstwirtschaft Rheinland-Pfalz Nr. 64/07; Schüler, G., Gellweiler, I., Seeling, S., Eds.; Zentralstelle der Forstverwaltung Forschungsanstalt für Waldökologie und Forstwirtschaft Rheinland-Pfalz (FAWF): Trippstadt, Germany, 2007; pp. 60–61. [Google Scholar]
  16. Bonell, M. Progress in the understanding of runoff generation dynamics in forests. J. Hydrol. 1993, 150, 217–275. [Google Scholar] [CrossRef]
  17. Grant, G.E.; Lewis, S.L.; Swanson, F.J.; Cissel, J.H.; McDonnell, J.J. Effects of Forest Practices on Peak Flows and Consequent Channel Response: A State-of-Science Report for Western Oregon and Washington; USDA Forest Service General Technical Report PNW-GTR-760; U.S. Department of Agriculture, Forest Service, Pacific Northwest Research Station: Portland, OR, USA, May 2008.
  18. Morgan, R.P.C. Soil Erosion and Conservation, 3rd ed.; Blackwell Publishing Ltd.: Oxford, UK, 2005. [Google Scholar]
  19. Thornes, J.B. Vegetation and Erosion; J. Wiley: Chichester, UK, 1990. [Google Scholar]
  20. MacDonald, L.H.; Sampson, R.W.; Anderson, D.M. Runoff and road erosion at the plot and road segment scales, St. John, US Virgin Islands. Earth Surf. Process. Landf. 2001, 26, 251–272. [Google Scholar] [CrossRef]
  21. Sheridan, G.; Noske, P. Quantifying the Water Quality Benefits of Erosion and Sediment Control Practices on Unsealed Forest Roads; Final Report 2005; Research Report for the Gippsland Lakes Future Directions Action Plan and the Victorian Forest Service; Department of Sustainability and Environment, School of Forest and Ecosystem Science, University of Melbourne: Melbourne, Austrilia, 2005. [Google Scholar]
  22. Wemple, B.C. Investigations of Runoff Production and Sedimentation on Forest Roads. Ph.D. Thesis, Oregon State University, Corvallis, OR, USA, 30 November 1998. [Google Scholar]
  23. Cerdà, A.; Ibáñez, S.; Calvo, A. Design and operation of a small and portable rainfall simulator for rugged terrain. Soil Technol. 1997, 11, 163–170. [Google Scholar] [CrossRef]
  24. Cerdà, A. Soil water erosion on road embankments in eastern Spain. Sci. Total Environ. 2007, 378, 151–155. [Google Scholar] [CrossRef] [PubMed]
  25. Humphry, J.B.; Daniel, T.C.; Edwards, D.R.; Sharpley, A.N. A Portable Rainfall Simulator for Plot-Scale Runoff Studies. Appl. Eng. Agric. 2002, 18, 199–204. [Google Scholar] [CrossRef]
  26. Foltz, R.B.; Copeland, N.S. Improving erosion modeling on forest roads in the Lake Tahoe Basin: Small plot rainfall simulations to determine saturated hydraulic conductivity and interrill erodibility. In Proceedings of the 2009 ASABE Annual International Meeting, Reno, NV, USA, 21–24 June 2009; American Society of Agricultural and Biological Engineers: St. Joseph, MI, USA, 2009. Paper No. 095553. [Google Scholar]
  27. Iserloh, T.; Fister, W.; Seeger, M.; Williger, H.; Ries, J.B. A small portable rainfall simulator for reproducible experiments on soil erosion. Soil Tillage Res. 2012, 124, 131–137. [Google Scholar] [CrossRef]
  28. Iserloh, T.; Ries, J.B.; Arnáez, J.; Boix Fayos, C.; Butzen, V.; Cerdà, A.; Echeverría, M.T.; Fernández-Gálvez, J.; Fister, W.; Geißler, C.; et al. European small portable rainfall simulators: A comparison of rainfall characteristics. Catena 2013, 110, 100–112. [Google Scholar] [CrossRef] [Green Version]
  29. Iserloh, T.; Ries, J.B.; Cerdá, A.; Echeverría, M.T.; Fister, W.; Geißler, C.; Kuhn, N.J.; León, F.J.; Peters, P.; Schindewolf, M.; et al. Comparative measurements with seven rainfall simulators on uniform bare fallow land. Z. Geomorphol. 2013, 57, 11–26. [Google Scholar] [CrossRef]
  30. Seitz, S.; Goebes, P.; Zumstein, P.; Assmann, T.; Kühn, P.; Niklaus, P.A.; Schuldt, A.; Scholten, T. The influence of leaf litter diversity and soil fauna on initial soil erosion in subtropical forests. Earth Surf. Process. Landf. 2015, 40, 1439–1447. [Google Scholar] [CrossRef]
  31. Salem, H.M.; Valero, C.; Muñoz, M.Á.; Gil-Rodríguez, M.; Barreiro, P. Effect of reservoir tillage on rainwater harvesting and soil erosion control under a developed rainfall simulator. Catena 2014, 113, 353–362. [Google Scholar] [CrossRef] [Green Version]
  32. Backes, C. Durchführung von Beregnungsversuchen und Herleitung eines Klassifizierungstools zur Bewertung des Potentiellen Abflussverhaltens von Wege- und Linienstrukturen. Diploma Thesis, University of Trier, Trier, Germany, November 2005. [Google Scholar]
  33. Arnáez, J.; Larrea, V.; Ortigosa, L. Surface runoff and soil erosion on unpaved forest roads from rainfall simulation tests in northeastern Spain. Catena 2004, 57, 1–14. [Google Scholar] [CrossRef]
  34. Jordán, A.; Martínez-Zavala, L. Soil loss and runoff rates on unpaved forest roads in southern Spain after simulated rainfall. For. Ecol. Manag. 2008, 255, 913–919. [Google Scholar] [CrossRef]
  35. Jordán-López, A.; Martínez-Zavala, L.; Bellinfante, N. Impact of different parts of unpaved forest roads on runoff and sediment yield in a Mediterranean area. Sci. Total Environ. 2009, 407, 937–944. [Google Scholar] [CrossRef] [PubMed]
  36. Robichaud, P.R.; Wagenbrenner, J.W.; Brown, R.E. Rill erosion in natural and disturbed forests: 1. Measurements. Water Resour. Res. 2010, 46, W10506. [Google Scholar] [CrossRef]
  37. Burroughs, E.R., Jr.; King, J.G. Reduction of Soil Erosion on Forest Roads; USDA Forest Service, Intermountain Research Station: Ogden, UT, USA, 1989.
  38. Akbarimehr, M.; Naghdi, R. Determination of most appropriate distance between water diversions on skid trails in the mountainous forest, north of Iran. Catena 2012, 88, 68–72. [Google Scholar] [CrossRef]
  39. Douglas, I. Predicting road erosion rates in selectively logged tropical rain forests. In Proceedings of the IUGG2003, Sapporo, Japan, 30 July–11 July 2003. IAHS Publ. No. 279.
  40. Croke, J.; Harsine, P.; Fogarty, P. Soil recovery from track construction and harvesting changes in surface infiltration, erosion and delivery rates with time. For. Ecol. Manag. 2001, 143, 3–12. [Google Scholar] [CrossRef]
  41. Luce, C.H.; Black, T.A. Sediment production from forest roads in western Oregon. Water Resour. Res. 1999, 35, 2561–2570. [Google Scholar] [CrossRef]
  42. Wemple, B.C.; Swanson, F.J.; Jones, J.A. Forest roads and geomorphic process interactions, Cascade Range, Oregon. Earth Surf. Process. Landf. 2001, 26, 191–204. [Google Scholar] [CrossRef]
  43. Tempel, M. Abflussverhalten Kleiner, Forstlich Genutzter Bacheinzugsgebiete am Beispiel des Einzugsgebietes des Oberen Gräfenbaches im Soonwald/Hunsrück. Ph.D. Thesis, Johannes Gutenberg-Universität Mainz, Mainz, Germany, 13 October 2006. [Google Scholar]
  44. Spies, T.A.; Hibbs, D.E.; Ohmann, J.L.; Reeves, G.H.; Pabst, R.J.; Swanson, F.J.; Whitlock, C.; Jones, J.A.; Wemple, B.C.; Parendes, L.A.; et al. The ecological basis of forest ecosystem management in the Oregon Coast Range. In Forest and Stream Management in the Oregon Coast Range; Hobbs, S.D., Hayes, J.P., Johnson, R.L., Reeves, G.H., Spies, T.A., Tappeiner, J.C., II, Wells, G.E., Eds.; Oregon State University Press: Corvallis, OR, USA, 2002; pp. 31–67. [Google Scholar]
  45. Trombulak, S.C.; Frissell, C.A. Review of ecological effects of roads on terrestrial and aquatic communities. Conserv. Biol. 2001, 14, 18–30. [Google Scholar] [CrossRef]
  46. Flanagan, S.A.; Furniss, M.J.; Ledwith, T.S.; Thiesen, S.; Love, M.; Moore, K.; Ory, J. Methods for Inventory and Environmental Risk Assessment of Road Drainage Crossings; USDA Forest Service, Technology and Development Program: San Dimas, CA, USA, 1998.
  47. Megahan, W.F.; Wilson, M.D.; Monsen, S.B. Sediment production from granitic cutslopes on forest roads in Idaho, USA. Earth Surf. Process. Landf. 2001, 26, 153–163. [Google Scholar] [CrossRef]
  48. Riedel, M.S.; Swift, L.W., Jr.; Vose, J.M.; Clinton, B.D. Forest road erosion research at the Coweeta Hydrologic Laboratory. In Advancing the Fundamental Sciences: Proceedings of the Forest Service National Earth Sciences Conference, Proceedings of the Forest Service National Earth Sciences Conference, San Diego, CA, USA, 18–22 October 2004; Furniss, M., Clifton, C., Ronnenberg, K., Eds.; USDA Forest Service, Pacific Northwest Research Station: Portland, OR, USA, 2007. [Google Scholar]
  49. Madej, M.A. Erosion and sediment delivery following removal of forest roads. Earth Surf. Process. Landf. 2001, 26, 175–190. [Google Scholar] [CrossRef]
  50. Anderson, C.J.; Lockaby, B.G. Research gaps related to forest management and stream sediment in the United States. Environ. Manag. 2011, 47, 303–313. [Google Scholar] [CrossRef] [PubMed]
  51. Reid, L.M.; Dunne, T. Sediment production from forest road surfaces. Water Resour. Res. 1984, 20, 1753–1761. [Google Scholar] [CrossRef]
  52. Lane, P.M.J.; Sheridan, G.J. Impact of an unsealed forest road stream crossing: Water quality and sediment sources. Hydrol. Process. 2002, 16, 2599–2612. [Google Scholar] [CrossRef]
  53. Harr, R.D.; Nichols, R.A. Stabilizing forest roads to help restore fish habitats: A Northwest Washington example. Fisheries 1993, 18, 18–22. [Google Scholar] [CrossRef]
  54. Ramos Scharrón, C.E. Sediment production from unpaved roads in a sub-tropical dry setting—Southwestern Puerto Rico. Catena 2010, 82, 146–158. [Google Scholar] [CrossRef]
  55. Hartanto, H.; Prabhu, R.; Widayat, A.S.E.; Asdak, C. Factors affecting runoff and soil erosion: Plot-level soil loss monitoring for assessing sustainability of forest management. For. Ecol. Manag. 2003, 180, 361–374. [Google Scholar] [CrossRef]
  56. Sidle, R.C.; Sasaki, S.; Otsuki, M.; Noguchi, S.; Nik, A.R. Sediment pathways in a tropical forest: Effects of logging roads and skid trails. Hydrol. Process. 2004, 18, 703–720. [Google Scholar] [CrossRef]
  57. Fransen, P.J.B.; Phillips, C.J.; Fahey, B.D. Forest road erosion in New Zealand: Overview. Earth Surf. Process. Landf. 2001, 26, 165–174. [Google Scholar] [CrossRef]
  58. Croke, J.; Mockler, S. Gully initiation and road-to-stream linkage in a forested catchment, Southeastern Australia. Earth Surf. Process. Landf. 2001, 26, 205–217. [Google Scholar] [CrossRef]
  59. Arnáez, J.; Larrea, V. Erosion processes and rates on road-sides of hill-roads (Iberian System, La Rioja, Spain). Phys. Chem. Earth 1995, 20, 395–401. [Google Scholar] [CrossRef]
  60. Fornis, R.L.; Vermeulen, H.R.; Nieuwenhuis, J.D. Kinetic energy-rainfall intensity relationship for Central Cebu, Philippines for soil erosion studies. J. Hydrol. 2005, 300, 20–32. [Google Scholar] [CrossRef]
  61. Christiansen, J.E. Irrigation by Sprinkling; University of Califonia: Berkeley, CA, USA, 1942. [Google Scholar]
  62. Schwickert, P.W. Das Laacher Kuppenland. Eine Vegetationsgeographische Untersuchung als Beitrag zur Naturräumlichen Gliederung. Ph.D. Thesis, University Koblenz-Landau, Koblenz, Germany, 2 December 2009. [Google Scholar]
  63. Zemke, J.J. Messung, Simulation und Modellierung von Oberflächenabfluss und Bodenabtrag auf Wirtschaftswegen in Bewaldeten Einzugsgebieten. Ph.D. Thesis, University Koblenz-Landau, Koblenz, Germany, 11 November 2014. [Google Scholar]
  64. Ghahramani, A.; Ishikawa, Y.; Gomi, T.; Shikari, K.; Miyata, S. Effect of gorund cover on splash and sheetwash erosion over a steep forested hillslope: A plot-scale study. Catena 2011, 85, 34–47. [Google Scholar] [CrossRef]
  65. Siepel, A.C.; Steenhuis, T.S.; Rose, C.W.; Parlange, J.Y.; McIsaac, G.F. A simplified hillslope eorison model with vegetation elements for practical application. J. Hydrol. 2002, 258, 111–121. [Google Scholar] [CrossRef]
  66. Swift, L.W., Jr. Gravel and grass surfacing reduces soil loss from mountain roads. For. Sci. 1984, 30, 657–670. [Google Scholar]
  67. Doerr, S.H.; Shakesby, R.A.; Wlash, R.P.D. Soil water repellency: Its causes, characteristics and hydro-geomorphological significance. Earth-Sci. Rev. 2000, 51, 33–65. [Google Scholar] [CrossRef]
  68. Harris, R.; Jarvis, C. Statistics for Geography and Environmental Science, 1st ed.; Routledge: Abingdon, UK, 2011. [Google Scholar]
  69. Schüler, G. Identification of flood-generating forest areas and forestry measures for water retention. For. Snow Landsc. Res. 2006, 80, 99–114. [Google Scholar]
  70. Auerswald, K.; Fiener, P.; Dikau, R. Rates of sheet and rill erosion in Germany—A meta-analysis. Geomorphology 2009, 111, 182–193. [Google Scholar] [CrossRef]
  71. Foltz, R.B. A comparison of three erosion control mulches on decommissioned forest road corridors in the northern Rocky Mountains, United States. J. Soil Water Conserv. 2012, 67, 536–544. [Google Scholar] [CrossRef]
  72. Foltz, R.B.; Copeland, N.S. Evaluating the efficacy of wood shreds for mitigating erosion. J. Environ. Manag. 2009, 90, 779–785. [Google Scholar] [CrossRef] [PubMed]
Figure 1. Localization of the study areas Laacher See (LS) and national park Hunsrück-Hochwald (NPHH).
Hydrology 03 00025 g001
Figure 2. Rainfall simulator setup on a forest road, windshield removed for a better visibility.
Hydrology 03 00025 g002
Figure 3. Exemplary road surfaces: (left) fortified road; (middle) unfortified road; and (right) skid trail.
Hydrology 03 00025 g003
Figure 4. Exemplary hydrographs for different surface types. Indicated rainfall intensity error (+0.05 mm·min−1) calculated on the basis of fortified forest road simulation. Q = Runoff volume per minute; t = Time.
Hydrology 03 00025 g004
Figure 5. Successive erosion of tire imprints during rainfall simulation.
Hydrology 03 00025 g005
Figure 6. Mean runoff (Q) and infiltration (Inf) percentages for each surface category, time interval 10 min (t).
Hydrology 03 00025 g006
Figure 7. Boxplots of mean total runoff volumes (t = 90 min) for different surface categories.
Hydrology 03 00025 g007
Figure 8. Mean sum of eroded sediment for each rainfall event, differentiated between surface categories.
Hydrology 03 00025 g008
Figure 9. Residual accumulation of coarse material after 90 min of artificial rainfall, rule (0.23 m) for scale.
Hydrology 03 00025 g009
Figure 10. Comparison between mean soil types of the plot surfaces (mixed samples) and mean soil types of the soil erosion samples, USDA soil taxonomy.
Hydrology 03 00025 g010
Figure 11. Boxplots of mean erosion sums for different surface categories.
Hydrology 03 00025 g011
Table 1. Morphometric, pedologic and geologic characteristics of the study areas.
CatchmentArea (km2) Avg. Elev. (m)Avg. Slope (°)Dominant GeologyUSDA Soil TextureRoad Density (m·ha−1)
LS1.235515LST, basanite, slatesandy loam162
NPHH6.96766Quartzite, slatesandy loam330
Table 2. Rainfall characteristics during simulation runs (operating pressure = 0.09 bar).
Output (L·min−1)P 1 (L·min−1 * Plotsize−1)I 2 (mm·h−1)KE 3 (J·m−2 * mm−1)CU 4 (%)d50 5 (mm)
0.970.48454.6>800.28
1 Rainfall applied to plot surface; 2 Rainfall intensity; 3 Rainfall kinetic energy; 4 Christiansen-Coefficient; 5 Median drop size.
Table 3. Plot characteristics for all conducted experiments.
#SurfaceCatchmentVeg. Cover (%)SlopeSoil MoistureΡ 1GravelWDPT 2
BeforeAfter
Category(°)(%)(%)(Mg·m−3)(%)Class
1road, fort.LS01.422.739.20.7350.40
2road, fort.LS 301.727.337.10.8251.20
3road, fort.LS591.618.432.40.9550.10
4road, fort.LS132.024.635.80.9847.60
5road, unfort.LS07.818.227.31.1049.10
6road, unfort.LS06.816.423.81.2047.50
7road, unfort.LS09.019.126.21.1546.70
8road, unfort.LS011.019.828.11.0545.90
9skid trail, rut.LS8513.412.224.11.1823.43
10skid trail, rut.LS896.116.522.41.2125.72
11skid trail, rut.LS899.417.822.81.3022.32
12skid trail, rut.NPHH 4905.019.431.21.2819.11
13skid trail, unrut.LS996.411.429.11.1221.73
14skid trail, unrut.LS914.822.234,71.2024.34
15skid trail, unrut.LS964.018.132.10.9822.23
16skid trail, unrut.NPHH984.215.331.41.1118.73
17skid trail, unrut.NPHH975.517.430.81.0419.42
18undisturbedLS1005.014.528.20.9918.94
19undisturbedLS4010.013.829.41.2321.26
20undisturbedLS28.510.919.51.0320.15
21undisturbedNPHH1005.921.229.70.9818.44
22undisturbedNPHH1007.318.130.41.0812.24
23undisturbedNPHH1004.416.531.81.0110.15
1 Bulk density; 2 Water Drop Penetration Time; 3 Laacher See; 4 National park Hunsrück-Hochwald.
Table 4. Runoff values of each simulation.
#SurfaceEvent 1Event 2Event 3Total
Σ Q 1C 2Σ QCΣ QCC
Category(L·m−2)(%)(L·m−2)(%)(L·m−2)(%)(%)
1road, fort.11.6751.420.8992.022.0897.280.2
2road, fort.17.1475.521.8396.123.66104.292.0
3road, fort.9.3641.220.4289.920.9392.274.4
4road, fort.15.8769.917.9479.021.2793.780.9
5road, unfort.16.3672.021.6595.323.39103.090.1
6road, unfort.20.9792.423.38102.9723.11101.899.0
7road, unfort.11.8552.222.6899.923.65104.285.4
8road, unfort.17.4776.923.21102.223.35102.894.0
9skid trail, rut.13.6460.121.7395.723.09101.785.8
10skid trail, rut.9.4341.516.7773.919.6386.567.3
11skid trail, rut.6.5028.614.4863.815.5968.753.7
12skid trail, rut.1.878.26.1827.214.2262.632.6
13skid trail, unrut.0.070.30.271.22.9713.14.9
14skid trail, unrut.3.0813.66.1126.95.9326.122.2
15skid trail, unrut.5.4824.112.1053.312.6655.844.3
16skid trail, unrut.0.070.30.190.80.110.50.5
17skid trail, unrut.0.060.30.411.80.904.02.0
18undisturbed0.241.10.170.80.401.81.2
19undisturbed0.472.10.662.90.612.72.6
20undisturbed2.6311.62.2610.00.582.68.0
21undisturbed0.592.61.416.20.944.14.3
22undisturbed0.060.30.331.50.582.61.4
23undisturbed0.602.61.004.41.476.54.5
1 Runoff volume; 2 Runoff coefficient.
Table 5. Mean total runoff volumes (t = 90 min) and runoff coefficients for different surface categories.
Surface CategoryMean Σ Q 1Mean C 2
(L·m−2)(%)
Forest road, fortified55.7781.9
Forest road, unfortified62.7692.1
Skid trail, rutted40.7859.9
Skid trail, unrutted10.0814.8
Undisturbed topsoil2.503.7
1 Runoff volume; 2 Runoff coefficient.
Table 6. Significance of surface type differences regarding runoff volumes, Mann–Whitney test.
Surface CategroyForest RoadForest RoadSkid TrailSkid Trail
ForitifiedUnfortifiedRuttedUnrutted
Forest road, unfortified 0.114
Skid trail, rutted0.2000.057
Skid trail, unrutted0.016 *0.016 *0.032 *
Undisturbed topsoil0.010 *0.010 *0.010 *0.537
* Significantly different (p < 0.05).
Table 7. Spearman-Rho correlations between mean runoff volumes and plot chracteristics.
CoverSlopeSoil Moist.ρ 1GravelWDPT 2
BeforeAfter
Mean Σ Q 3All experiments−0.830 **0.1150.394−0.116−0.0230.844 **0.773 **
Forest road, fortified−0.6320.6001.000 **0.4000.0000.400-
Forest road, unfortified-−0.400−0.400−0.2000.2000.000-
Skid trail, rutted−0.9490.800−1.000 **−0.400−0.8000.8000.949
Skid trail unrutted−0.600−0.3000.6000.500−0.1000.900 *0.447
Undisturbed topsoil−0.5070.086−0.257−0.029−0.029−0.0290.494
* Significant correlation at 0.01 level; ** significant correlation at 0.05 level. 1 Bulk density; 2 Water Drop Penetration Time; 3 Runoff volume.
Table 8. Eroded sediment sums for each simulation.
#SurfaceEvent 1Event 2Event 3Total
CategoryΣ Sediment (g·m−2)Σ Sediment (g·m−2)Σ Sediment (g·m−2)Σ Sediment (g·m−2)
1road, fort.40.7255.2254.12150.06
2road, fort.86.2985.0293.78265.09
3road, fort.6.097.603.0716.76
4road, fort.16.9111.9613.1742.04
5road, unfort.52.5976.69114.29243.56
6road, unfort.223.57107.5670.68401.81
7road, unfort.55.46123.40104.59283.45
8road, unfort.70.6154.1235.20159.93
9skid trail, rut.10.7013.3612.5136.56
10skid trail, rut.10.729.867.8728.45
11skid trail, rut.4.414.632.5511.59
12skid trail, rut.0.862.525.598.97
13skid trail, unrut.0.000.002.272.27
14skid trail, unrut.1.311.421.133.86
15skid trail, unrut.7.055.425.7218.19
16skid trail, unrut.0.230.240.100.57
17skid trail, unrut.0.050.110.961.12
18undisturbed1.000.350.672.01
19undisturbed2.021.690.914.63
20undisturbed5.062.100.497.65
21undisturbed2.801.651.916.37
22undisturbed1.051.402.214.65
23undisturbed0.910.730.131.77
Table 9. Mean sums of sediment eroded from different surface categories during three consecutive rainfall events.
Surface CategoryMean Σ Sediment (g·m−2)
Event 1Event 2Event 3Total
Forest road, fortified37.540.041.0118.5
Forest road, unfortified100.690.481.2272.2
Skid trail, rutted6.77.67.121.4
Skid trail, unrutted1.71.42.05.1
Undisturbed topsoil2.11.31.34.7
Table 10. Percentage of Gravel in in-situ and eroded soil for different surface categories.
Surface CategoryGravel in Soil in-SituGravel in Eroded Soil
(%)(%)
Forest road, fortified *50.40.5
Forest road, unfortified47.51.1
Skid trail/forest topsoil30.6---
* Sample taken exclusive of base course material.
Table 11. Significance of surface type differences regarding soil erosion sums, Mann–Whitney test.
Surface CategoryForest RoadSkid Trail
FortifiedUnfortifiedRuttedUnrutted
Forest road, unfortified 0.083
Skid trail, rutted0.0830.021 *
Skid trail, unrutted0.027 *0.014 *0.049 *
Undisturbed topsoil0.011 *0.011 *0.011 *0.201
* Significantly different (p < 0.05).
Table 12. Spearman-Rho correlations between mean runoff volumes and plot chracteristics.
Mean Σ Q 1CoverSlopeρ 2Gravel
Mean Σ SedimentAll experiments0.931 **−0.800 **0.087−0.1050.759 **
Forest road, fortified0.800−0.9490.000−0.6000.800
Forest road, unfortified0.200-−0.8001.000 **0.400
Skid trail, rutted0.800−0.6320.400−1.000 **0.600
Skid trail unrutted1.000 **−0.600−0.300−0.1000.900 *
Undisturbed topsoil0.600−0.1010.143−0.257−0.200
* Significant correlation at 0.01 level; ** significant correlation at 0.05 level. 1 Runoff volume; 2 Bulk density.

