1. Introduction
For the last two decades, the degradation of land and water resources due to increased population and extensive land use change has been challenging the future agriculture sustainability of India [
1,
2,
3]. Degradation of water resources, increased soil salinity and waterlogging problems have been widely reported as a major threat to sustainable agricultural production. The soil salinity and waterlogging are two major burning issues in the irrigated lands, and these problems are more pronounced in arid regions of India [
4,
5]. The salinity and waterlogged areas are increasing every year due to increased secondary salinization. Most of the salt affected areas and shallow water table conditions are located in northwestern India, Ganges old alluvial plains, and dry moisture regions in the western part of India [
6,
7]. Highly fertile and productive land of about 2.8 million hectares in the Indo-Ganges alluvial plains in Punjab, Haryana, Uttar Pardesh, Delhi, Bihar and Rajasthan states are gradually becoming unproductive due to waterlogging and secondary salinization [
8].
In India, Punjab state comprises only about 1.5% of the geographical area (5.04 Mha). However, in terms of agricultural production and development, it is the most advanced state, and agriculture contributes nearly 39% of the state GDP [
1]. Punjab is intensively cultivated and contributes a large share in the food grain basket of India (55% of wheat and 42% of rice to total India production) [
9]. After the green revolution, extensive agriculture development has been achieved through the introduction of tube wells and canal irrigation in the Punjab province. The introduction of the canal network in the southwestern Punjab and non-exploitation of its native brackish groundwater has resulted in the rise of the water table, waterlogging and salinity problems [
10,
11]. In contrast to southwestern and central parts, over utilization of the resources has declined the water table to critical levels (more than 10 m) [
12,
13]. It shows a negative impact on agriculture production, national food security and livelihoods of small-scale agricultural farmers in the Punjab [
3]. Hence, proper planning and management is necessary to improve the hydrology and soil conditions in water logged areas of Punjab. Therefore, the main objective of this study is to understand the groundwater dynamics and to provide feasible solutions to manage the soil salinity and waterlogging through groundwater modeling studies. This study concentrates on the southwestern part of Punjab province to reduce the waterlogging problem through a new innovative approach called “groundwater evaporation ponds (GEP)”. This approach was theoretically tested through an intensive data-driven numerical modeling tool in the Muktsar district, where salinity and waterlogging are major constraints for sustainable agriculture production.
2. Description of the Study Area
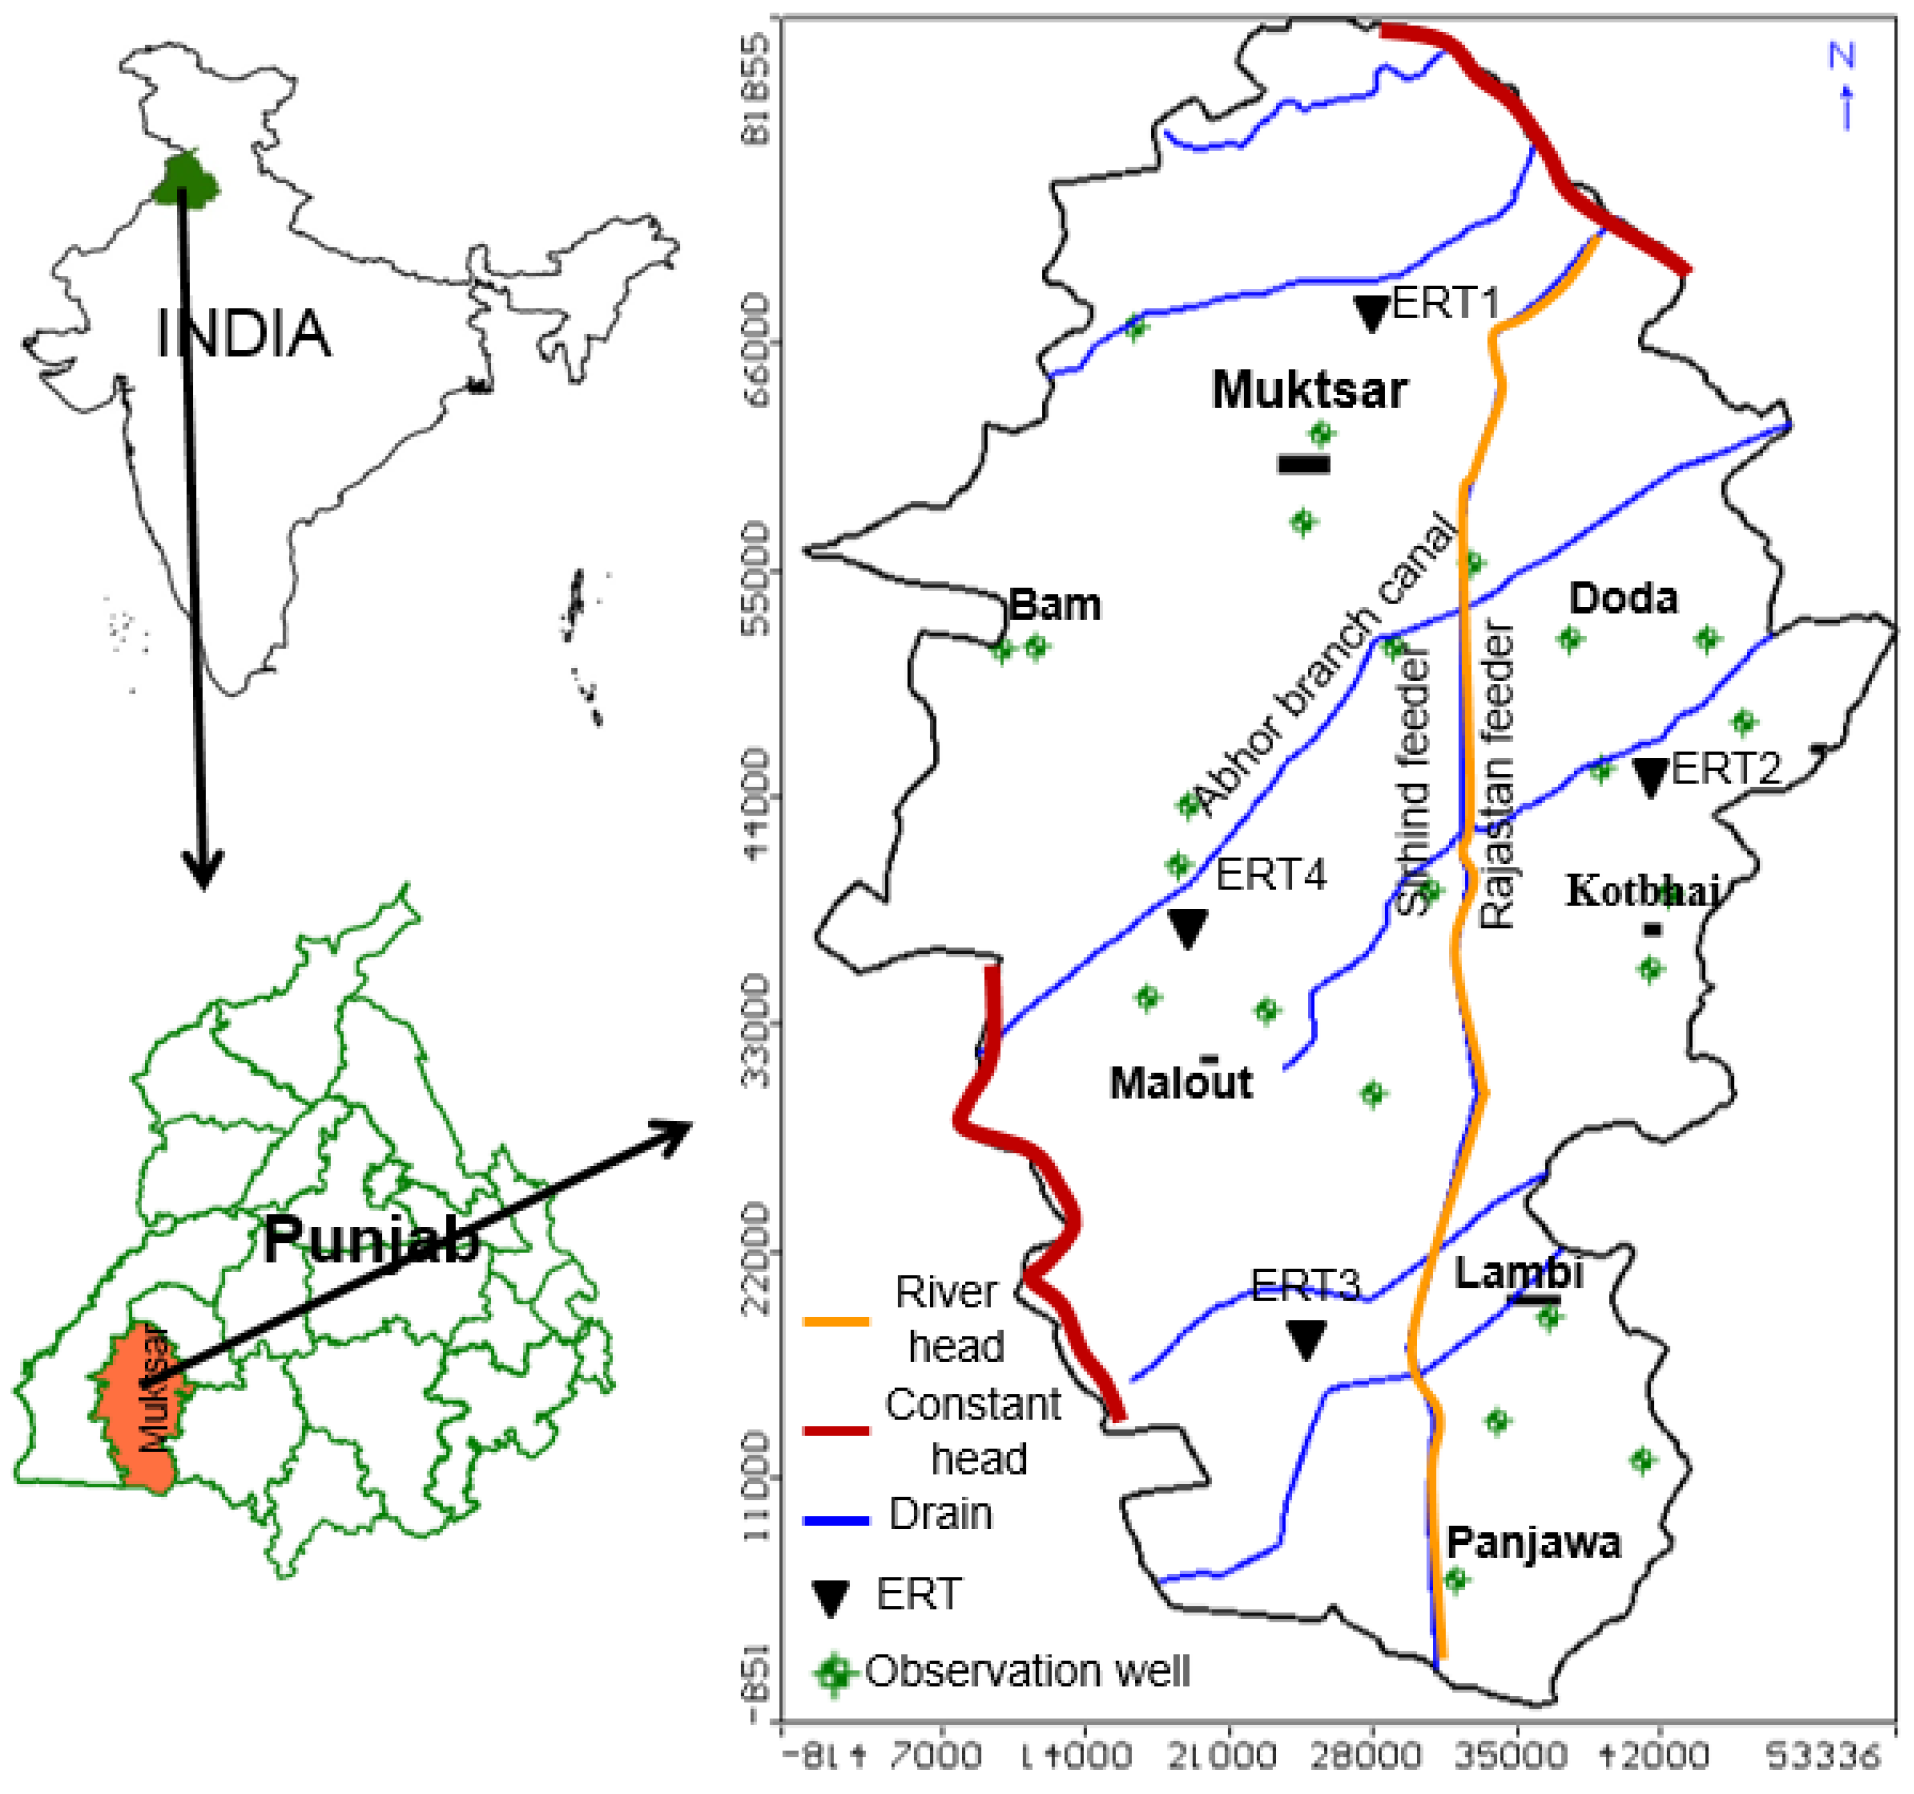
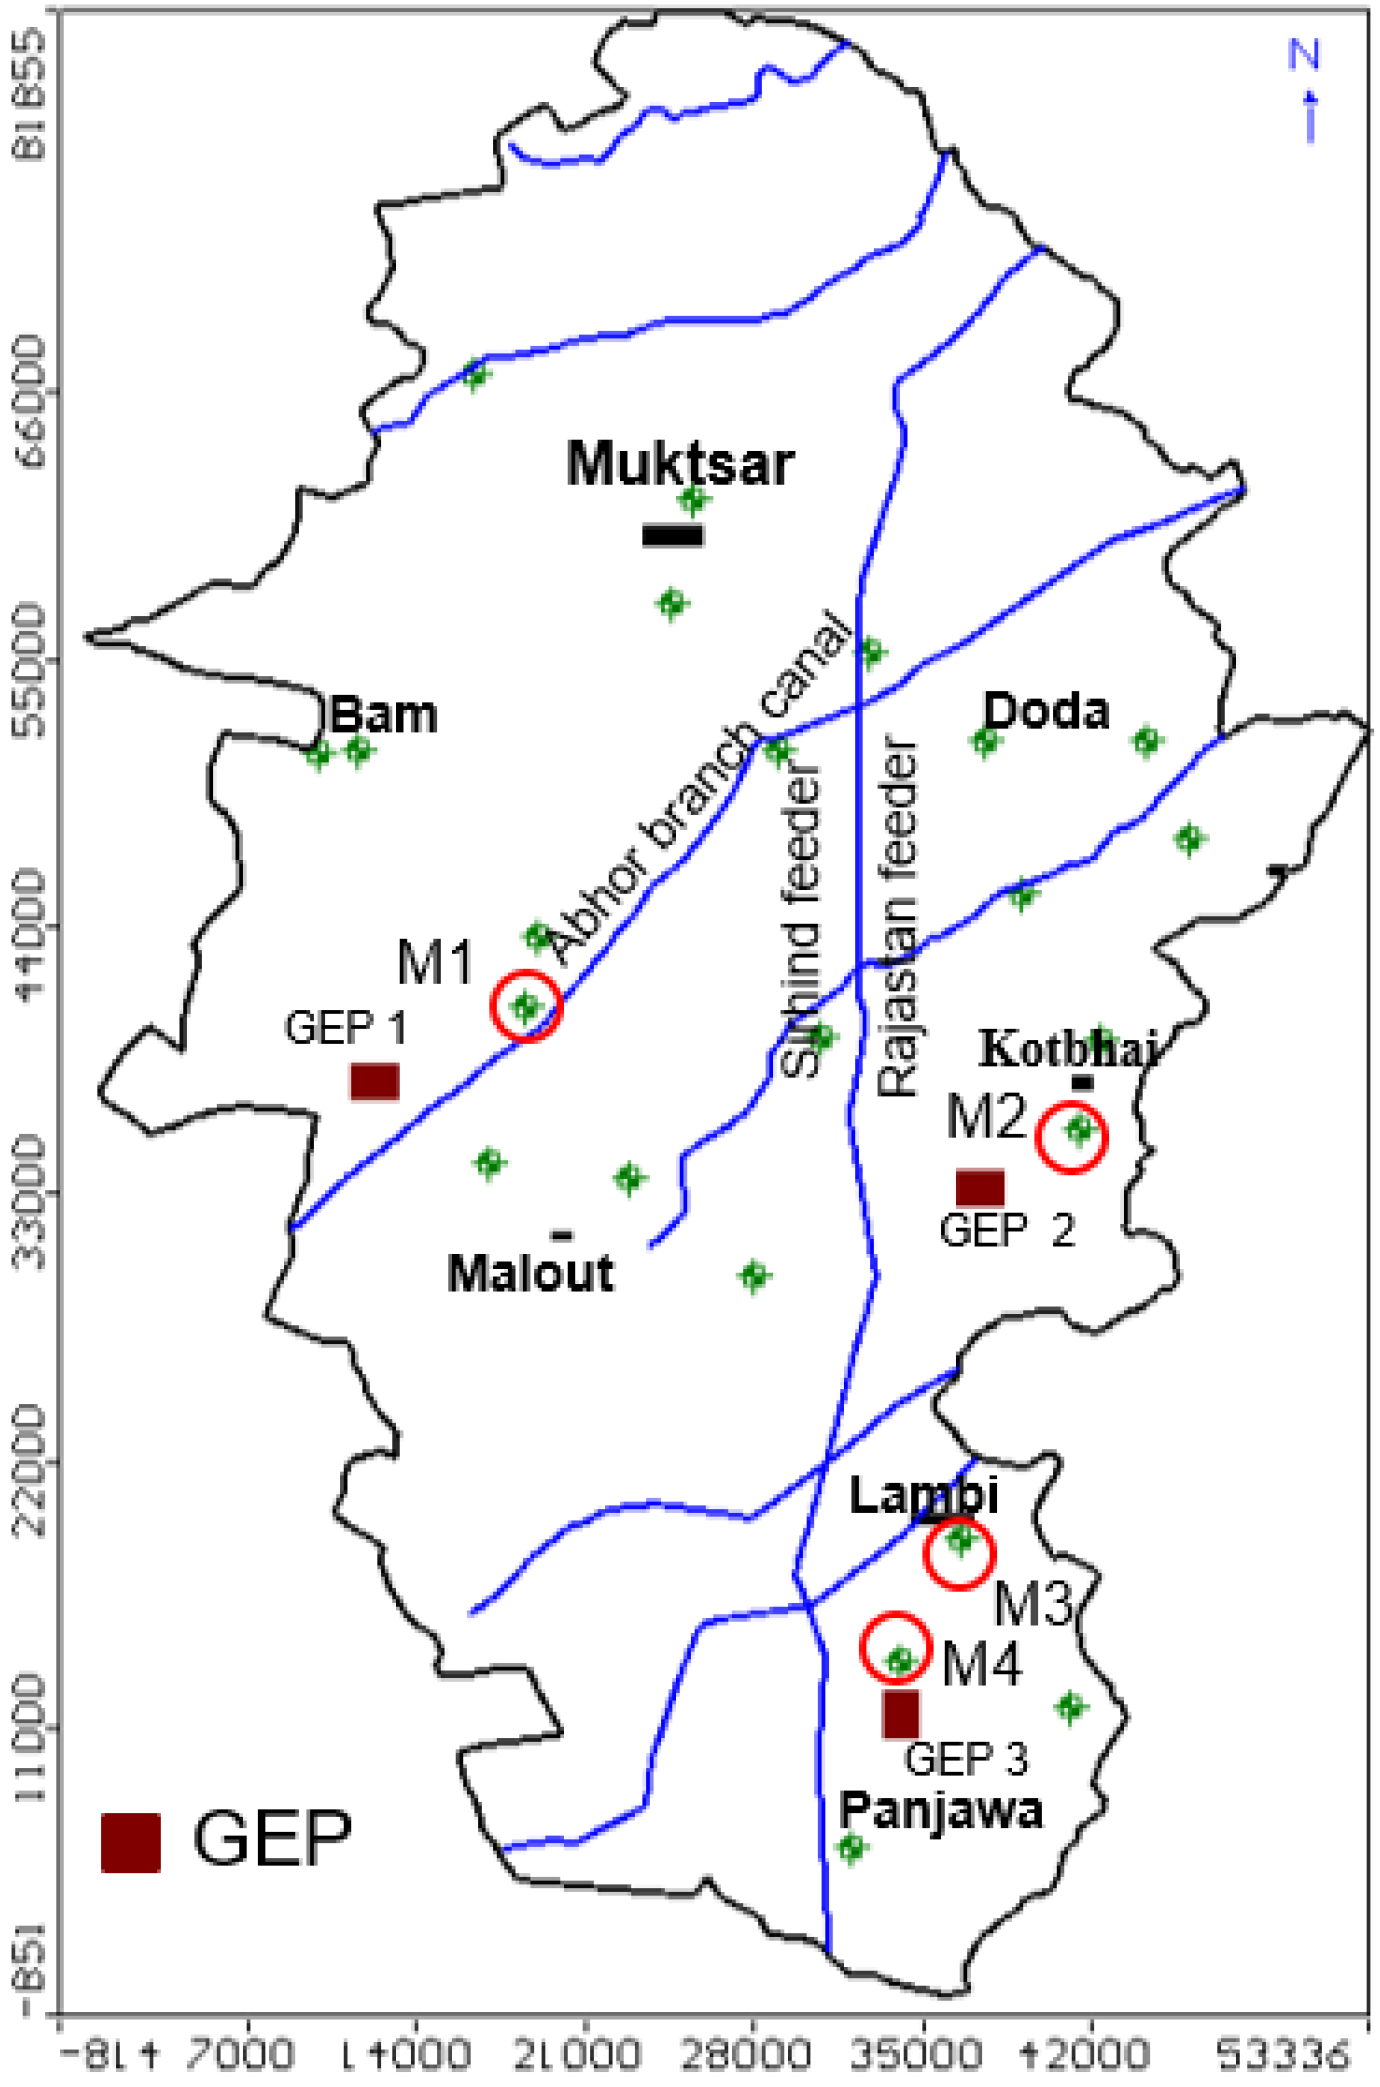
The Muktsar district of Punjab is bounded by the states of Rajasthan and Haryana in the south, Firozpur district in the west, Faridkot district in the north, and Bathinda district on the eastern side (
Figure 1). The District lies between 30°69′ and 29°87′ north latitude and 74°21′ and 74°86′ east longitude and covers an area of 2615 km
2. The district has been divided into four blocks for administrative purposes, namely Kotbhai, Lambi, Malout and Muktsar [
14], and is home for 0.903 million people as per the 2011 census, and 90% of the people depends on agriculture [
15]. The major crops in the area are gram, wheat, barley, millets, cotton and mustard. There are no rivers flowing through the district; however, the area is drained by extensive canal networks drawn from the Sirhind feeder channel. In this district, irrigation water requirements are mainly balanced by canal networks. In the total area (2615 km
2), 2240 km
2 is irrigated by the canals [
14]. The topography of this district is flat with an average elevation of 200 m amsl and slopes gently towards the south and southwest. The Muktsar district experiences the dry sub humid climate with annual average rainfall 380 mm, of which 79% fall during monsoon from June to September [
1].
Hydrogeological Conditions
The study region mainly consists of the Quaternary alluvium, which belongs to the Indus aquifer system. The area is underlain by unconsolidated formation comprising sand, silt and clays with varying proportions. The bore hole lithologs, collected at several locations in the Muktsar district, explain that alluvium thickness of about 416 m deposited in the area and below that Nagaur clay stone occurs [
14]. The groundwater in this region occurs in unconfined to confined aquifer conditions and is generally saline except at local patches with wide spatial variation, which is mainly depending upon the source of irrigation. Almost the entire district is facing a waterlogging problem. In this district, irrigation water demand is balanced by both surface water (96%) through canal networks of the two major canals—Sirhind feeder and Rajasthan feeder—and on tube wells (4%). The depth of the tube wells ranges from 22 to 55 mbgl. The total number of electric and diesel operated tube wells in this district are 10,086 and 16,518, respectively.
During 1997, groundwater levels are varied from 2 to 5 mbgl except a few places in the east of Kotbhai and Muktsarblocks, where groundwater levels were >5 mbgl. However, the long-term groundwater level data, from 1997 to 2006, indicated a 1.94 m to 3.87 m rise in groundwater level at all locations. In contrast, in a few places at Muktsar and Bhamma blocks, groundwater levels declined about 1.2 m in the same duration [
14]. The average groundwater level depths range from 3.2 mbgl in 2005 to 0.8 mbgl in 2011 in Malout and Lambi blocks. Likewise, it ranges from 2.97 mbgl (2005) to 2.15 mbgl (2011) at the Kotbhai block. The groundwater development in the district is within the safe levels of exploitation ranging from 53% to 74% of development.
3. Methodology
3.1. Data Collection and Analysis
Groundwater levels data from 2005 to 2011 were collected from GOI online data [
16] and hydrogeology data was collected from CSIR–National Geophysical Research Institute (NGRI), Hyderabad, India. Groundwater recharge was estimated using water level fluctuation method [
17] using the following relation:
where D
h are changes in groundwater level, and S
y is specific yield.
The groundwater pumping was estimated based on a number of wells and pumping rates that include shallow and deep tube wells [
1].
3.2. Groundwater Modeling
The groundwater flow model was constructed with help of existing hydrogeology data and geophysical information using finite difference based on the numerical modeling program USGS MODFLOW 2005 with VISUAL MODFLOW 2011.1 graphical interface of Waterloo Hydrologic, Canada [
18]. VISUAL MODFLOW is successfully utilized by many researchers to quantify and predict the groundwater resources in different geological environments [
19,
20,
21,
22,
23,
24,
25,
26,
27]. MODFLOW can simulate steady and transient state groundwater flow conditions [
19]. It is a finite difference based numerical modeling program that approximates the following equation:
where
Kx,
Ky and
Kz are hydraulic conductivity tensors.
Ss is specific storage, and
R is source or sink that is intrinsically positive and defines the volume of inflow into the system per unit volume of the aquifer per unit time.
3.3. Aquifer Conceptualization
The purpose of building a conceptual model is to simplify the field problem and organize the associated field data so that the system can be analyzed more readily [
4]. The conceptualization includes synthesis and framing up of data pertaining to geology, hydrogeology, hydrology and meteorology in the area. The subsurface of the Mukstsar district has been conceptualized as two-layer aquifer systems with a total thickness of 140 m. The first layer thickness varies from 15 to 25 m followed by the second layer with a thickness of 80–120 m based on hydrogeophysical investigations and bore well lithologs [
1]. The spatial resolution of grid cells in the model domain is 500 m
2, and, along the river, it is 125 m
2. 3.4. Boundary Conditions and Aquifer Parameters
The estimated recharge, using a water level fluctuation method four times in a year from 2005 to 2011, is simulated as a recharge boundary condition with a recharge package in the model. The total number of stress periods is 28 with four stress periods per year. The lateral inflow/outflow to or from the area is simulated as a constant head boundary condition along the northeast and western boundaries of the area, which matches with groundwater heads (
Figure 1). The groundwater pumping was simulated with well package with pumping rate varying from 300–500 m
3/day based on well census data and field investigations [
1]. The total number of pumping wells simulated in the model is 250. The Rajasthan and Sirhind feeder canals contribute to the groundwater system, as they are perennial unlined canals. These canals are simulated as a river boundary condition with an appropriate width and depth (
Figure 1). Groundwater evaporation was simulated in the model with evapotranspiration (ET) package and assumed 0.5 m is extinction depth with 100 mm/year evaporation.
The aquifer properties were obtained from previous studies and published literature in the area [
1,
12]. The average aquifer permeability for first and second layers are simulated as 2 m/day and 14 m/day, respectively. In addition, specific storage (S
s) and specific yield (S
y) of the first and second layers are considered as 0.0005 and 10% and 0.005 and 15%, respectively, in the groundwater flow model.
4. Results
4.1. Calibration and Validation of the Groundwater Flow Model
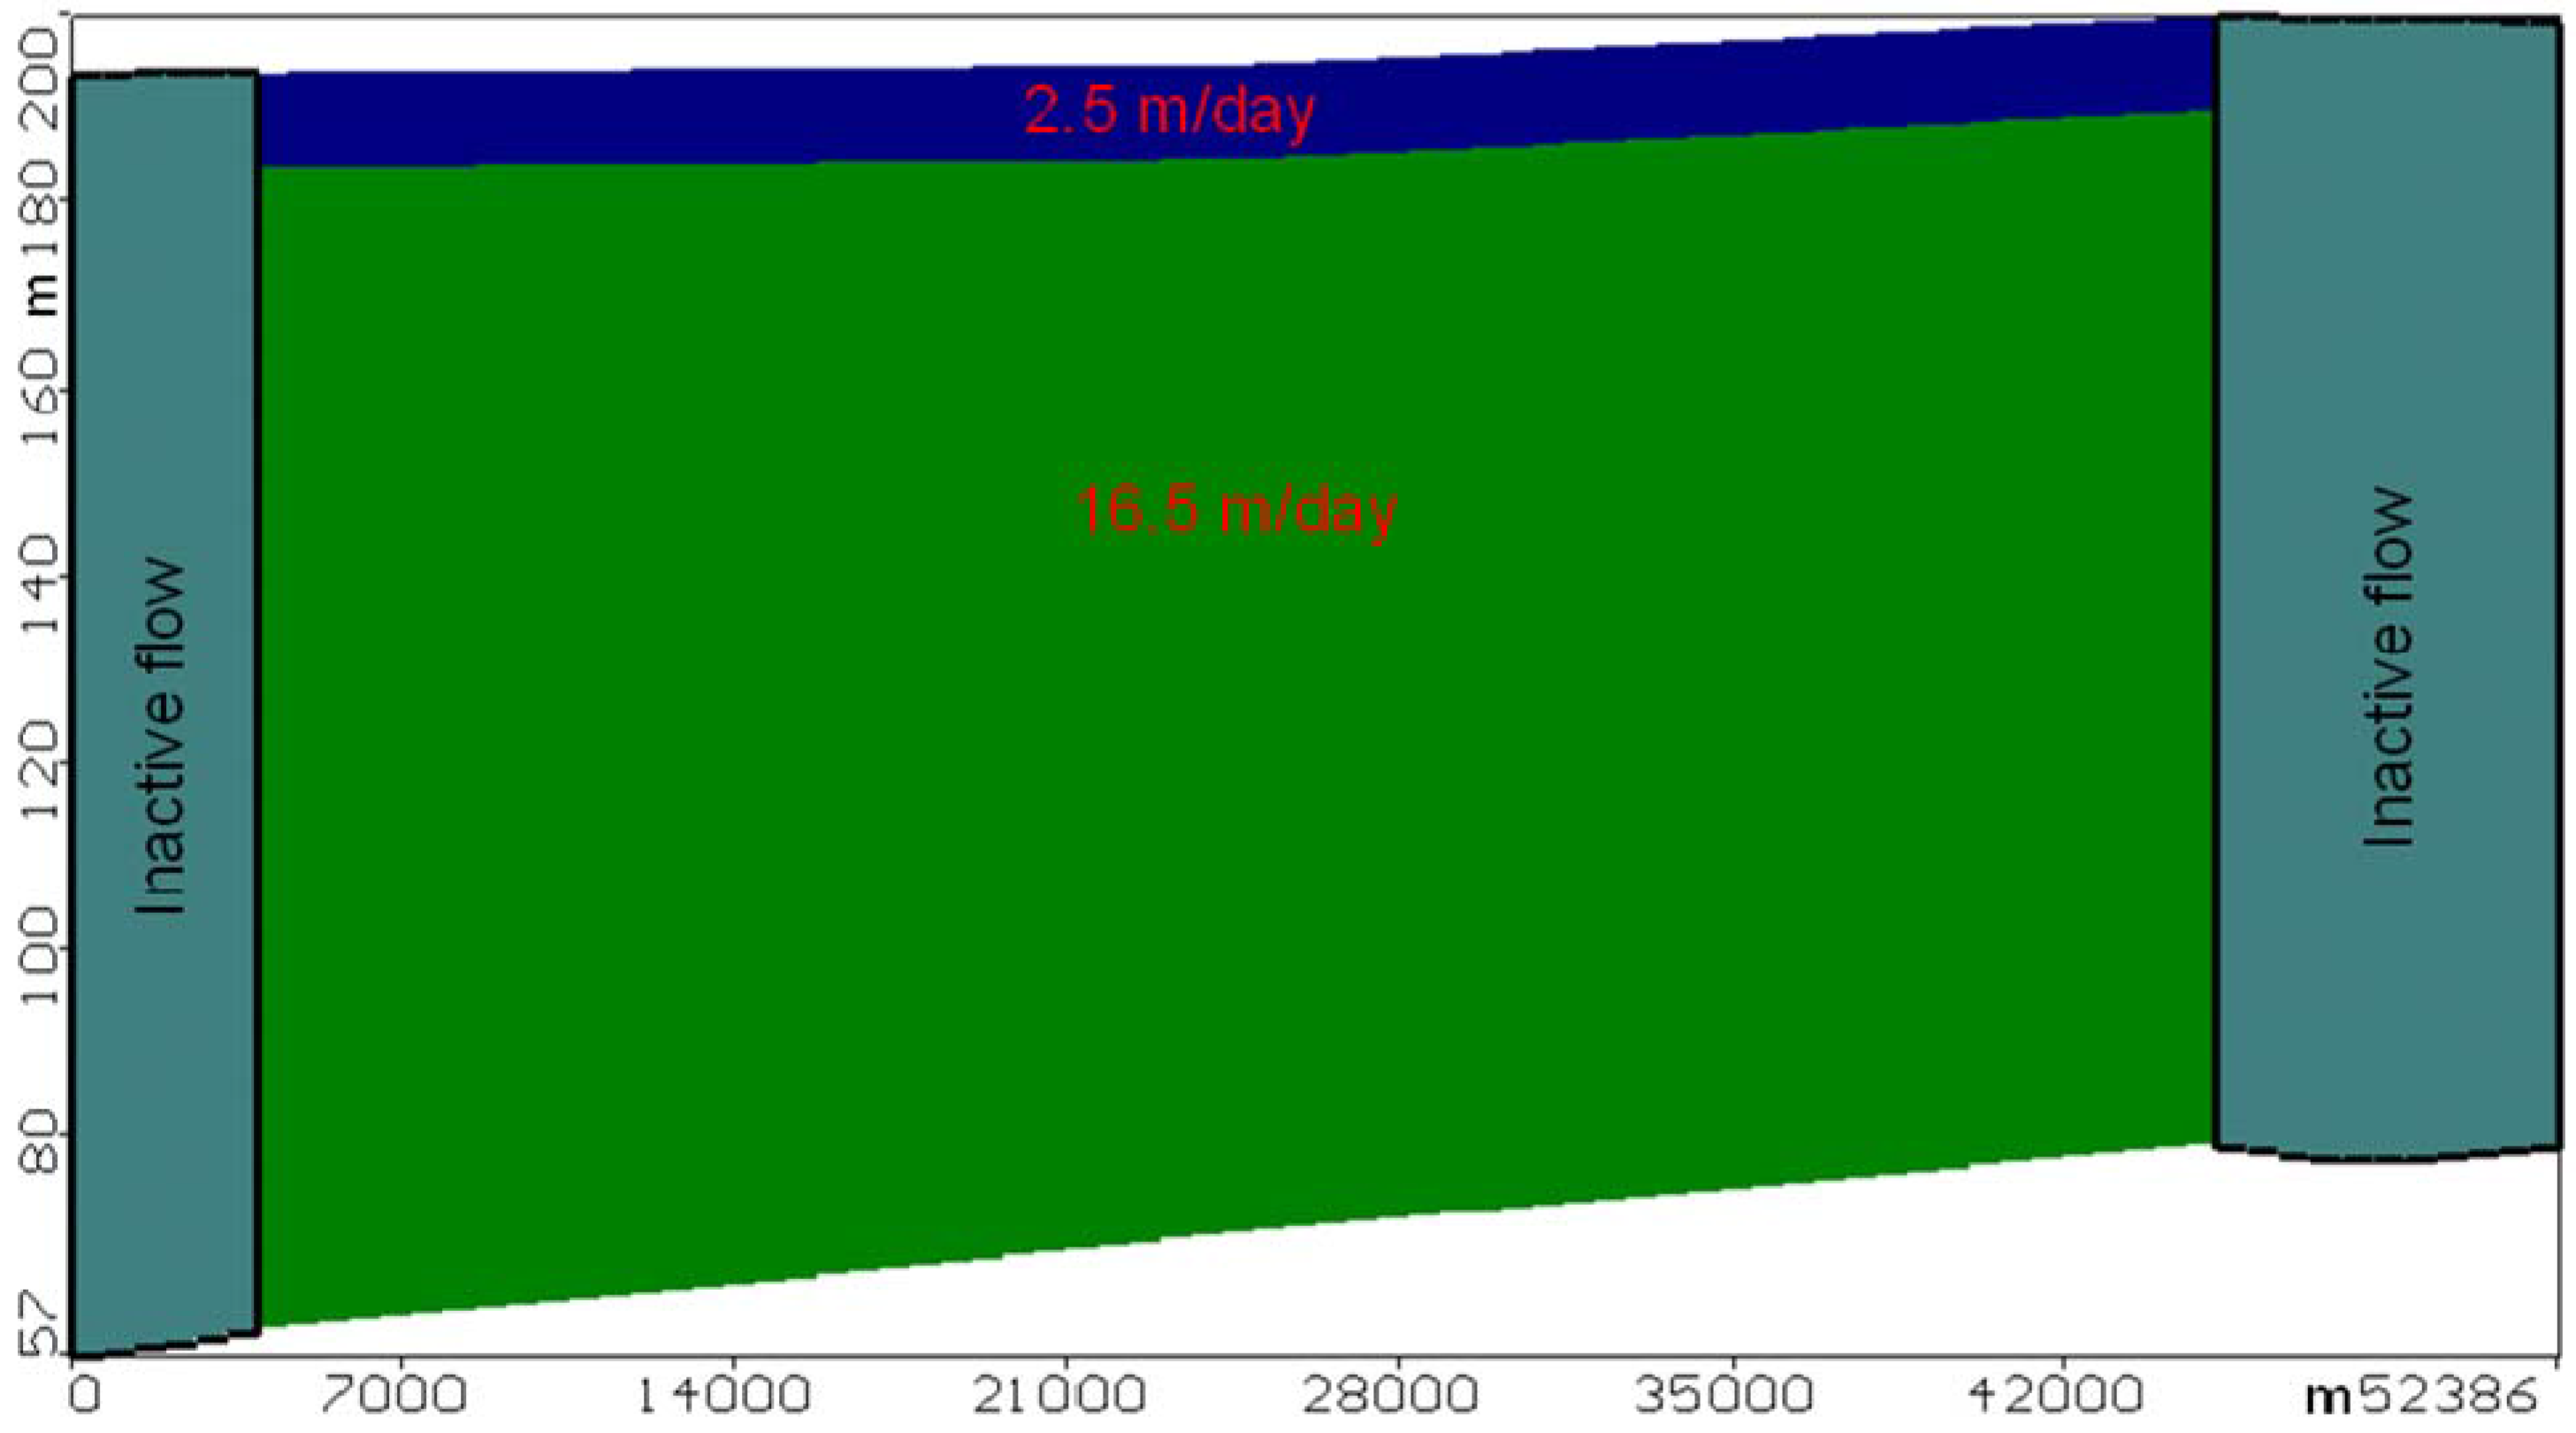
The Muktsar area is simulated as a two-layer aquifer model based on the available hdyrogeologic data (
Figure 2). The groundwater flow model was calibrated in the transient conditions. Initially, the groundwater flow was calibrated under a steady state condition for June 2005, and then it ran in transient conditions from 2005 to 2008. For steady state calibration, 28 observation wells are used. Out of 28 wells, 12 reliable wells distributed over the model domain are considered for transient calibration. The flow model was calibrated by manual adjustment of conductivity, specific yield and specific storage within a range of observed values until a best fit was obtained between observed and simulated water levels. The root mean square error (RMSE) and normalized root mean square error (NRMSE) were considered for model calibration. The conductivity of the first and second layers are increased to 20% and 15%, respectively, in the initial value and specific yields are reduced to 8% and 13% from 10% to 15%, respectively. At the end of the model calibration, the RMSE error is 0.9 m and the NRMSE is 5% at the conductivity of first layer is 2.5 m/day and the second layer is 16.5 m/day (
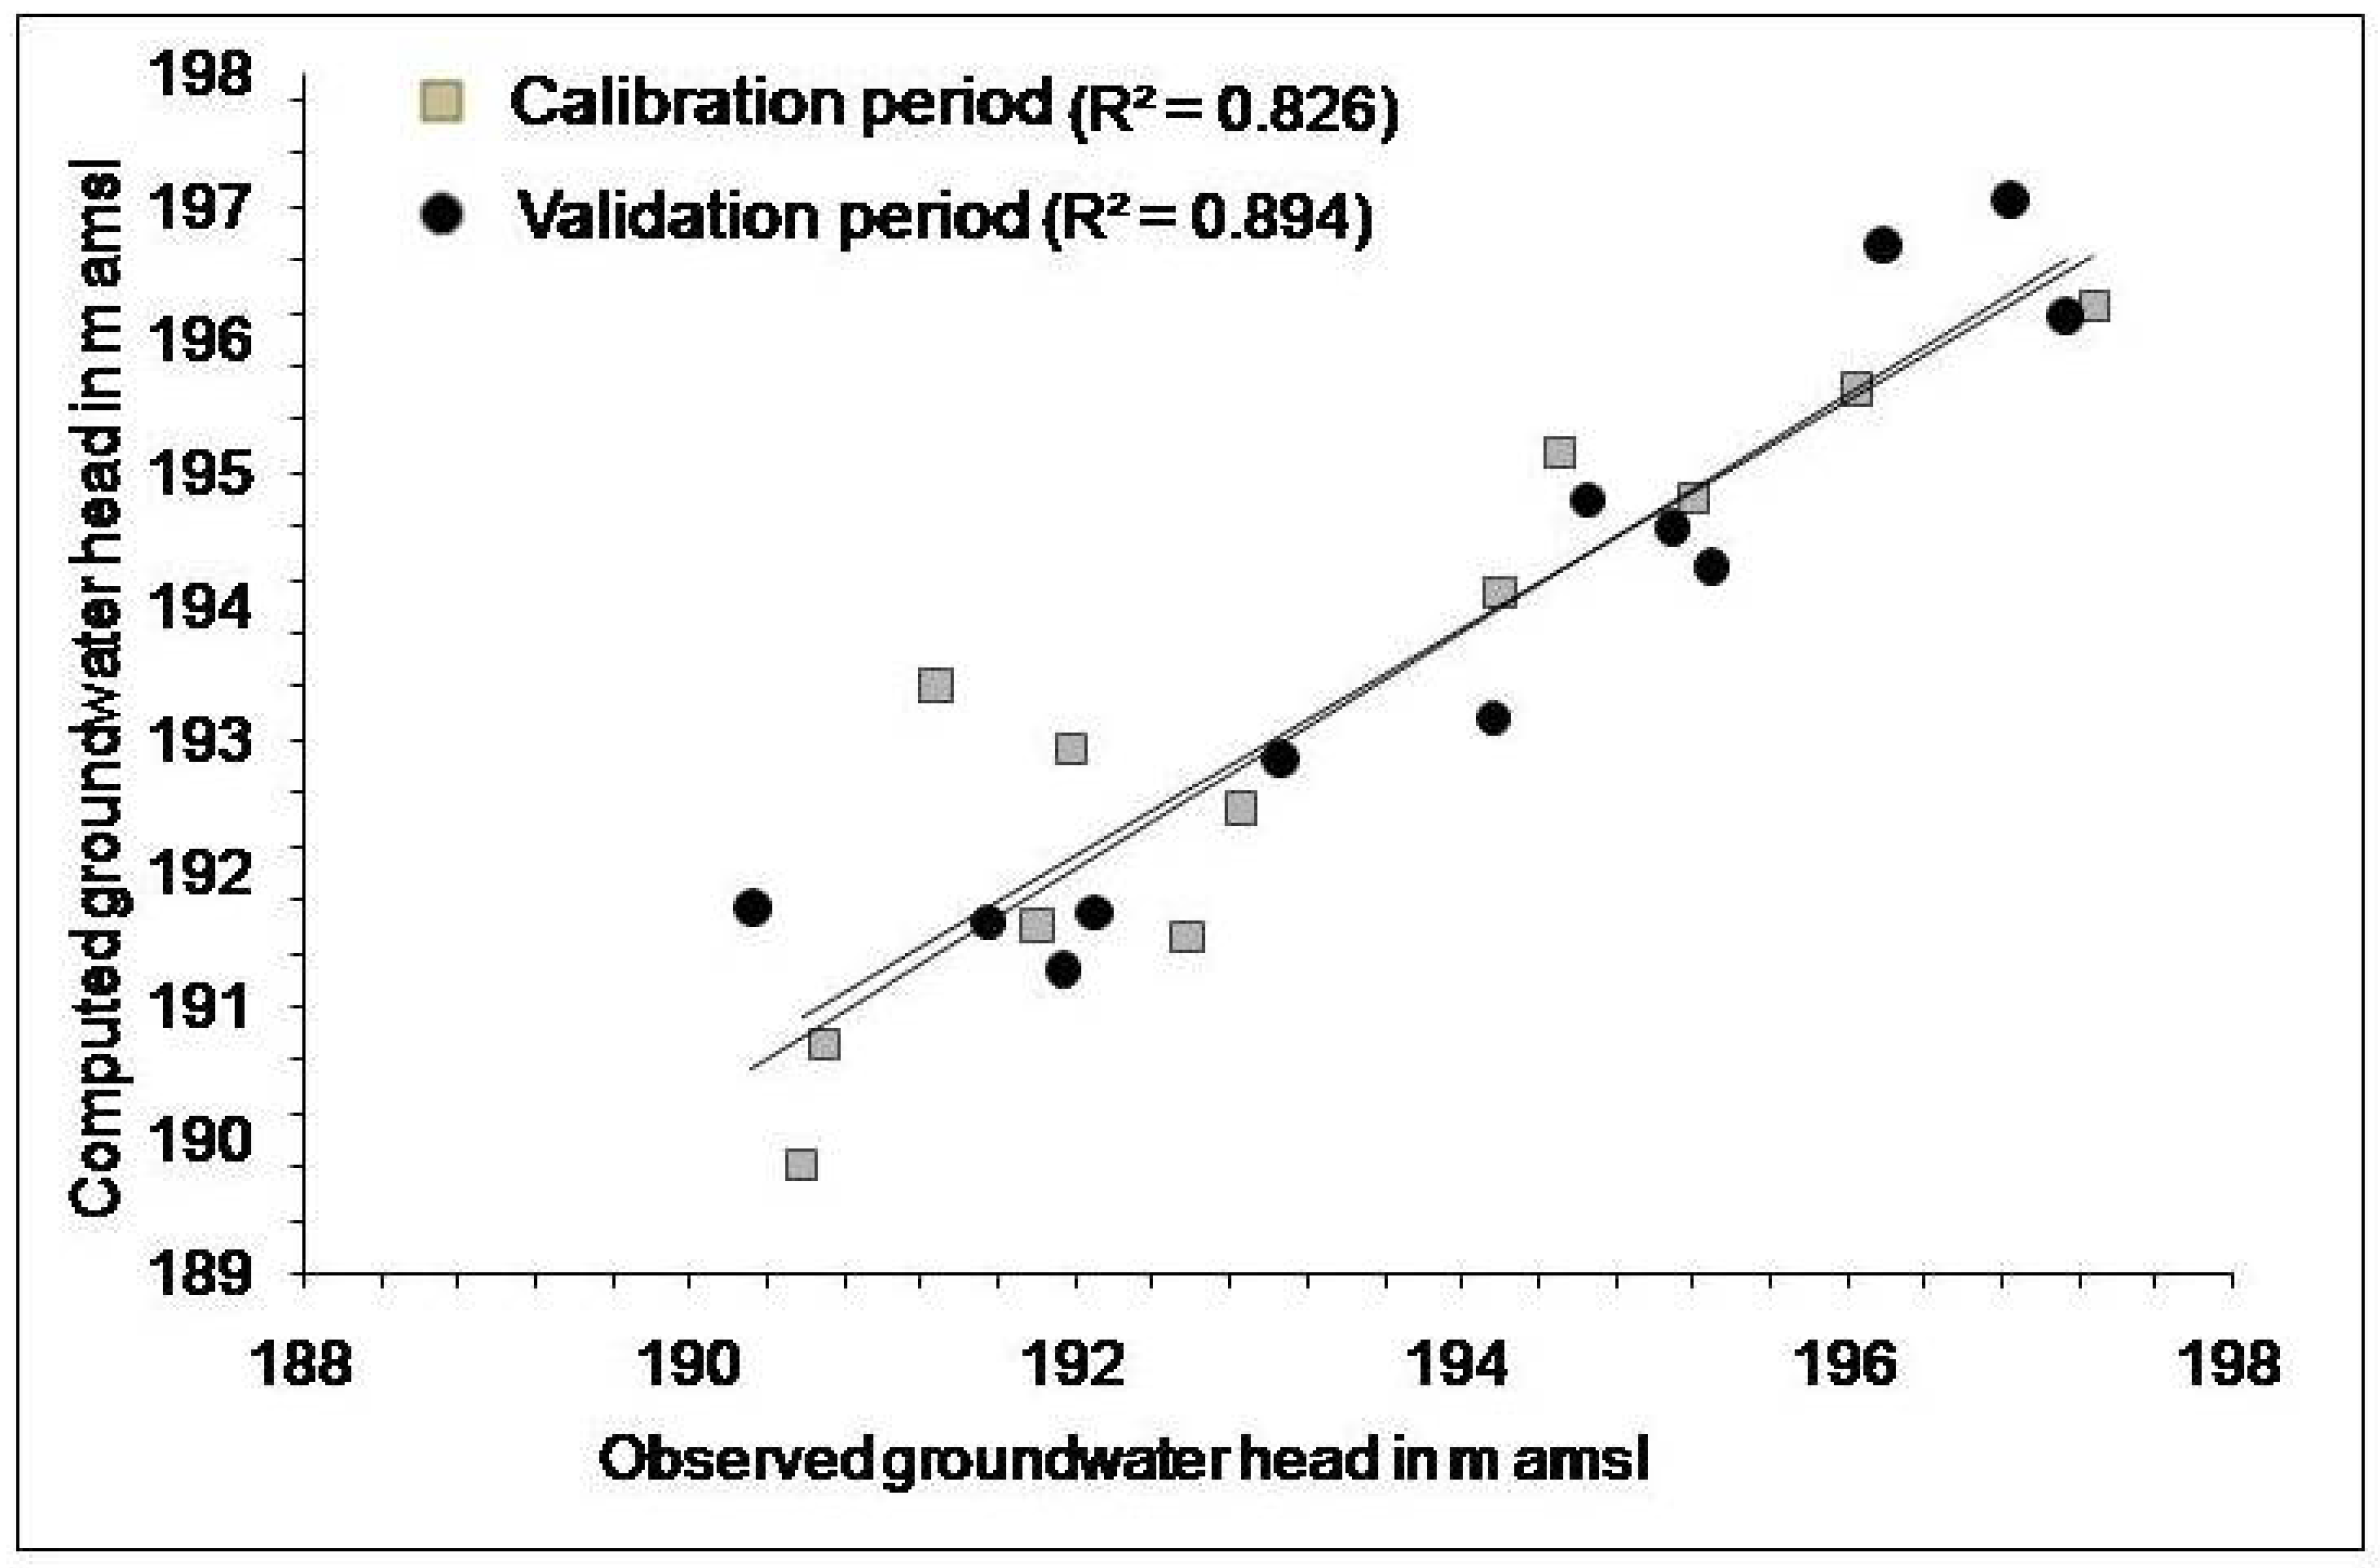
Figure 2). The calibrated model has been validated from 2009 to 2011, and it was observed that there is no considerable change in RMSE and NRMSE. The spatially distributed computed and observed heads indicated that the model obtained a reasonable compromise between observed and computed groundwater heads during both calibration and validation periods (
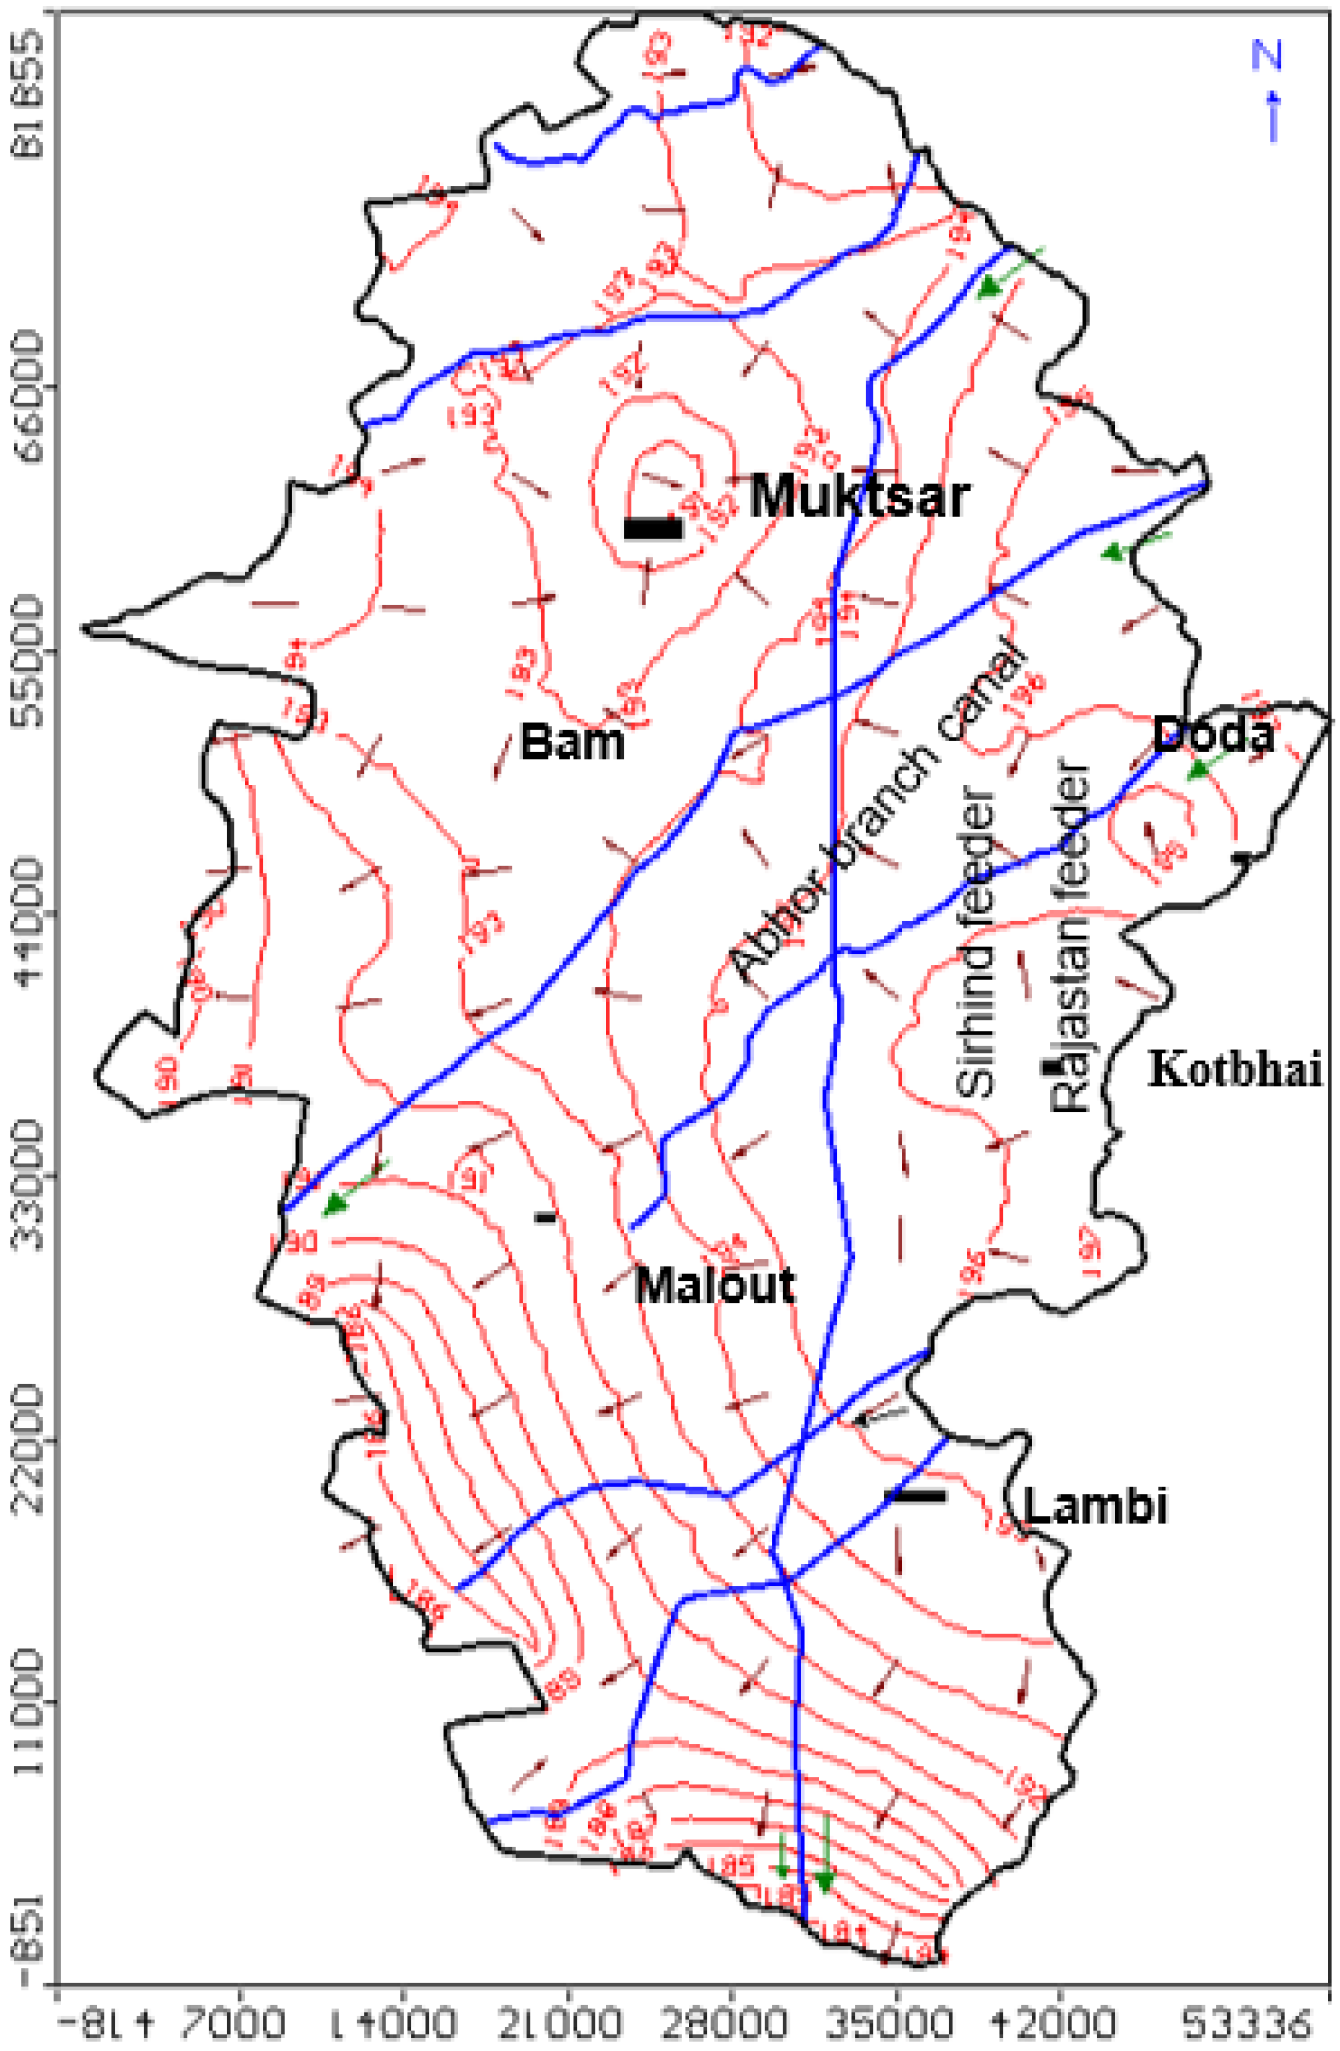
Figure 3). The computed water level contouring along with velocity vectors represents the predominant groundwater flow pattern towards the west from the central and eastern parts (
Figure 4). The velocity vectors also indicated that some localized flows were due to heavy groundwater withdrawals (
Figure 4).
4.2. Groundwater Evaporation Ponds and Its Impact on Groundwater Levels
The model initially has been calibrated for 2005 in steady state condition, and then it ran in a transient condition, and hence the year 2005 is excluded in the water balance. The groundwater balance without GEPs for the entire area from 2006 to 2011 indicates that net inflow to the aquifer is 97.9 mm
3 and net outflow 148.9 mm
3 with a net loss of 51 mm
3. The river leakage is 10 mm
3 and groundwater evaporation is 5.9 mm
3 (
Table 1). GEPs are small excavated pits/ponds in the land with a depth of 1.5 m with an aerial spread of 6000 m
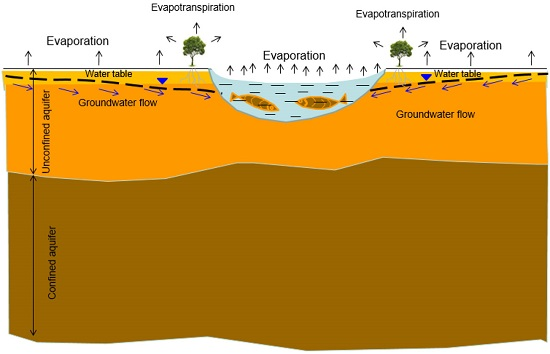
2 in the model. However, the depth and area should be selected based on local hydrogeological and water table conditions. Generally, groundwater from shallow water table areas continuously discharges through bare soil evaporation. However, bare soil evaporation rates are usually less than 10% of the potential evaporation rate. If a GEP is constructed at the lowest position of a discharge zone, it will increase the evaporation rate, which is equal to the potential evaporation rate. The suitable plantation around those ponds may further increase evapotranspiration and also create a good ecosystem in the area. The conceptual diagram of the groundwater evaporation pond is presented in
Figure 5. These conceptual GEPs were simulated in the groundwater flow model at appropriate locations, and the flow model was well calibrated before testing the GEPs in the area through the model.
Then, the well-calibrated groundwater model is used to predict the role of GEP on the groundwater levels in the study site. The suitable discharge zones are selected in the model to simulate the GEP based on computed groundwater flow direction through groundwater velocity vectors in the flow model (refer to
Figure 4). GEPs were considered at three locations in the most downstream part of discharge areas. The GEPs are simulated in the model at the depth of 2 m below the ground surface with an aerial spread of 6000 m
2, where critical groundwater depth is <1.5 mbgl (
Figure 6). It is assumed that ET of this study site is 75% higher than the normal ET, and the model was simulated with an ET package with 175 mm/year and 1 m extinction depth in the GEP area (
Figure 6).
The groundwater balance with GEPs indicated that net inflow into the groundwater aquifer is 101 mm
3. The river leakage is 11 mm
3, and net inflows from the northeast is 4 mm
3. Of this, 1.5 mm
3 is coming from GEPs to the aquifer. However, the groundwater inflows into the GEPs is 16 mm
3. Groundwater evaporation is 6.5 mm
3 (
Table 1). The net loss from 2011 to 2018 is 56 mm
3, which is 10.6% higher than without GEPs. The increased net loss due to GEPs is 5 mm
3, and this impact has been observed in project groundwater levels around GEPs.
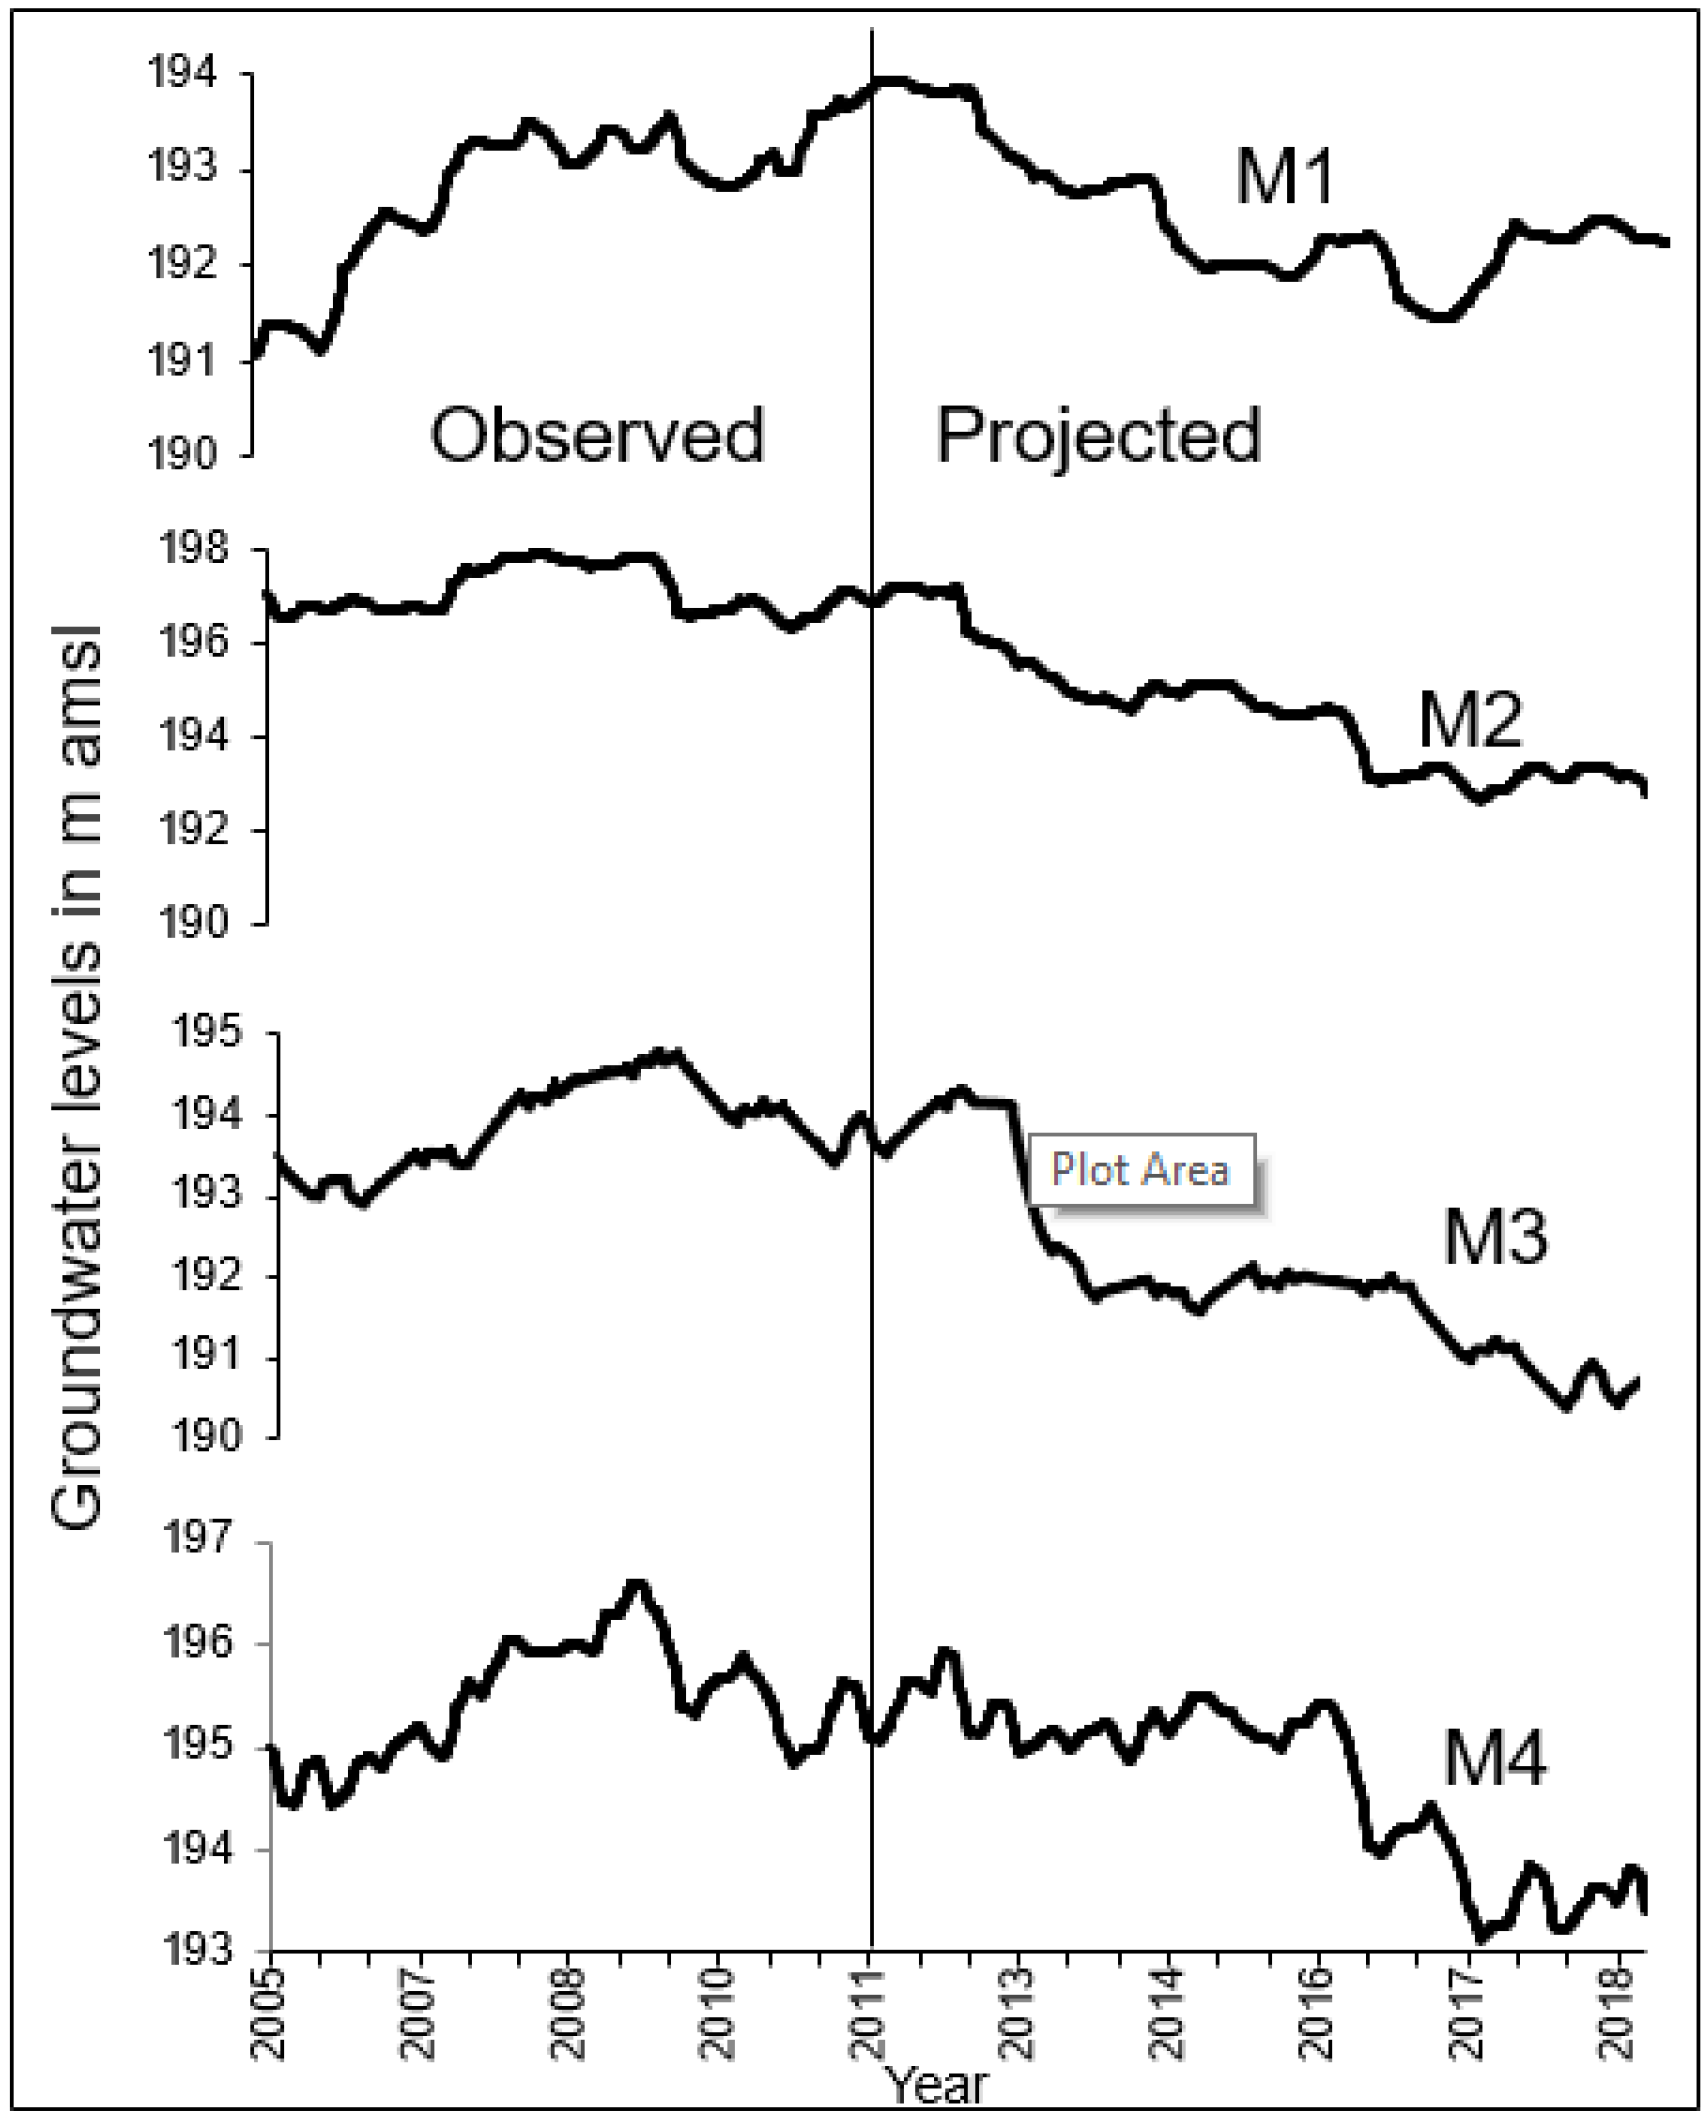
The projected groundwater levels are observed at four selected observation wells, namely M1, M2, M3 and M4, located at 5000 m, 2500 m, 1000 m and 6000 m, respectively, from the evaporation ponds (
Figure 6 and
Figure 7). It is assumed that groundwater evaporation ponds were constructed in 2012, and the influence was observed from 2012 and will be observed to the end of 2018. The projected groundwater levels with these ponds indicated that average groundwater levels would decline by 2 m at the end of 2018 with reference to 2011 (
Figure 7). The zone of influence in depletion of groundwater levels due to the ponds may vary depending on groundwater velocity and hydrogeologic characteristics in the area.
5. Discussion
The groundwater levels are very shallow throughout the Muktsar district varying from <1 m to >5 mbgl. In particular, high saline groundwater with a shallow water table is observed in the Malout, Kotbhai and Lambi blocks, which is <1.5 mbgl, and observations revealed that groundwater levels were in an increasing trend from 2005 to 2011 with 0.5 m/year. Due to the poor drainage and less consumption of groundwater resources, water levels are continuously increasing in the study site. In addition, the saline soils are reducing the infiltration capacity and creating waterlogging problems in the area. Generally, water from this type of shallow water table and saline waterlogged areas continuously discharge through bare soil evaporation. However, bare soil evaporation rates are usually less than 10% of the potential evaporation rate. The landscape functions as a discharge area when the water table is within a critical depth below the soil surface, where capillary rise causes groundwater to be drawn to the surface. This depth is a function of soil type, but is typically on the order of 1.5 m. If a GEP is constructed at the lowest position of a discharge zone, groundwater will flow into the pond and water will evaporate at the potential evaporation rate rather than at the much lower rate from bare soil. The potential evaporation rate is significantly greater than the average annual rainfall, which will lower the water level within the GEP. Moreover, the groundwater level in the surrounding areas will go down due to induced groundwater flow towards GEP.
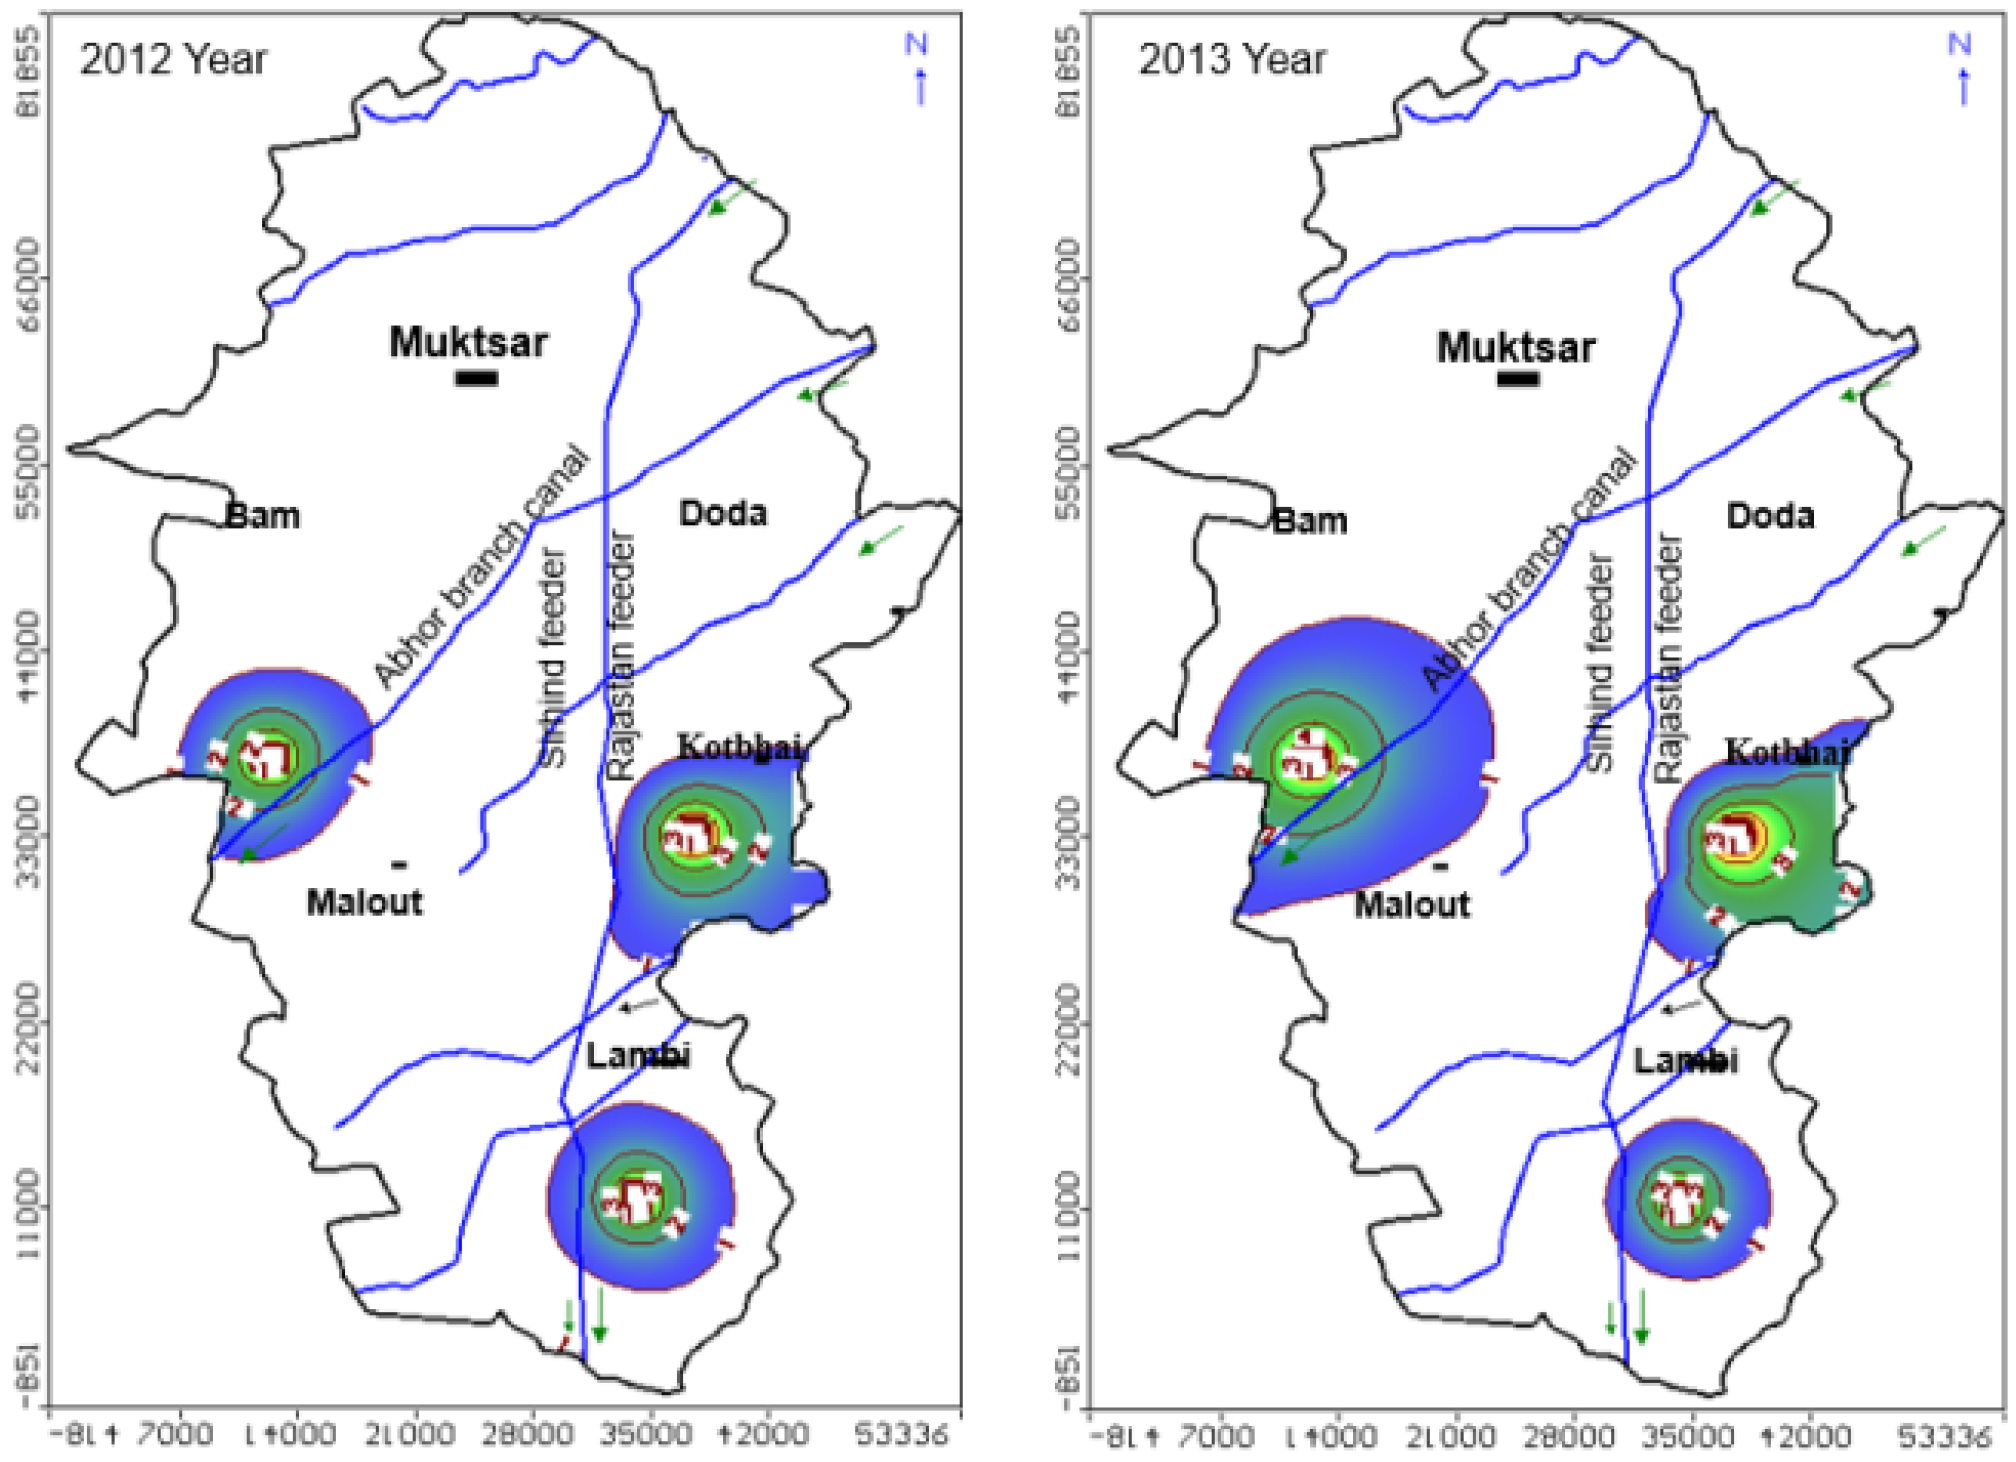
The model results indicated that construction of GEP is able to deplete the groundwater levels.
Figure 8 and
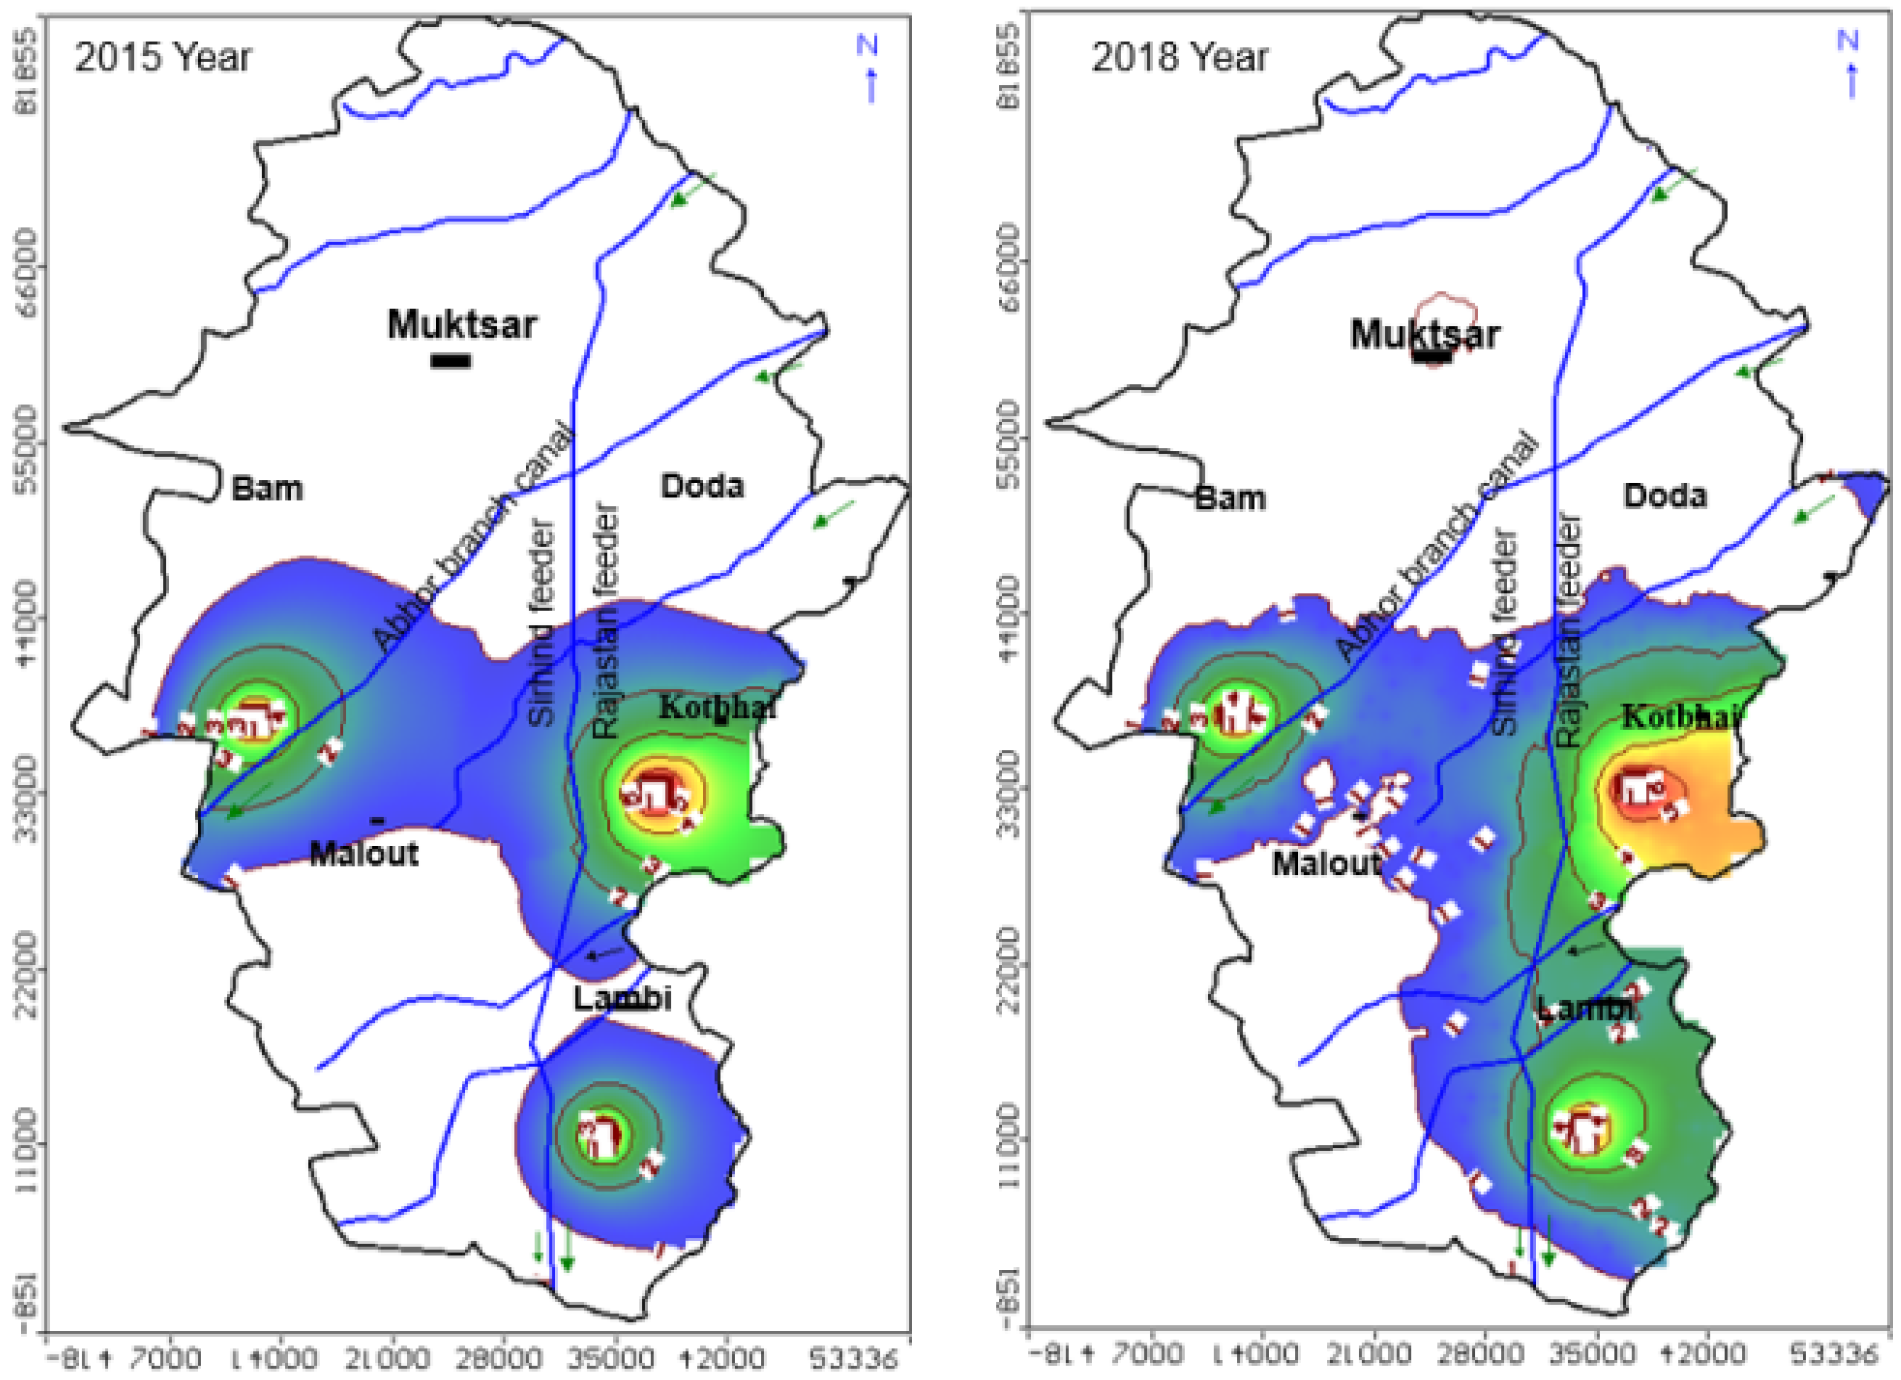
Figure 9 shows that the area influenced by the GEP and the area of water level depletion will be increased over time from 2012 to 2018 around the ponds with reference to 2011 groundwater levels.
Figure 8 indicated that GEP1, GEP2 and GEP3 was able to deplete groundwater levels about 1 m in the area covering of 128,000 m
2, 210,500 m
2 and 170,000 m
2, respectively, at the end of 2012, and 512,000 m
2, 208,000 m
2 and 138,000 m
2 at the end of 2013, respectively. The GEP1 and GEP2 together was able to deplete groundwater level 1 m in the area of 1106,500 m
2, and GEP3 depleted the water level 2 m in the area of 275,000 m
2 by the end of 2015. At the end of 2018, the three ponds together may deplete the water level 2 m in the area of 1,802,500 m
2 (
Figure 9).
In addition, loosening of the soil of the abandoned lands around the sub-surface evaporation pond and addition of gypsum to dispersed soils will improve soil structure and increase leaching. The continuous process may help to improve the soil structure and also deplete groundwater levels to avoid waterlogging conditions. The GEPs not only will help in depleting the groundwater levels to control the water logging but also provide an opportunity for additional income by utilizing them for aquaculture. It is highly suggested that community based aquaculture will be beneficial.
The size of GEP depends on the saline waterlogged area and also depends on local hydrogeologic conditions. It is necessary to monitor the temporal changes of soil salinity and depth of the water table. The proper functioning of GEP needs good maintenance to avoid any algal growth and outbreaks in the pond along with maintenance of vegetation. The GEP can be helpful in reduction of salt exports from the site to water courses and improvement of the biodiversity in the surrounding area indirectly. It will increase the productivity of saline and waterlogged areas sustainably. The concept will be highly suitable in areas where the land is relatively flat but with gentle undulation, shallow water table (≤1.5 m), soil with moderate hydraulic conductivity, poor access to natural or constructed drainage under saline water table conditions, which is not desirable for discharge to the streams, and an annual evaporative demand far exceeding annual rainfall around discharge zones. Overall, modeling results highlighted that GEP is a reliable option to reduce waterlogging and recover productive agricultural land, if there is no proper surface drainage in the site.
6. Conclusions
In the Muktsar district, the waterlogging and salinity conditions are mostly prevailing in the Malout, Kotbhia and Lambi blocks. The groundwater levels are very shallow and vary between <1 m and 6 m, and groundwater levels are increased towards the land surface about 0.5 m/year between 2005 and 2011. A groundwater flow model was used to test the new innovative approach, called a groundwater evaporation pond (GEP), to reduce waterlogging in the study site. Model simulation was carried out from 2012 to 2018 with GEP. Model results revealed that construction of GEP will deplete the groundwater levels about 2 m by the end of 2018, which will indirectly help to reduce the waterlogging and also help with the management of salinity problems in the study area. Furthermore, GEP will be useful for aquaculture, and the proper management of aquaculture in the GEP can generate additional income that will improve the socio–economic and livelihood status in the area. This is only a conceptual idea, and it has to be tested at the field level. The methodology could be adopted in a similar kind of hydrogeology and shallow saline waterlogged areas. However, the limitation of the GEP approach is in identifying the suitable place for construction of the GEP, which requires proper knowledge about the hydrogeology of the area.
Acknowledgments
The authors are thankful to the Central Groundwater Board (CGWB), Southern Region–Hyderabad for providing hydrogeology and groundwater data and the International Water Management Institute (IWMI), India, for providing time for the present research work in the project “Ganges Aquifer Management for Ecosystem Services (GAMES)”. We would like to thank the director of the CSIR–National Geophysical Research Institute (NGRI), Hyderabad for his kind permission to publish this paper.
Author Contributions
The idea of this study was conceived by Sanmugam Prataphar and Lagudu Surinaidu. Groundwater modeling was carried out by Lagudu Surinaidu and data interpretation, literature review and manuscript preparation was jointly done by Lagudu Surinaidu, Velidi Venkata Surya Gurunadha Rao, Mogali Jayaraja Nandan, and Natrajaj Rajamohan.
Conflicts of Interest
The authors declare no conflict of interests.
Abbreviations
The following abbreviations are used in this manuscript:
| GEP | Groundwater Evaporation Ponds |
| RMSE | Root Mean Square Error |
| NRMSE | Normalized Root Mean Square Error |
References
- Gurunadha Rao, V.V.S.; Sankaran, S.; Prakash, B.A.; Yadaiah, P.; Mahesh Kumar, K.; Chandrasekhar, S.V.N. Groundwater Quality, Hydrogeological, Geophysical and Groundwater Flow Modeling Studies in Muktsar District, Punjab. Available online: https://www.google.com/url?sa=t&rct=j&q=&esrc=s&source=web&cd=1&ved=0ahUKEwiLq66VxKnOAhVHVywKHWtTDlIQFggcMAA&url=%68%74%74%70%3a%2f%2f%32%30%32%2e%31%35%39%2e%32%32%33%2e%32%35%33%3a%39%30%2f%44%53%54%2f%64%73%74%50%44%46%2f%49%4e%52%4d%5f%31%34%34%5f%31%2e%70%64%66&usg=AFQjCNFe4Y-8XxuKlt4eO6kFMK86hgGj4Q&sig2=r3bdTKn8DanALIzFRkN_9w&bvm=bv.128617741,d.bGg&cad=rja (accessed on 29 July 2016).
- Kumar, M.D. Food Security and Sustainable Agriculture in India: The Water Management Challenge; International Water Management Institute (Working Paper60): Colombo, Sri Lanka, 2003; ISBN: 92-9090-521-2. [Google Scholar]
- Food and Agriculture Organization (FAO). The State of the World’s Land and Water Resources for Food and Agriculture (SOLAW)—Managing Systems at Risk; Food and Agriculture Organization of the United Nations: Rome, Italy; Earthscan: London, UK, 2011. [Google Scholar]
- Singh, A.; Panda, S. Integrated salt and water balance modeling for the management of waterlogging and salinization, I: Validation of Sahysmod. J. Irrig. Drain Eng. 2012, 138, 955–963. [Google Scholar] [CrossRef]
- Jain, S.K.; Agarwal, P.K.; Singh, V.P. Problems related to water resources management in India. In Hydrology and Water Resources of India; Water Science and Technology Library: Berlin, Germany, 2007; Volume 57, pp. 871–936. [Google Scholar]
- Mandal, A.K.; Sharma, R.C. Delineation and characterization of waterlogged salt affected soils in IGNP using remote sensing and GIS. J. Indian Soc. Remote Sens. 2011, 39, 39–50. [Google Scholar] [CrossRef]
- Singh, A. Estimating long-term regional groundwater recharge for the evaluation of potential solution alternatives to waterlogging and salinization. J. Hydrol. 2011, 406, 245–255. [Google Scholar] [CrossRef]
- Pathak, P.S. Agro forestry: A tool for arresting land degradation. Indian Farming 2000, 49, 15–19. [Google Scholar]
- Planning Commission. Report of the High Level Expert Group on Waterlogging in Punjab, Planning Commission, Government of India. 2013. Available online: http://planningcommission.gov.in/reports/genrep/rep_waterpunjab2702.pdf (accessed on June 2014). [Google Scholar]
- Sharma, K. Land degradation in India with special reference to Punjab. J. Agric. Phys. 2001, 1, 80–81. [Google Scholar]
- Vashisht, A.K. Status of water resources in Punjab and its management strategies. J. Indian Water Res. Soc. 2008, 28, 1–8. [Google Scholar]
- Surinaidu, L.; Mahesh, J.; Padalu, G.; Rajesh, R.; Acharya, P.S.; Saram, V.S.; Guruanadha Rao, V.V.S. Geophysical studies for assessment of Groundwater potential in Old Amrtisar, Jalandhar, Ludhiana and Muktsar districts, Punjab. Environ. Monit. Assess 2010. [Google Scholar] [CrossRef]
- Mandal, A.K.; Sharma, R.C. Computerization database on salt affected soils of Haryana state. J. Indian Soc. Remote Sens. 2005, 33, 447–455. [Google Scholar]
- Central Groundwater Board (CGWB). Groundwater Information Booklet Muktsardistrict, Punjab; Government of India North Western Region: Chandigarh, India, 2007. [Google Scholar]
- Government of India (GOI). Census Data of India. Available online: http://censusindia.gov.in (accessed on 29 July 2013).
- Government of India (GOI). Groundwater Information System. Available online: http://www.india-wris.nrsc.gov.in/wris.html (accessed on 21 April 2013).
- Groundwater Resources Estimation (GEC) Methodology. In Ministry of Water Resources; Government of India: New Delh, India, 2009; pp. 1–107.
- Waterloo Hydrologic. Visual MODFLOW Version 2011.1 User Manual; Waterloo Hydrologic Inc.: Waterloo, ON, Canada, 2011. [Google Scholar]
- Anderson, M.P.; Woessner, W.W. Applied Groundwater Modeling-Simulation of Flow and Advective Transport; Elsevier: Amsterdam, The Netherlands, 2002; p. 341. [Google Scholar]
- Tamma Rao, G.; Gurunadha Rao, V.V.S.; Ranganadhan, K.; Surinaidu, L.; Mahesh, J.; Ramesh, G. Assessment of groundwater contamination from a Hazardous dumpsite in Ranipet, Tamilnadu, India. Hydrogeol. J. 2011, 19, 1587–1598. [Google Scholar]
- Surinaidu, L.; Mutuwatte, L.; Amarasinghe, U.A.; Jain, S.K.; Kumar, S.; Singh, S.; Ghosh, N.C. Reviving Ganges Water Machine: Accelerating surface and groundwater interactions in the case of Ramganga sub-basin. J. Hydrol. 2016. [Google Scholar] [CrossRef]
- Surinaidu, L.; Gurunadha Rao, V.V.S.; Nandan, M.J.; Yugraj, Y. Hydrogeological and numerical modelling studies to solve the groundwater seepage problems in the underground tunnels. J. Indian Geophys. Union 2015, 9, 422–432. [Google Scholar]
- Surinaidu, L.; Gurunadha Rao, V.V.S.; Rajendra Prasad, P.; Mahesh, J.; Thamma Rao, G.; Sarma, V.S. Assessment of possibility of salt water intrusion in the Central Godavari Delta, region, Southern India. Reg. Environ. Chang. J. 2014. [Google Scholar] [CrossRef]
- Surinaidu, L.; Gurunadha Rao, V.V.S.; Srinivasa Rao, N.; Srinu, S. Hydrogeological and numerical modeling for estimating groundwater inflows into the Coal Mines to designoptimal pumping, Andhra Pradesh, India. Water Res. Ind. 2014. [Google Scholar] [CrossRef]
- Surinaidu, L.; Gurunadha Rao, V.V.S.; Ramesh, G. Assessment of groundwaterinflows into Kuteshwar Limestone Mines through flow modeling study, Madhya Pradesh, India. Arab J. Geosci. 2013, 6, 1153–1161. [Google Scholar] [CrossRef]
- Surinaidu, L.; Bacon, C.G.D.; Pavelic, P. Agricultural groundwater management in the Upper Bhima Basin: Current status and future scenarios. Hydrol. Earth Syst. Sci. 2013, 17, 507–517. [Google Scholar] [CrossRef]
- Varalakshmi, V.; Venkateswara Rao, B.; Surinaidu, L.; Tejaswi, M. GroundwaterFlow Modelling of a Hard Rock Aquifer—A case study. J. Hydrol. Eng. 2014, 19, 877–886. [Google Scholar] [CrossRef]
© 2016 by the authors; licensee MDPI, Basel, Switzerland. This article is an open access article distributed under the terms and conditions of the Creative Commons Attribution (CC-BY) license (http://creativecommons.org/licenses/by/4.0/).


