1. Introduction
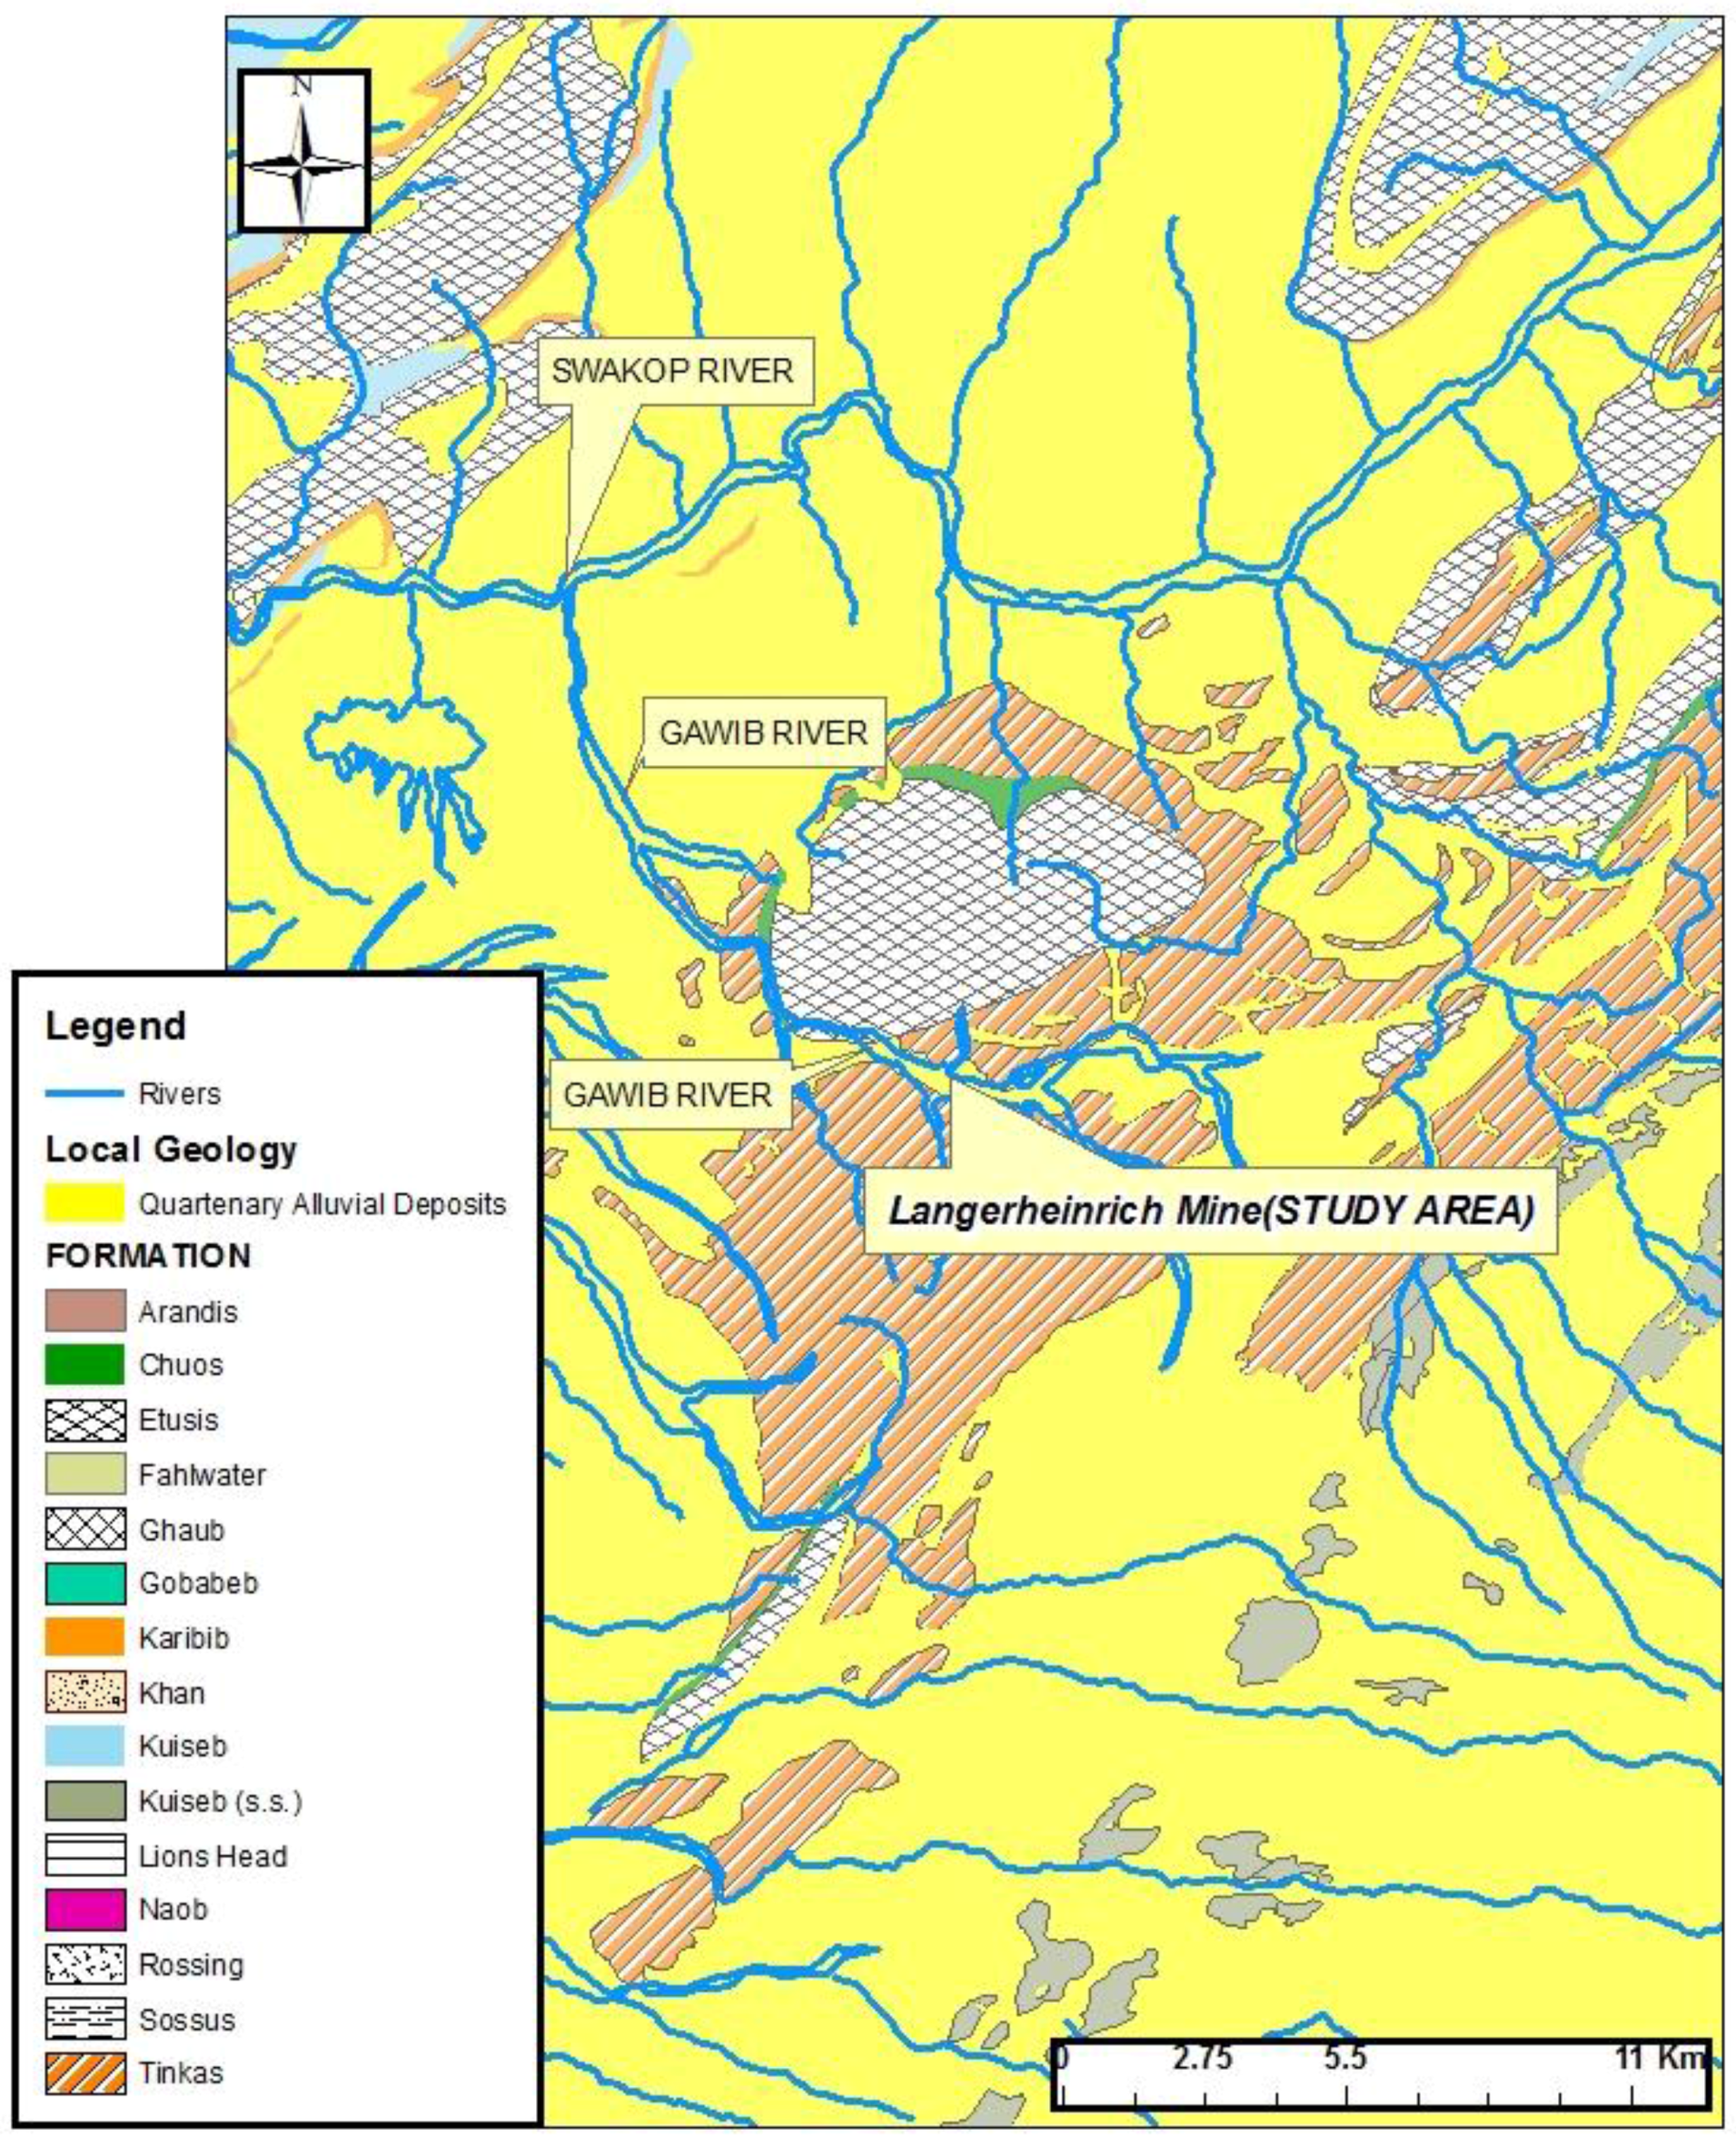
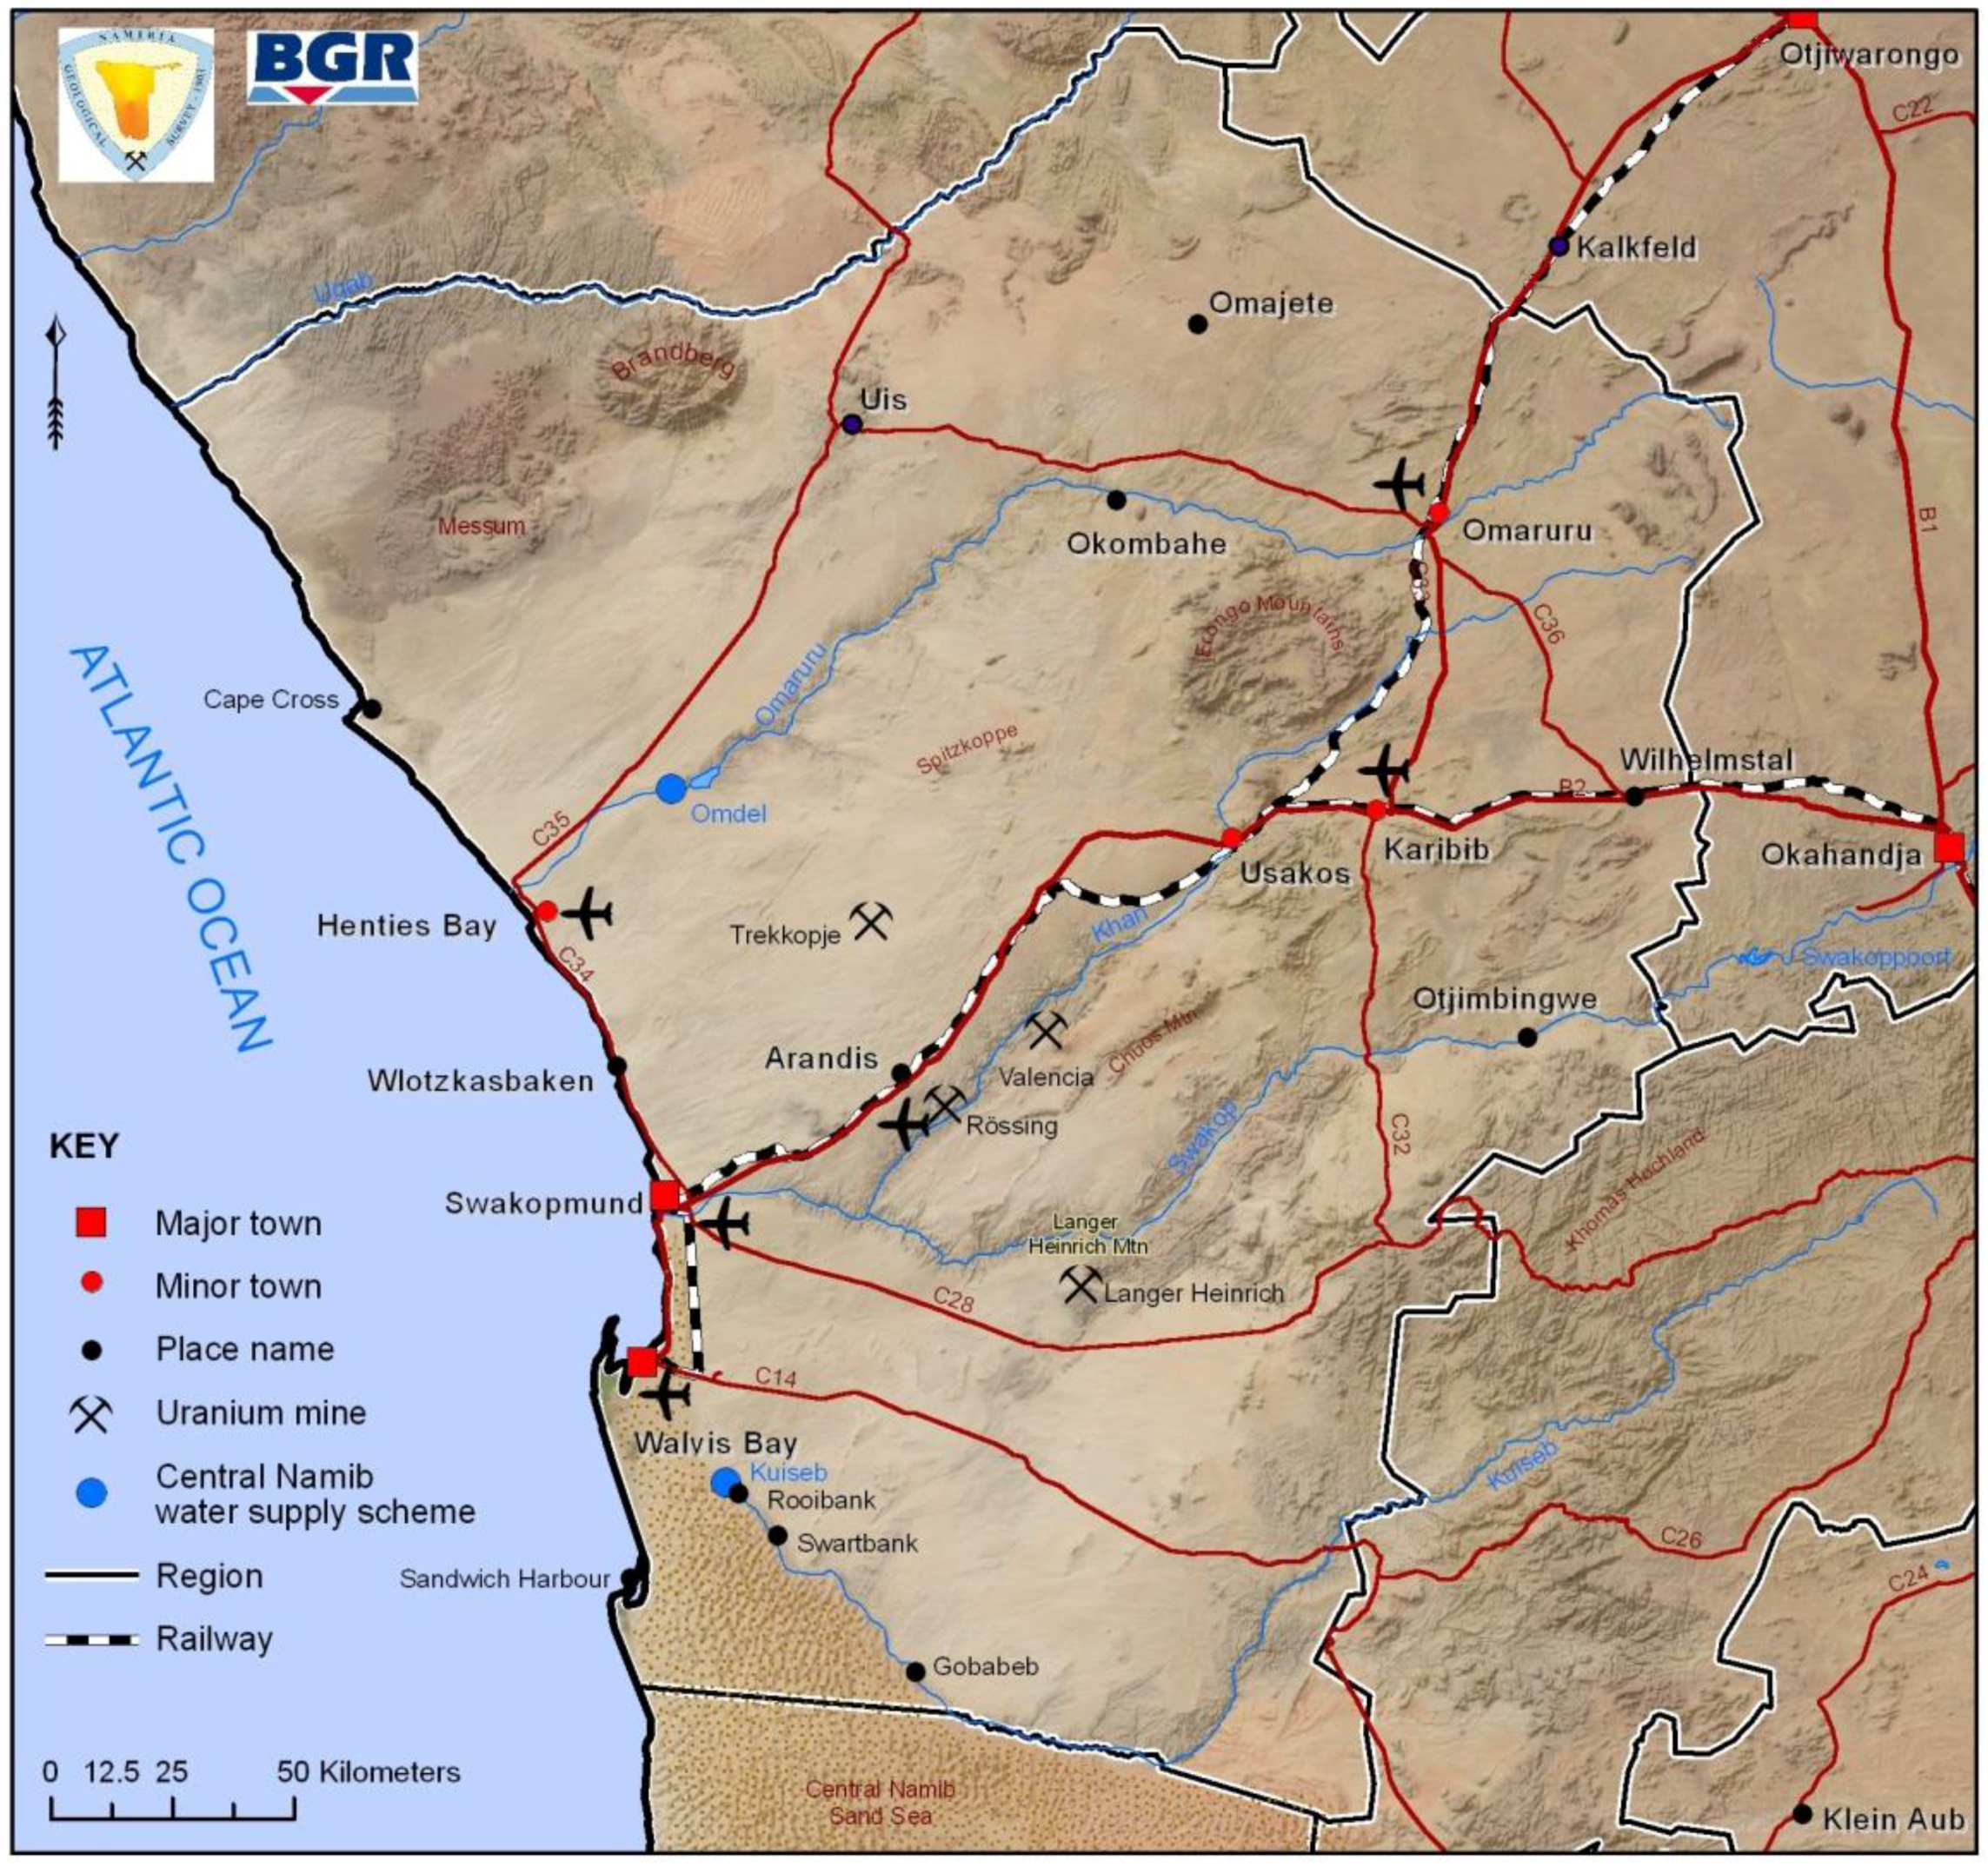
The Langerheinrich Uranium Mine is located in the Erongo Region, in the western coastal part of Namibia. The mine is developed in the floodplain of the Gawib River (
Figure 1), a tributary of the Swakop River, which is located north west of the study area and flows towards the Atlantic Ocean. Namibia hosts one of the largest uranium deposits in the world and such mines are expanding in different parts the country and the current study has been undertaken in the Langerheinrich Uranium Mine (
Figure 1).
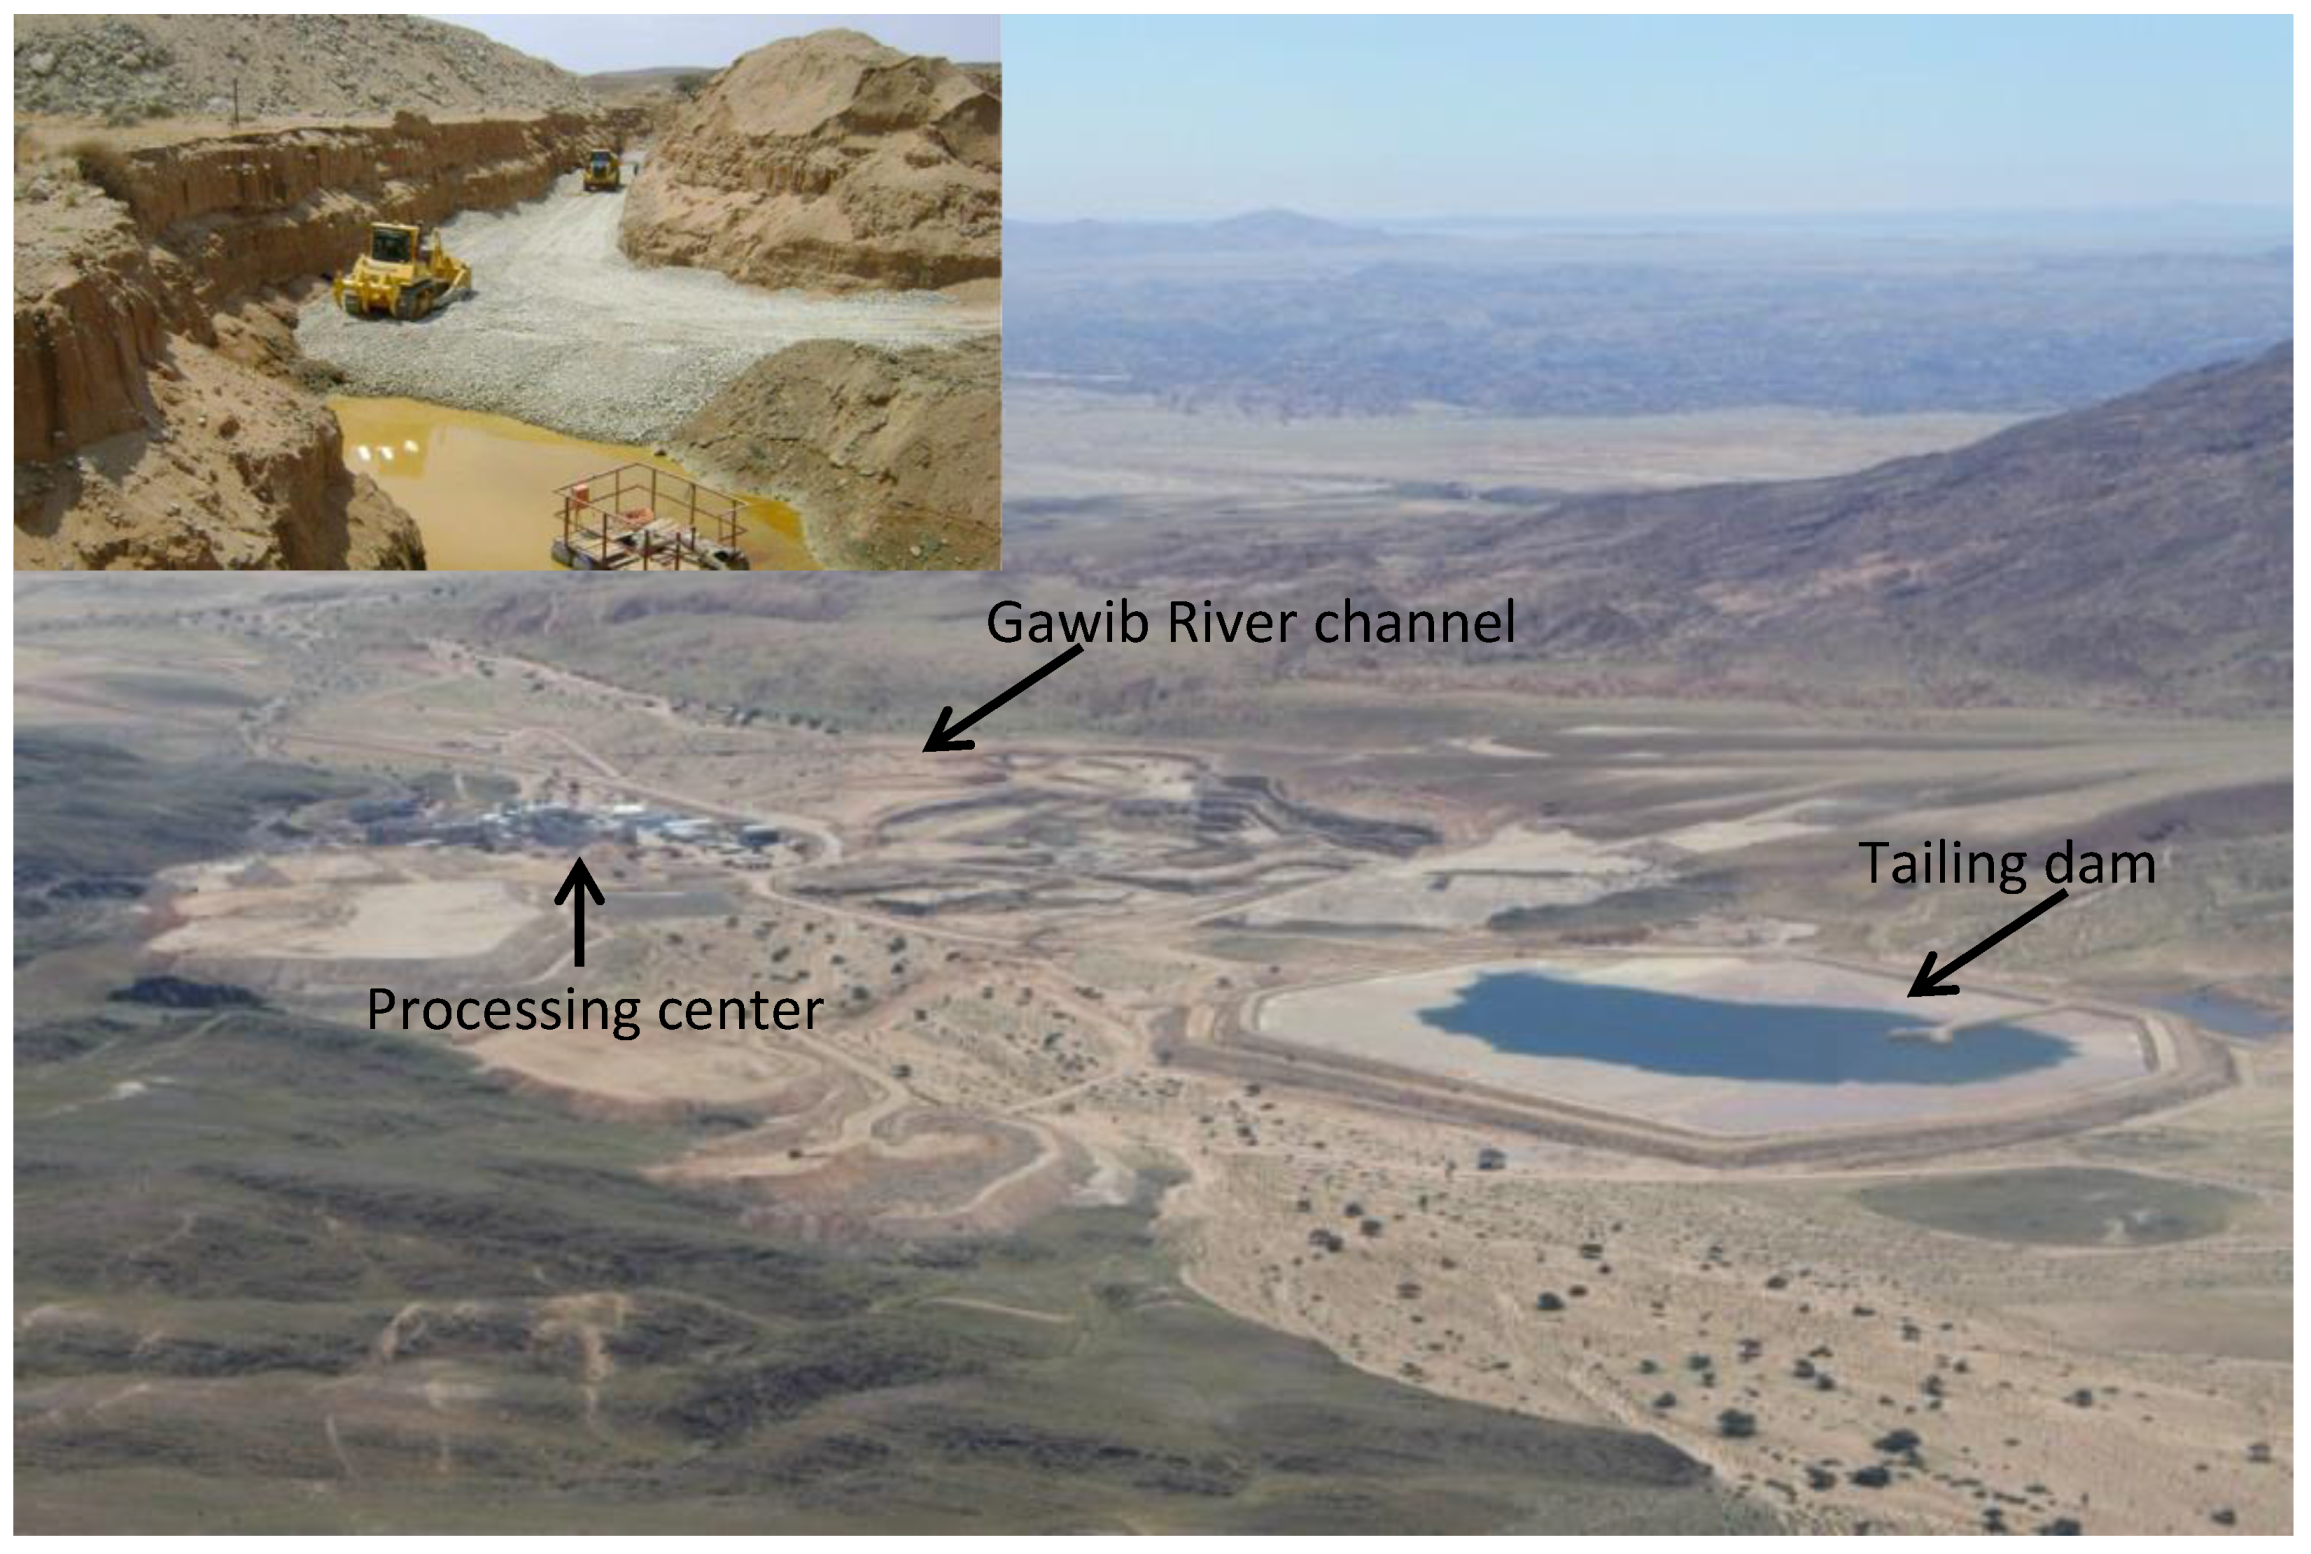
Sometime in the year 2008, seepage from the tailing dam was observed along the roads in the mine site downstream of the tailings [
1] and the important questions to ask are: how much of this water had infiltrated? What are the radionuclides content of the seepage water? The fact cannot be ignored here to mean that all the water has been pumped back to the tailing dams with no infiltration, after all not all the water seeped out of sediments. It is also important to note the location of the tailing dams (
Figure 2) that directly lies on top of the Gawib River flood plain. The tailings are not lined to prevent the seepage from the processing water that is ponding on the tailing dams and seep into the groundwater.
The Erongo region, which hosts several uranium mines, is situated in the arid Namib Desert with minimal vegetation and has an average rainfall of less than 150 mm per annum [
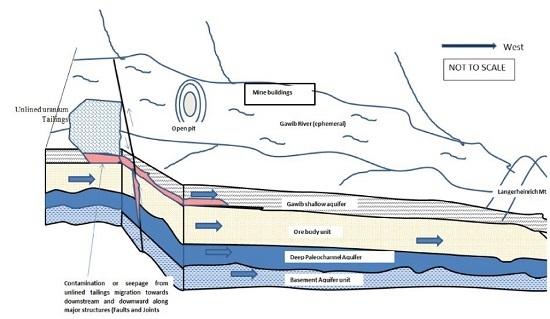
1]. The Langerheinrich mine is situated between the Langerheinrich Mountain that borders the mine in the North East and Schieferberge Mountain immediately to the south. The Khomas Hochland highlands lie in the South East part of the Langerheinrich, and are very crucial in the hydrogeology of the area as they are the source of recharge to the alluvial aquifer.
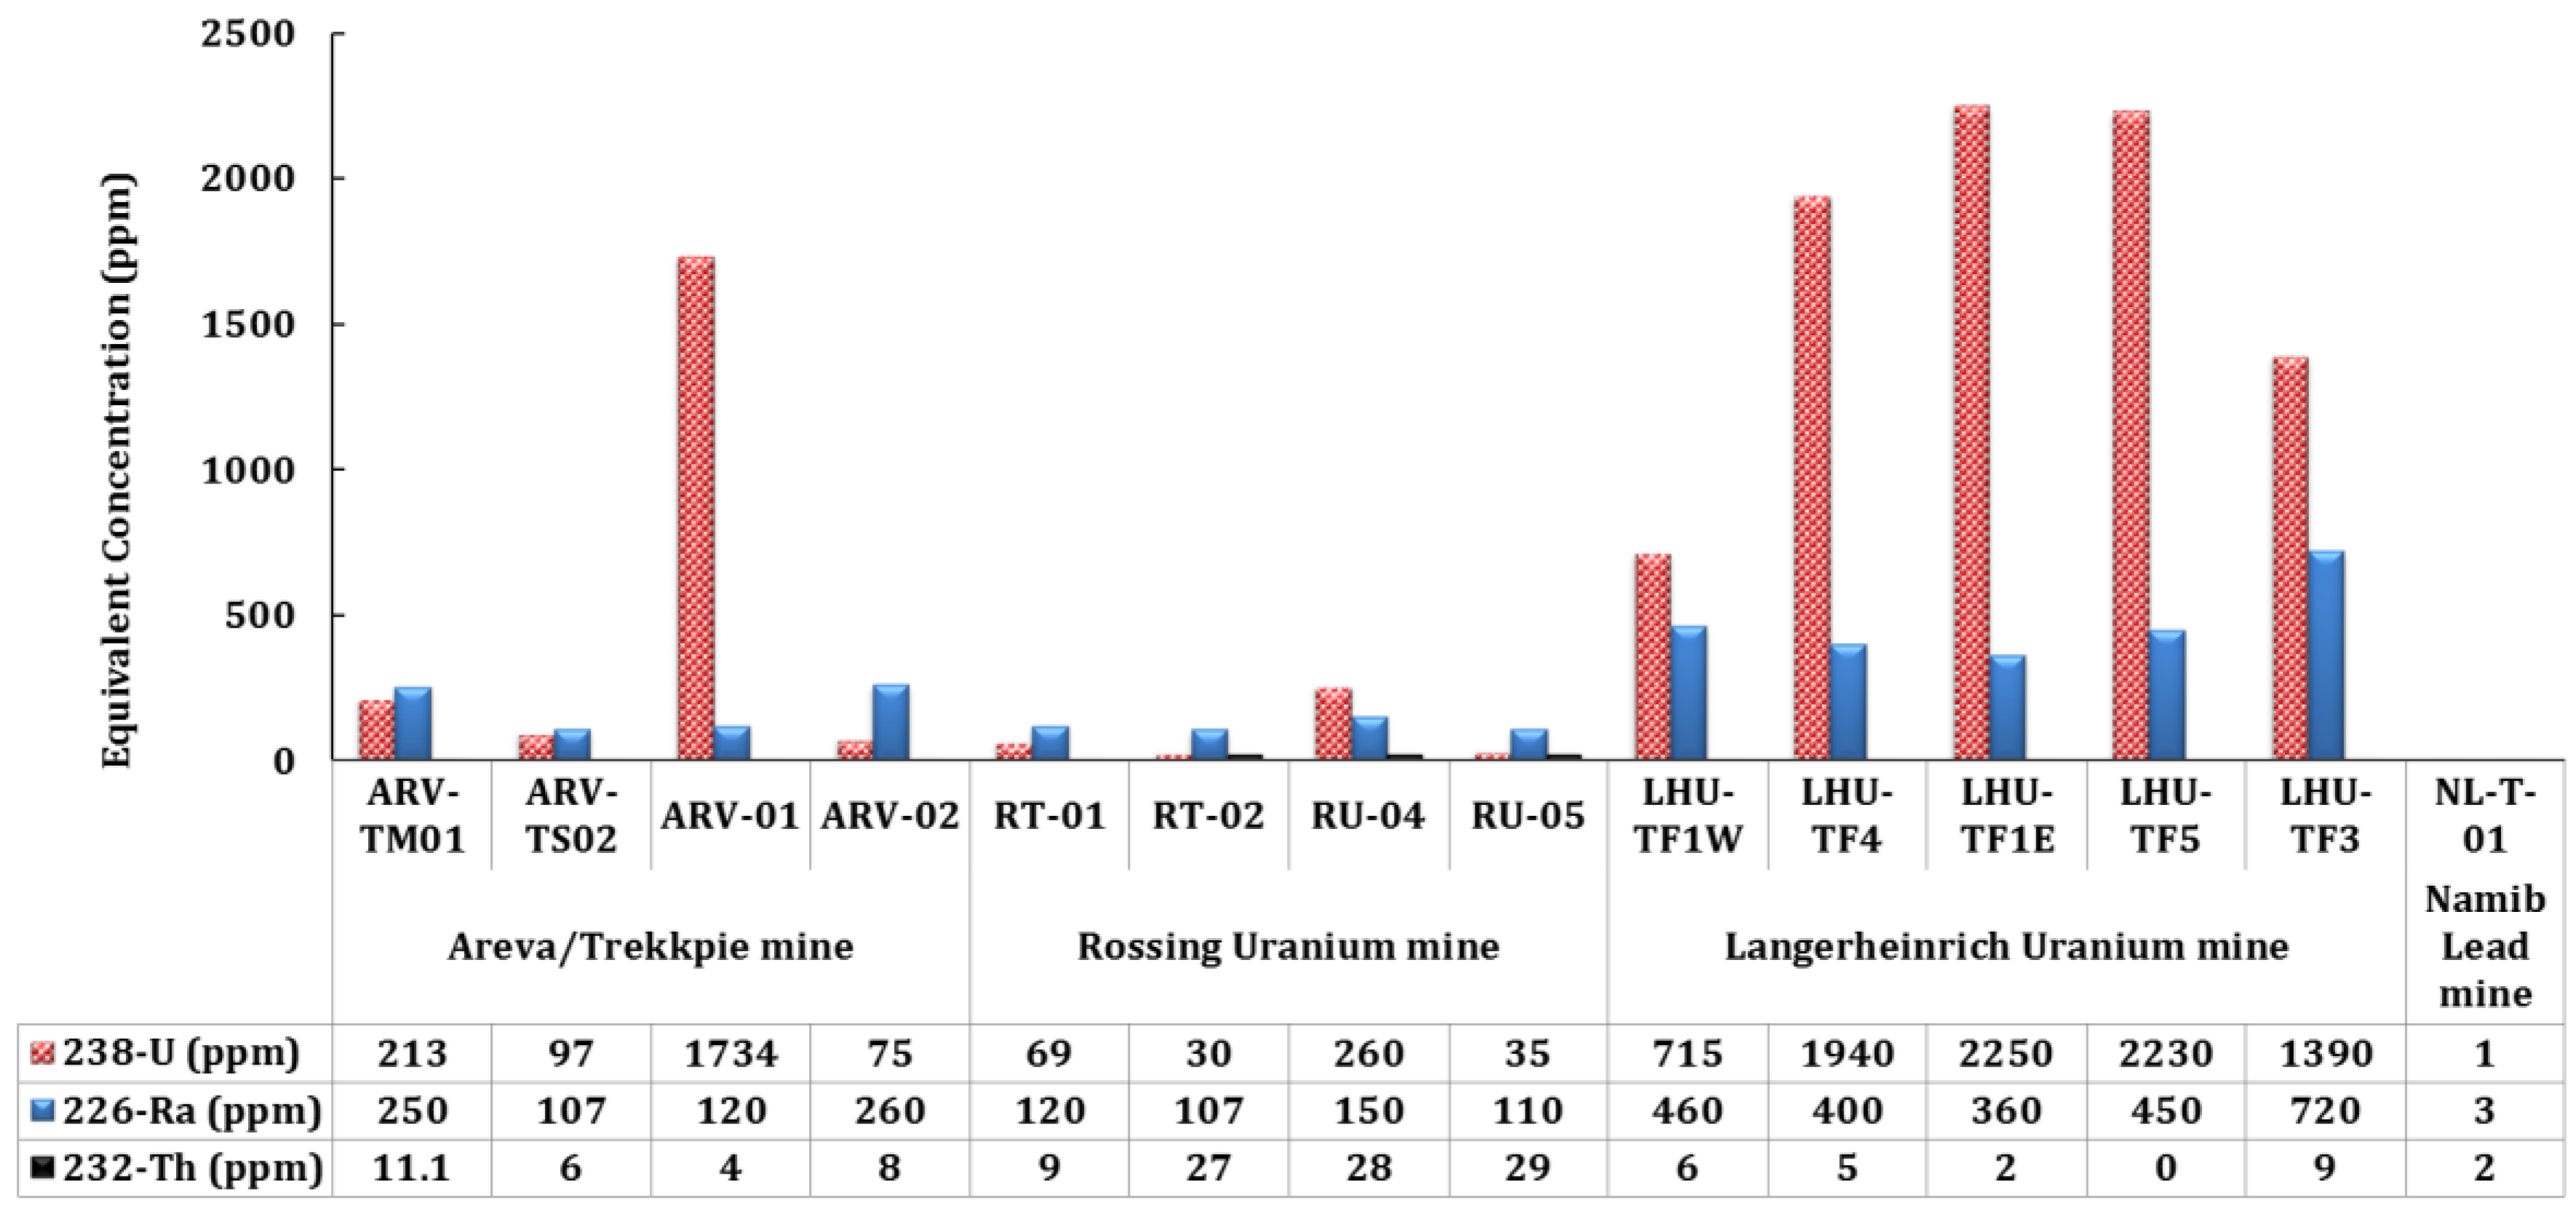
The most prominent indication of high uranium concentration in the groundwater was reported by Shaduka (2012) (
Figure 3) [
2]. The study was conducted in different uranium mines in the region such as Areva, Rossing and Langerheinrich where high equivalent concentration of U, Ra and Th was detected in the Langerheinrich Uranium Mine than the others except one uranium spike in the Areva mine. The results obtained by Shaduka (2012) were used as a baseline to conduct detailed investigation in the Langerheinrich Uranium Mine and the results are reported in this paper.
Owing to the provenance of the uranium tailing dams within the flood plain of the Gawib River, which is underlain by the alluvial aquifer, the main aim of this work focuses in the understanding of the possibility and degree of uranium seepage from the unlined tailing dams and dispersion downstream through groundwater flow. This was approached through quantifying the uranium concentration and estimating groundwater flow velocity to determine the time it takes for the plume to reach the fresh groundwater aquifer through thick unconsolidated sediments underneath the tailing dams. It was also aimed to build knowledge of the assessment and protection of groundwater resources in the uranium mining areas of Namibia. The findings are also expected to add value to the monitoring activities of radiation.
2. Geological and Hydrogeological Setting
The Langerheinrich Uranium Mine is located in the central zone of the Damara belt, within the Damara Orogen. The Damara Orogen is popular in the geological history of Namibia, which belongs to late-Precambrian (2.75 Ga) to early–Palaeozoic (2.5 Ga). The Damara Orogen is part of Pan-African collisional belts in Southern Africa. In Namibia, the Damara Orogeny has given birth to three distinct belts, which are the Damara, Kaoko and Gariep belts [
3]. The Langerheinrich deposit is hosted within the Late Proterozoic Damara orogenic belt consisting of meta-sedimentary and meta-volcanic rocks [
4]. As it was described in [
4], different stages of syn- to post-tectonic granites and alaskites intruded into the Damara rocks, some of them containing naturally high amounts of uranium, e.g., Rössing and Ida Dome alaskites. The stratigraphy of the Langerheinrich deposit is overlain by recent tertiary sands /scree fluviatile sediments of the Kalahari group that is about 60 m thick and underlain by the older Damara super group metasediments [
2]. North of the study area is the Langerheinrich Mountain composed of the quartzites and arkoses and belongs to the Etusis formation of the Nossib group (
Figure 4). The Gawib paleo-channel hosting the study area has cross cut the Tinkas formation, composed of schists and greywackes. The geological map in
Figure 4 also shows the extensive coverage of granites of the Damara group that are important source for the secondary uranium mineralisation in the area.
Alluvial deposits are thick at the foot of the central mountainous zone and in the coastal zone in the west with mainly evaporites such as gypsum and halite as main constituents. The presence of the evaporites could indicate the arid climatic condition of the region supported by the lack of fresh water. The westward-flowing river such as the Swakop is life-sustaining oases in the Namib Desert and sand, gravel and silt deposits in the riverbeds are usually 10–30 m thick and have substantial yield. As the Swakop River enters the Namib Desert, its groundwater becomes gradually more saline and unsuitable for human consumption [
5]. Detailed investigation of the study area shows that the Langerheinrich area has three distinct aquifer systems, namely; (1) Gawib shallow alluvium aquifers, on top above the orebody zone (2) Deeper Paleochannel aquifers; and (3) the Basement aquifers, fractured older Damara basement rocks [
6].
3. Materials and Methods
Available information in the area was reviewed besides the fieldwork that mainly involved water sample collection at the Langerheinrich Uranium Mine using a bailer for purging and sampling. In situ measurement of physico-chemical parameters (EC, pH, Redox, T) has been conducted. Samples were filtered and acidified in the field for uranium determination. The static water level and the total depth of the boreholes were recorded for each borehole. The borehole samples were selected according to their position in relation to the tailing dam being investigated. Some boreholes were selected from the upstream of the tailing facility in the paleo-channel and some downstream of the tailing facility.
The water samples were limited to ten which include the fresh water sample (water supplied to the mine by NAMWATER) and processing water sample, which is the water being recycled and deposited on the tailing dams. The eight samples are from the boreholes (
Table 1). The measurement shows that borehole depth varies between 16 m and 61 m while the static water level lies between 6.9 and 30.7 m. Essentially the measurements indicate the presence of aquifers that have variable depth which could include the upper alluvial part and the lower partially consolidated sediments.
The stable isotopes of oxygen and hydrogen were analysed by using the Liquid Water Isotope Analyzer (LWIA) model 45-EP at the University of the Witwatersrand (South Africa). The instrument contains the laser analysis system and an internal computer, liquid autosampler, a small membrane vacuum pump and a room air intake line that passes air through a Drierite column for moisture removal. A Hamilton microliter syringe was used to inject 0.75 µL of sample through a PTFE septum in the autosampler. The injection port of the autosampler is heated to 46 °C to help vaporize the sample under vacuum immediately upon injection. The vapor then travels down the transfer line into the pre-evacuated mirrored chamber for analysis.
A 1.5-mL aliquot of a sample was filtered and was pipetted into a 2-mL autosampler glass vial and closed with PTFE septum caps. Five standards were used in the analysis. The LWIA laser machine is capable of providing accurate results with a precision of approximately 1‰ for δ2Hand 0.2‰ for δ18O in liquid water samples of up to at least 1000 mg/L dissolved salt concentration.
For Tritium analysis, 10 samples were collected in 1 L PVC bottle and analysed at iThemba Labs, Gauteng, Johannesburg. The samples were distilled and subsequently enriched through electrolysis processes. 500 mL of the water sample, having first been distilled and containing sodium hydroxide, is introduced into the cell. A direct current of 10–20 ampere is then passed through the cell, which is cooled because of the heat generation. After a week, the electrolyte volume is reduced to 20 mL. The volume reduction of 25 times produces a corresponding tritium enrichment factor of about 20. Samples of standard known tritium concentration (spikes) were run in one cell of each batch to check on the enrichment attained. For liquid scintillation counting samples were prepared by directly distilling the enriched water sample from the highly concentrated electrolyte. 10 mL of the distilled water sample was mixed with 11 mL Ultima Gold and placed in a vial in the analyser and counted 2 to 3 cycles of 4 h. Detection limits are 0.2 TU for enriched samples.
The standard water quality test for major ions was performed on the samples by the Analytical Laboratory services Metals such as uranium, vanadium, and lithium were measured by using the Induced Couple Plasma Mass Spectrometer (ICP MS).
5. Discussion
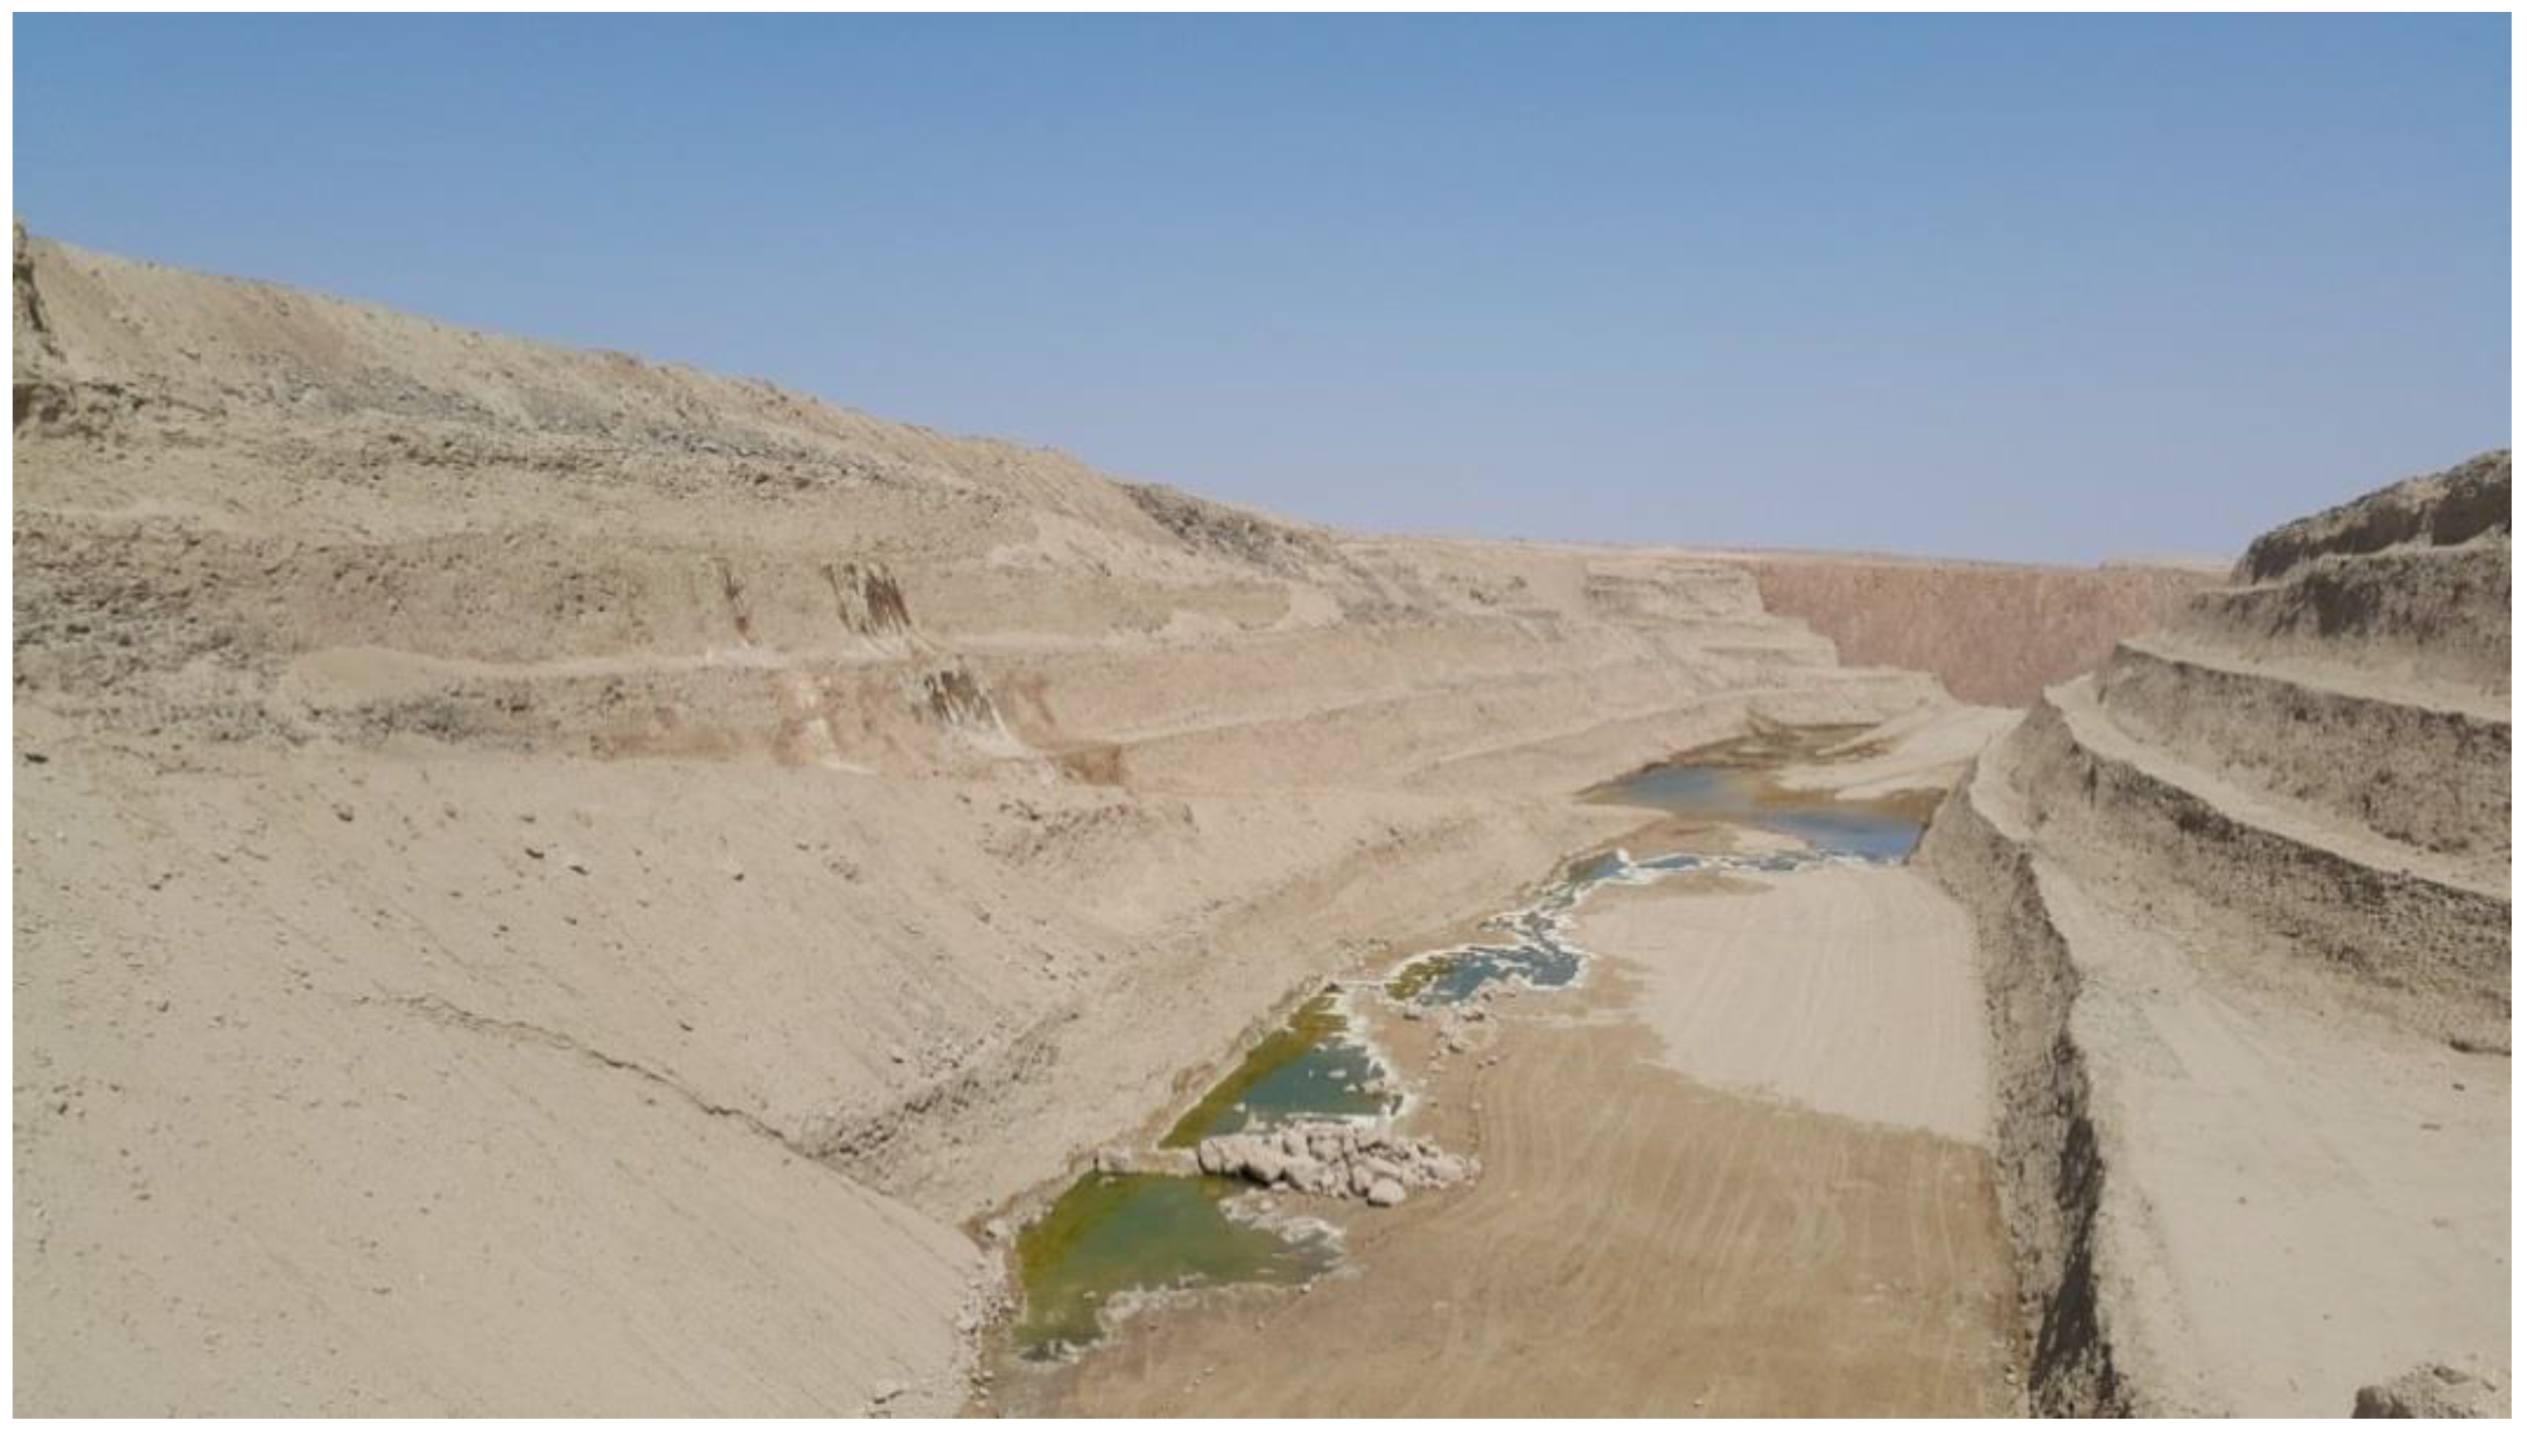
The physico-chemical parameters were useful in identifying the boreholes, which were influenced by the uranium rich seepage from the tailing dam that reveals an alkaline and oxidizing media through which transportation took place. The characteristic feature of the boreholes that are impacted by the seepage also has high electrical conductivity. Uranium rich seepage outlets are widely observed along the mining roads that can infiltrate into the shallow aquifer (
Figure 5).
The new tailing dam that is currently being used has only been lined underneath while continuous lateral seepage occurs regularly. The borehole located downstream of the tailing dam (TM46) produces yellowish coloured water that has been related to the seepage from the tailing.
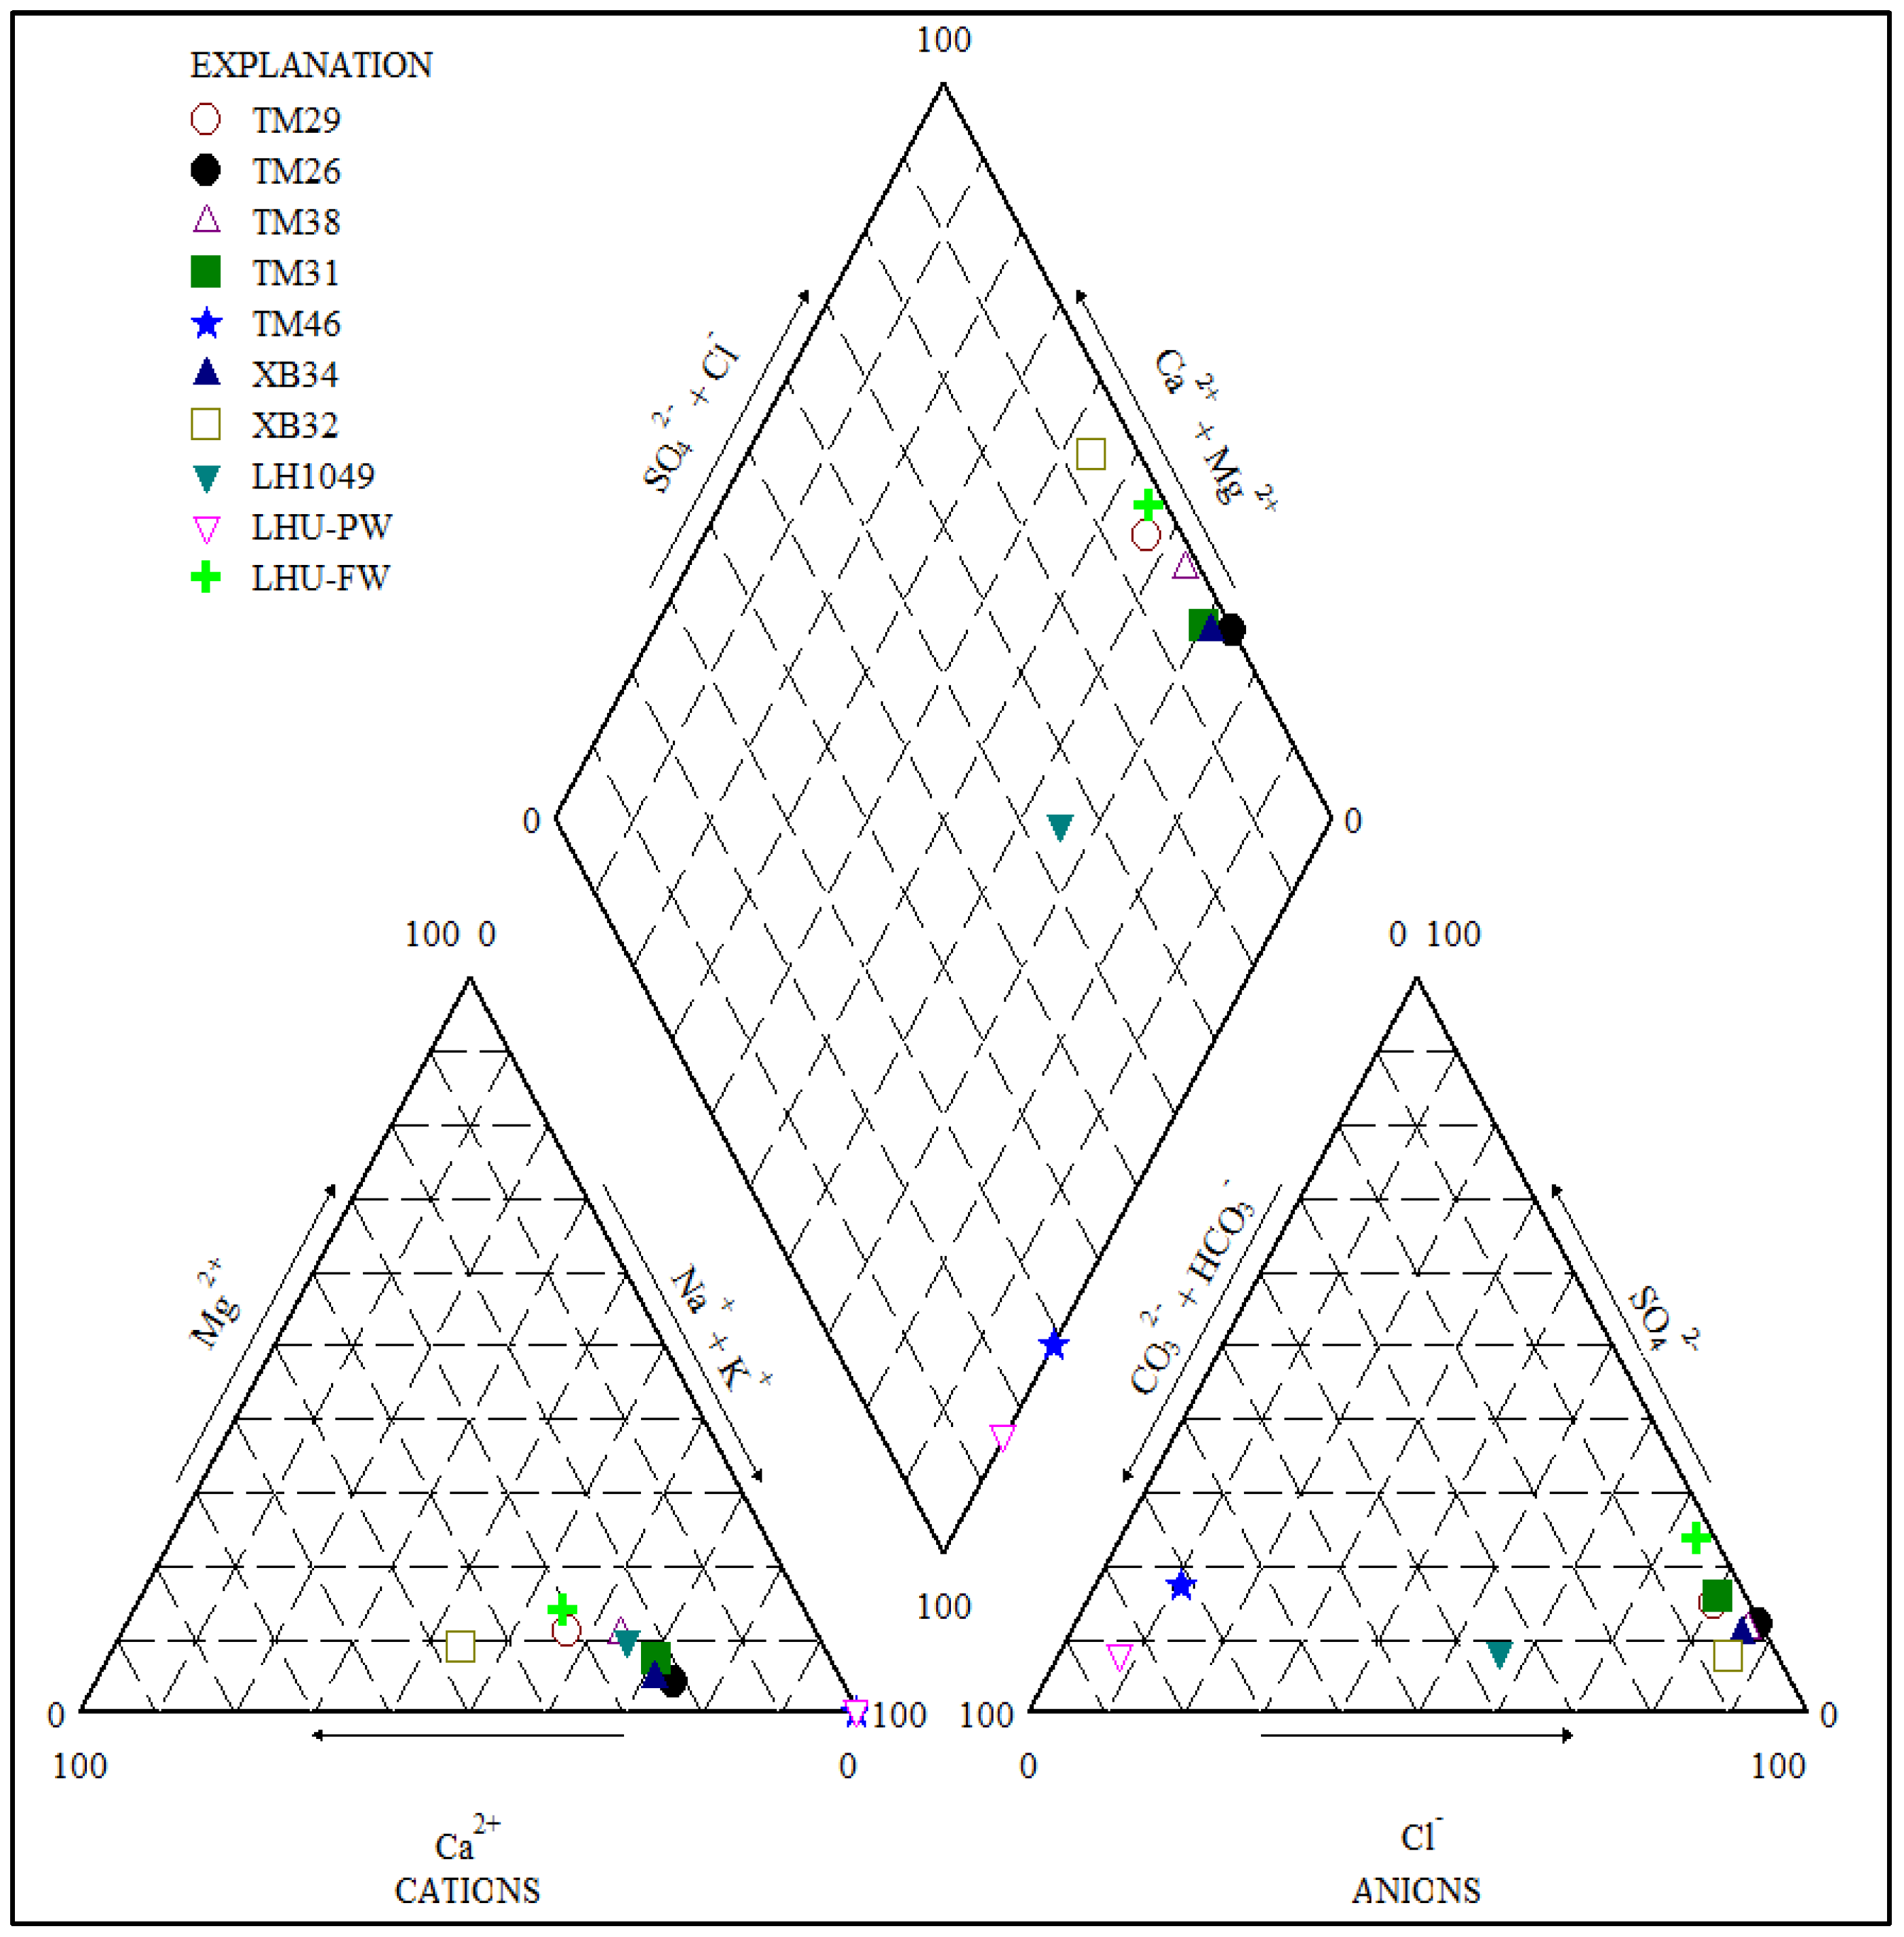
The major ion results were plotted on the piper diagram (
Figure 6) to determine the hydrogeochemical facies of water samples. Most water samples fall in the region of Na/K-Cl type with XB32 plotting on Ca, Mg and Na-Cl field. It is, however, important to observe the position of LHU-PW (processing water) and TM46 (borehole water downstream the tailings) both plot in the same Na/K-Cl field. On the diamond plot, all the water samples plots on the Cl and SO
4 region except LHU-1049, which plots on the Na + K, Ca + Mg and Cl + SO
4, HCO
3.
Most of the water samples have been plotted on the zone of 30% to 70% of the Ca2+ and Mg2+ where with TM46 and LHU-PW samples plotting on the region of freshening while LHU-1049 plots on the Mixing zone. This shows that TM46 is directly contaminated by the source (indication for mixing) with LHU-PW. TM46 and LHU-PW were plotted on the freshening region since “LHU-PW” processing water is continuously added being mixed with the clean water supplied to the mine, hence, the same effect was passed on to the polluted borehole. The LHU-1049 has plotted on the Mixing region suggesting the end members similar to the typical groundwater and the processing water.
The LHU-1049 borehole (borehole below the unlined tailing dam) is the only borehole that was sampled in the baseline water sampling campaign in 2005 [
7], which was before the mining activities that currently exists in the mine area. The results of the 2015 water analysis for the LHU-1049 borehole were compared with the 2015 data to determine if there is an impact of pollution through seepage/flow in the past ten years (
Table 3).
The 2015 water analysis for LHU 1049 borehole shows that the water quality has been highly deteriorated due to the mining activity, specifically contamination through seepage from the tailing facility and groundwater flow in the alluvial aquifer. A decade of time-span shows tremendous impact on the quality of groundwater, which is under the influence of constant seepage and flow within the alluvial aquifer. The parameters such as EC and Cl increased by over 60%, while the increase for others is over 100% (
Table 3), which shows lack of attenuation in the sediments or overload of chemicals. Uranium increased from 0.1 mg/L (background value) in 2005 to 8.9 mg/L in 2015, which represents about 8800% increase.
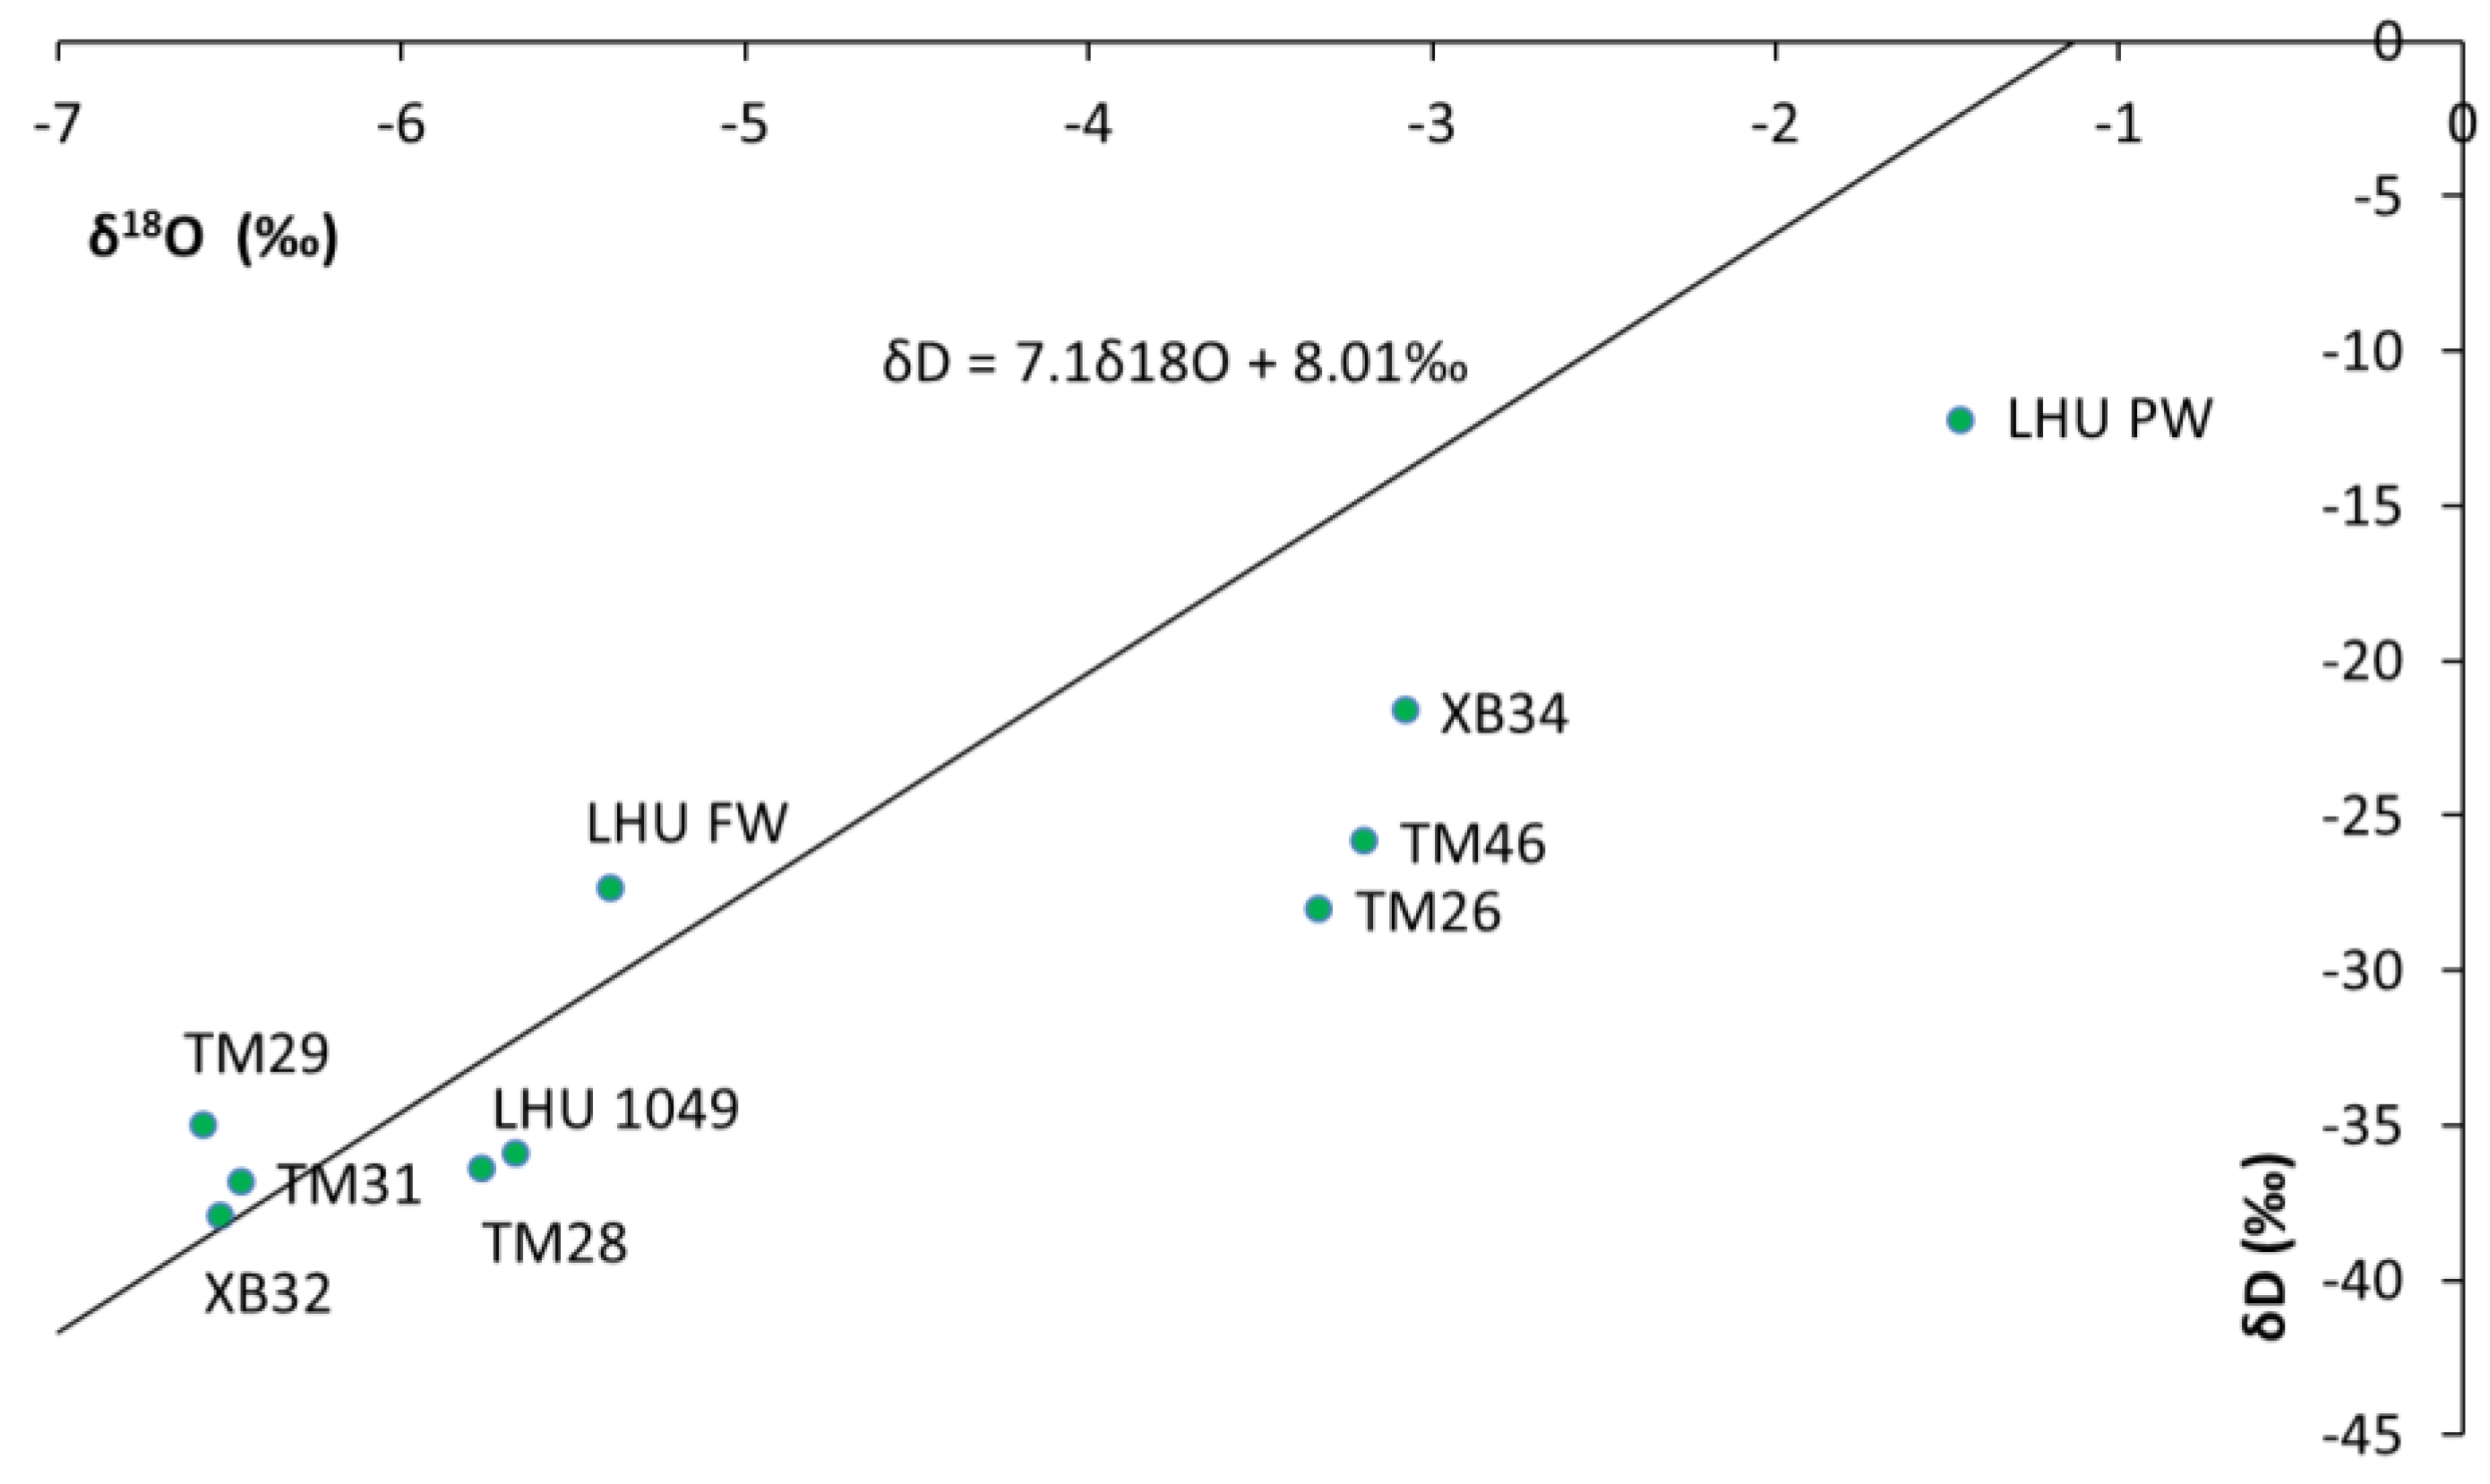
The isotopic results were plotted in relation to the Local Meteoric Water Line (δ
2H = 7.1δ
18O + 8.01‰) for Windhoek (IAEA-GNIP data) (
Figure 7). The LHU-PW sample plots in the enriched zone reasonably due to recycling, hence, enriched with respect to heavy isotope. The samples upstream of the mining area i.e., XB34 and XB32 and the samples from far downstream do not seem to be affected by seepage as they plot off the mixing line between the signature of the groundwater and the LHU-PW (Processing water sample) which is the seepage contaminant, they have depleted isotopic signature. However, for the samples in the mining area i.e., TM46, TM26, LHU1049 and TM28 the isotopic signatures seem to be affected by the seepage.
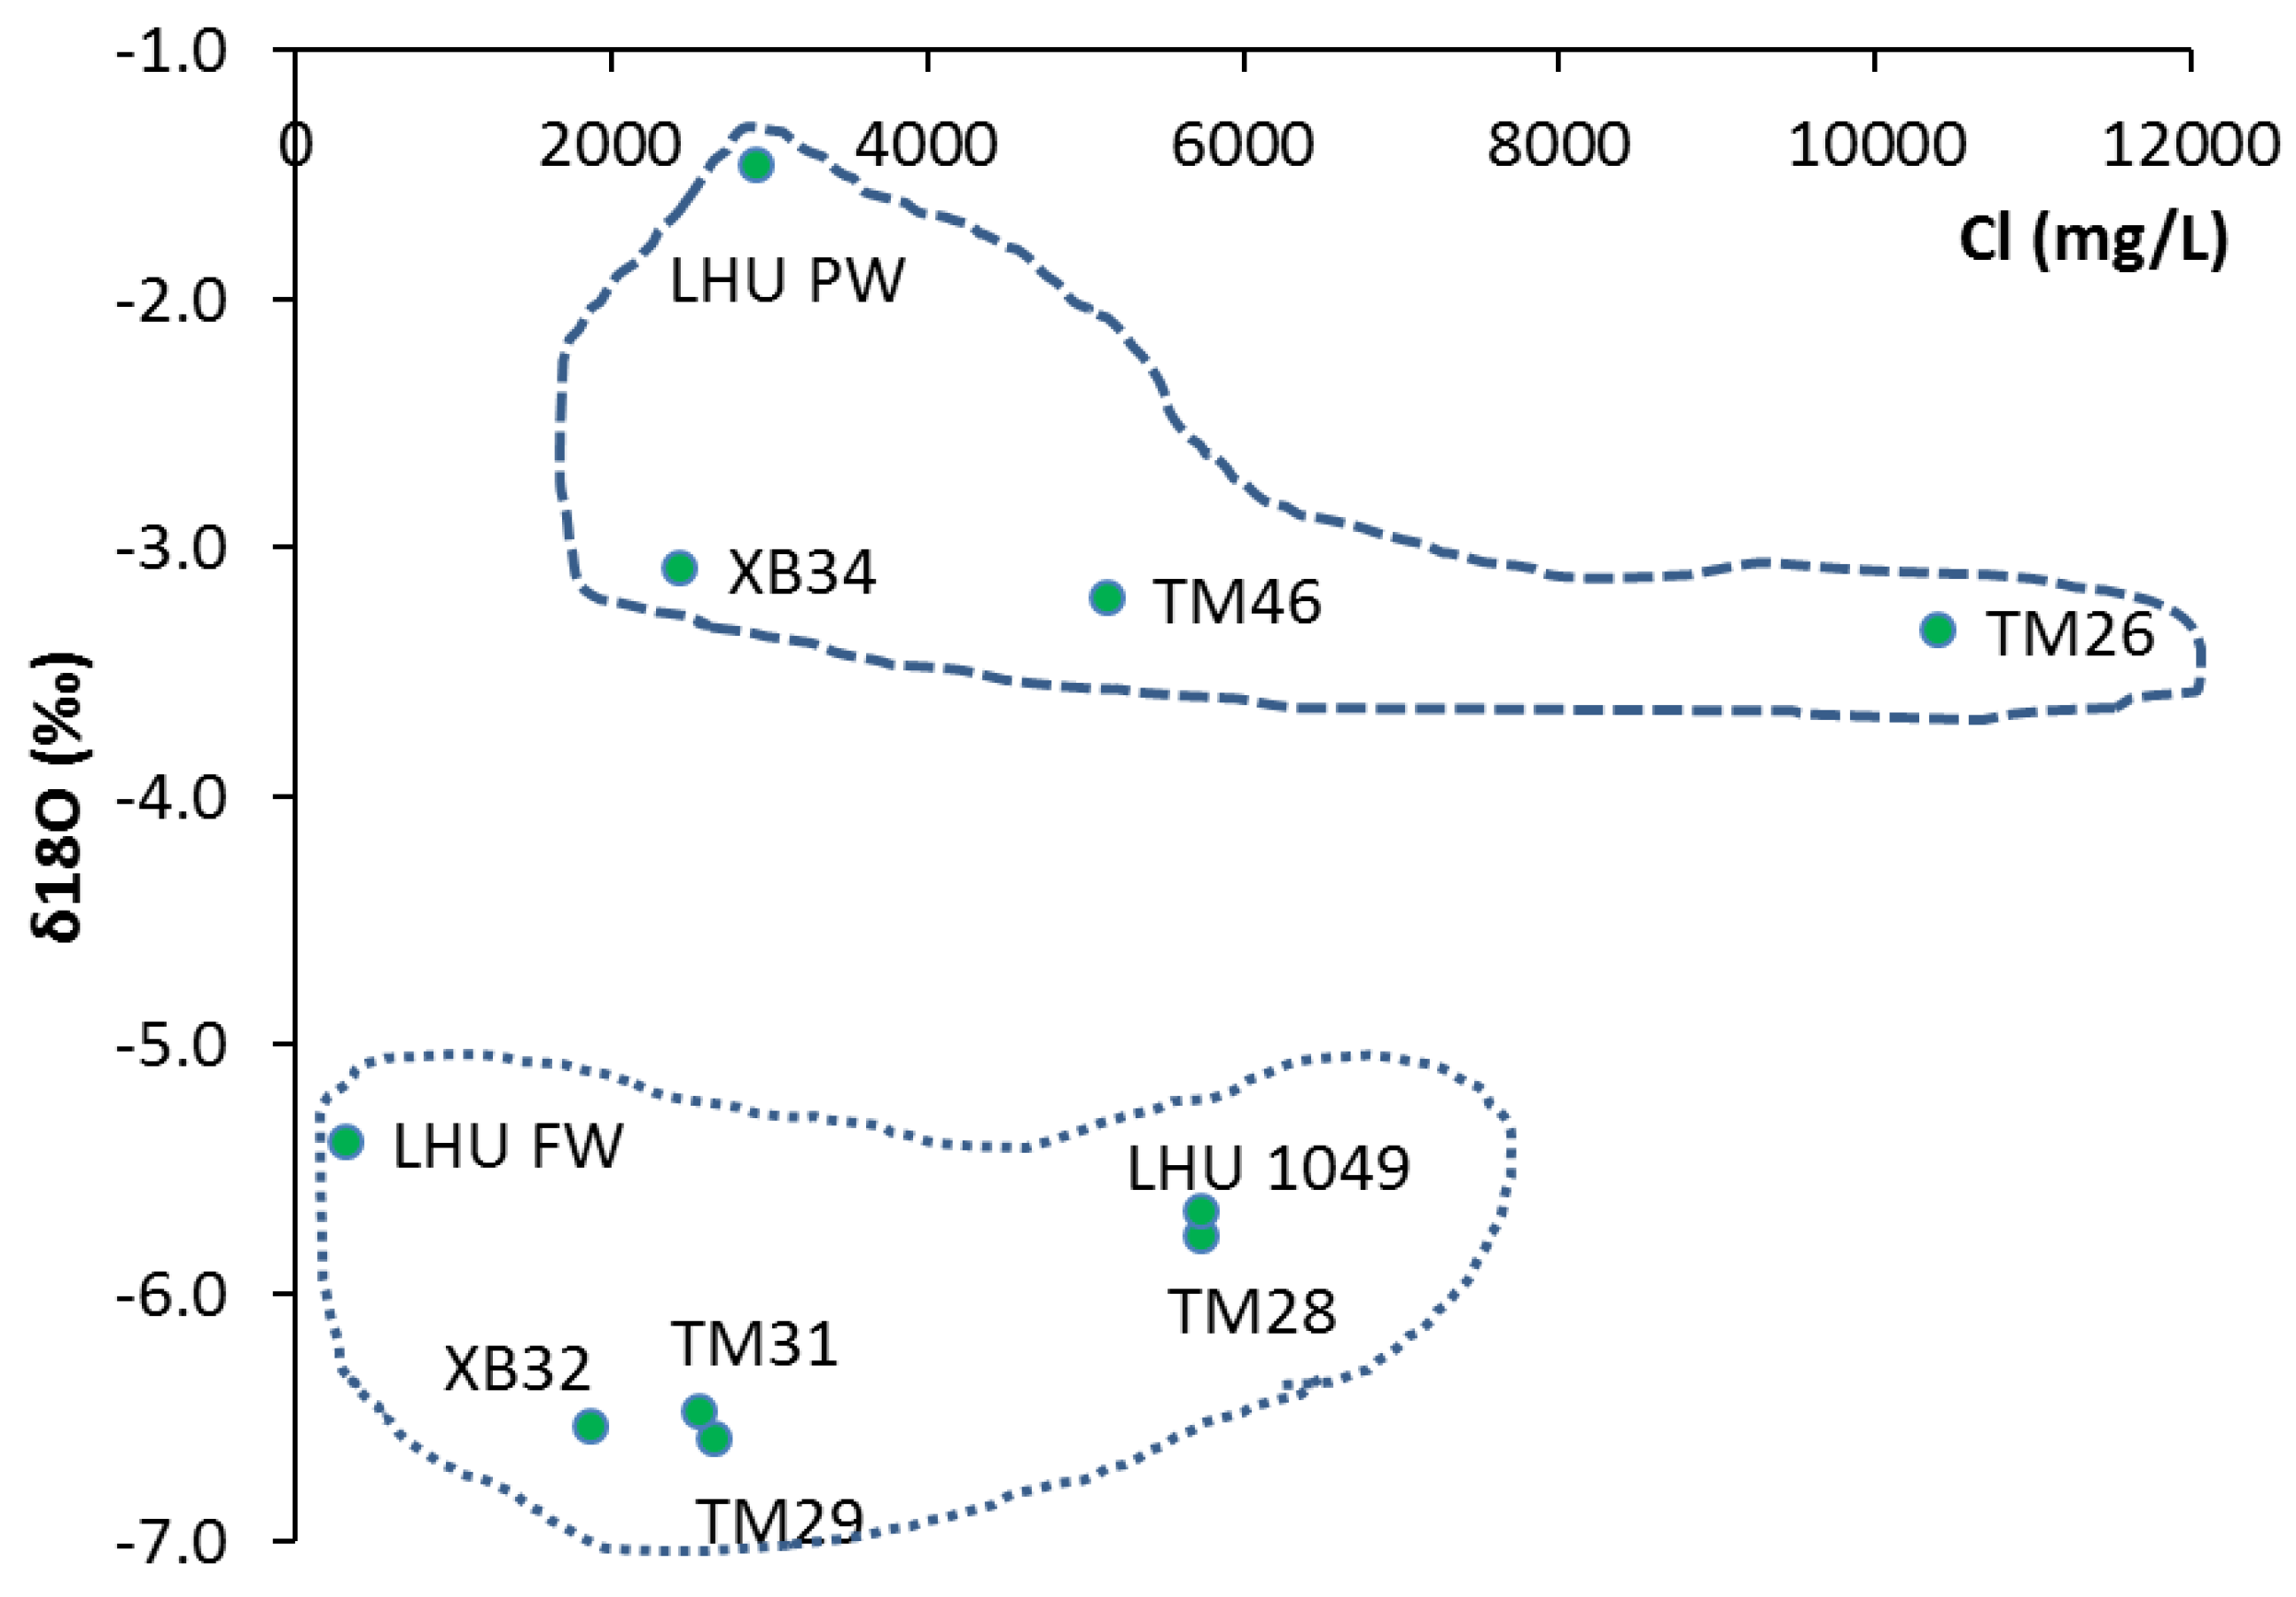
The plot for the chloride against the stable isotope of oxygen 18 (
Figure 8) suggests that at least four samples such as LHU PW, XB34, TM 46 and TM 26 with variable chloride concentration show impact of evaporation with enriched δ
18O. The figure depicts the presence of two clusters that signifies the presence of both shallow (the upper cluster) and deep (lower cluster) circulating groundwater. The stable isotope results also confirm that the aquifer in the area exist as an open system that facilitates groundwater flow, which is also supported by the recharge of isotopically enriched water after evaporation. Hence, it is vulnerable to seepage and dispersion downstream through groundwater flow. Therefore, extra caution is required to protect the precious groundwater resource in the alluvial aquifer from uranium pollution.
Tritium is an excellent tracer for determining time scale for mixing and flow of water since it is considered to be relatively conservative and is ideally suited for studying processes that occur on a time scale of less than 100 years [
8]. Its original amount decreases only through radioactive decay with a half-life of 12.43 years. The tritium results show that two water samples (TM26 and XB34) have values less than 0.8 TU i.e., TM26 (0.6 TU) and XB34 (0.8 TU). The remaining samples have tritium values ranging between 1 and 2.1 TU, (
Table 2). The tritium content of the precipitation at Windhoek is about 2.6 TU and 3.6 TU for January and February 2000 respectively, (IAEA-GNIP data). It is important to note that the Windhoek GNIP station is located at about 260 km from the Langerheinrich uranium mine that might not receive the same type of rainfall and tritium content could vary accordingly. Hence, the Windhoek rainfall tritium value may not be reflected in any of the samples and therefore, it could be misleading to conclude that there is no direct recharge from current precipitation in the area. Tritium can be used as an indicator for the groundwater recharge time. The TM6 and XB34 samples have less than 0.8 TU, hence referred to as Sub modern—recharged prior to 1952 [
9]. The other six borehole samples and the two samples obtained from the pipeline and pond (processing water) has tritium values falling in the bracket of 0.8–2.1 TU, hence, referred to as mixture of sub-modern and recent water [
9]. The tritium values also indicate that there is an open hydrological system at Langerheinrich mine where there is a recent recharge into the groundwater in the mining area, hence, suggesting the possibility for pollutants to enter the underlying aquifer from the mining activities.
It is very important to underline the fact that seepage of uranium rich water is governed by groundwater flow velocity controlled by the loading capacity from the tailing dams, redox condition and hydraulic property of the aquifer. In this case, there are other major factors including the lithologies and structural setting of the area to be considered. This is because uranium mobility depends on the broad range of factors that also include chemical reaction in the tailing dam and subsurface reactivity of uranium with the sediments. There are major structures such as faults and fractures in the study area that can influence the groundwater flow and hence, the downward movement of the plume or seepage from the tailing dam. Since the downstream boreholes are affected by uranium pollution, this study tries to estimate the travel time for the contamination plume from the contaminated borehole LHU-1049 to the non-contaminated borehole TM29 located at 2.6 km downstream of the mine.
The hydrogeological properties such as hydraulic conductivity (k) and effective porosity (ŋ
e) for the alluvial aquifer of the area have been extracted from existing work [
10]. The horizontal distance between borehole LHU-1049 and TM29 was about 2.6 km. The groundwater head between the two boreholes was measured in the field.
Parameters:
Hydraulic conductivity (K) = 10 m/d = 3650 m/year
Effective porosity (ŋe) = 0.25
Change in groundwater head (∆H) = LHU-1049 (30.74 m) & TM29 (17.15) = 13.59 m
Hydraulic gradient (i) = 13.59/2600 m = 0.00523
Distance between the two boreholes = 2600 m
The seepage velocity (V
t) between LHU-1049 and TM29 is given by:
With the seepage velocity of 76.4 m/ year, it will take about 34 years to cover a distance of 2600 m to reach the borehole TM29. This is the seepage from the old tailing dam, however, given the situation that the current active tailing dam next to the TM29 borehole, is also having a seepage problem. The seepage may reach this borehole in a very short time as compared to seepage of the old tailings as estimated above. It is also important to note that the estimated velocity does not take into account the nature of fractures (joints and faults) in the area that may boost the seepage velocity. The result is helpful to bring to the attention of decision makers for further protection of the downstream groundwater resource from pollution.


