Article

Differences in Stream Water Nitrate Concentrations between a Nitrogen-Saturated Upland Forest and a Downstream Mixed Land Use River Basin

1
Kyushu University Forest, Kyushu University, 394 Tsubakuro, Sasaguri, Fukuoka 811-2415, Japan
2
Research Institute for Humanity and Nature, 457-4 Motoyama, Kamigamo, Kita-ku, Kyoto 603-8047, Japan
3
Faculty of Agriculture, Kyushu University, 6‑10‑1 Hakozaki, Higashi‑ku, Fukuoka 812-8581, Japan
*
Author to whom correspondence should be addressed.
Hydrology 2017, 4(3), 43; https://doi.org/10.3390/hydrology4030043
Submission received: 16 July 2017 / Revised: 10 September 2017 / Accepted: 11 September 2017 / Published: 14 September 2017

Abstract

:
Nitrogen (N) saturation of upland forests has been assumed to be a substantial N source downstream. However, removal processes of N, including assimilation and denitrification in the downstream area, have not been clarified. To evaluate the N removal processes, nitrate (NO3) and organic N concentrations, as well as nitrogen isotope ratio (δ15N) and oxygen isotope ratio (δ18O) of NO3 were measured along three rivers of Tatara River Basin, Japan where upland forests have already been N-saturated. Geographic information system (GIS) based topographical analysis was also conducted to evaluate the land use as urban area in relation to topography. In two of the three rivers, NO3 concentrations did not increase from upstream to downstream, despite the potential non-point N sources of urban areas. In another river, NO3 concentrations rather decreased. The values of δ15N and δ18O of NO3 and organic N concentrations suggested the presence of denitrification and assimilation over N pollutants in the river whose watersheds have a lower percentage of urban area. The lower percentage of urban area could be explained by the lower topographic index. This study concluded that the NO3 leaching from upland N-saturated forests was substantially assimilated or denitrified in the downstream area.

1. Introduction

It is vital to identify the factors regulating stream nitrogen (N) eutrophication in a mixed land use river basin [1,2]. Non-point source (NPS) pollution from agricultural and urban areas is the main source of downstream eutrophication [3], while denitrification and assimilation reduces nitrate (NO3) in stream water, leading to reducing N eutrophication in stream water [4,5]. These factors should be evaluated carefully to improve our understanding of downstream N eutrophication.
Upland forests have been commonly regarded as having negligible NPSs for downstream eutrophication [6,7]. However, elevated atmospheric N deposition resulting from human activities may potentially cause N saturation in forested ecosystems, defined as an excess of biotic demand [8], which causes high levels of NO3 leaching from upland forested ecosystems to be observed [8,9]. Thus, N-saturated upland forests can also act as an influential NPS, as can agricultural and urban areas [10,11].
Chiwa et al. [10] conducted synoptic stream water samplings in the Tatara River Basin, northern Kyushu, Japan, and found that the stream NO3 concentrations in the N-saturated upland forest were high compared to those downstream, concluding that the N-saturated upland forests could be a substantial NPS of N downstream. However, neither loading, nor downstream removal processes of N (including assimilation and denitrification) have been clarified. These processes are important for improving our understanding of the effects of high levels of NO3 leaching from N-saturated upland forests on downstream N eutrophication.
Quantitative analyses of loading from each pollutant source and removal processes in downstream areas form a reliable approach for understanding the factors affecting downstream N eutrophication [12]. However, this approach requires excessively large labor costs because of the complexities of pollutant sources and removal processes in downstream mixed land use river basins. Precise pollutant concentrations and water discharge are also required for load calculation. In addition, there are several unknown factors in the evaluation of load factors for certain areas because the nitrogen load in rivers depends on multiple terrestrial factors such as topography and land use, as well as various biogeochemical processes [13].
The isotope composition of nitrogen compounds provides detailed tracers to evaluate nitrogen transport and transformation dynamics in catchment and river systems [13,14]. It has been demonstrated that anthropogenic nitrate originating from wastewaters and fertilizers has a differing range of nitrogen isotope ratio in NO315N) values, so the isotope tracer technique is particularly useful for assessing nitrogen pollution in rivers. Stable isotopes of riverine NO3, such as δ15N and oxygen isotope ratio in NO318O) values have been used to identify NO3 sources in surface water [15,16]. Increases in both δ15N and δ18O values indicate N removal processes including denitrification [17,18] and assimilation by microbial activities [19,20]. Therefore, the use of stable isotopes of these riverine NO3 should be a powerful tool for inferring the N source and removal process of NO3 in downstream water.
Many studies evaluate stream NO3 loading and its removal process using isotope techniques [6,13]. However, no study has yet examined catchments with N-saturated upland forests. It is important to understand how high NO3 loading from N-saturated upland forests is removed in downstream areas for the purpose of the management of downstream N eutrophication.
We hypothesized that NO3-N from upland N-saturated forest is assimilated or denitrified in downstream areas. The objectives of this study are (1) to evaluate the NPS from upland forest and (2) to identify additional NPS and N removal processes in the downstream area using δ15N and δ18O values of NO3 in the Tatara River Basin where upland forest has been N saturated [10]. This is the first study to show the N removal process in the mixed land use downstream area in a catchment with N-saturated upland forest.

2. Materials and Methods
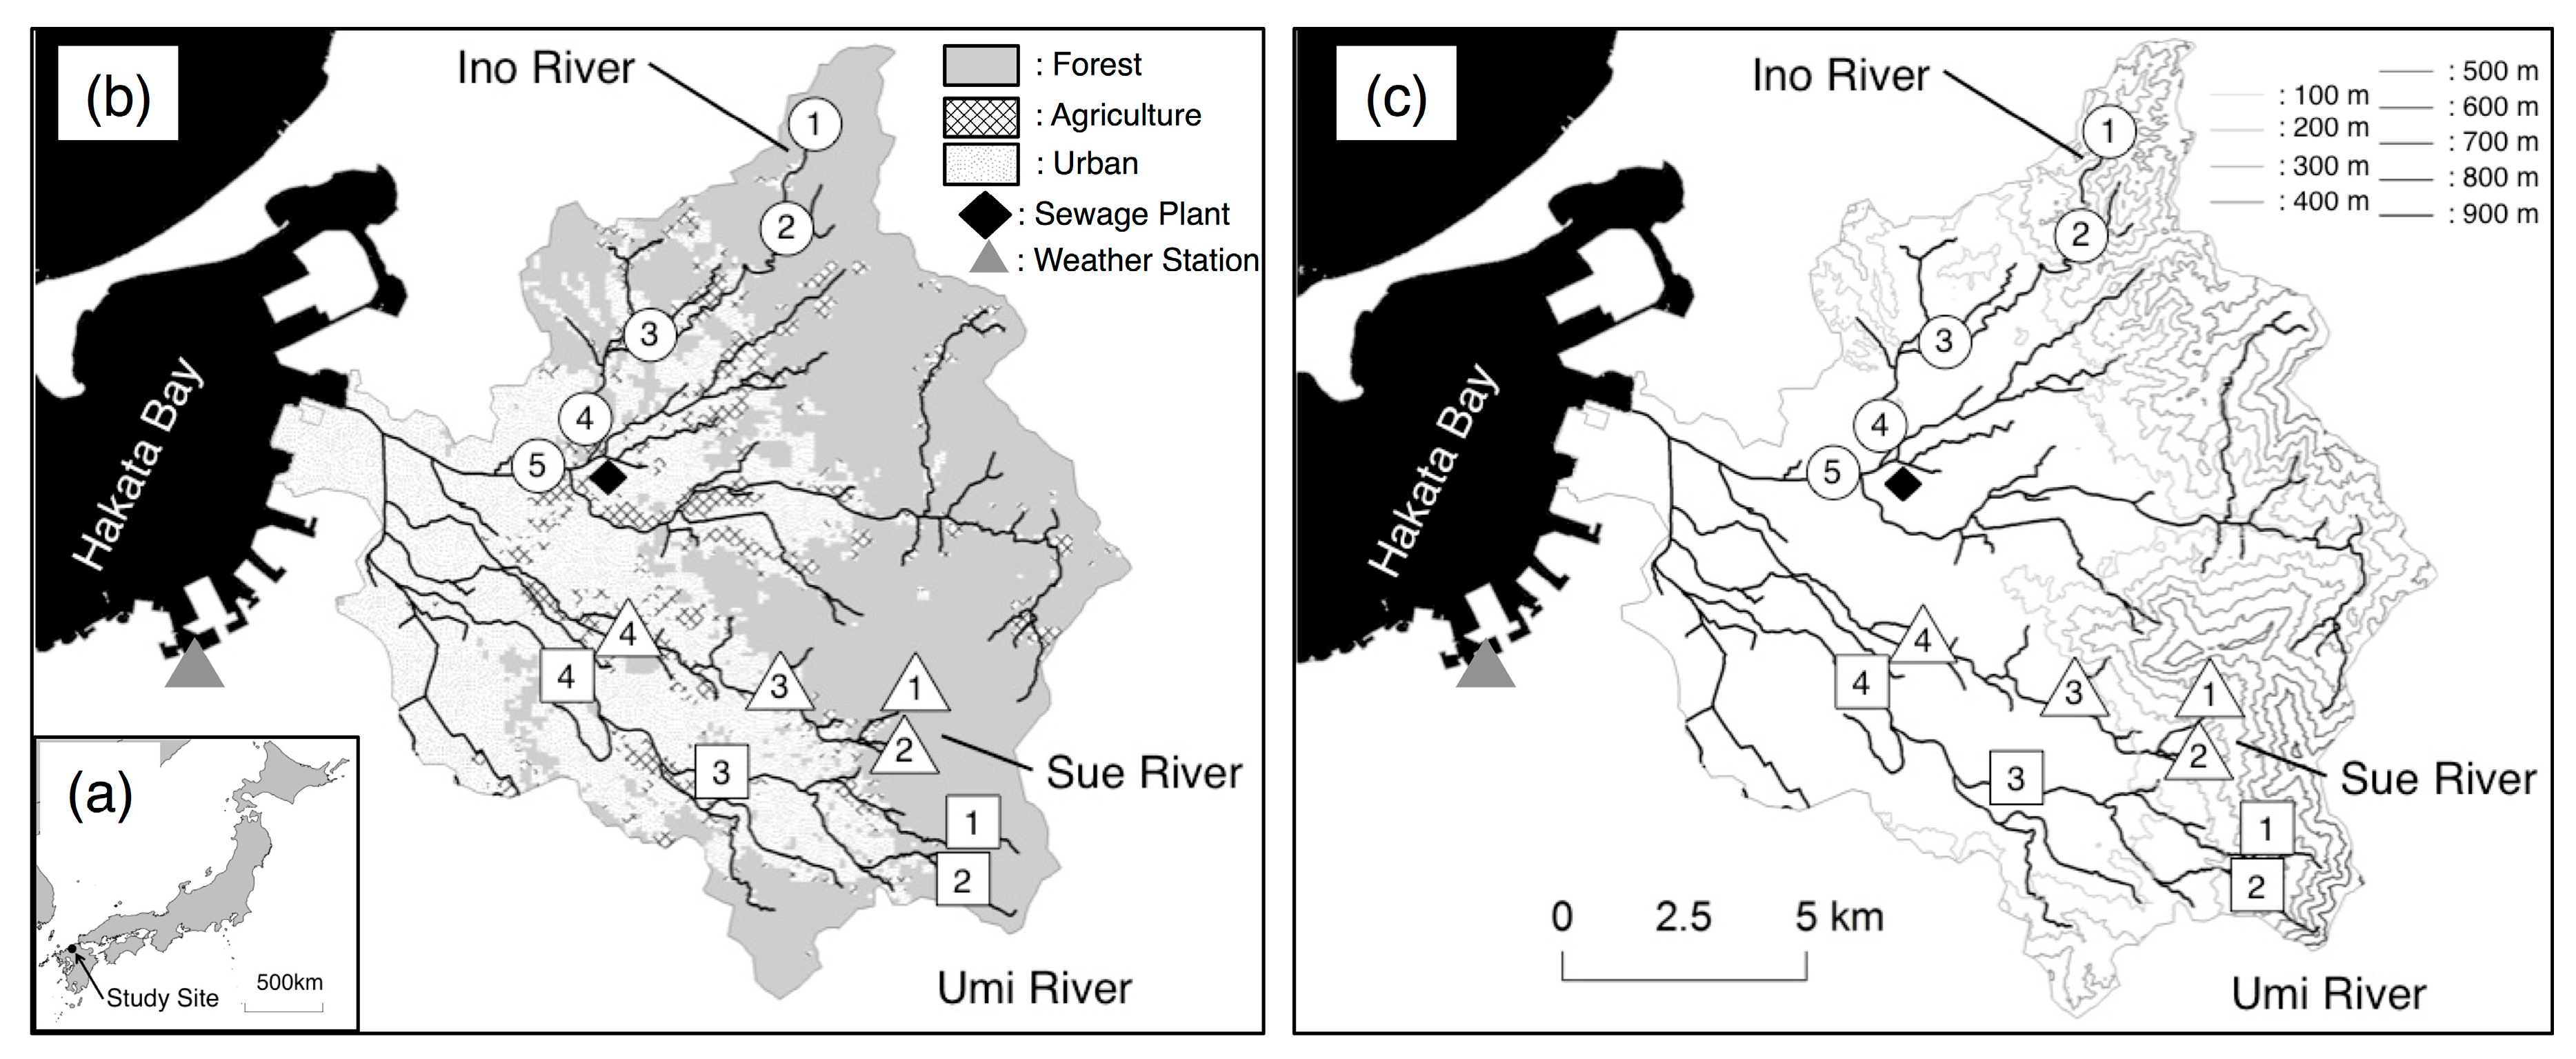
2.1. Study Area

This study was conducted in the Tatara River Basin located in northern Kyushu Island, western Japan (Figure 1a). It consists of the Tatara River and several tributaries: the Ino, Sue, Umi, and Kubara rivers, which are longer than 5 km. The basin area is 199 km2, where forest covers 52%, agricultural field covers 8% (paddy 7.7%), and urban area covers 37%. The catchment area and the proportion of each land use (forest, paddy fields, other agricultural areas, and urban) was calculated from data and land use statistics obtained from the Geospatial Information Authority of Japan and the National Land Information Division, respectively, using ArcGIS V10.1 (ESRI). The monthly mean air temperature and precipitation at the Fukuoka meteorological weather station located in this basin are shown in Table 1 for the years 2012 to 2013. The lowest temperature was 2.9 °C in January 2013, and the highest was 33.6 °C in August 2012. The population density in this basin was 1316 people km−2 in 2013 (Fukuoka Prefecture, http://www.pref.fukuoka.lg.jp/dataweb/jinko-2014y.html). Upland forests in the Tatara River Basin exhibit N-saturation [10]. The land use of the upstream areas is largely forestry, and the middle and downstream areas are largely agricultural and urban areas (Figure 1b). More than 90% of the basin’s agricultural area is comprised of paddy fields in this basin (Table 2). The location of the Tatara-Gawa wastewater treatment plant is shown in Figure 1b,c. Sewage water from urban areas in the Tatara River Basin—including from the Ino, Sue, and Umi rivers—was collected at the treatment plant, and the treated water was discharged into the lower reaches, further downstream than Ino5. The flow rate of each river tended to decrease toward the downstream because of water supply for the local population. The mean annual river flow rate of the Tatara River at Amouzu-Bashi (Ino5) was 3.3 m3/s and that of the Umi River at Befu Katamine (near Umi4) was 1.0 m3/s in 2013 (Fukuoka City Government 2015).

2.2. Water Sampling and Chemical Analysis

The Tatara River Basin consists of five main rivers. We chose three rivers (the Ino, Sue, and Umi rivers) for this study (Figure 1b,c). Stream water was collected from the upstream to the downstream of three rivers across a range of land uses, including forests, agricultural, and urban areas (Figure 1b,c; Table 2).
At each sampling site, the near-surface water at the center of the stream channel was collected during non-precipitation periods, which were at least four days after a rainfall event (>10 mm for the total precipitation). The sampling was undertaken four times, once a season over a given year, in summer (6 August) and autumn (9 November) of 2012, and winter (29 January) (except Sue4) and spring (14 April; except Sue4 and Umi4) of 2013. Some samples were missing because of bad weather. According to monitoring data in the upstream of this basin since 2009, NO3 concentrations remain high in recent year (Chiwa M., personal communication). Therefore, the situation that upland forest is N-saturated has not changed in recent years.
Total N (TN), NO3, nitrite (NO2) and ammonium (NH4+), as well as the δ15N and δ18O values of NO3 were analyzed in all collected samples. TN was determined using unfiltered samples. To analyze NO3, NO2, and NH4+, as well as the δ15N and δ18O values of NO3, the collected samples were filtered using a 0.45-μm membrane filter (DISMIC-25CS; Advantec, Tokyo, Japan). Unfiltered (for TN determination) and filtered samples (for NO3, NO2, and NH4+ determination) were stored in the dark at 4 °C, while aliquots of the filtered samples (for measuring δ15N and δ18O values of NO3) were stored in the dark at −20 °C until chemical analyses were carried out.
NO3, NO2, and NH4+ concentrations were determined using an ion chromatograph (DX-120; Dionex, Osaka, Japan). NO2 and NH4+ concentrations in our samples were below the detection limits (DLs: 0.15 μmol L−1 for NO2 and 0.25 μmol L−1 for NH4+). For TN analysis, water samples were digested using an alkaline solution of potassium peroxydisulfate (NaOH-K2S2O8), and the TN was then measured using ultraviolet absorptiometry (UV mini-1240, Shimadzu, Kyoto, Japan). Organic nitrogen (Org-N) concentration was calculated by subtracting the NO3 concentration from the TN concentration. The δ15N and δ18O values of NO3 were analyzed using the microbial denitrified method [21,22]. NO3 in a sample was completely converted to nitrous oxide (N2O) by denitrifying bacteria that lack N2O-reductase activity. The total amount of NO2 of each sample was adjusted so as to have larger than 30 nmol-N before analysis. The analysis of samples was performed using a stable isotope mass spectrometer (Delta Plus XP, Thermo Fisher Scientific). Isotopic data of NO3 were calibrated using IAEA-NO3, USGS34, USGS35 [23].
The N and O stable isotope ratios are expressed in the following generally-accepted delta notation as δ values
δsample = (RsampleRstandard)/Rstandard
where R is the 15N/14N or 18O/16O ratio of the NO3 of a sample and the international standard (atmospheric N2 for nitrogen and the Vienna Standard Mean Ocean Water (VSMOW) for oxygen, respectively).

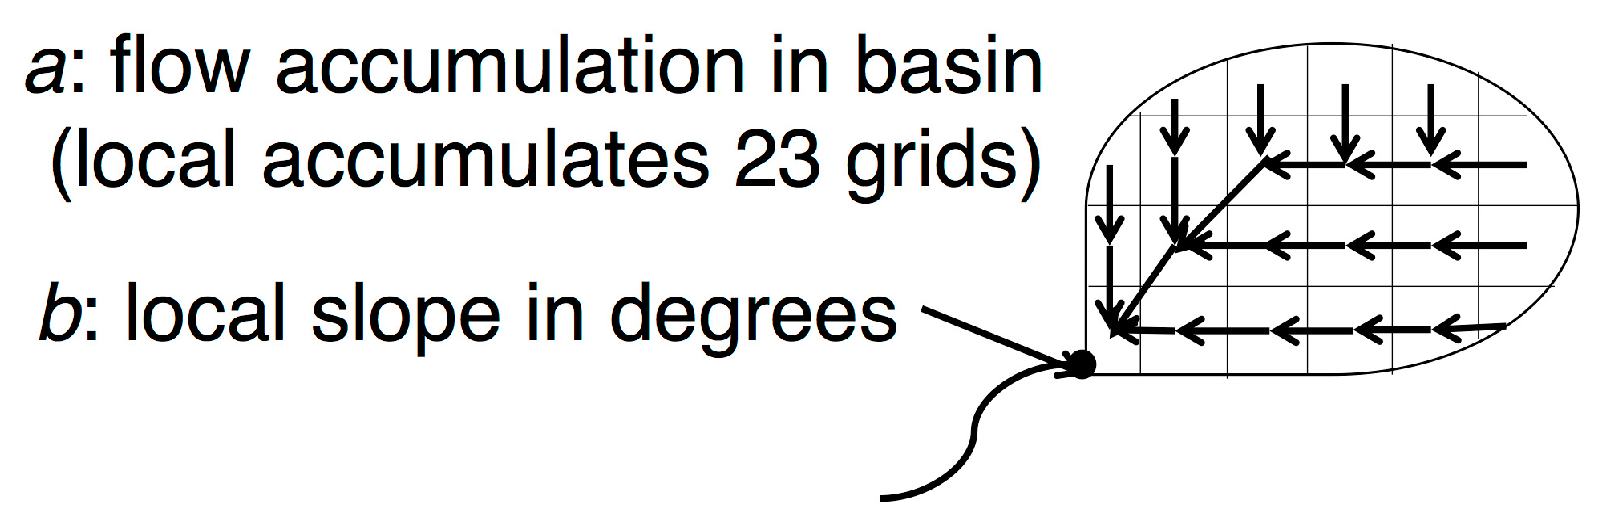
2.3. Geographical Analysis and Topographic Index

The drainage area and proportion of land-use at each sampling point were calculated using the digital elevation model (DEM) of 20 × 20 m resolution (Geospatial Information Authority of Japan), and land use data with 100 × 100 m resolution polygon data (National Land Information Division) using ArcGIS (version 10.1). The maximum resolution enough to analyze the entire watershed is 20 m for digital elevation model and 100 m for land use data.
To evaluate the land use as urban area in relation to topography, the topographic index (TI) was used as an index of the flatness and concavity of the catchment area in question. Topography is one of the most important factors affecting land use as urban area. Other factors affecting the percentage of urban area could be the location of flat area that should be analyzed. However, topographic characteristics can be analyzed quantitatively based on geographic information system (GIS) data in a whole basin. TI is commonly used to quantify topographic control on hydrological processes and was calculated from a DEM of a 20 × 20 m resolution in the watershed using ArcGIS (Figure 2)
TI = ln (a/tan b)
where a is the specific contributing area (grids) and b is the local slope in degrees [24].
The TI value was calculated for every cell at a 20 × 20 m resolution. Thus, the statistics for TI values were calculated for each catchment. Then, average TI values for all cells of the drainage area at the sampling point were calculated at each sampling site. To evaluate changes in land use between upstream and downstream sampling points, the local TI value (LTI) was calculated for the area obtained by subtracting the drainage area of the upstream sampling site from the drainage area of the downstream sampling site.

2.4. Data Analysis

The regression equation between NO3-N concentration and the percentage of urban area was calculated using the non-linear regression curve. This analysis is advantageous for providing insight into denitrification and assimilation in downstream area in mixed land use watershed. Spearman’s rank correlation coefficient (r) was used to examine the relationships between the logarithm NO3 concentration and δ15N and the relationships between the local urban area (LUA) and LTI at each river to evaluate denitrification in downstream in mixed land use area. All statistical analyses were carried out using an open source statistical programing language of R Version 3.3.3.

3. Results and Discussion
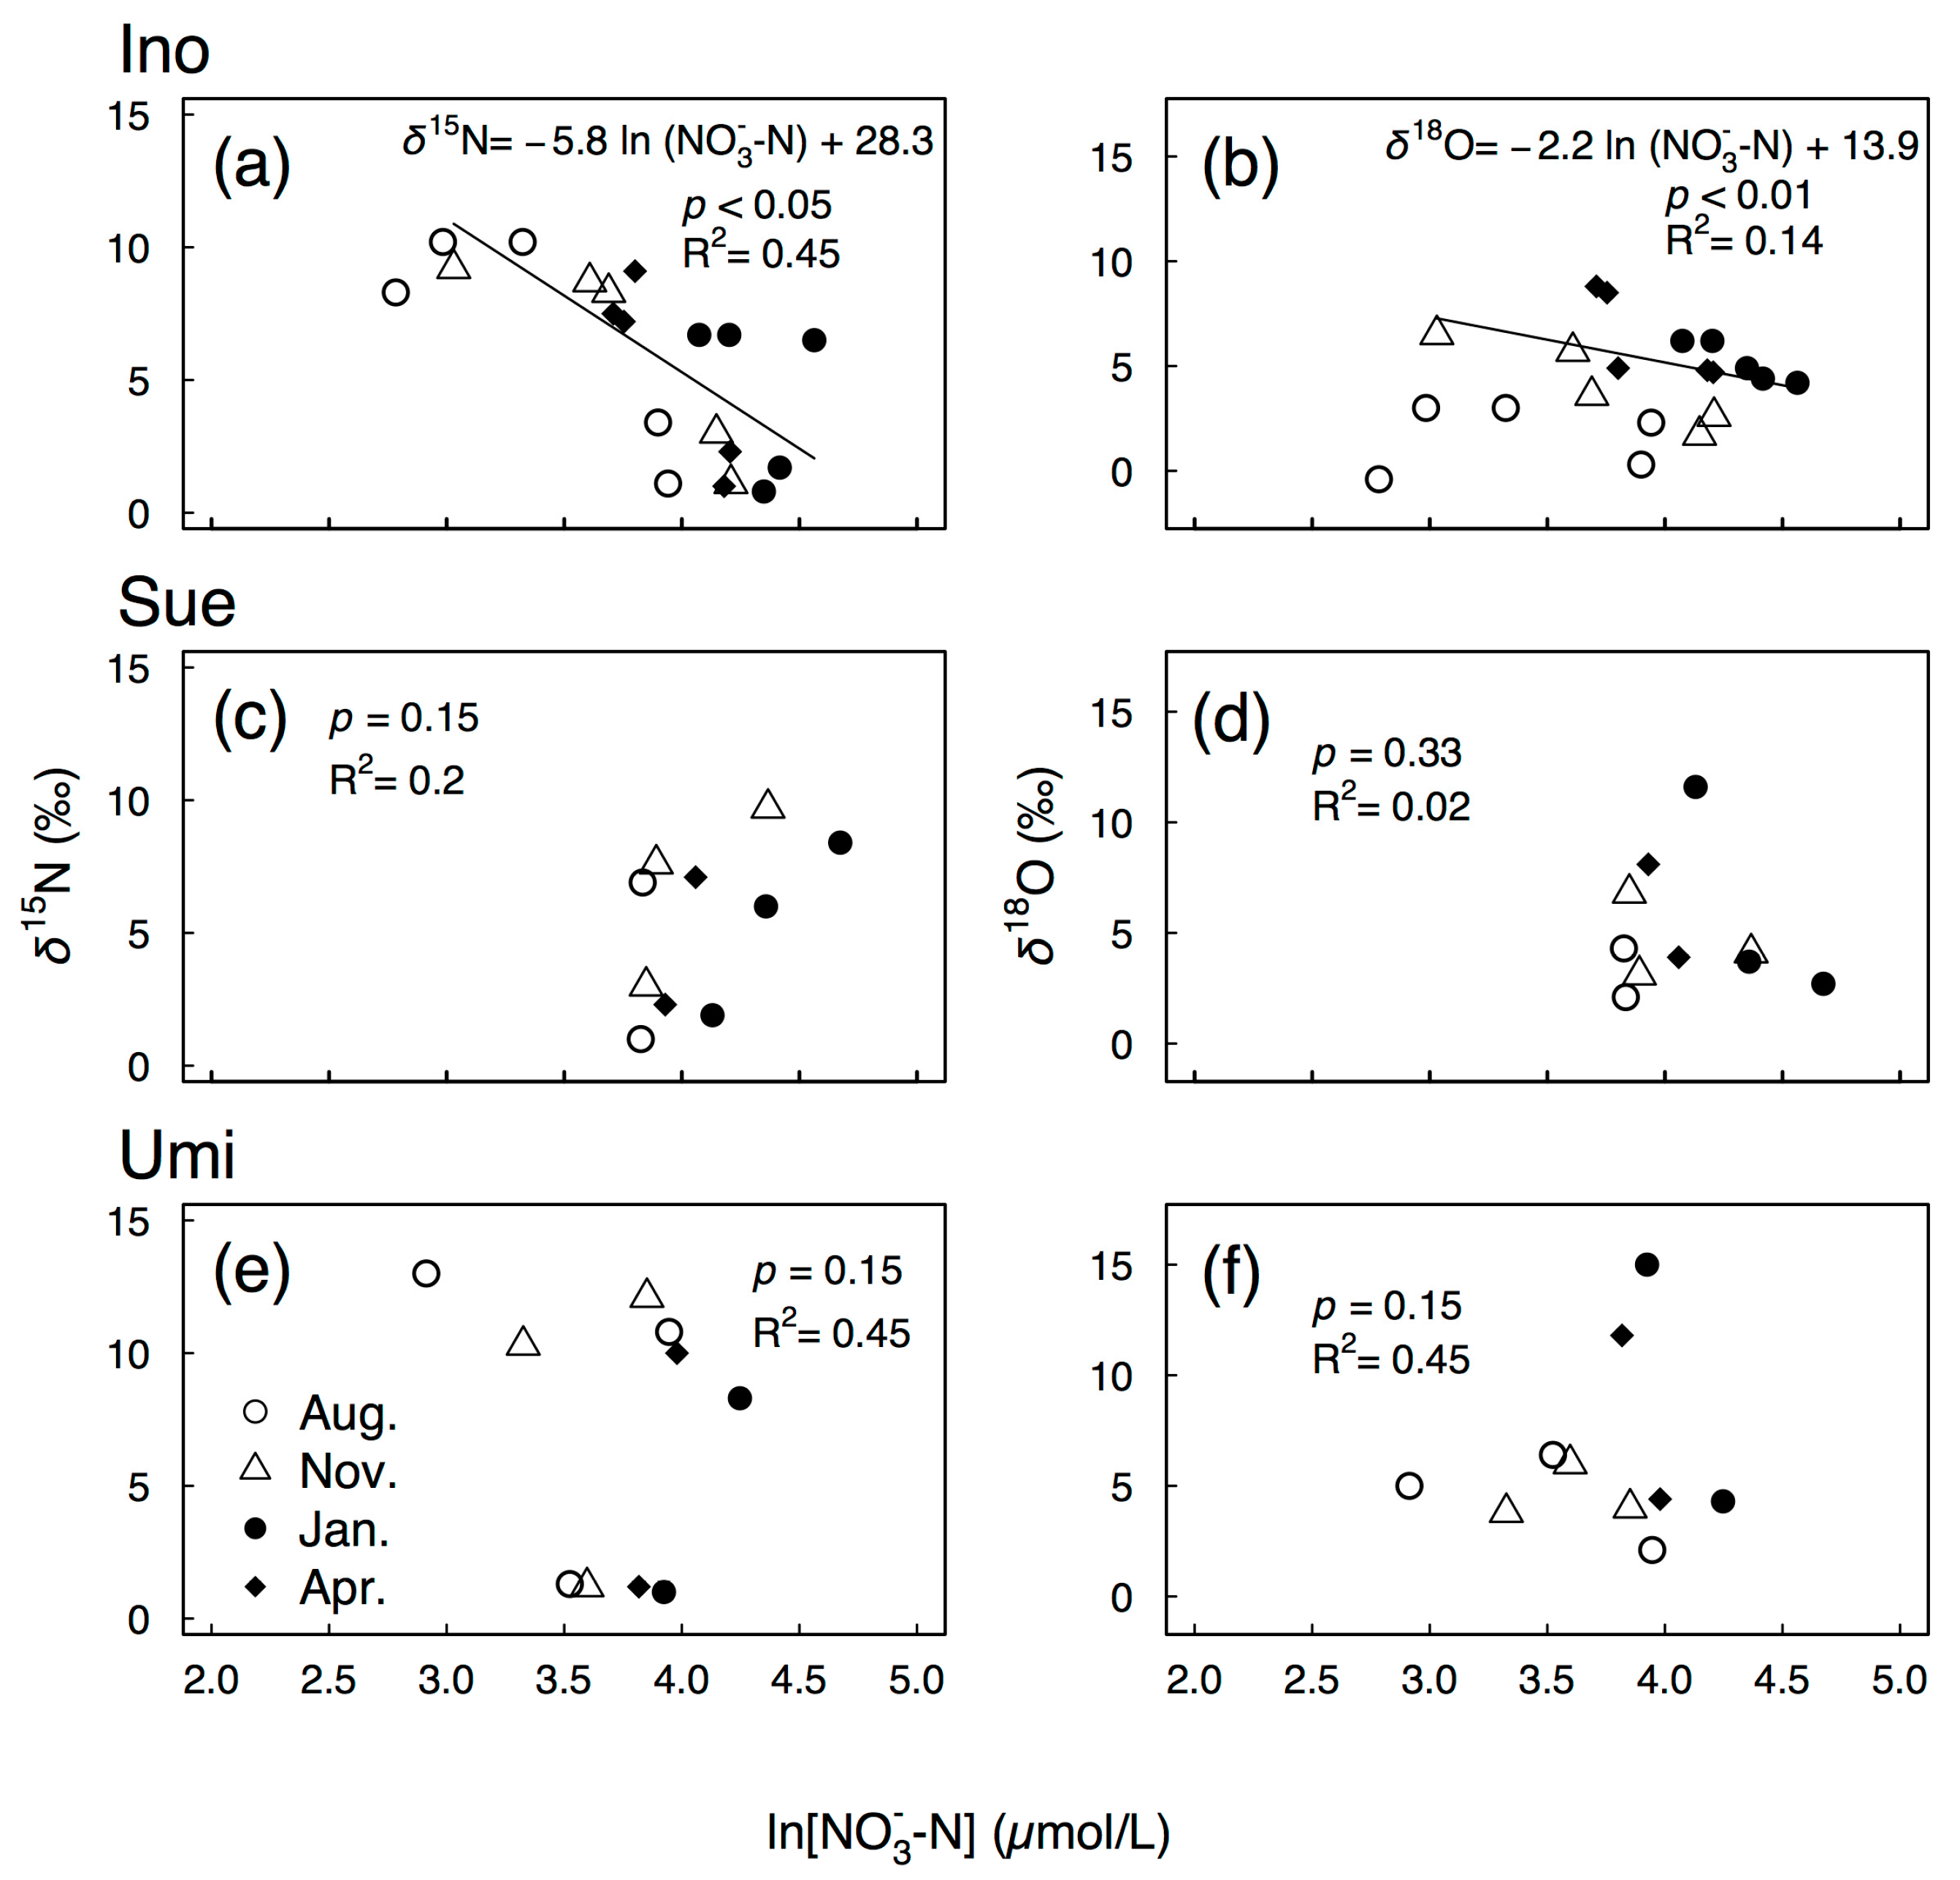
3.1. Changes in the NO3-N Concentration, δ15N and δ18O Upstream and Downstream

NO3-N concentrations in the upstream waters of Ino1, Sue1, and Umi1, where there are forests (Figure 1b), were moderately high (41 to 65 μmol L−1) and showed relatively small variation regardless of the sampling time (Figure 3a,c). High levels of NO3 leaching from forests have been observed in urban- or suburban-forested watersheds compared with rural-forested watersheds [10,25,26], and regional-scale spatial patterns of higher atmospheric N deposition were observed in urban- or suburban-forested areas [27,28,29]. In a previous study, river basins included suburban forests, and atmospheric N deposition was moderately high (16 kg N ha−1 year−1 in these areas [30]), which is above the threshold value that could potentially cause N leaching from a forested watershed. Therefore, in the present study, upland forests in the river basins were influential NPSs of N for downstream areas.
In the following analyses, we concentrated on the topics of the regional N dynamics rather than the seasonal changes. Although it is difficult to separate the seasonal effects, datasets are enough to test the hypothesis that NO3 from upland N-saturation in the forest is assimilated or denitrified in the downstream area.
In many cases, agricultural and urban areas are the large downstream N alternative sources [31]. However, the agricultural area in this basin consists mostly of paddy fields that can be a sink for NO3 because of net denitrification losses [32,33]. We examined the effects of paddy fields on NO3 concentration and isotopic signatures. However, the effects of paddy fields cannot be detected, probably because of the small percentage of paddy area in this catchment (Table 2). Therefore, the N source in the downstream could be mainly from the urban area, rather than agriculture, and we used the percentage of urban area as an index of the downstream N sources. NO3 in the downstream could be mixed with N sources from the upstream N-saturated forest and from the downstream urban areas.
Significant positive increases in organic N (Org-N) concentrations with the percentages of urban areas (Figure 3d–f) support the idea that the urban activities are important sources of N pollutants, because Org-N is considered as a pollution source from urban areas [34,35]. However, the NO3-N concentration did not increase significantly with the increasing percentages of urban areas, corresponding to the downstream (no increased type; Figure 3b,c). Ohte et al. [13] showed that dual NO3 isotope data are a powerful tool for tracing anthropogenic sources in most agricultural regions in Japan, and increased δ15N values and decreased δ18O values with increasing percentages of urban areas in the Sue and Umi rivers (Figure 3h,i,k,l) support the additional sources of anthropogenic NO3 downstream from urban areas. Previous studies reported higher values of δ15N in NO3 from sewage [36] and lower values of δ18O in stream NO3, where NO3 was anthropogenically polluted in mixed land use river basins in Japan [13].
The Ino River exhibited rather significant decreases in stream NO3-N concentrations with the percentage of urban area (decreased type; Figure 3a), despite the fact that the percentage of urban areas increased from the upstream to the downstream in the Ino River, as well as the Sue and Umi rivers (Figure 1b). An increase in Org-N concentrations with the percentage of urban area (Figure 3d) also suggests the additional N pollutants from urban areas in the Ino River. The decrease in NO3-N concentrations from the upstream to the downstream could be caused by the predominance of denitrification and assimilation over N pollutants in the downstream of the Ino River that should be tested further using isotope analysis, as shown later. It should be also noted that the contribution of groundwater to the rivers may decrease the downstream NO3-N concentration though the dilution effect. However, the reported inorganic N (NO3-N + NO2-N) concentrations of groundwater collected at the two sites in the downstream Ino River watershed were 79 and 93 μmol L−1 (Fukuoka City Government 2013), which was not low enough to dilute the NO3 concentration in the stream water.
The presence of the denitrification and assimilation of N pollutants from urban areas of the Ino River is supported by the significance of the enrichment values of δ15N and δ18O. The enrichment values indicate the degree of denitrification [14] and were obtained from the slope of the relationships between NO3-N concentration and δ15N and δ18O. The enrichment value of εN in the Ino River (εN = −5.8‰, Figure 4a) was approximately double the εO values (εO = −2.2‰, Figure 4b), which was consistent with many studies [37,38]. The values of δ15N and δ18O suggest the effects of denitrification [14,39]. The lower percentage of urban area in the downstream of the Ino River than the Sue and Umi may lead to a clear relationship between NO3-N concentration and δ15N and δ18O in Ino. Therefore, our hypothesis that NO3-N from upland N-saturated forest is assimilated or denitrified in downstream areas could be supported for the Ino River, where the percentage of urban area is low. Previous study showed that N-saturated forest is a large enough NPS of N to impact downstream water quality [10]. This study advanced our knowledge for dynamics of N pollution in mixed land use watershed that nitrate exported from the N-saturated forest is denitrified and/or assimilated in the downstream.
The reason for the lower values of δ18O in summer compared to other seasons in the Ino River (Figure 4b) could be caused by inflow of nitrification-derived NO3, as shown in the lower org-N concentrations in the summer than in other seasons in the Ino River (Figure 3d), as well as in the Sue and Umi rivers (Figure 3e,f).

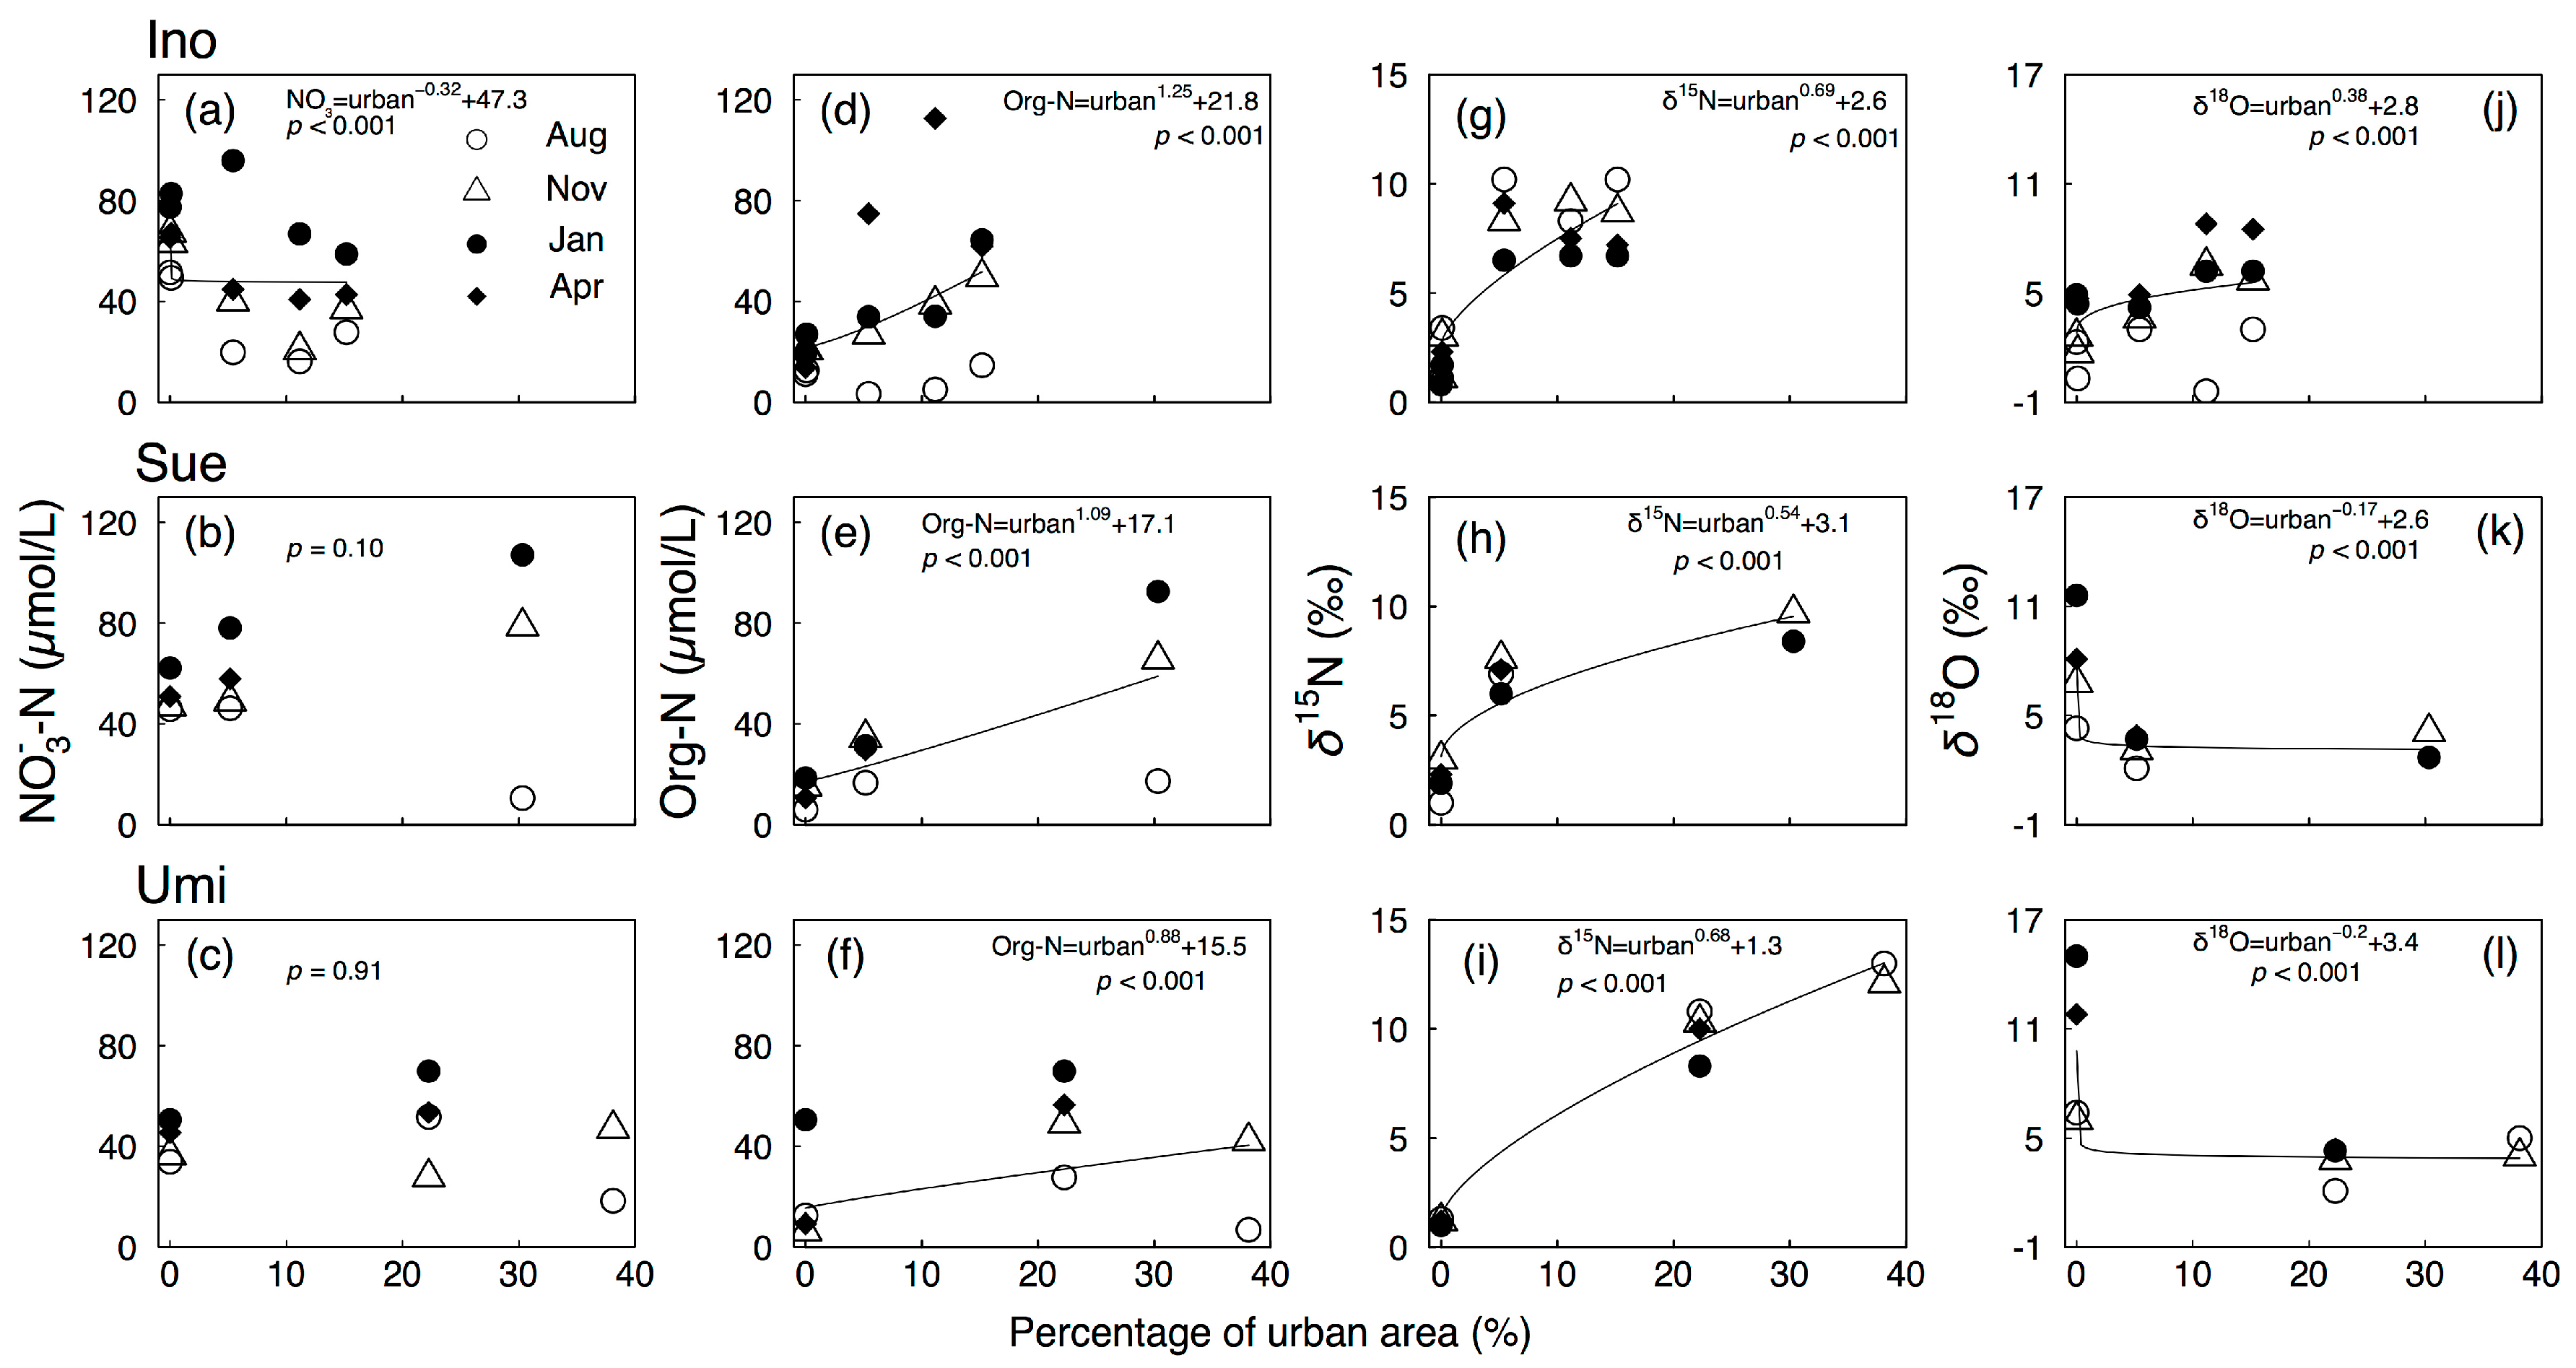
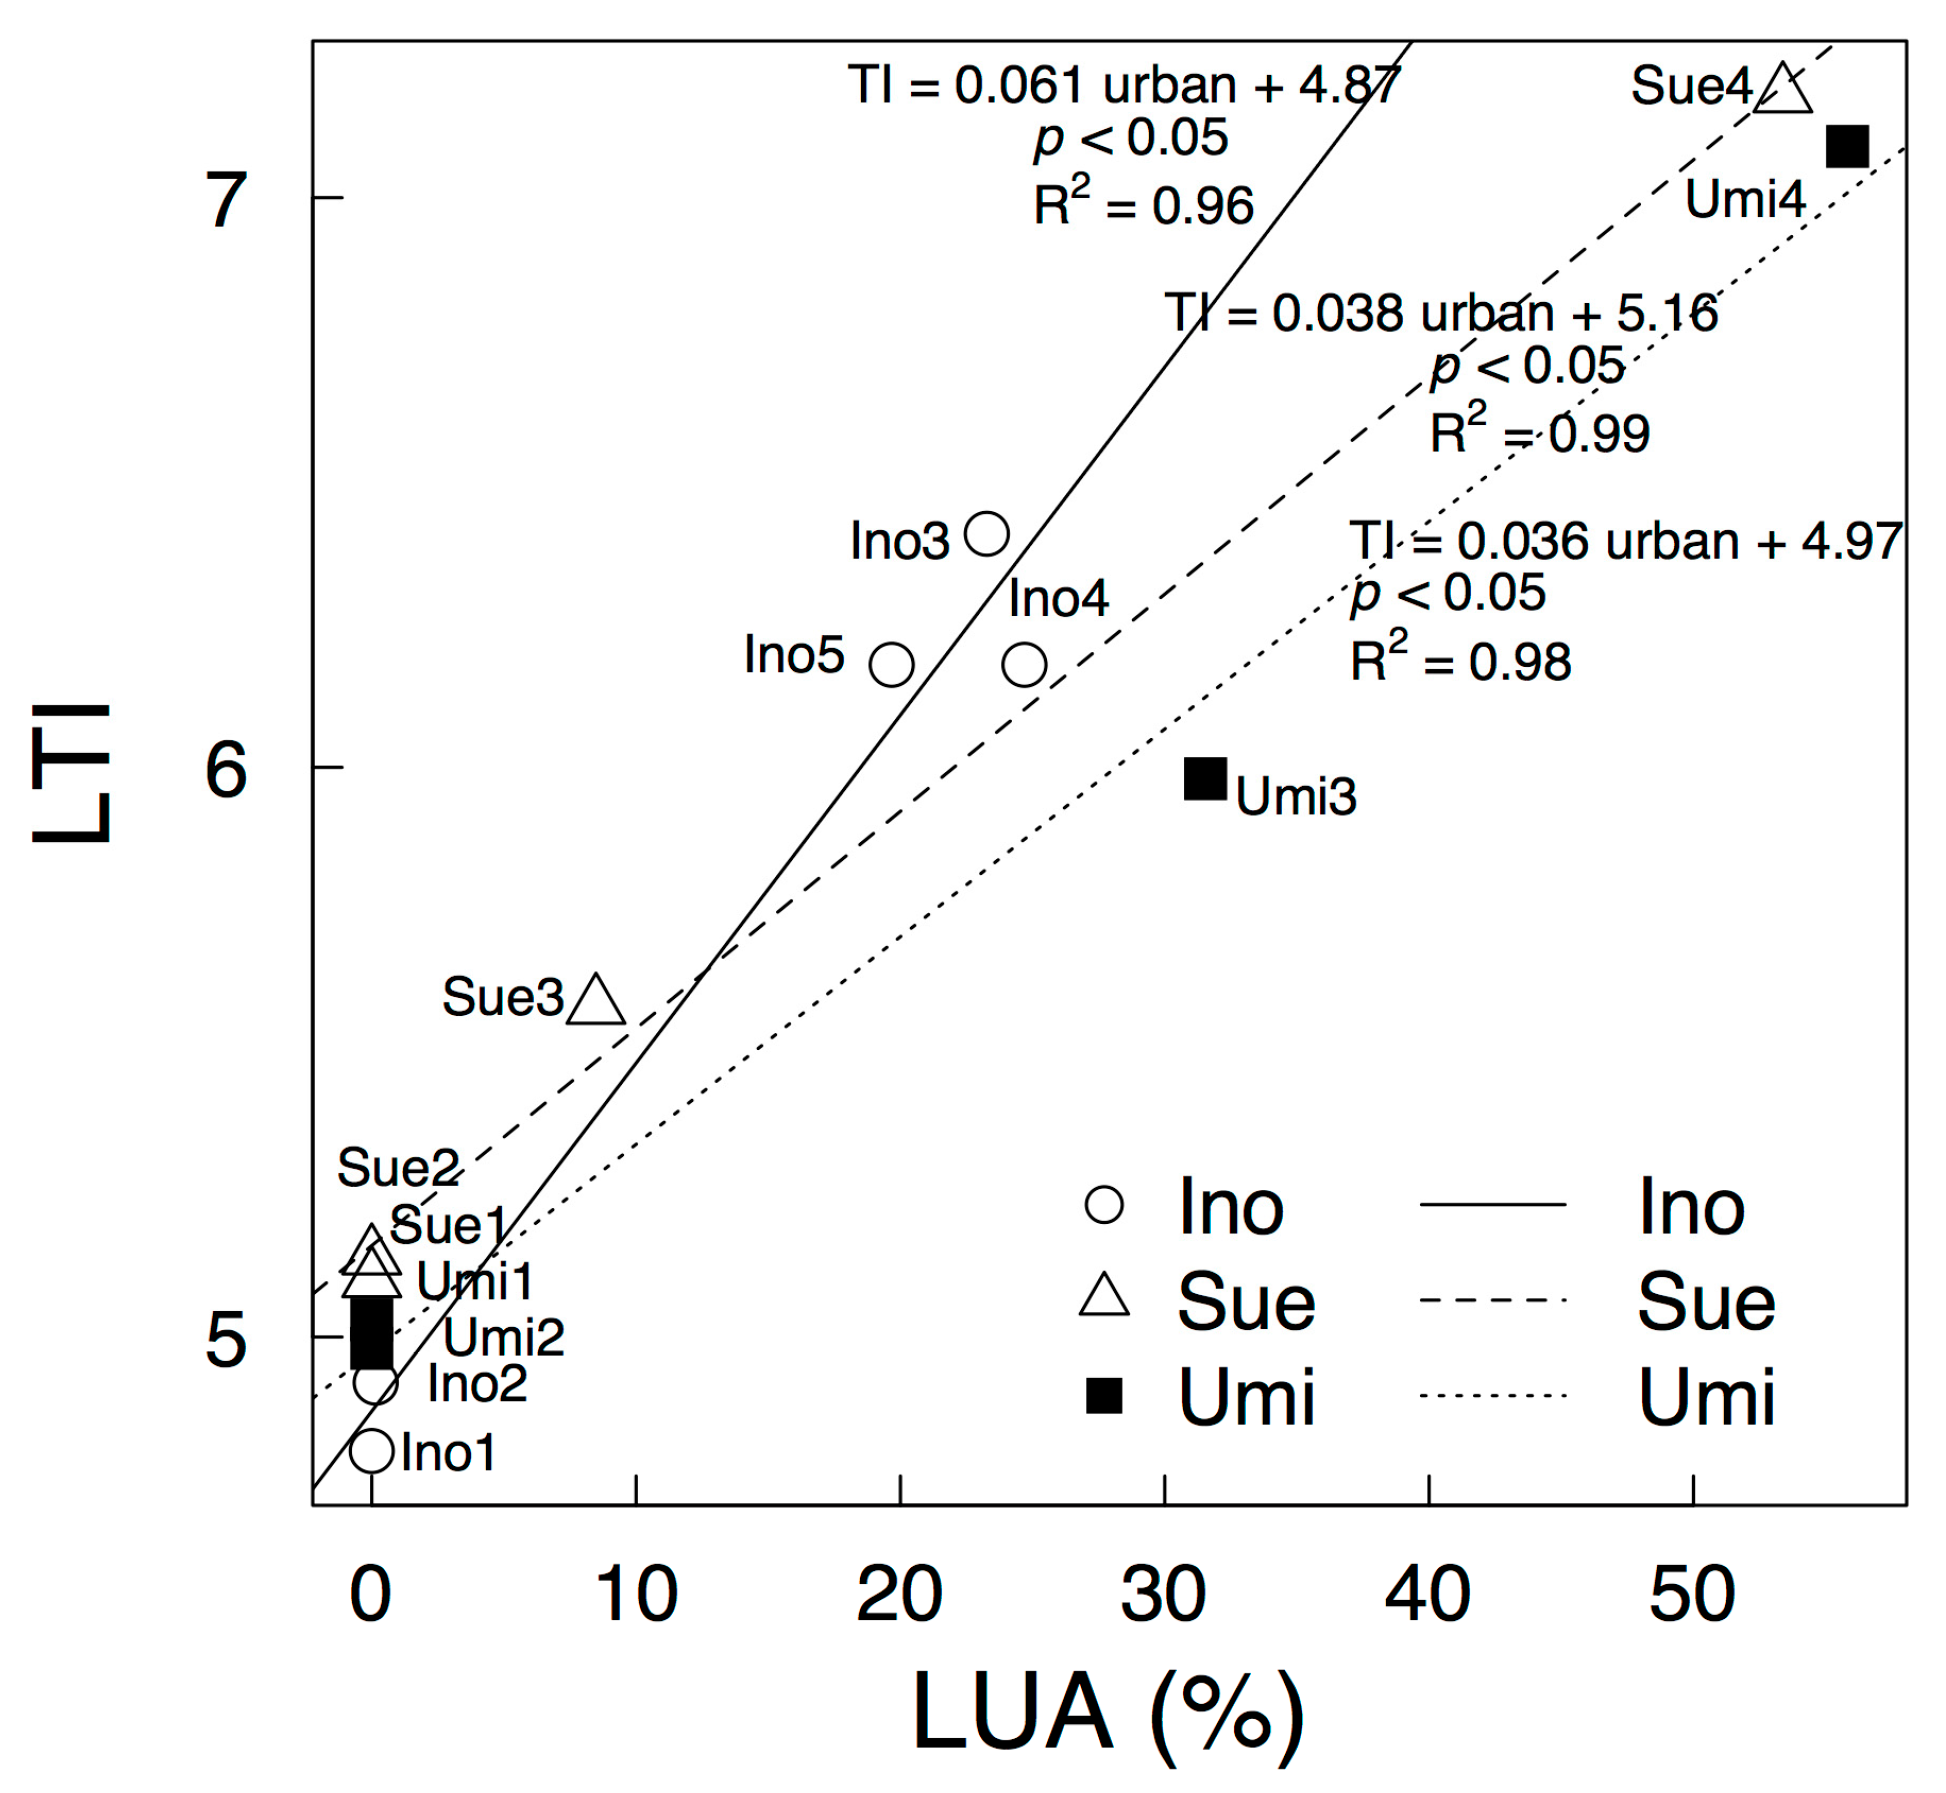
3.2. Use of the Topographic Index to Explain the Lower Percentage of Urban Area in Ino

We conducted topographic analysis to relate the lower percentage of urban area in Ino. The local urban area (LUA) is the percentage of urban area in the drainage area between the upstream sampling site and the downstream sampling site. The percentage of LUA could be an index of NO3 loading from urban areas between the upstream and downstream sampling sites, and the increase in the LUA may indicate the potential increase in the NO3 loading. The LTI could be an index of the flatness of the object area. Because the values of LUA and LTI at each sampling site were calculated from large numerous of cell grid (30–6740 and 750–168,500 (minimum–maximum) for LUA and LTI, respectively), the calculated value at each sampling site is reliable.
Both the values of LUA and LTI tended to increase toward downstream areas of the three rivers (Figure 5), suggesting that urban areas favor flatter areas rather than steeper areas. The LUA of the downstream in the Ino River was lower than those in the Sue and Umi rivers, and it could be the result of the lower LTI in the downstream of the Ino River compared to the others. Other factors than LTI affecting percentage of urban area could be the location of flat area. However, our analysis is based on a relatively small-scale watershed (200 km2) and the effect of the location of flat area would be small.
Previous studies used TI to explain the topographic controls on denitrification in upland forests [40,41,42]. TI is an indicative of the wetter point relative to other points and therefore the degree of NO3 removal rates including denitrification and assimilation. Therefore, further investigation is required to analyze topographic dependence on denitrification and assimilation in urban areas. In addition, the loading and nitrogen reducing process is ambiguous in urban area and therefore modeling evaluation using fuzzy pattern-recognition may be useful [43,44,45,46].

4. Conclusions

The isotope tracer technique is useful for assessing nitrogen pollution in rivers. The stable isotope composition of riverine NO3 is a more detailed tracer to estimate nitrogen transport and transformation dynamics in catchment and river systems. It is known that nitrogen saturated forest has large influence on downstream nitrogen pollution. Our study evaluated the NO3 removal process in a downstream area using δ15N and δ18O values in NO3 and TI values. Although pollutant sources and removal processes in the downstream mixed land use river basins represent complex phenomena and therefore their quantitative analysis is difficult, this study demonstrated that NO3 leaching from upland N-saturated forests was substantially assimilated or denitrified in downstream areas. The riverine distribution of δ15N and δ18O of NO3 is a useful index for detecting the influence of land use and topography and providing information for evaluating the influences of land use change. However, further investigation is required to analyze topographic dependence on denitrification and assimilation in urban areas.

Acknowledgments

The cost of publication was supported in part by a Global COE Program from Kyushu University. This study was partly financially supported by Grants-in-Aid for Scientific Research (17H03833). We thank Tetsuji Ota (Kyushu University) and the members of the Tayasu laboratories (Center for Ecological Research, Kyoto University) who helped with the experiments. We also thank the members of the University of Kyushu University for their support in this study.

Author Contributions

Ken’ichi Shinozuka conducted this research as part of his Ph.D., conceived of and designed this study, acquired the samples, analyzed and interpreted the data, and wrote the paper. Ichiro Tayasu and Chikage Yoshimizu supported the N and O isotope analysis of NO3. Masaaki Chiwa analyzed and interpreted the data and wrote the paper. Kyoichi Otsuki and Atsushi Kume supervised the work and helped with improving the manuscript.

Conflicts of Interest

The authors declare no conflict of interest.

References

  1. Carpenter, S.R.; Chisholm, S.W.; Krebs, C.J.; Schindler, D.W.; Wright, R.F. Ecosystem experiments. Science 1995, 269, 324–327. [Google Scholar] [CrossRef] [PubMed]
  2. Swaney, D.P.; Humborg, C.; Emeis, K.; Kannen, A.; Silvert, W.; Tett, P.; Pastres, R.; Solidoro, C.; Yamamuro, M.; Hénocque, Y.; et al. Five critical questions of scale for the coastal zone. Estuar. Coast. Shelf Sci. 2012, 96, 9–21. [Google Scholar] [CrossRef]
  3. Carpenter, S.R.; Caraco, N.F.; Correll, D.L.; Howarth, R.W.; Sharpley, A.N.; Smith, V.H. Nonpoint pollution of surface waters with phosphorus and nitrogen. Ecol. Appl. 1998, 8, 559–568. [Google Scholar] [CrossRef]
  4. Fennessy, M.S.; Cronk, J.K. The effectiveness and restoration potential of riparian ecotones for the management of nonpoint source pollution, particularly nitrate. Crit. Rev. Environ. Sci. Technol. 1997, 27, 285–317. [Google Scholar] [CrossRef]
  5. Kaushal, S.S.; Groffman, P.M.; Band, L.E.; Shields, C.A.; Morgan, R.P.; Palmer, M.A.; Belt, K.T.; Swan, C.M.; Findlay, S.E.G.; Fisher, G.T. Interaction between urbanization and climate variability amplifies watershed nitrate export in Maryland. Environ. Sci. Technol. 2008, 42, 5872–5878. [Google Scholar] [CrossRef] [PubMed]
  6. Howarth, R.W.; Billen, G.; Swaney, D.; Townsend, A.; Jaworski, N.; Lajtha, K.; Downing, J.A.; Elmgren, R.; Caraco, N.; Jordan, T.; et al. Regional nitrogen budgets and riverine N & P fluxes for the drainages to the North Atlantic Ocean: Natural and human influences. Biogeochemistry 1996, 35, 75–139. [Google Scholar] [CrossRef]
  7. Alvarez-Cobelas, M.; Angeler, D.G.; Sánchez-Carrillo, S. Export of nitrogen from catchments: A worldwide analysis. Environ. Pollut. 2008, 156, 261–269. [Google Scholar] [CrossRef] [PubMed]
  8. Aber, J.D.; Nadelhoffer, K.J.; Steudler, P.; Melillo, J.M. Nitrogen saturation in northern forest ecosystems: Excess nitrogen from fossil fuel combustion may stress the biosphere. BioScience 1989, 39, 378–386. [Google Scholar] [CrossRef]
  9. Mitchell, M.J.; Iwatsubo, G.; Ohrui, K.; Nakagawa, Y. Nitrogen saturation in Japanese forests: An evaluationn. For. Ecol. Manag. 1997, 97, 39–51. [Google Scholar] [CrossRef]
  10. Chiwa, M.; Onikura, N.; Ide, J.; Kume, A. Impact of N-saturated upland forests on downstream N pollution in the Tatara River Basin, Japan. Ecosystems 2012, 15, 230–241. [Google Scholar] [CrossRef]
  11. Sugimoto, R.; Tsuboi, T. Seasonal and annual fluxes of atmospheric nitrogen deposition and riverine nitrogen export in two adjacent contrasting rivers in central Japan facing the Sea of Japan. J. Hydrol. Reg. Stud. 2015. [Google Scholar] [CrossRef]
  12. Allan, J.D.; Castillo, M.M. Stream Ecology: Structure and Function of Running Waters; Springer: Dordrecht, The Netherlands, 2007; 436 p. [Google Scholar]
  13. Ohte, N.; Tayasu, I.; Kohzu, A.; Yoshimizu, C.; Osaka, K.; Makabe, A.; Koba, K.; Yoshida, N.; Nagata, T. Spatial distribution of nitrate sources of rivers in the Lake Biwa watershed, Japan: Controlling factors revealed by nitrogen and oxygen isotope values. Water Resour. Res. 2010, 46, W07505. [Google Scholar] [CrossRef]
  14. Kendall, C. Tracing Nitrogen Sources and Cycling in Catchments. In Isotope Tracers in Catchment Hydrology; Kendall, C., McDonnell, J.J., Eds.; Elsevier Science: Amsterdam, The Netherlands, 1998; pp. 517–576. [Google Scholar]
  15. Rock, L.; Mayer, B. Isotopic assessment of sources of surface water nitrate within the Oldman River Basin, Southern Alberta, Canada. Water Air Soil Pollut. Focus 2004, 4, 545–562. [Google Scholar] [CrossRef]
  16. Nestler, A.; Berglund, M.; Accoe, F.; Duta, S.; Xue, D.; Boeckx, P.; Taylor, P. Isotopes for improved management of nitrate pollution in aqueous resources: Review of surface water field studies. Environ. Sci. Pollut. Res. 2011, 18, 519–533. [Google Scholar] [CrossRef] [PubMed]
  17. Townsend-Small, A.; McCarthy, M.J.; Brandes, J.A.; Yang, L.; Zhang, L.; Gardner, W.S. Stable isotopic composition of nitrate in Lake Taihu, China, and major inflow rivers. Hydrobiologia 2007, 581, 135–140. [Google Scholar] [CrossRef]
  18. Miyajima, T.; Yoshimizu, C.; Tsuboi, Y.; Tanaka, Y.; Tayasu, I.; Nagata, T.; Koike, I. Longitudinal distribution of nitrate δ15N and δ18O in two contrasting tropical rivers: Implications for instream nitrogen cycling. Biogeochemistry 2009, 95, 243–260. [Google Scholar] [CrossRef]
  19. Granger, J.; Sigman, D.M.; Needoba, J.A.; Harrison, P.J. Coupled nitrogen and oxygen isotope fractionation of nitrate during assimilation by cultures of marine phytoplankton. Limnol. Oceanogr. 2004, 49, 1763–1773. [Google Scholar] [CrossRef]
  20. Deutsch, B.; Voss, M.; Fischer, H. Nitrogen transformation processes in the Elbe River: Distinguishing between assimilation and denitrification by means of stable isotope ratios in nitrate. Aquat. Sci. 2009, 71, 228–237. [Google Scholar] [CrossRef]
  21. Sigman, D.M.; Casciotti, K.L.; Andreani, M.; Barford, C.; Galanter, M.; Böhlke, J.K. A bacterial method for the nitrogen isotopic analysis of nitrate in seawater and freshwater. Anal. Chem. 2001, 73, 4145–4153. [Google Scholar] [CrossRef] [PubMed]
  22. Casciotti, K.L.; Sigman, D.M.; Hastings, M.G.; Böhlke, J.K.; Hilkert, A. Measurement of the oxygen isotopic composition of nitrate in seawater and freshwater using the denitrifier method. Anal. Chem. 2002, 74, 4905–4912. [Google Scholar] [CrossRef] [PubMed]
  23. Böhlke, J.K.; Mroczkowski, S.J.; Coplen, T.B. Oxygen isotopes in nitrate: New reference materials for 18O:17O:16O measurements and observations on nitrate-water equilibration. Rapid Commun. Mass Spectrom. 2003, 17, 1835–1846. [Google Scholar] [CrossRef] [PubMed]
  24. Beven, K.J.; Kirkby, M.J. A physically-based, variable contributing area model of basin hydrology/Un modèle à base physique de zone d’appel variable de l’hydrologie du bassin versant. Hydrol. Sci. Bull. 1979, 24, 43–69. [Google Scholar] [CrossRef]
  25. Shibata, H.; Kuraji, K.; Toda, H.; Sasa, K. Regional comparison of nitrogen export to Japanese forest streams. Sci. World J. 2001, 1, 572–580. [Google Scholar] [CrossRef] [PubMed]
  26. Zhang, Z.; Fukushima, T.; Shi, P.; Tao, F.; Onda, Y.; Gomi, T.; Mizugaki, S.; Asano, Y.; Kosugi, K.; Hiramatsu, S.; et al. Baseflow concentrations of nitrogen and phosphorus in forested headwaters in Japan. Sci. Total Environ. 2008, 402, 113–122. [Google Scholar] [CrossRef] [PubMed]
  27. Itoh, Y.; Miura, S.; Kato, M.; Yoshinaga, S. Regional distribution of nitrate concentrations in the stream water of forested watersheds in the Kanto and Chubu Districts. J. Jpn. For. Soc. 2004, 86, 275–278. [Google Scholar] [CrossRef]
  28. Yoshinaga, S.; Itoh, Y.; Aizawa, S.; Tsurita, T. Variation in nitrate concentrations in streamwater of forested watersheds in the northeastern Kanto plain as a function of distance from the Tokyo Metropolitan area. J. Jpn. For. Soc. 2012, 94, 84–91. [Google Scholar] [CrossRef]
  29. Chiwa, M.; Enoki, T.; Higashi, N.; Kumagai, T.; Otsuki, K. The increased contribution of atmospheric nitrogen deposition to nitrogen cycling in a rural forested area of Kyushu, Japan. Water Air Soil Pollut. 2013, 224, 1763. [Google Scholar] [CrossRef]
  30. Chiwa, M.; Maruno, R.; Ide, J.; Miyano, T.; Higashi, N.; Otsuki, K. Role of stormflow in reducing N retention in a suburban forested watershed, western Japan. J. Geophys. Res. Biogeosci. 2010, 115, G02004. [Google Scholar] [CrossRef]
  31. Díaz, F.J.; O’Geen, A.T.; Dahlgren, R.A. Agricultural pollutant removal by constructed wetlands: Implications for water management and design. Agric. Water Manag. 2012, 104, 171–183. [Google Scholar] [CrossRef]
  32. Maruyama, T.; Noto, F.; Murashima, K.; Hashimoto, I.; Kitada, K. Analysis of the nitrogen pollution load potential from farmland in the Tedori River alluvial fan areas in Japan. Paddy Water Environ. 2010, 8, 293–300. [Google Scholar] [CrossRef]
  33. Shinozuka, K.; Chiwa, M.; Nakamura, K.; Nagao, S.; Kume, A. Stream water nitrogen eutrophication during non-irrigated periods in a paddy-dominated agricultural basin in a snowfall area in Japan. Water Air Soil Pollut. 2016, 227, 219. [Google Scholar] [CrossRef]
  34. Kroeger, K.D.; Cole, M.L.; Valiela, I. Groundwater-transported dissolved organic nitrogen exports from coastal watersheds. Limnol. Oceanogr. 2006, 51, 2248–2261. [Google Scholar] [CrossRef]
  35. Stanley, E.H.; Maxted, J.T. Changes in the dissolved nitrogen pool across land cover gradients in wisconsin streams. Ecol. Appl. 2008, 18, 1579–1590. [Google Scholar] [CrossRef] [PubMed]
  36. Kendall, C.; Elliott, E.M.; Wankel, S.D. Tracing anthropogenic inputs of nitrogen to ecosystems. In Stable Isotopes in Ecology and Environmental Science; Michener, R.H., Lajtha, K., Eds.; Blackwell Publishing Ltd.: Oxford, UK, 2008; pp. 375–449. [Google Scholar]
  37. Cey, E.E.; Rudolph, D.L.; Aravena, R.; Parkin, G. Role of the riparian zone in controlling the distribution and fate of agricultural nitrogen near a small stream in southern Ontario. J. Contam. Hydrol. 1999, 37, 45–67. [Google Scholar] [CrossRef]
  38. Lehmann, M.F.; Reichert, P.; Bernasconi, S.M.; Barbieri, A.; McKenzie, J.A. Modelling nitrogen and oxygen isotope fractionation during denitrification in a lacustrine redox-transition zone. Geochim. Cosmochim. Acta 2003, 67, 2529–2542. [Google Scholar] [CrossRef]
  39. Sebilo, M.; Billen, G.; Grably, M.; Mariotti, A. Isotopic composition of nitrate-nitrogen as a marker of riparian and benthic denitrification at the scale of the whole Seine River system. Biogeochemistry 2003, 63, 35–51. [Google Scholar] [CrossRef]
  40. Ogawa, A.; Shibata, H.; Suzuki, K.; Mitchell, M.J.; Ikegami, Y. Relationship of topography to surface water chemistry with particular focus on nitrogen and organic carbon solutes within a forested watershed in Hokkaido, Japan. Hydrol. Process. 2006, 20, 251–265. [Google Scholar] [CrossRef]
  41. Anderson, T.R.; Groffman, P.M.; Walter, M.T. Using a soil topographic index to distribute denitrification fluxes across a northeastern headwater catchment. J. Hydrol. 2015, 522, 123–134. [Google Scholar] [CrossRef]
  42. Kulkarni, M.V.; Groffman, P.M.; Yavitt, J.B.; Goodale, C.L. Complex controls of denitrification at ecosystem, landscape and regional scales in northern hardwood forests. Ecol. Model. 2015, 298, 39–52. [Google Scholar] [CrossRef]
  43. Olyaie, E.; Banejad, H.; Chau, K.W.; Melesse, A.M. A comparison of various artificial intelligence approaches performance for estimating suspended sediment load of river systems: A case study in United States. Environ. Monit. Assess. 2015, 187. [Google Scholar] [CrossRef] [PubMed]
  44. Wang, W.C.; Xu, D.M.; Chau, K.W.; Lei, G.J. Assessment of river water quality based on theory of variable Fuzzy sets and Fuzzy Binary comparison method. Water Resour. Manag. 2014, 28, 4183–4200. [Google Scholar] [CrossRef]
  45. Chen, X.Y.; Chau, K.W. A Hybrid double feedforward neural network for suspended sediment load estimation. Water Resour. Manag. 2016, 30, 2179–2194. [Google Scholar] [CrossRef]
  46. Sefeedpari, P.; Rafiee, S.; Akram, A.; Chau, K.W.; Pishgar-Komleh, S.H. Prophesying egg production based on energy consumption using multi-layered adaptive neural fuzzy inference system approach. Comput. Electron. Agric. 2016, 131, 10–19. [Google Scholar] [CrossRef]
Figure 1. (a) Location of the Tatara River Basin in northern Kyushu Island, western Japan; (b) Map of the Tatara River Basin showing the locations of synoptic sampling sites for this study. Open circles, open triangles and open squares show sampling sites for the Ino, Sue, and Umi rivers, respectively. Numbers correspond to the sampling sites shown in Table 2. Black diamonds show the Tatara-Gawa wastewater treatment plant and all of the treated wastewater discharged into the mouth of the river near Hakata Bay; (c) Contour map of the Tatara River Basin. Most of the highland areas are steep and covered with artificial forest (Chamaecyparis obtusa or Cryptomeria japonica) or secondary evergreen broad-leaved forest.
Hydrology 04 00043 g001
Figure 2. Scheme of the calculation method of the topographic index (TI). Arrows are the flow direction per grid. Fan-shape indicates contributing area.
Hydrology 04 00043 g002
Figure 3. Changes in NO3-N, organic nitrogen (Org-N; μmol/L), δ15N, and δ18O (‰) with the percentage of urban area in the Ino (a,d,g,j), Sue (b,e,h,k), and Umi (c,f,i,l) rivers. White circle, white triangles, black circles, and black diamonds indicate the stream water sampling months of August, November, January, and April, respectively. Exponential regression lines with a significant p-value (p < 0.05) are drawn directly from all data points.
Hydrology 04 00043 g003
Figure 4. δ15N and δ18O (‰) of stream NO3-N shown against the natural logarithm of the stream NO3 concentration (μmol/L) in the Ino (a,b), Sue (c,d), and Umi (e,f) rivers. Data in August were eliminated from the regression analysis. Negative slopes of the equations showed isotopic enrichment with the decrease in stream NO3. ε is the negative slope of the linear relation of the stable isotope vs. NO3 (in ln).
Hydrology 04 00043 g004
Figure 5. Relationship between local TI (LTI) and the percentage of local urban area (LUA) of the Ino, Sue, and Umi rivers. The linear regression lines are shown with the equation and p-values.
Hydrology 04 00043 g005
Table 1. Monthly mean air temperature and precipitation from June 2012 to May 2013 observed at the Fukuoka meteorological weather station (35.58° N, 130.45° E) located in the basin (http://www.data.jma.go.jp/obd/stats/etrn/).
JuneJulyAugustSeptemberOctoberNovemberDecemberJanuaryFebruaryMarchAprilMayAnnual
Temperature (°C)23.128.029.124.519.212.97.66.17.812.314.720.317.1
Precipitation (mm)2894641891294812599588257108371685
Table 2. Watershed area, river width, and gradient of the river bed at each sampling site. The land use percentage at each sampling site is also shown. Other land uses include barren lands and golf courses. Land use was determined using the dataset of the National Land Information Division for 2009.
SiteWatershed Area (km2)River Width (m)Gradient of River Bed (°)Land Use (%)
ForestPaddyFarmlandUrbanRiverOthers
Ino13.48.07.00100.00.00.00.00.00.0
Ino210.47.66.0097.10.30.00.11.51.0
Ino314.29.20.6086.83.90.76.31.31.1
Ino426.423.20.3874.96.11.214.81.81.2
Ino593.834.60.0569.28.00.718.31.62.2
Sue12.59.43.66100.00.00.00.00.00.0
Sue20.74.25.2599.50.00.00.00.00.5
Sue38.914.31.1787.35.90.26.10.20.2
Sue421.623.00.2953.79.80.730.31.83.6
Umi12.14.26.0599.80.00.00.00.00.2
Umi20.32.010.28100.00.00.00.00.00.0
Umi314.921.71.4568.04.10.027.10.50.4
Umi43526.62.9749.15.40.238.10.96.4

