Article

Comparison and Downscale of AMSR2 Soil Moisture Products with In Situ Measurements from the SCAN–NRCS Network over Puerto Rico

by
Jonathan Nuñez-Olivieri
1,2,
Jonathan Muñoz-Barreto
1,*,
Rebecca Tirado-Corbalá
3,
Tarendra Lakhankar
2 and
Andmorgan Fisher
4
1
Department of Civil Engineering and Surveying, University of Puerto Rico, Mayagüez, PR 00682, USA
2
NOAA-CREST Center, The City College of New York, New York, NY 10031, USA
3
Agro-Environmental Science Department, University of Puerto Rico, Mayagüez, PR 00682, USA
4
Geospatial Research Laboratory, U.S. Army Engineer Research and Development Center, 7701 Telegraph Road, Alexandria, VA 22315, USA
*
Author to whom correspondence should be addressed.
Hydrology 2017, 4(4), 46; https://doi.org/10.3390/hydrology4040046
Submission received: 11 September 2017 / Revised: 25 September 2017 / Accepted: 28 September 2017 / Published: 30 September 2017

Abstract

:
A continuous spatio-temporal database of accurate soil moisture (SM) measurements is an important asset for agricultural activities, hydrologic studies, and environmental monitoring. The Advanced Microwave Scanning Radiometer 2 (AMSR2), which was launched in May 2012, has been providing SM data globally with a revisit period of two days. It is imperative to assess the quality of this data before performing any application. Since resources of accurate SM measurements are very limited in Puerto Rico, this research will assess the quality of the AMSR2 data by comparing it with ground-based measurements, as well as perform a downscaling technique to provide a better description of how the sensor perceives the surface soil moisture as it passes over the island. The comparison consisted of the evaluation of the mean error, root mean squared error, and the correlation coefficient. Two downscaling techniques were used, and their performances were studied. The results revealed that AMSR2 products tend to underestimate soil moisture. This is due to the extreme heterogeneous distributions of elevations, vegetation densities, soil types, and weather events on the island. This research provides a comprehensive study on the accuracy and potential of the AMSR2 products over Puerto Rico. Further studies are recommended to improve the AMSR2 products.

Graphical Abstract

1. Introduction

Soil moisture (SM) content is the quantity of water accumulated in soil pores, usually recorded as percent or volumetric ratio (e.g., cm3/cm3) for different depths (e.g., 5 cm, 10 cm, and 25 cm). SM plays an important role in water cycles, hydrologic studies, agricultural activities, and environmental monitoring [1,2,3,4,5,6]. Hydrologic modeling systems are very sensitive to changes in SM values for applications involving flood control and drought assessment [1]. In agricultural activities, best management practices and irrigation control can be optimized with continuous spatio-temporal SM measurements [7]. Predictions and results for environmental monitoring applications such as climate change and weather forecasting have a high dependency on the accuracy of the SM data [5,6,8]. The spatio-temporal availability of accurate SM measurements rely on the quality of the instruments, frequency of retrieval, and management of the data [2]. There are three options for acquiring SM content: ground-based measurements, modeling predictions, and remotely-sensed estimates [1,3].
The SM measurements collected in the field, which are usually referred to as in situ measurements, are commonly retrieved in high or low density networks of point measurements. The density of a network is determined by the quantity and assembling of instruments, the area of study, and the budget of the project. There are various instruments and techniques used to obtain ground-based measurements. Time domain reflectometry (TDR) instruments measure the soil dielectric permittivity, which is commonly used to quantify SM, since its value increases with the higher presence of water [3,9]. The TDR instruments provide accurate SM measurements for a specific location that can be represented as a point measure in a map. Another type of instrument used to collect in situ SM measurements is based on cosmic-ray detection. The COsmic-ray Soil Moisture Observing System (COSMOS) measures the quantity of fast neutrons above the land surface, which have an inversely correlated relationship with SM due to kinetic energy loss, and provides an estimate of SM over a horizontal footprint with a diameter of about 600 m [9]. This kinetic loss happens when fast neutrons collide with hydrogen atoms found in wet land surfaces [9]. While in situ measuring provides accurate products, the instruments can be difficult to calibrate and maintain without high technical knowledge, and the availability of an adequate network that meets the requirements for each individual project is very limited [1].
Soil moisture can be simulated at different spatio-temporal resolutions using modeling systems [3]. The quality of the simulation is tied to the accuracy of the in situ data used as the training dataset, and the right implementation of a validation and optimization process [3,10]. There are a variety of modeling systems used to simulated soil moisture, such as the SM Accounting, the SM Water Balance Model, and the variable infiltration capacity (VIC) model [3,11,12,13]. As an example of how these models work, the VIC model simulates SM based in correlations between land cover, SM storage capacity, topography, and precipitation [12,14]. A simulation can be performed for various spatio-temporal resolutions, depending on the objective of the project [3]. However, the poor availability of ground-based SM data networks, the uncertainty of forcing data, and the model structure will affect directly the process of simulation, validation, and optimization of the modeled SM products [13,15].
Satellite-based microwave observations can retrieve SM estimates at different spatio-temporal resolutions [1,3]. Passive microwave depends on the physical temperature and surface emissivity of the earth’s surface. In principle, passive sensors, such as radiometers, measure the thermal emission of the surface at the microwave wavelength, and translate that energy to brightness temperature [15,16]. The response of the soil to an electromagnetic wave depends on its texture, surface roughness, organic matter content, iron oxide content, and moisture content [17]. In general, radiative transfer models such as the tau-omega (τ-ω), use the dielectric constant alongside other characteristics of the soil, such as an incident angle and brightness temperature, to estimate SM with remote sensing technologies [17,18,19,20]. Satellite-based SM products are provided at a global scale by satellite sensors such as the Soil Moisture Active Passive (SMAP) Mission from NASA (https://smap.jpl.nasa.gov/), the Soil Moisture and Ocean Salinity (SMOS) from the European Space Agency (http://www.esa.int/Our_Activities/Observing_the_Earth/SMOS), the Advanced Microwave Scanning Radiometer for the Earth Observing System (AMSR-E) (https://nsidc.org/data/amsre) from the Japan Aerospace Exploration Agency (JAXA), and the AMSR-2 also from JAXA (http://suzaku.eorc.jaxa.jp/GCOM_W/). An advantage of the current satellite-based remotely-sensed SM products is the availability of global scale measurements at a continuous spatio-temporal resolution [1,7]. However, at the current state, the satellite-based products are available at coarse spatial resolutions ranging from 3 km to 40 km, which are not useful for small scale hydrologic modeling and agricultural applications. Also, due to the availability of ground-based networks, the validation process for satellite-based products is very limited [1,7,21]. Recent studies have been working on the improvement of the soil moisture estimations of satellite-based products using different algorithms that relate soil moisture with variables such as vegetation, brightness temperature, precipitation, and others [21,22,23].

1.1. Soil Moisture in Puerto Rico

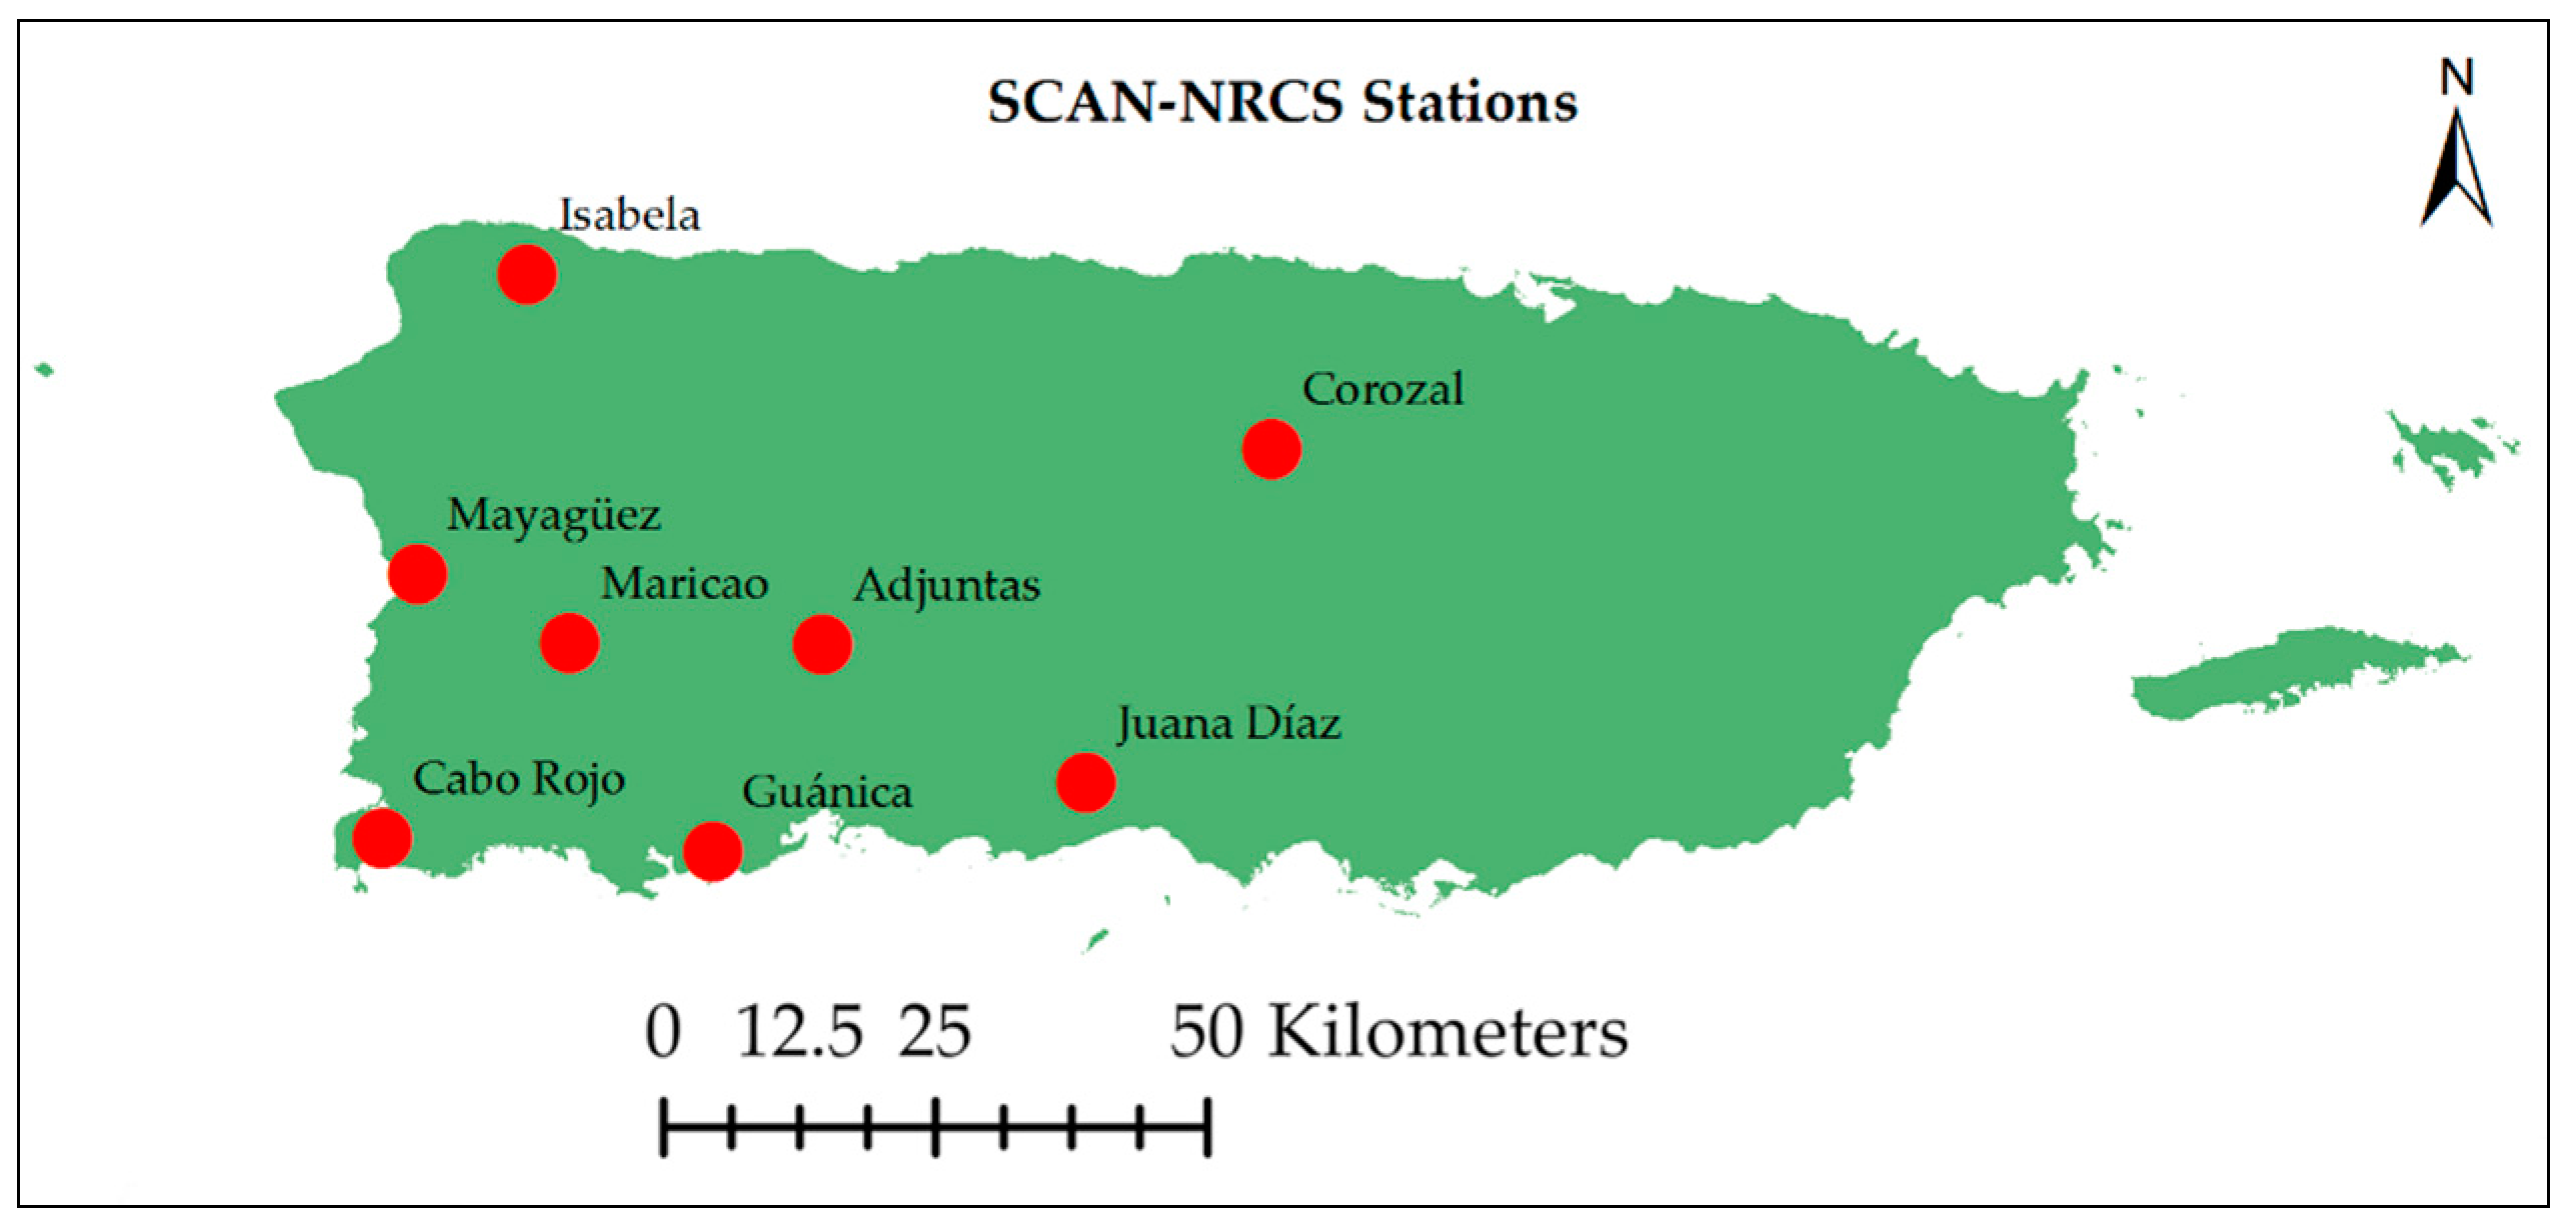
The spatio-temporal availability and accuracy of SM measurements are key elements to acquiring the best possible outcomes in applications involving hydrologic modeling, agricultural management, and weather monitoring. Unfortunately, in Puerto Rico the resources available to retrieve accurate SM measurements are very limited. Currently, the Soil Climate Analysis Network (SCAN) of the Natural Resources Conservation Service (NRCS) has eight stations around the center and western regions of the island retrieving in situ SM content. The data collection is available online (www.wcc.nrcs.usda.gov), and provides over five years of hourly and daily SM data. Simulated SM is available from the Geostationary Operational Environmental Satellite—Puerto Rico Water and Energy Balance (GOES-PRWEB) model (https://pragwater.com/goes-puerto-rico-water-and-energy-balance-goes-web-algorithm/) at 1 km resolution, which uses a water and energy balance approach to simulate different hydrologic parameters such as surface runoff, stream flow, and SM. However, the GOES-PRWEB SM product has not been officially validated. Remotely sensed SM data can be retrieved from the various missions such as SMAP, SMOS, or the Global Change Observation Mission—Water 1 (GCOM-W1) satellite system. This research is based on data from the Advanced Microwave Scanning Radiometer 2 (AMSR2), a sensor carried by the GCOM-W1 satellite system. The AMSR2, which launched in May 2012, is a microwave radiometer that estimates SM worldwide every two days at a 25 km resolution [6,23]. The SM product can be downloaded from the Earth Observation Research Center (EORC) of the Japan Aerospace Exploration Agency (JAXA) website (https://gcom-w1.jaxa.jp), and is available on a daily or monthly basis at 10 km and 25 km resolutions.

1.2. Scope and Objectives

Since resources of accurate SM measurements are very limited in Puerto Rico, the scope of this research is to assess the quality of the AMSR2 data and perform a downscaling technique to provide a better description of how the sensor perceives the surface SM as it passes over the island. The comparison consists of the evaluation of the difference between the satellite-based and the ground-based measurements by means of the mean error (ME), the root mean squared error (RMSE), and the correlation coefficient (R). Two downscaling techniques are used, and their performances are studied. The first technique used to downscale the AMSR2 SM products to a finer downscaled product consists of a simple linear equation that relates the coarse resolution AMSR2 SM with three parameters retrieved from the Moderate Resolution Imaging Spectroradiometer (MODIS). These three MODIS parameters are the Normalized Difference of Vegetation Index (NDVI), the Land Surface Temperature (LST), and the albedo. The second technique is an algorithm that relates weighted values of sand fraction, elevation, and NDVI with the AMSR2 SM product. The performance of each method was analyzed with the hopes of providing a better method for the retrieval of SM in Puerto Rico.

2. Datasets

2.1. AMSR2 Satellite-Based Soil Moisture Data

The GCOM-W1 satellite system was launched in 17 May 2012 to collect geophysical parameters (i.e., precipitation, sea surface temperature, and soil moisture content) and observe changes in water circulation [6,22]. The GCOM-W1 system carries the AMSR2 sensor, which retrieves the radiometric waves emitted from Earth. The brightness temperature data collected by the AMSR2 sensor is used to estimate SM at a coarse spatial resolution globally with an average temporal resolution of two days [6,24]. The SM estimates are calculated using the Land Parameter Retrieval Model (LPRM), which is based on a forward radiative transfer model that retrieves soil moisture and vegetation optical depth. The SM product provided by the AMSR2 can be retrieved from the Earth Observation Research Center (EORC) on the Japan Aerospace Exploration Agency (JAXA) website. The data can be downloaded in Hierarchical Data Format 5 (HDF5) for day and night readings, scene (referring to all of the measurements taken at half orbit between the North Pole and the South Pole with respect to the observation point [25]), or global map (10 km and 25 km resolution), on a daily or monthly basis. For this research, all of the available data from September 2012 to January 2017 of the daily global AMSR2 25 km resolution SM estimated values for both ascending and descending overpasses were retrieved and analyzed. To retrieve the SM values for Puerto Rico, the geographical coordinates included in the original satellite data were processed using the Euclidean distance method. The maximum, minimum, mean, and standard deviation for the ascending and descending overpasses of the AMSR2 25 km resolution SM product over Puerto Rico are presented in Figure 1.

2.2. SCAN–NRCS Ground-Based Soil Moisture Data

The Soil Climate Analysis Network (SCAN) project of the Natural Resources Conservation Service (NRCS) has been collecting soil moisture and soil temperature all over the United States since 1991. At present, the project has employed over 200 stations around the United States, mainly in agricultural areas. The stations are continuously providing ground-based measurements of SM, precipitation, relative humidity, land surface temperature, solar radiation, wind velocity, wind direction, and barometric pressure. Eight SCAN–NRCS stations (Figure 2) that are located over the central and western regions of Puerto Rico have been providing data from 2001 to the present day. The SM data provided by the SCAN network is measured hourly with TDR instruments at four different depths (5, 10, 20, and 50 cm). The data is offered daily, or hourly. All of the available surface layer (at a depth of 5 cm) SM data for each station was retrieved for the analysis from the NRCS-NWCC (National Water Climate Center) website in comma-separated values (.csv) format.

2.3. MODIS Remotely Sensed Parameters

The MODIS sensor is a spectroradiometer that collects data for 36 different spectral bands and offers its products at a spatial resolution that varies from 500 to 5600 m. The products of MODIS are leaf area index, fractional photosynthetically active radiation, bidirectional reflectance distribution function, thermal anomalies and fire, temperature, emissivity, vegetation indices, gross and net primary productivity, and albedo. Two units of MODIS are currently collecting data: one is aboard the Terra satellite, and the other is in the Aqua satellite system. These satellite systems are part of the NASA-centered international Earth Observing System (EOS). Both systems travel in a circular sun-synchronous polar orbit, which is a setting that allows the systems to go from north to south of Earth every 99 min (16 orbits per day), and collect data for the entire planet every one or two days. MODIS products of Albedo, LST, and NDVI at a 1 km resolution were retrieved in HDF4 from the EOS Data and Information System (EOSDIS) website (https://search.earthdata.nasa.gov/) for Puerto Rico in order to perform the downscaling of a 25-km resolution SM from AMRS2 to a 1-km resolution SM product. Albedo, LST, and NDVI parameters samples over Puerto Rico are presented in Figure 3.

3. Methods

Puerto Rico consists of an archipelago with a land surface area of 9104 km2. The island is mostly mountainous, and the elevation at the highest point is 1338 m (4390 feet) above sea level. In Puerto Rico, the soil type, land use, soil temperature, daily precipitation, impervious areas, and density of vegetation varies noticeably by the kilometer. Therefore, it is expected that any average of a 25-km resolution SM estimate cannot be representative of the area of coverage. The methodology of this project is meant to assess the quality of the AMSR2 products over Puerto Rico, and enhance the satellite-based SM product by downscaling the coarse resolution AMSR2 SM product to a finer resolution SM product.

3.1. Comparison of AMSR2 with SCAN–NRCS Soil Moisture Products

The comparison between the coarse resolution AMSR2 SM products and the SCAN–NRCS SM data was performed for all of the data available during September 2012 to January 2017 for both the ascending (1148 days of data) and the descending (1080 days of data) overpasses, which take place around 1:30 p.m. and 1:30 a.m., respectively. Since the ground-based SM is offered hourly, average values of the SCAN SM measurements between 1–2 p.m. and 1–2 a.m. were computed and compared with the AMSR2 SM products. To assess the quality of the AMSR2 SM products in terms of each SCAN–NRCS station, the location of each ground-based station was matched with the closest AMSR2 pixel centroid (Figure 4). To evaluate only the AMSR2 SM values that would better describe the area where the respective SCAN-NRCS station is located, the SM data was filtered by selecting the days when the soil moisture difference would not exceed ±0.15. The average distance between each SCAN–NRCS station and the AMSR2 25 km pixel centroid, and the percent of pixels inside the ±0.15 difference range, were reported to analyze how these parameters affected the correlation between the remotely sensed and in situ SM observations.
The AMSR2 SM values were analyzed by calculating the mean error (ME), the root mean square error (RMSE), and the correlation coefficient (R) for each station. The ME (Equation (1)) is the summation of the difference between the ground based and satellite based SM divided by the total of days analyzed. The mean error is calculated as follows:
ME   =   i   =   1 N e i N   =   i   =   1 N [ θ i , G     θ i , S ] N
where the error is ( e i ), the ground-based SM is θ i , G , the satellite-based SM is θ i , S , and N represents the number of days analyzed. It is important to note that the number of days analyzed changes with each station depending on the availability of the data. The RMSE is given by Equation (2):
RMSE   =   i   =   1 N e i 2 N   =   i   =   1 N [ θ i , G     θ i , S ] 2 N
The RMSE represents the absolute accuracy of the AMSR2 SM compared with the SCAN–NRCS in situ SM. The R (Equation (3)) measures the relationship in variability between the observed measurements and the estimated values [26], and is calculated by:
R   =   N i   =   1 N ( θ i , G × θ i , S ) ( i   =   1 N θ i , G ) × ( i   =   1 N θ i , S ) [ N ( i   =   1 N θ i , G 2 ) ( i   =   1 N θ i , G ) 2 ] × [ [ N ( i   =   1 N θ i , S 2 ) ( i   =   1 N θ i , S ) 2 ] ]
The correlation coefficient calculated as shown in the previous equation ranges from 0 to 1, where 0 is a poor estimate, and 1 is the best estimate. A value of R ≥0.70 is considered as a satisfactory estimation.

3.2. Downscaling the AMSR2 with Albedo, LST, and NDVI

Since the AMSR2 product does not provide representative data for SM measurements over Puerto Rico, two downscaling techniques were tested to refine the 25 km resolution product to a 1 km resolution product. The following approaches were performed with hopes of enhancing the satellite-based continuous spatio-temporal SM measurements over Puerto Rico. The downscaling technique selected has been previously executed by Ray et al. [12] and first published by Chauhan et al. [27]. The technique suggests that remotely sensed SM retrieved from the AMSRE system at a 25 km resolution can be downscaled to 1 km resolution using a simple linear equation. The equation is based on parameters calculated with a regression model, which is itself based on three physical properties of 1 km resolution retrieved from MODIS. The three physical properties are the albedo, the LST, and the NDVI. Equation (4) presents the downscaling approach with these three MODIS parameters:
θ s = i   =   0 i   =   n j   =   0 j   =   n k   =   0 k   =   n a ijk V i T j A k .
By establishing the number of explanatory variables n equal to 1, the equation yields to:
θ s   =   a 000   +   a 100 A   +   a 010 T   +   a 001 V   +   a 110 TA   +   a 101 VA   +   a 011 VT
where the a ijk parameters are the connection between the fine resolution downscaled SM and the coarse resolution satellite-based SM products, A is the albedo, T is the LST, and V is the NDVI. These parameters are calculated with a multiple linear regression model that compares the aggregated values of the physical properties with the coarse resolution SM estimate. Each parameter was upscaled to match the 25 km resolution of AMSR2. The upscale was performed as follows:
V 25   km   =   i   =   1 n j   =   1 m V ij mn ,   T 25   km   =   i   =   1 n j   =   1 m T ij mn ,     A 25   km   =   i   =   1 n j   =   1 m A ij mn  
where 25 km is the resolution at which the physical parameters will be upscaled, m is the value for the ith column of the 1 km resolution grid inside the 25 km resolution, and n is the value for the jth row of the 1 km resolution grid inside the 25 km resolution.

3.3. Downscaling the AMSR2 with Sand Fraction, Elevation, and NDVI

As another approach for the downscaling, an algorithm was implemented to refine the AMSR2 product by distributing the coarse resolution SM product into a finer resolution product using weighted control parameters. These control parameters are sand fraction (SAND), elevation (ELEV), and NDVI, and were retrieved at a resolution of 1 km. The process to calculate a weighted value of each parameter in location ij inside each AMSR2 pixel consists simply of dividing each ij value by its average, as shown in the following equations:
SANDw ij   =   SAND ij SAND ¯ ,   ELEVw ij   =   ELEV ij ELEV ¯ ,   NDVIw ij   =   NDVI ij NDVI ¯
These weighted values are then used to calculate the SM at each ij location by:
θ ij   =   θ   ×   1 3   ( 1 SANDw ij + 1 ELEVw ij + NDVIw ij   )
where θ is the 25 km AMSR2 SM, and θij is the downscaled AMSR2 at a 1 km resolution for location ij. After performing both downscales, the results were compared with the SCAN–NRCS ground-based SM, following the same evaluation methodology previously mentioned.

4. Results and Discussion

4.1. Comparison of AMSR2 with SCAN–NRCS Soil Moisture Products

All of the available data from September 2012 to January 2017 of AMSR2 SM products at a resolution of 25 km for both ascending and descending overpasses were compared with each SCAN–NRCS station over Puerto Rico. For the analysis, the maximum, minimum, mean, and standard deviation were calculated for each station, and all of the AMSR2 pixels that were matched by distance, as previously explained. The ascending and descending statistics results are shown in Table 1 and Table 2, respectively.
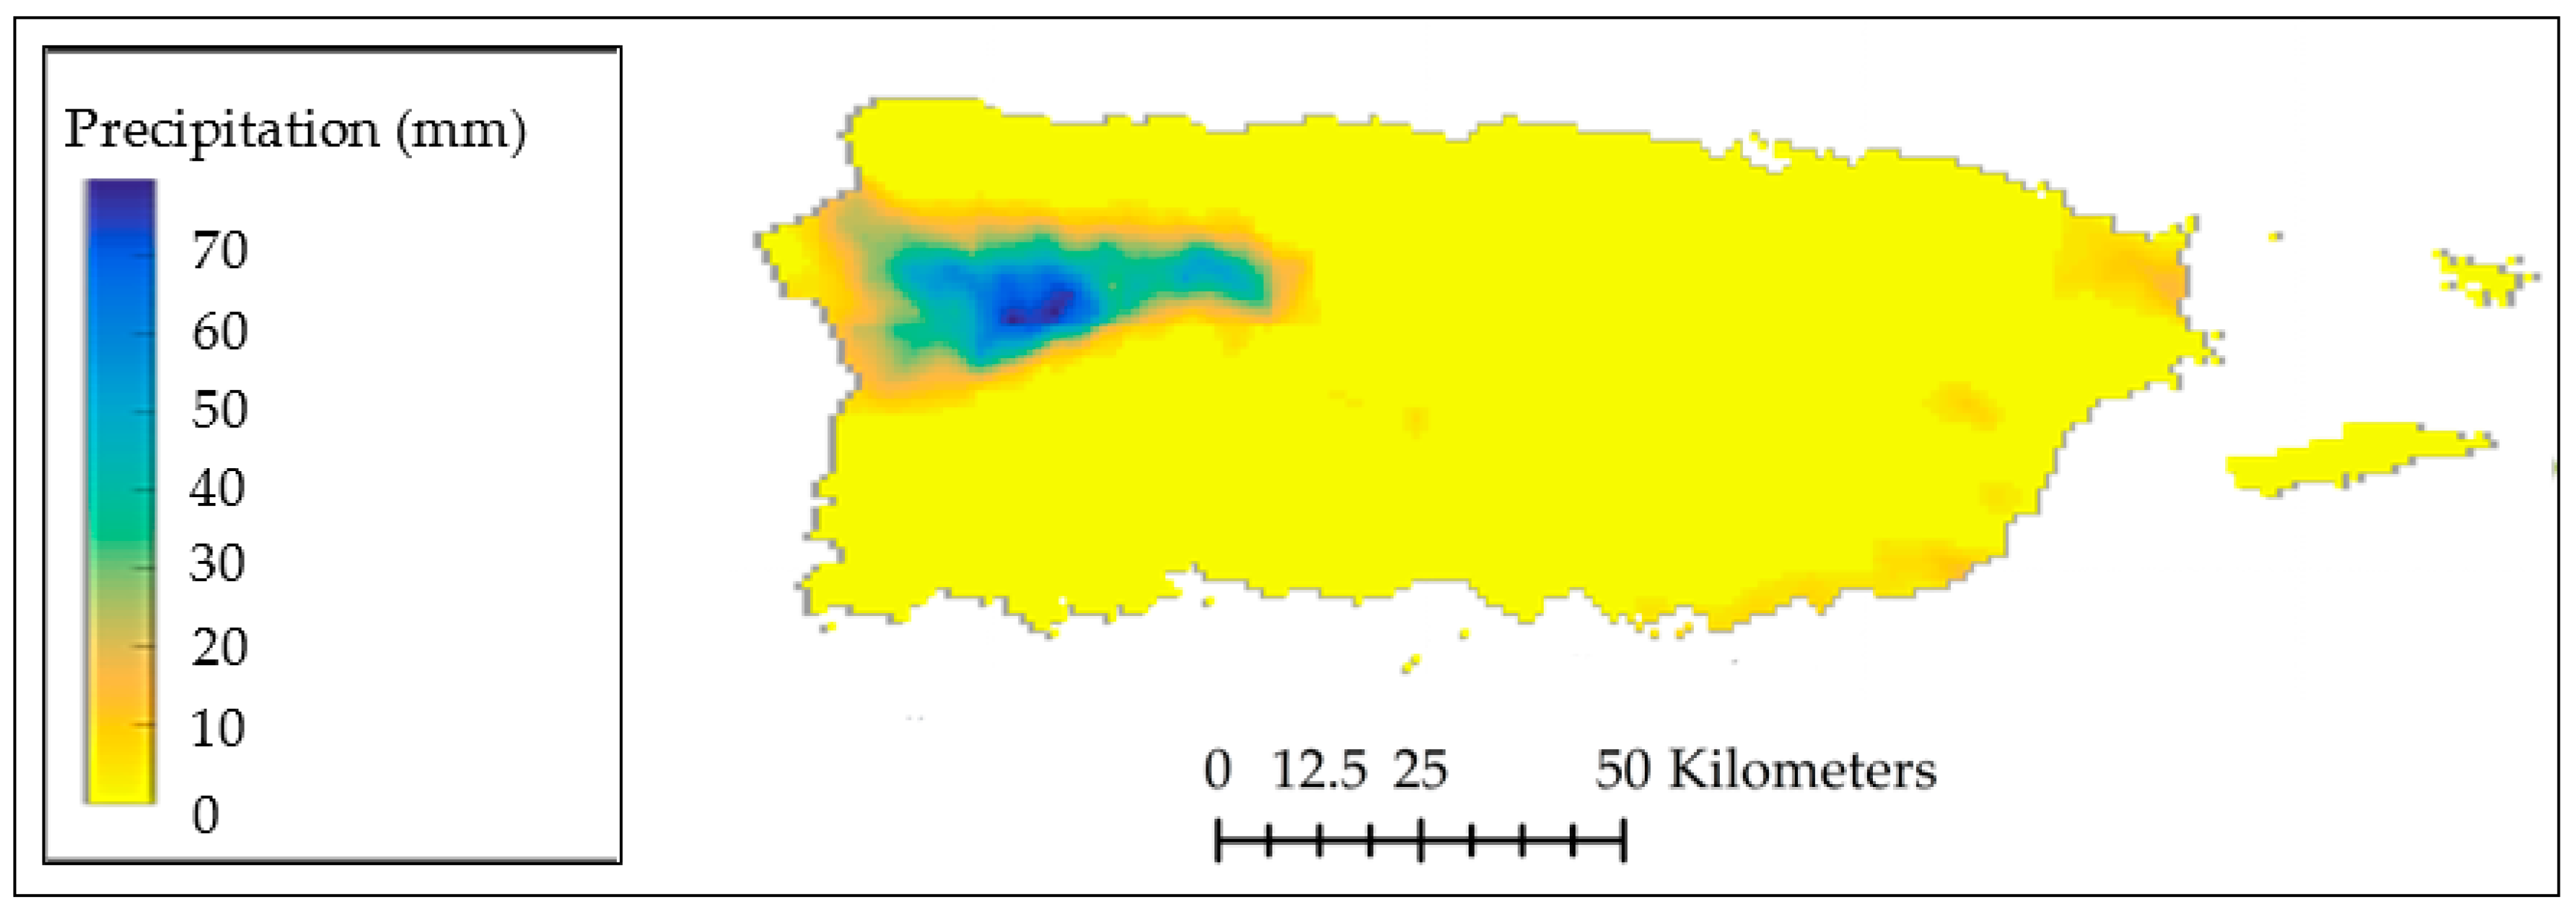
The maximum values of both overpasses of the AMSR2 SM are very congruent to the NRCS stations located in mountainous areas (Adjuntas, Corozal, and Isabela), where high humidity and frequent precipitation events are common. The minimum values of both overpasses of the AMSR2 SM underestimated the SM with respect to the NRCS readings for all of the stations, except for Guánica. This exception takes effect because the NRCS station in Guánica is located in an area known as the “Bosque Seco”, which directly translates to “Dry Forest”, and is known to be one of the most arid regions with low humidity and a low frequency of precipitation events in Puerto Rico. The mean values and standard deviations for AMSR2 readings with respect to the NRCS stations during both overpasses are low and very similar, revealing a consistent tendency of all the AMSR2 readings over PR to underestimate SM.
The percent of instances where the error was inside the range of ±0.15 (%), ME, RMSR, R, and the mean distance from station to centroid (Distance) are shown in Table 3 and Table 4. Overall, AMSR2 SM products for both overpasses tended to underestimate for all of the SCAN–NRCS stations, except for the station in Guánica, which is one of the most arid regions of the island.
The percent of error inside the ±0.15 range (%) and the mean distance of the nearest available AMSR2 pixel centroid with respect to each NRCS station (distance) readings both are influencing the values of ME, RMSE, and R. Lower % values decreases ME and RMSE, while increasing R.
If the distance is over 12 km ME and RMSE increases, R decreases. High R values were found in areas where the mean values of the NRCS SM readings in humid areas were equal to or higher than 0.30, the % was equal to or less than 40%, and the distance was less than 12 km. This high correlation reveals that when the AMSR2 is not underestimating SM, it provides a moderately good estimate within the range of the pixel, if the mean SM in the area is equal or higher than 0.30. Low R values were found in arid areas, where the mean SM was lower than 0.30, the lower distance increased the R up to 0.630.

4.2. Downscale of AMSR2 with Albedo, LST, and NDVI

The AMSR2 25 km resolution SM product was downscaled to 1 km resolution with a simple linear equation involving MODIS products for Albedo, NDVI, and LST. The average resultant downscaling equation for all AMSR2 data is shown in the following equation.
θ s   =   0 . 1503   +   1 . 33   ×   10 4   A   +   4 . 70   ×   10 5   T     1 . 06   ×   10 6   V     4 . 28   ×   10 7   TA   +   7 . 31   ×   10 10   VA     2 . 31   ×   10 9   VT
where θs is the downscaled SM, A is the albedo, T is the land surface temperature, V is the normalized difference of vegetation index, and the rest are the interactions between A, T, and V (TA, VA, and VT). The regression model achieved a moderate correlation of 0.6102 and an overall RMSE of 0.0050, which indicated that the model was a good fit with the AMSR2 estimates. To reinforce this statement, R-squared was calculated, and the F-statistic test was performed. The R-squared was 0.037, and the p-value of the F-statistic test was less than 10−4. These results reinforce the statement that the model is providing a good fit. Table 5 shows that all of the p-values are below the significant level (5%), meaning that the null hypothesis is rejected for each coefficient, and all of the terms in the linear equation are significant.
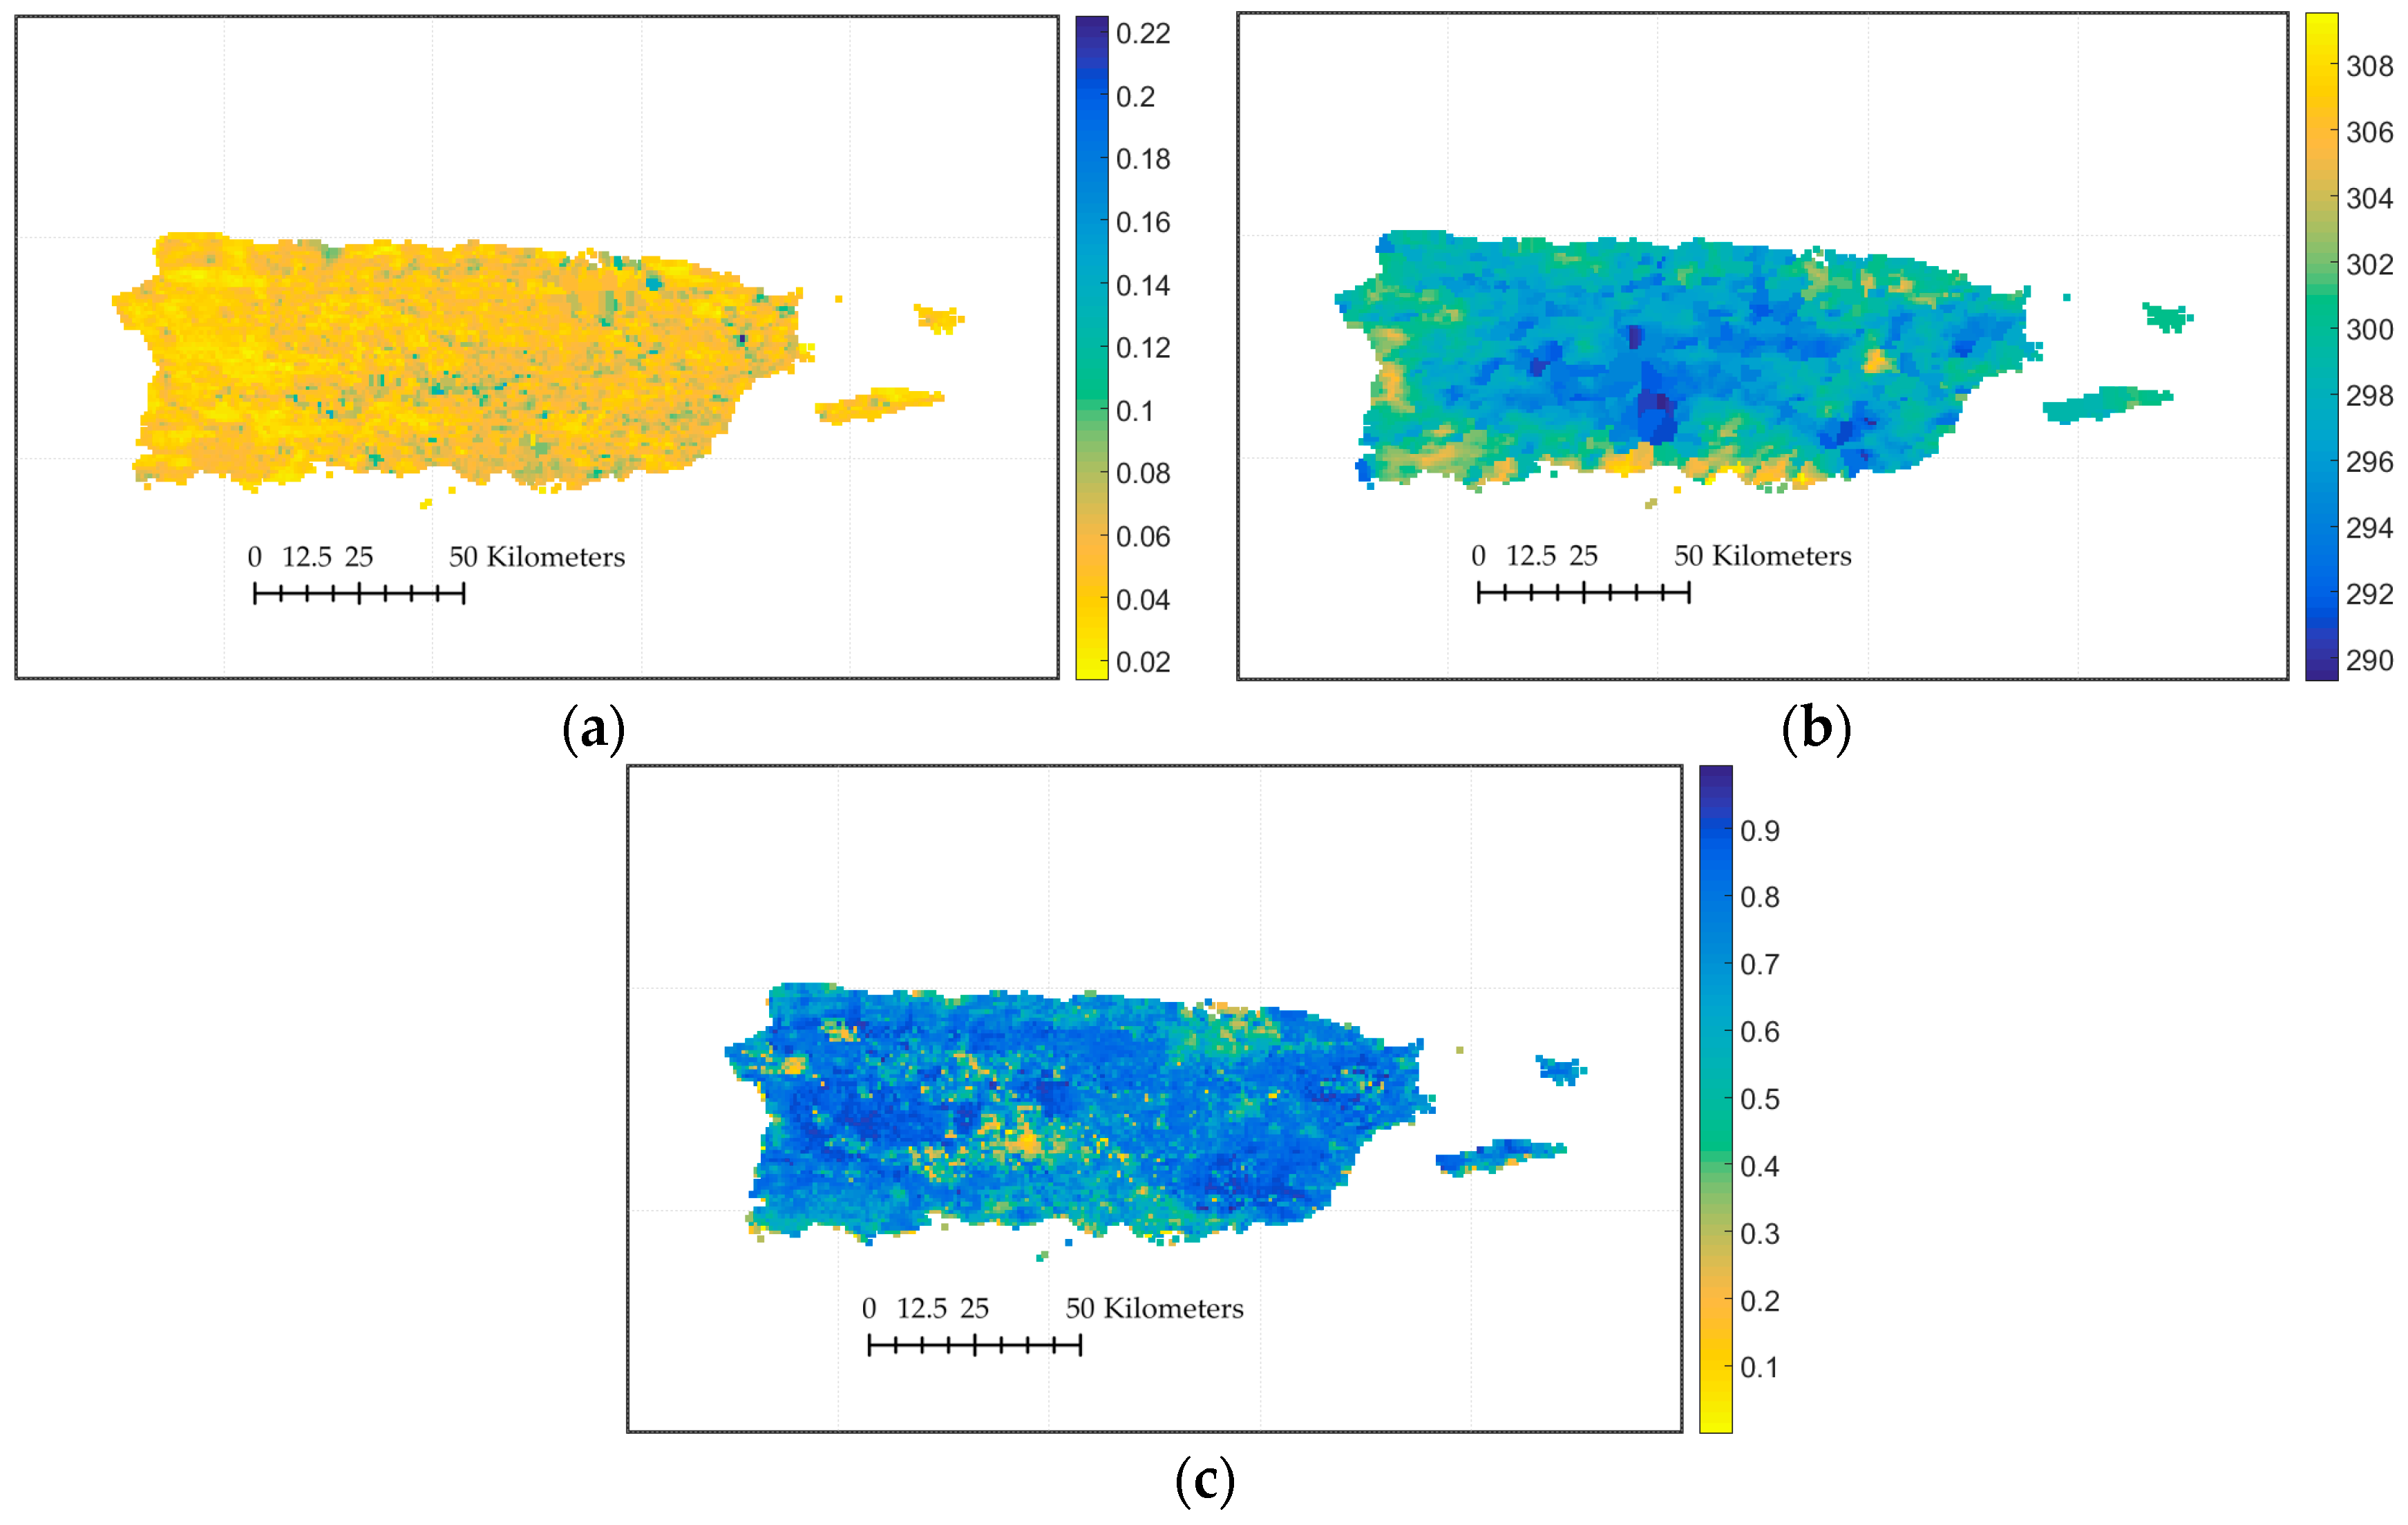
Figure 5 shows a sample for the downscaled AMSR2 SM values over PR using MODIS parameters Albedo, LST, and NDVI.
The following table (Table 6) presents the basic statistics for the comparison between the downscaled product using the MODIS parameters and the SCAN–NRCS SM measurements. In contrast with the comparison of the SCAN–NRCS measurements with the raw AMSR2 SM products, the downscaled product achieved a higher percentage of SM estimates that behave similar to the SCAN–NRCS data. In terms of R, the correlation slightly decreased. A potential solution to the decrease of correlation could be the optimization of the downscaling technique.

4.3. Downscale of AMSR2 with Sand Fraction, Elevation, and NDVI

This approach for the downscaling of AMSR2 was performed with an algorithm that used the weighted control parameters sand fraction, elevation, and the Normalized Difference of Vegetation Index. 
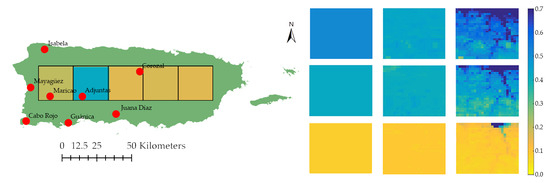
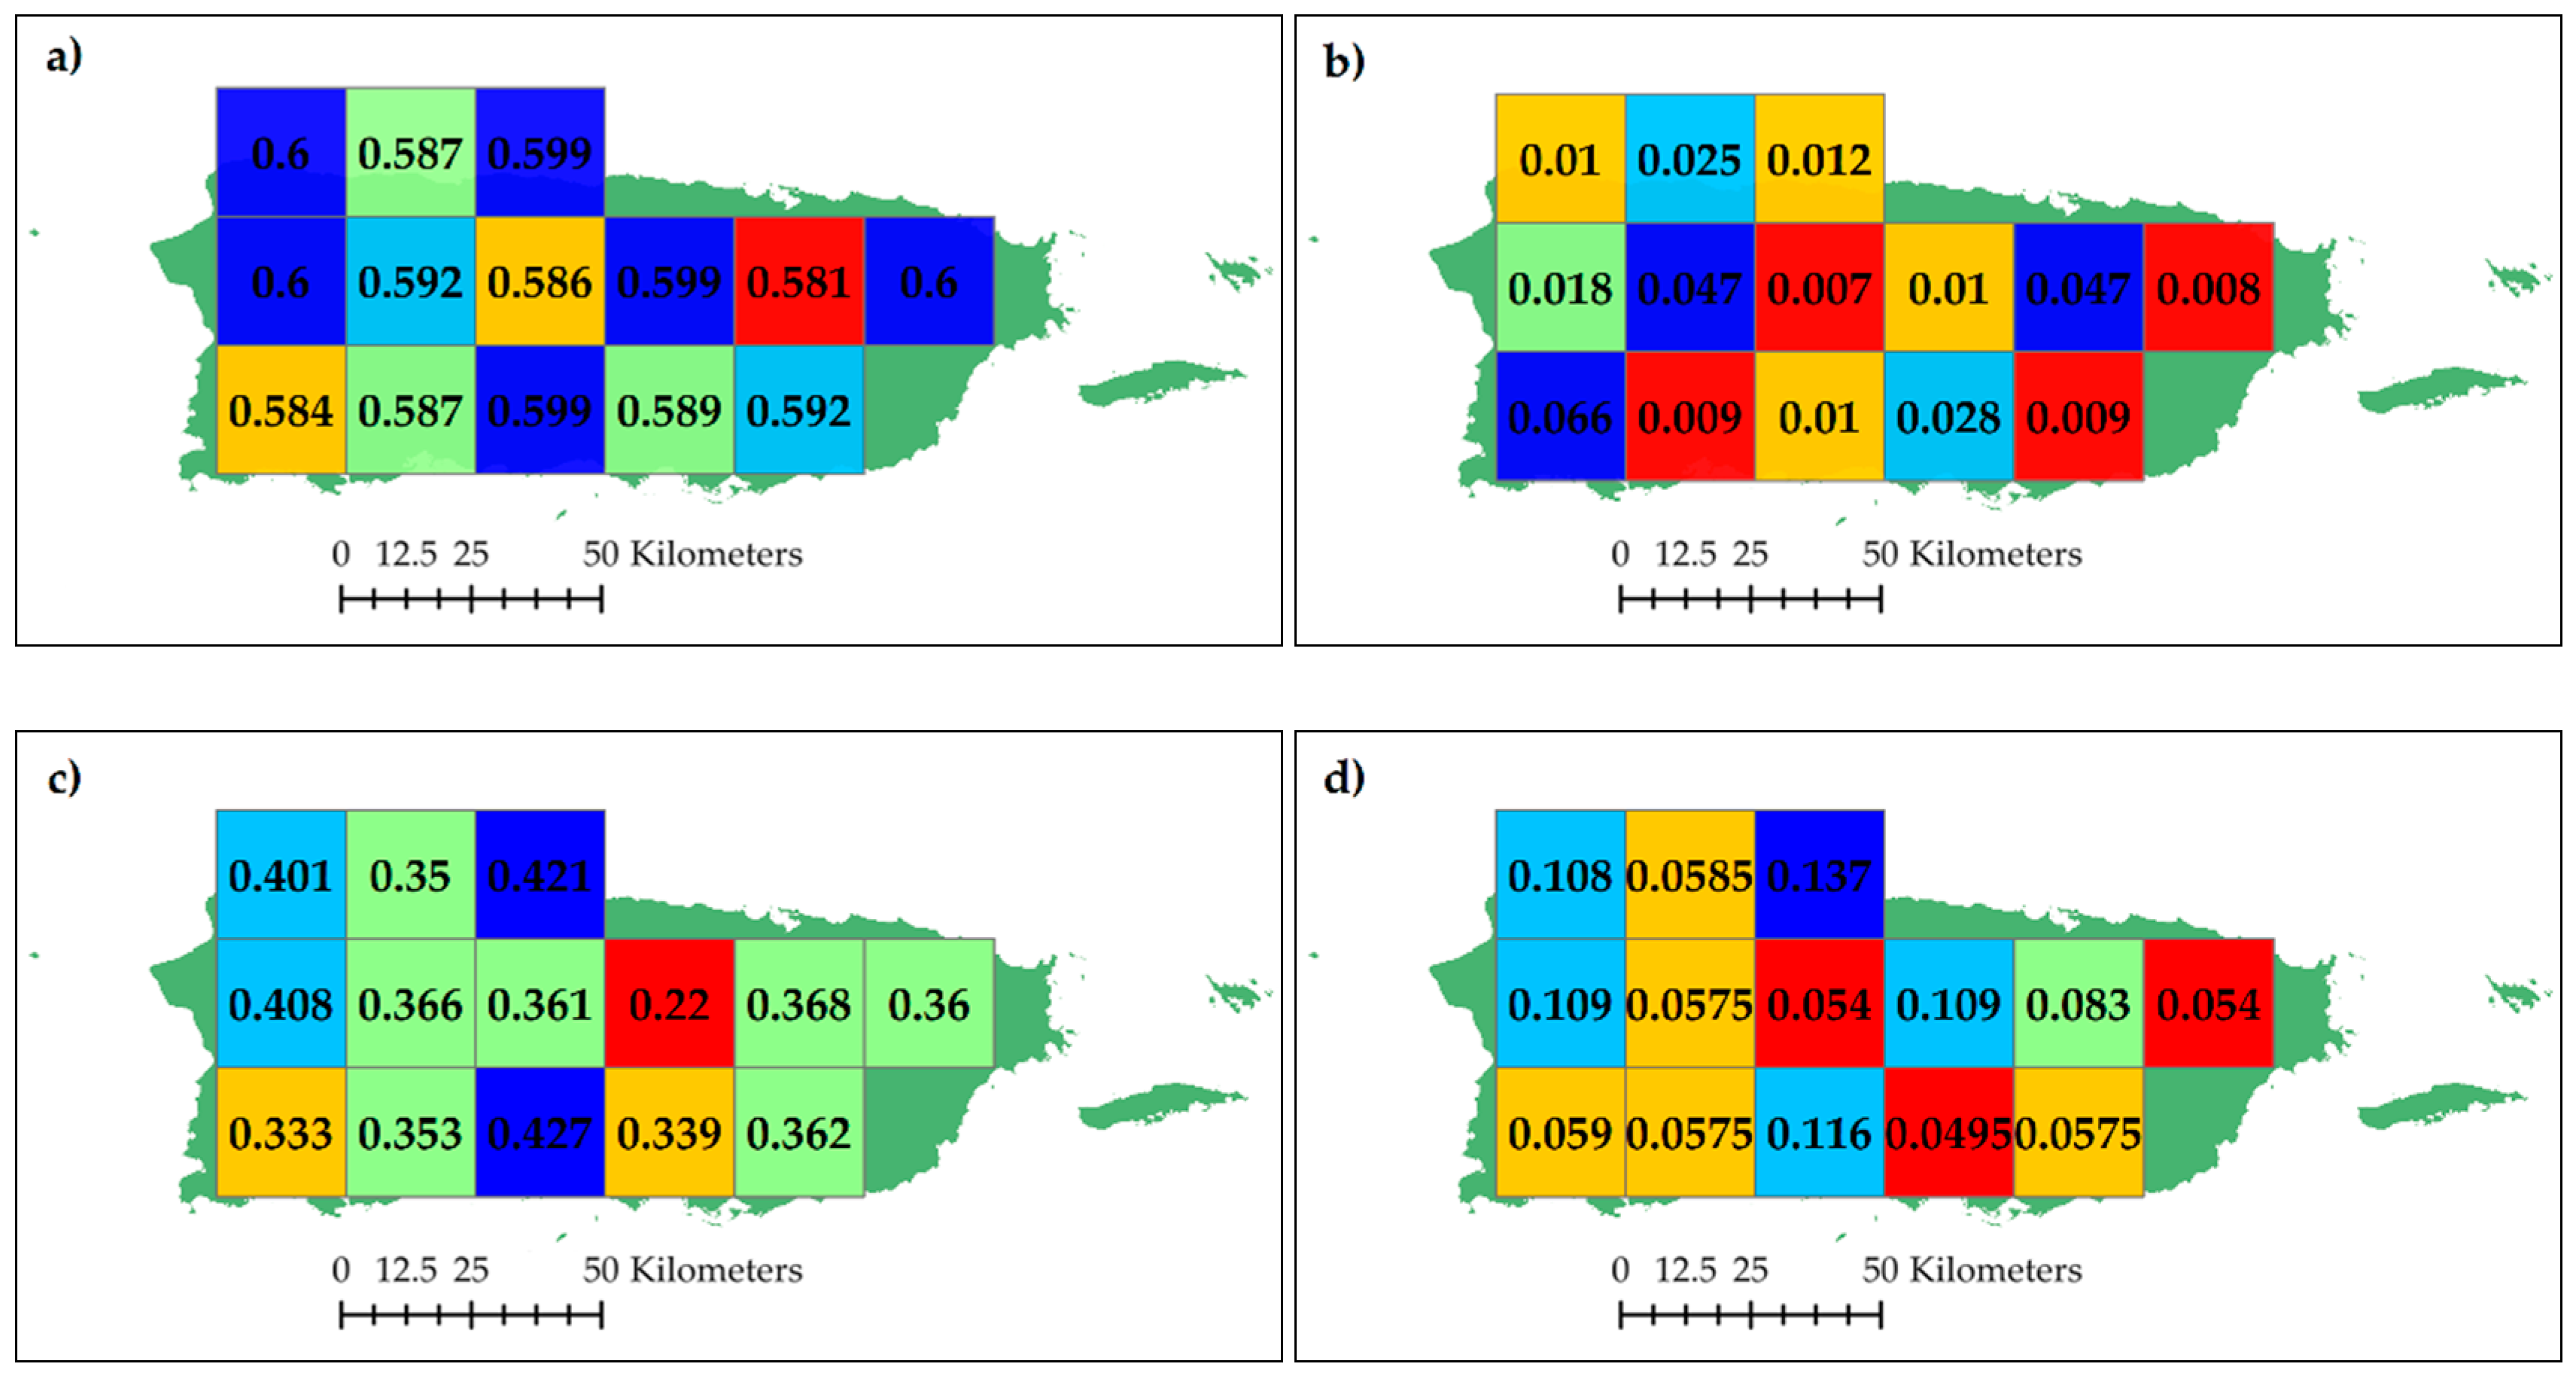
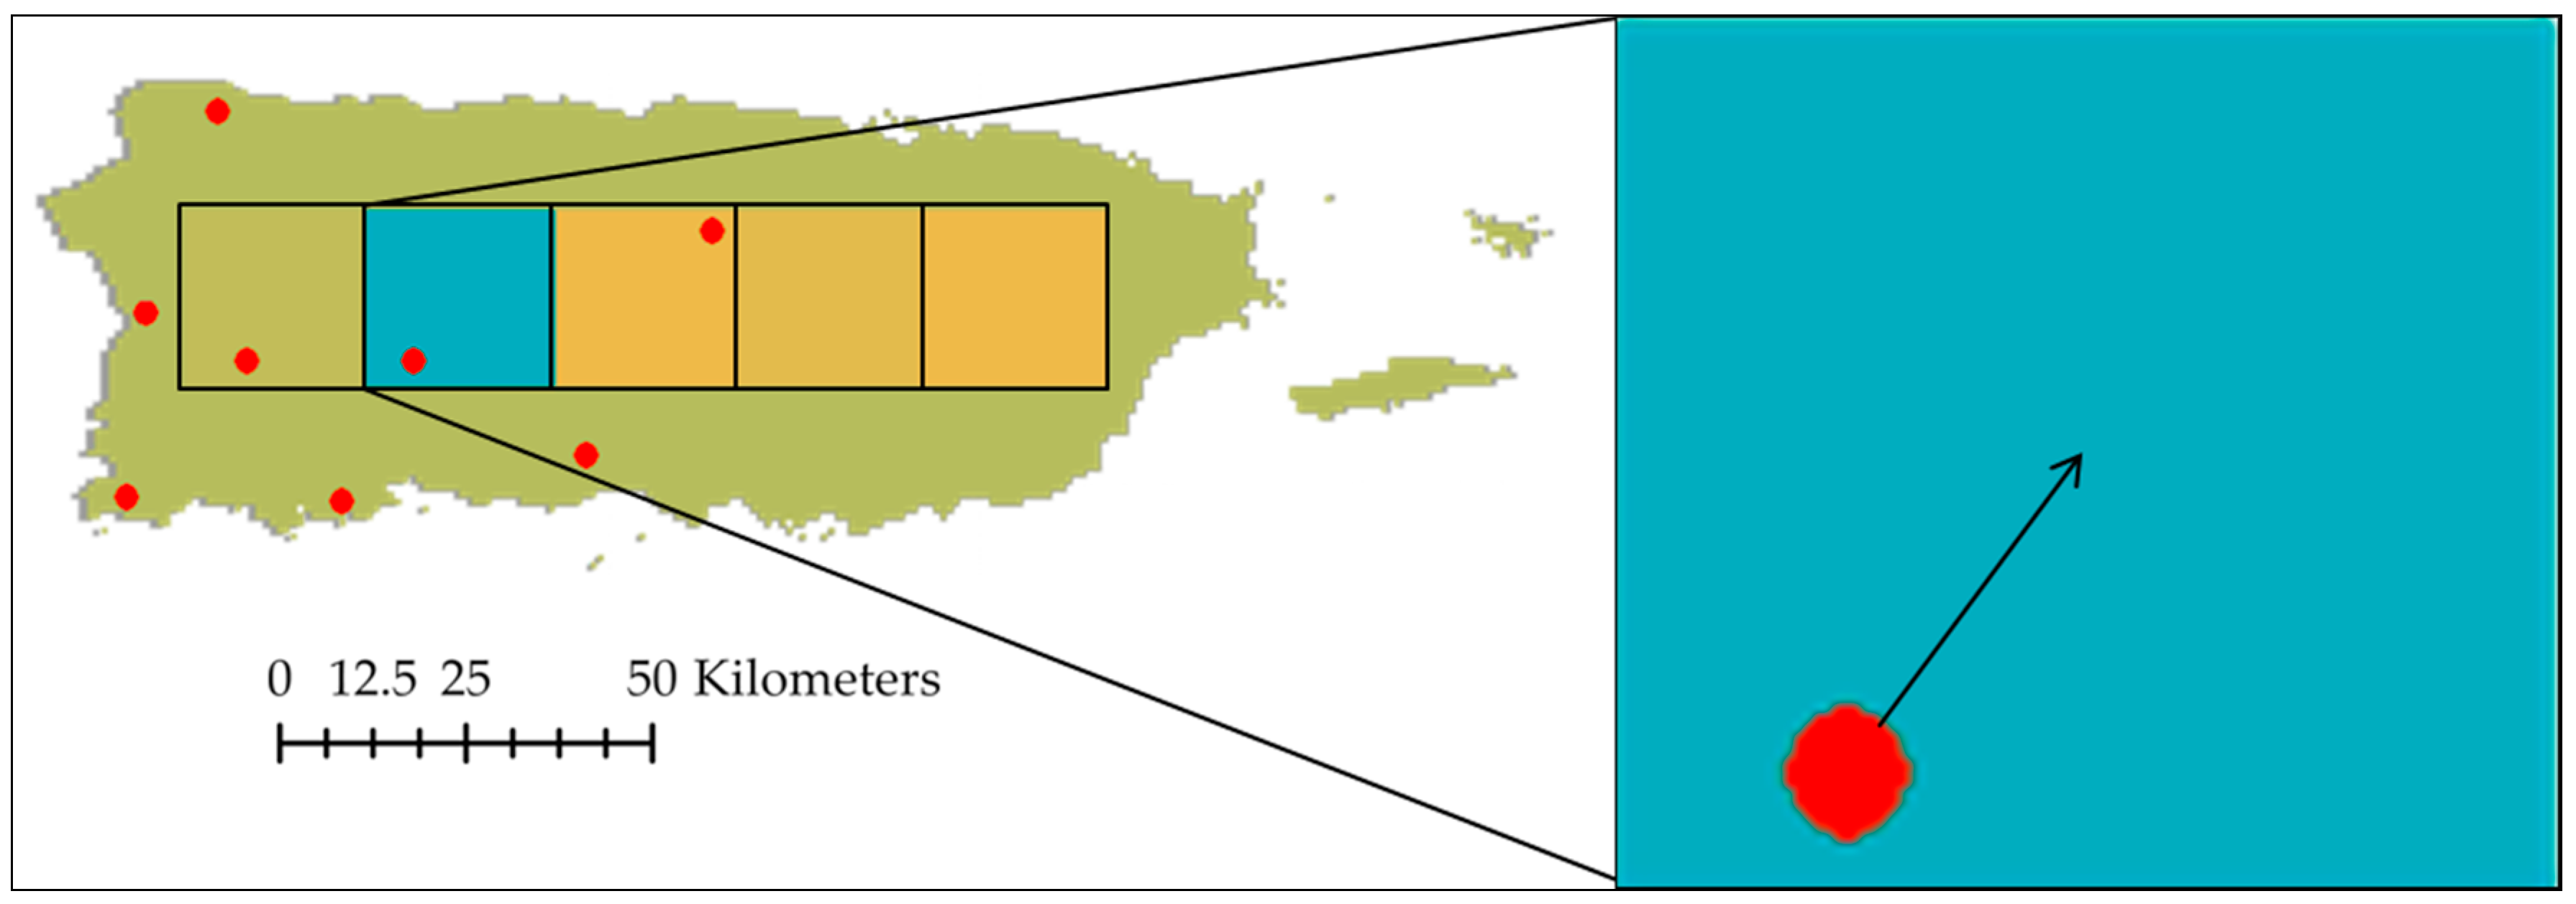
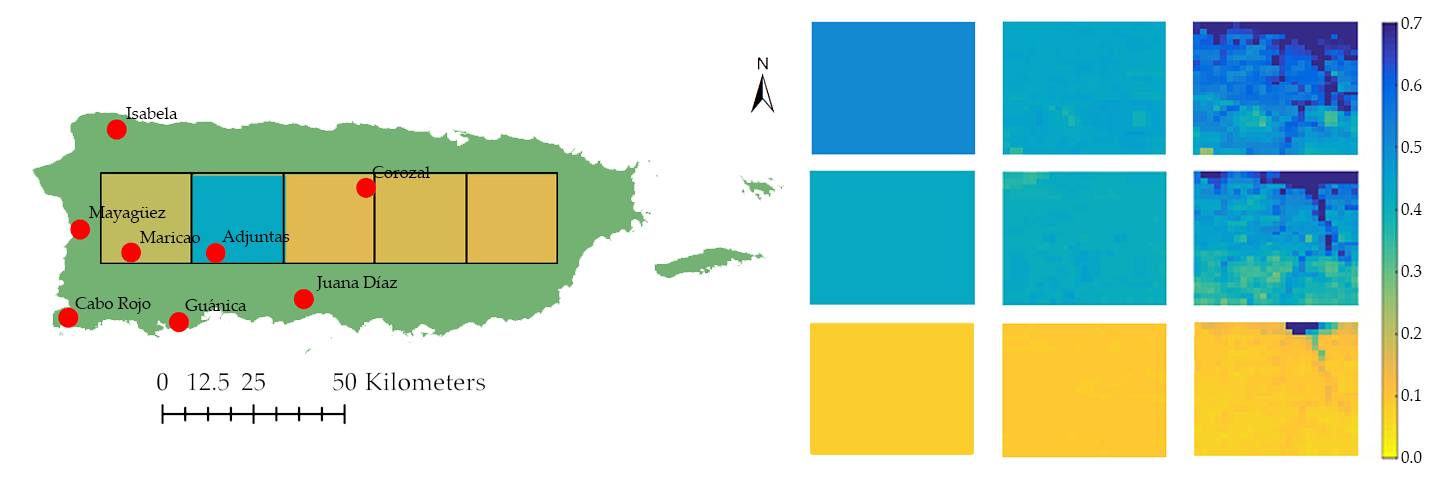
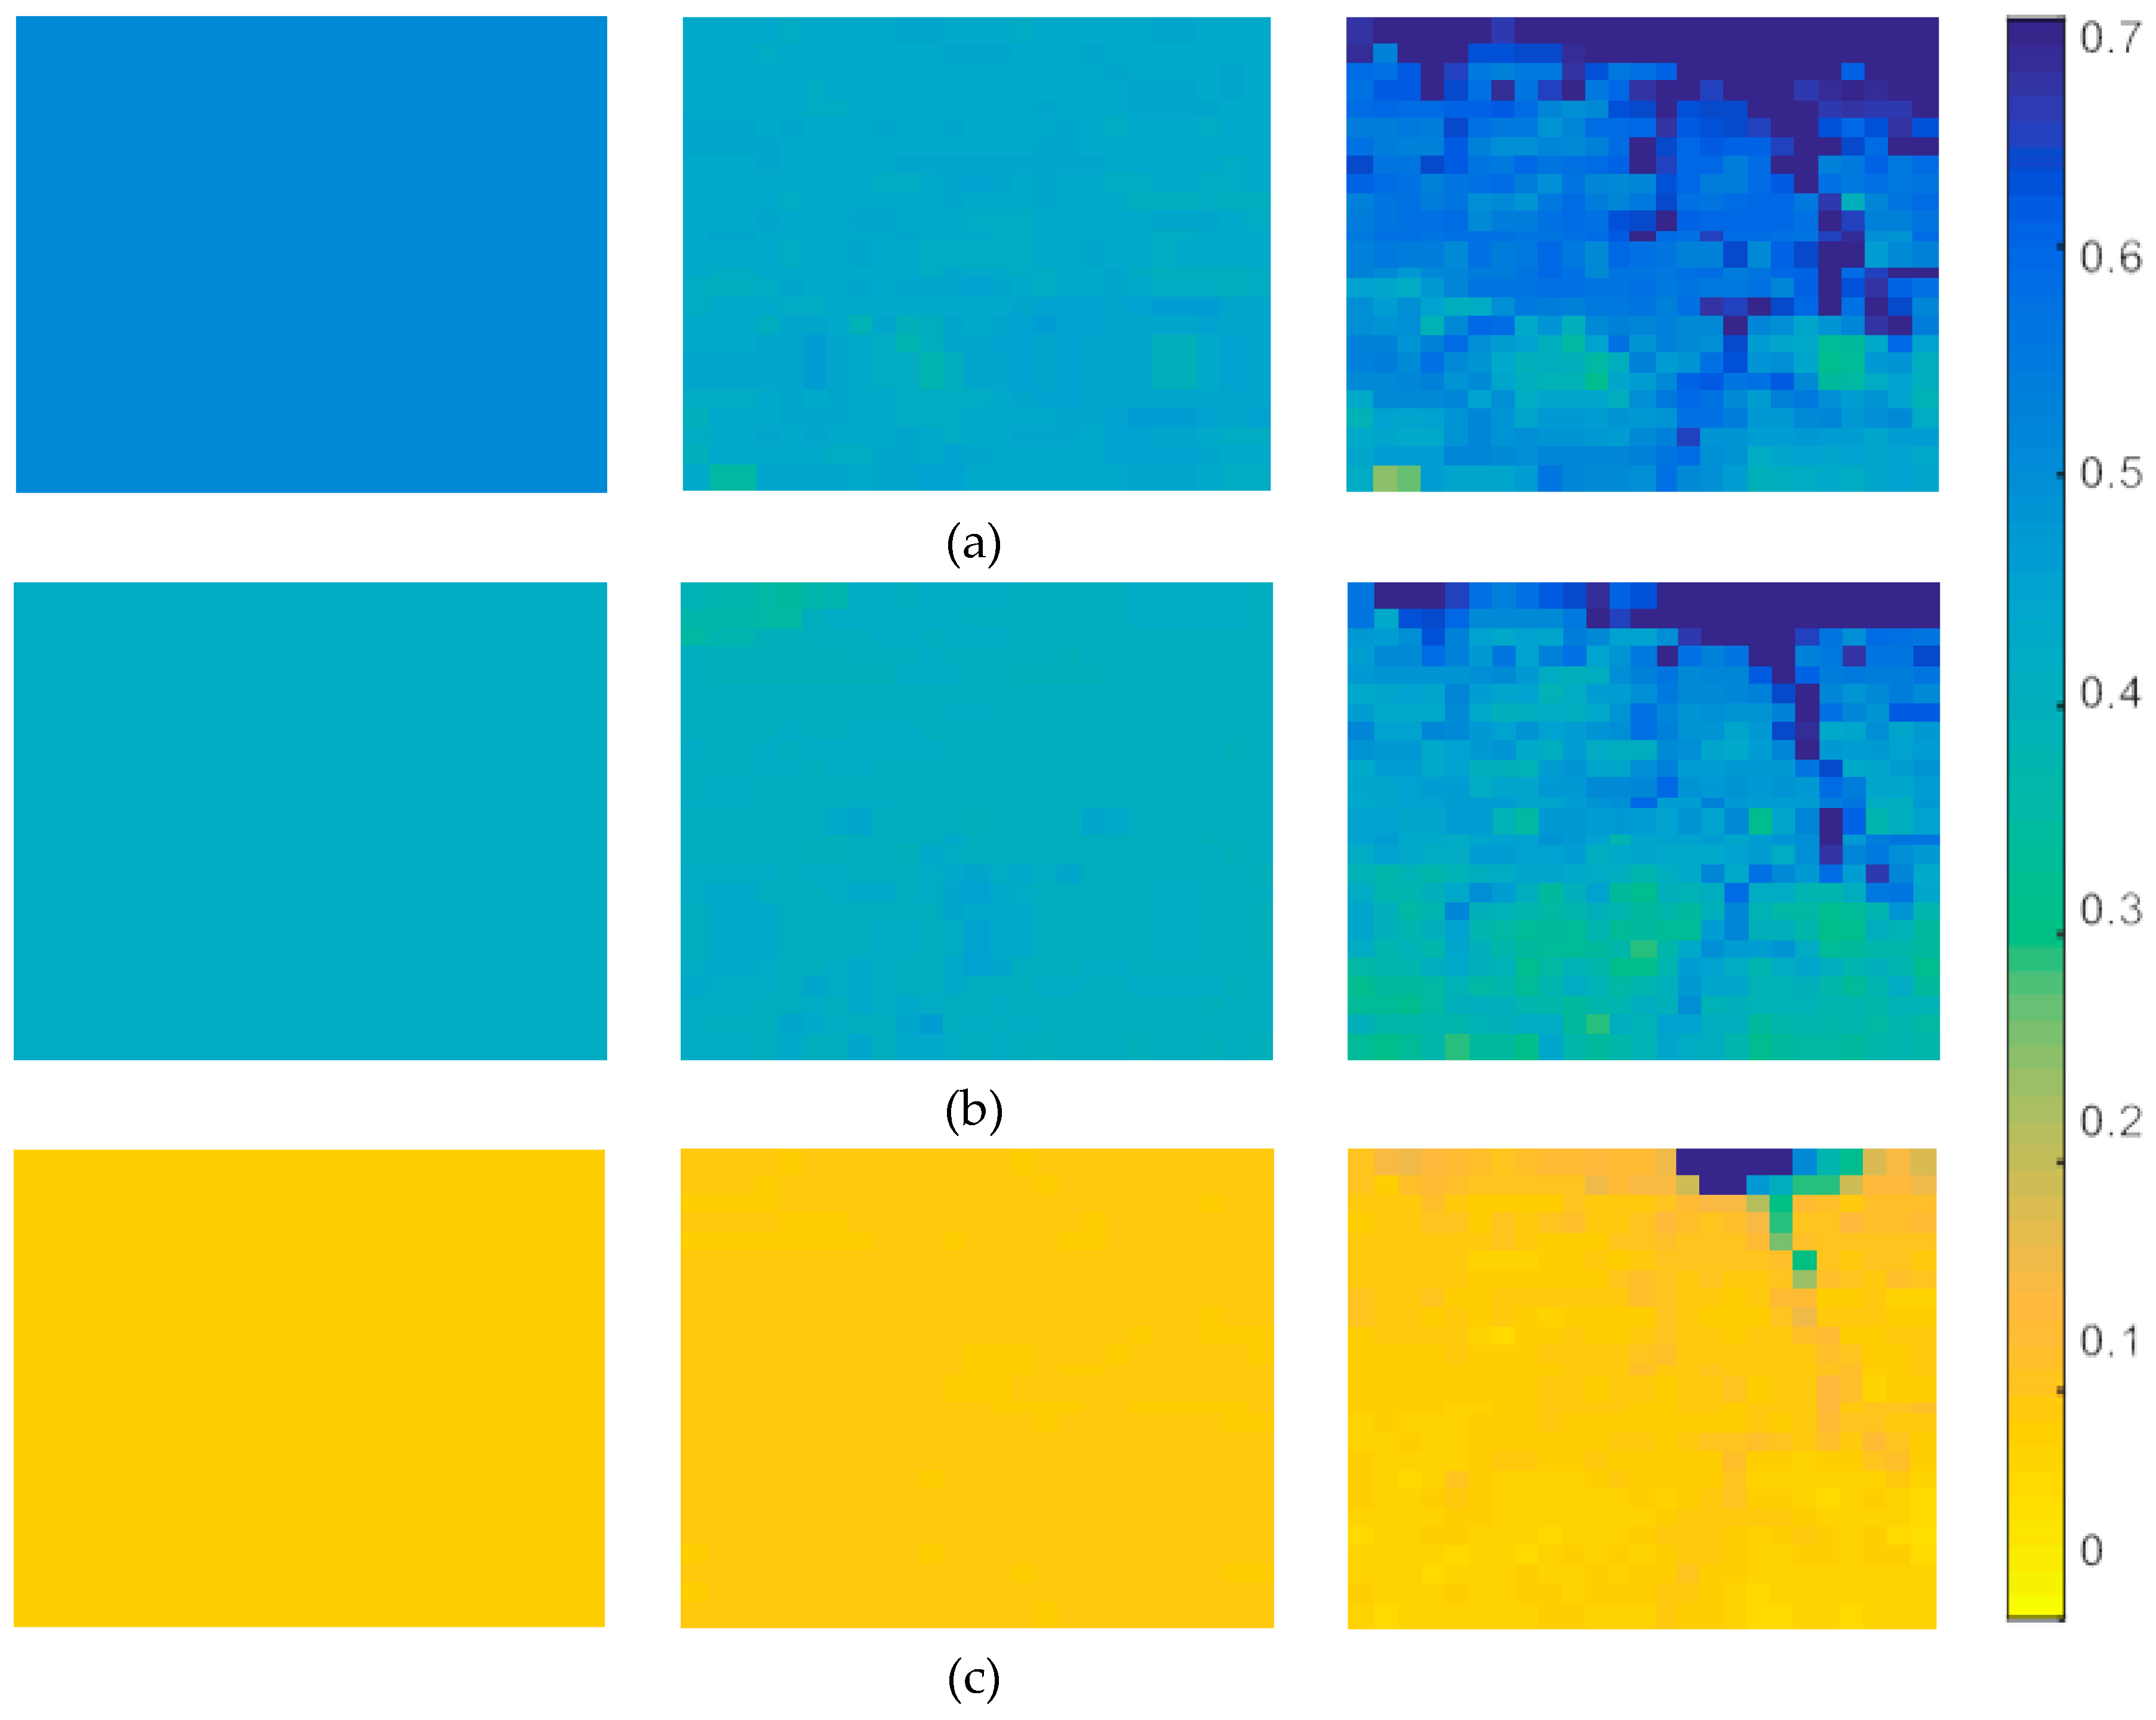
Figure 6 shows a sample 25 km pixel of the AMSR2 SM (left), the downscaled SM using MODIS parameters (center), and the downscaled SM using physical parameters (right) during (a) high humidity (SM ≥ 0.60), (b) moderate humidity (60 > SM > 0.25), and (c) low humidity (SM ≤ 0.20).
When the sand fraction is low, the value of the void fraction is higher, which provides more space for water to infiltrate, and decreases the SM. With changes in elevations, the lowest values accumulate moisture, providing higher SM values. The NDVI provides an estimation of the vegetation density in an area. When the NDVI value is high, more precipitation is intercepted, and more moisture is absorbed by the vegetation, which decreases the SM in the area.
The previous table (Table 7) presents the basic statistics for the comparison between the downscaled SM product using physical parameters and the SCAN–NRCS SM measurements. The outcome of the downscale in terms of correlation and percent of SM values that behaved similar to the SCAN–NRCS measurements was analogous to the results from the first downscaling. The most significant outcome from this downscale technique is the improvement of SM estimation of the Mayagüez SCAN–NRCS station. This improvement happens due to the consideration of the changes in topography, sand fraction, and NDVI in the algorithm, since this particular station is located at the bottom of a hill in an area where precipitation events are frequent.

5. Conclusions

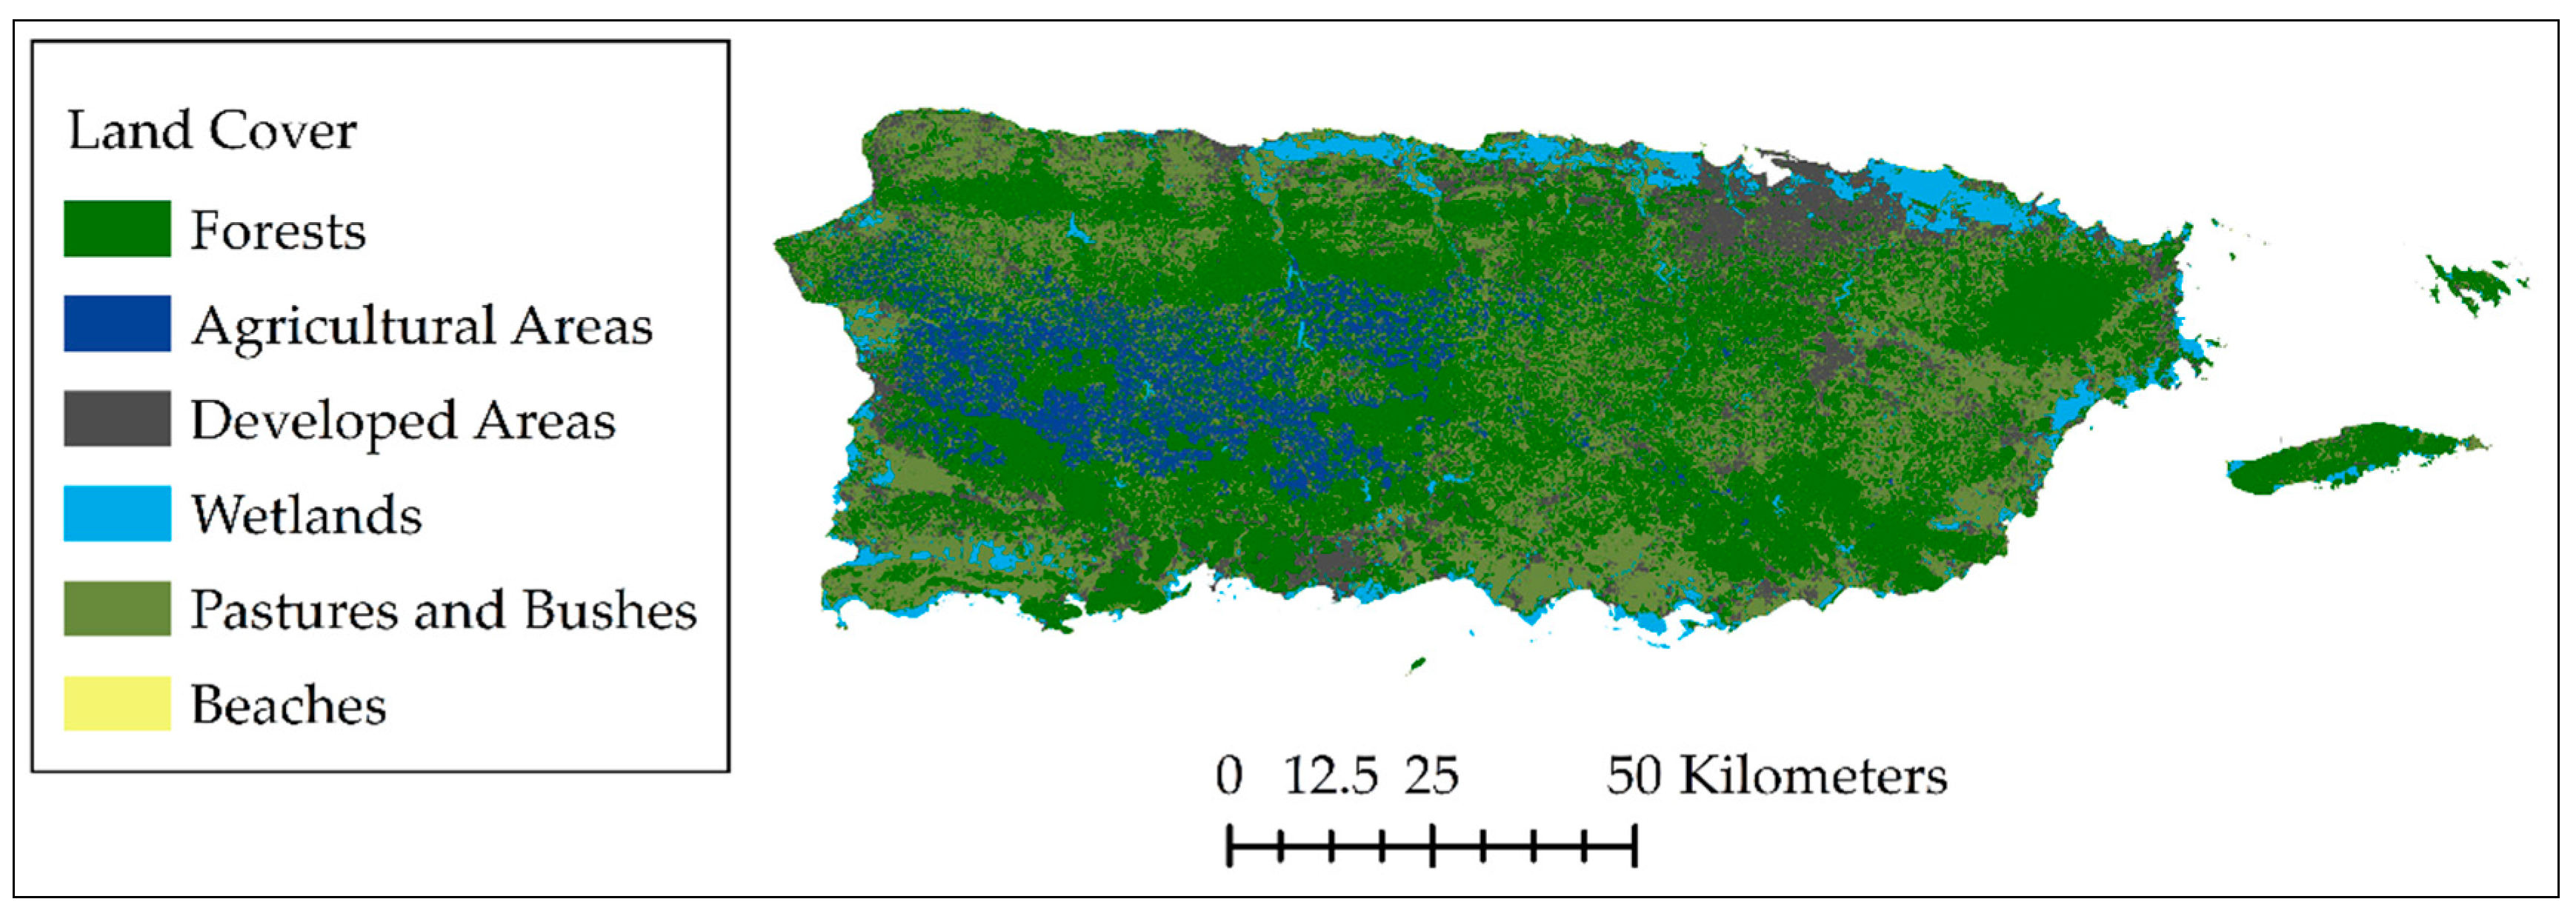
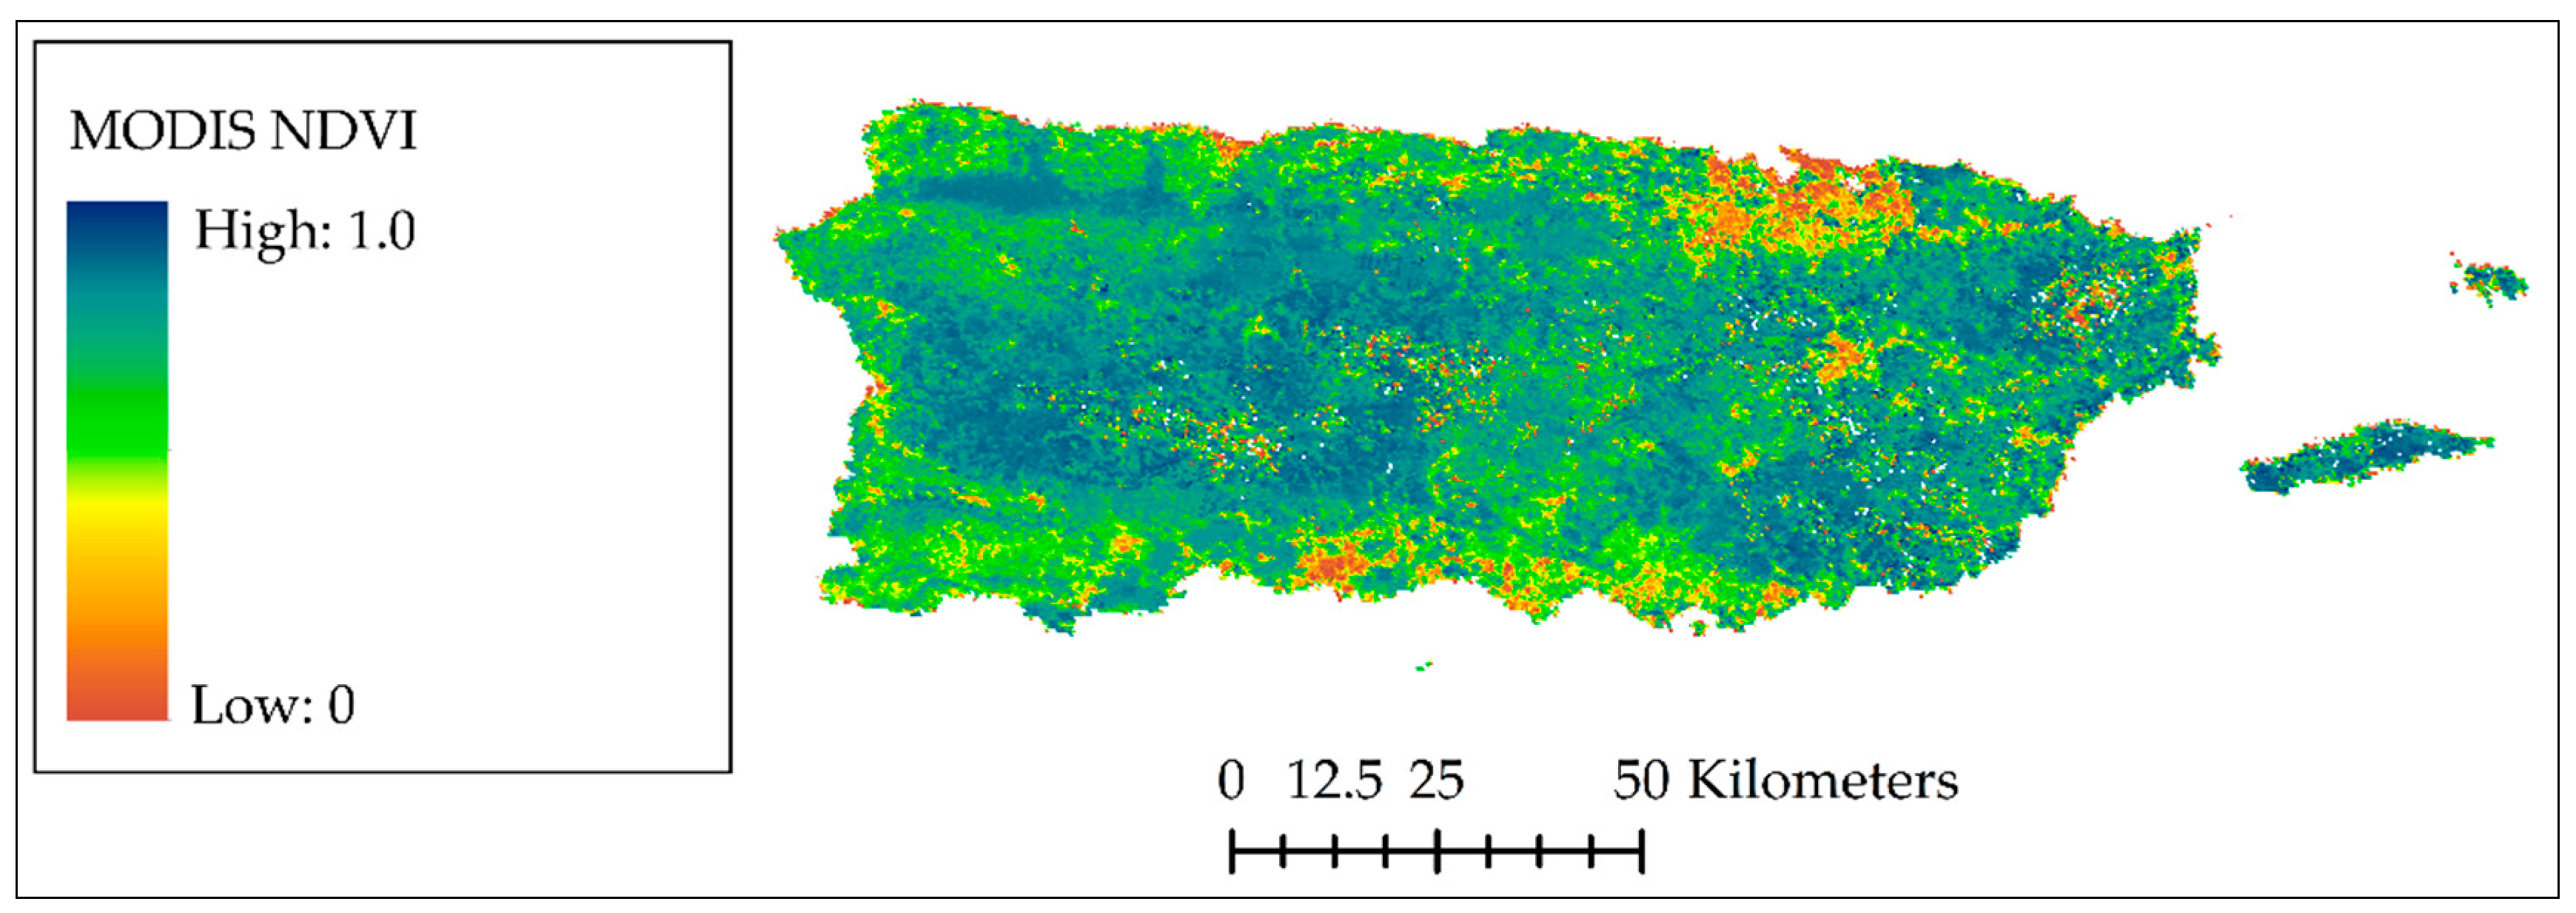
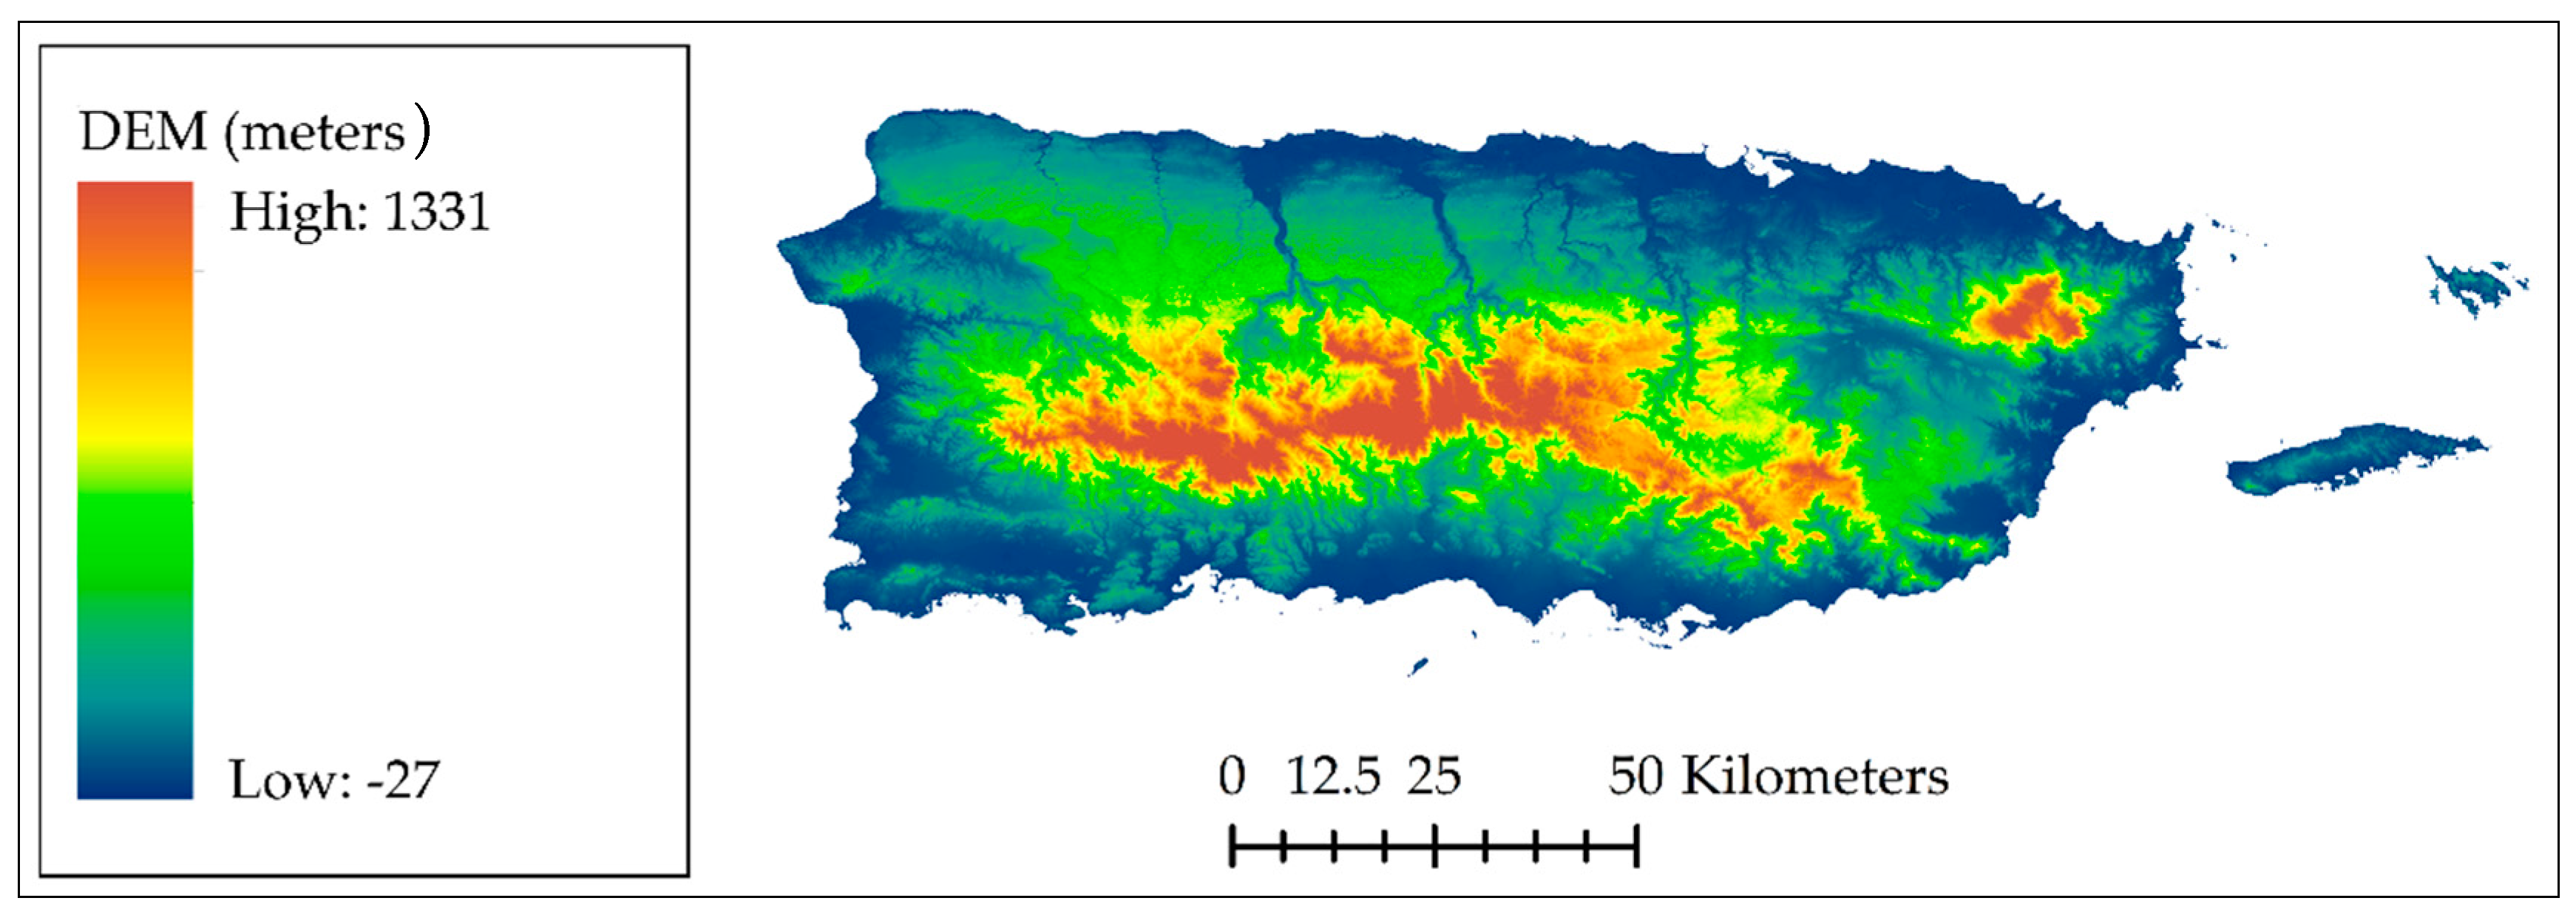
The comparison of AMSR2 SM products at 25 km resolution with the SCAN–NRCS stations revealed that the AMSR2 spatial coverage of 25 km does not provide a good estimate of SM in Puerto Rico. The overall results of the validation show that about 49% of the AMSR2 SM estimates behave similar to the SCAN–NRCS SM measurements, with an overall correlation of 0.613. The low correlation between the coarse resolution estimate and the ground-based measurements is due to changes in land use, vegetation density, topography, soil properties, and precipitation in Puerto Rico (Figure A1, Figure A2, Figure A3, Figure A4 and Figure A5). As well, in order to have a more robust validation, additional field data is needed inside the 25 km pixels.
The downscaling method using MODIS parameters provided a better fit with the AMSR2 data. The resulting SM from the linear equation that relates Albedo, LST, and NDVI from MODIS with the SM from AMSR2 showed a tendency to increase SM where a precipitation event occurred. This enhancement increased the percentage of AMSR2 estimates that behave similar to the ground-based measurements to 55%. To expand the coverage of the AMSR2, a daily average SM value was assumed for the area that was left out of the 25 km grids. This assumption led to the decrease in correlation, and can be modified in future research to assess this issue. The second approach, in which a weighted value of physical parameters was used, provided a better projection of how the SM is distributed throughout the pixel area, increasing the percentage of AMSR2 estimates that behave similar to the ground-based measurements to 56%. By considering sand fraction, elevation, and NDVI as variables to enhance SM estimations of the AMSR2, a significant change was observed where the R in the Mayagüez station increased from 0.647 to 0.955, and the percentage of AMSR2 estimates that behave similar to the ground-based measurements increased from 4% to 42%.
Future research is needed to improve the downscaled products for both methodologies, such as: exploring how the addition of other variables such as precipitation would affect the downscaled product, a comparison of how different vegetation indexes such as the simple ratio infrared index, or the soil-adjusted vegetation index influences the quality of the downscaled products. Other future research will include the optimization of the downscaling techniques through a sensitivity analysis, and the incorporation of a dense network of sensors placed inside the area of coverage of one AMSR2 pixel, in order to provide a better validation of the AMSR2 and the downscaled SM products in Puerto Rico.

Acknowledgments

This study was supported by Puerto Rico Water Resources and Environmental Research Institute operating under Section 104 of the Water Research and Development Act of 1984 (P.L. 98-242), University of Puerto Rico and NOAA grant NA14NES4320003 (Cooperative Institute for Climate and Satellites -CICS) at the University of Maryland/ESSIC. The statements contained within the manuscript/research article are not the opinions of the funding agency or the United States government but reflect the author’s opinions.

Author Contributions

J.N.O. and J.M.-B. were responsible for the data analysis, writing the manuscript, and communicating with the journal. R.T.-C., T.L., and A.F. were responsible for supervising the analysis, structure of the manuscript, and providing key components for discussion on results and conclusions.

Conflicts of Interest

The authors declare no conflict of interest.

Appendix

The following section contains Puerto Rico maps for Land Cover, MODIS NDVI, Elevation, Soil Types, and Precipitation with their respective references.
Figure A1. Land Use map for Puerto Rico (data retrieved from http://www2.pr.gov).
Hydrology 04 00046 g007
Figure A2. MODIS NDVI map for Puerto Rico (data from https://search.earthdata.nasa.gov/search).
Hydrology 04 00046 g008
Figure A3. Elevation Data map for Puerto Rico (DEM data from https://gdg.sc.egov.usda.gov/).
Hydrology 04 00046 g009
Figure A4. Soil Orders map for Puerto Rico (map retrieved from the NRCS Caribbean Area USDA website https://www.nrcs.usda.gov/Internet/FSE_MEDIA/nrcseprd955406.jpg).
Hydrology 04 00046 g010
Figure A5. Precipitation data for Puerto Rico (data retrieved from https://pragwater.com/tag/goes-prweb/).
Hydrology 04 00046 g011

References

  1. Zhuo, L.; Han, D. The Relevance of Soil Moisture by Remote Sensing and Hydrological Modelling. Procedia Eng. 2016, 154, 1368–1375. [Google Scholar] [CrossRef]
  2. Djamai, N.; Magagi, R.; Goïta, K.; Merlin, O.; Kerr, Y.; Roy, A. A combination of DISPATCH downscaling algorithm with CLASS land surface scheme for soil moisture estimation at fine scale during cloudy days. Remote Sens. Environ. 2016, 184, 1–14. [Google Scholar] [CrossRef]
  3. Holgate, C.M.; De Jeu, R.A.; van Dijk, A.I.; Liu, Y.Y.; Renzullo, L.J.; Dharssi, I.; Parinussa, R.M.; Van Der Schalie, R.; Gevaert, A.; et al. Comparison of remotely sensed and modelled soil moisture data sets across Australia. Remote Sens. Environ. 2016, 186, 479–500. [Google Scholar] [CrossRef]
  4. Entekhabi, D.; Njoku, E.G.; O’Neill, P.E.; Kellogg, K.H.; Crow, W.T.; Edelstein, W.N.; Entin, J.K.; Goodman, S.D.; Jackson, T.J.; Johnson, J.; et al. The Soil Moisture Active Passive (SMAP) Mission. Proc. IEEE 2010, 98, 704–716. [Google Scholar] [CrossRef]
  5. Song, C.; Jia, L.; Menenti, M. Retrieving High-Resolution Surface Soil Moisture by Downscaling AMSR-E Brightness Temperature Using MODIS LST and NDVI Data. IEEE J. Sel. Top. Appl. Earth Obs. Remote Sens. 2014, 7, 935–942. [Google Scholar] [CrossRef]
  6. Kawaguchi, M.; Yoshida, T. Regular Observation by Global Change Observation Mission 1st-Water GCOM-W1 (Shizuku). NEC Tech. J. 2013, 8, 32–35. [Google Scholar]
  7. Soulis, K.X.; Elmaloglou, S.; Dercas, N. Investigating the effects of soil moisture sensors positioning and accuracy on soil moisture based drip irrigation scheduling systems. Agric. Water Manag. 2015, 148, 258–268. [Google Scholar] [CrossRef]
  8. Peng, F.; Mu, M.; Sun, G. Responses of soil moisture to climate change based on projections by the end of the 21st century under the high emission scenario in the ‘Huang-Huai-Hai Plain’ region of China. J. Hydro-Environ. Res. 2017, 14, 105–118. [Google Scholar] [CrossRef]
  9. Dong, J.; Ochsner, T.E.; Zreda, M.; Cosh, M.H.; Zou, C.B. Calibration and Validation of the COSMOS Rover for Surface Soil Moisture Measurement. Vadose Zone J. 2014, 13, 2624–2636. [Google Scholar] [CrossRef]
  10. Ranney, K.J.; Niemann, J.D.; Lehman, B.M.; Green, T.R.; Jones, A.S. A method to downscale soil moisture to fine resolutions using topographic, vegetation, and soil data. Adv. Water Resour. 2015, 76, 81–96. [Google Scholar] [CrossRef]
  11. Das, N.N. Modeling and Application of Soil Moisture at Varying Spatial Scales with Parameter Scaling; Texas A&M University: College Station, TX, USA, 2008. [Google Scholar]
  12. Liang, X.; Lettenmaier, D.P. A simple hydrologically based model of land surface water and energy fluxes for general circulation models. J. Geophys. Res. 1994, 99, 14415–14428. [Google Scholar] [CrossRef]
  13. Dumedah, G.; Walker, J.P. Assessment of model behavior and acceptable forcing data uncertainty in the context of land surface soil moisture estimation. Adv. Water Resour. 2017, 101, 23–36. [Google Scholar] [CrossRef]
  14. Lillesand, T.M. Remote Sensing and Image Interpretation, 5th ed.; Wiley: Hoboken, NJ, USA, 2007. [Google Scholar]
  15. Elachi, C. Introduction to the Physics and Techniques of Remote Sensing; Wiley Interscience: Hoboken, NJ, USA, 1987. [Google Scholar]
  16. Jensen, J.R. Remote Sensing of the Environment—An Earth Resource Perspective; Pearson: London, UK, 1999. [Google Scholar]
  17. Aziz, F.A. Effect of Water Content on Brightness Temperature and Emissivity of Soil for Passive Remote Sensing Applications. Iraqi Natl. J. Earth Sci. 2014, 14, 1–18. [Google Scholar]
  18. Cihlar, J.; Ulaby, F.T. Dielectric Properties of Soils as a Function of Moisture Content; NASA: Washington, DC, USA, 1974.
  19. Ulaby, F.T.; Moore, R.K.; Fung, A.K. Microwave Remote Sensing, Active Passive—Volume III; Remote Sensing Series; Artech House: Norwood, MA, USA, 1986. [Google Scholar]
  20. Jackson, T.J.; Cosh, M.H.; Bindlish, R.; Starks, P.J.; Bosch, D.D.; Seyfried, M.; Goodrich, D.C.; Moran, M.S.; Du, J. Validation of Advanced Microwave Scanning Radiometer Soil Moisture Products. IEEE Trans. Geosci. Remote Sens. 2010, 48, 4256–4272. [Google Scholar] [CrossRef]
  21. Yan, H.; DeChant, C.M.; Moradkhani, H. Improving Soil Moisture Profile Prediction with the Particle Filter-Markov Chain Monte Carlo Method. IEEE Trans. Geosci. Remote Sens. 2015, 53, 6134–6147. [Google Scholar] [CrossRef]
  22. Kumar, S.V.; Peters-Lidard, C.D.; Santanello, J.A.; Reichle, R.H.; Draper, C.S.; Koster, R.D.; Nearing, G.; Jasinski, M.F. Evaluating the utility of satellite soil moisture retrievals over irrigated areas and the ability of land data assimilation methods to correct for unmodeled processes. Hydrol. Earth Syst. Sci. 2015, 19, 4463–4478. [Google Scholar] [CrossRef]
  23. Ahmadalipour, A.; Moradkhani, H.; Yan, H.; Zarekarizi, M. Remote Sensing of Drought: Vegetation, Soil Moisture, and Data Assimilation. In Remote Sensing of Hydrological Extremes; Springer: Basel, Switzerland, 2017; pp. 121–149. [Google Scholar]
  24. Hihara, T.; Kubota, M.; Okuro, A. Evaluation of sea surface temperature and wind speed observed by GCOM-W1/AMSR2 using in situ data and global products. Remote Sens. Environ. 2015, 164, 170–178. [Google Scholar] [CrossRef]
  25. Japan Aerospace Exploration Agency (JAXA). GCOM-W1 “SHIZUKU” Data Users Handbook; JAXA: Chōfu, Tokyo, 2013. [Google Scholar]
  26. Triola, M.F. Elementary Statistics, 10th ed.; Pearson: London, UK, 2008. [Google Scholar]
  27. Chauhan, N.S.; Miler, S.; Aradny, P. Spaceborn Soil Moisture Estimation at High Resolution: A Microwave-Optical/IR Synergistic Approach. Int. J. Remote Sens. 2003, 24, 4599–4622. [Google Scholar] [CrossRef]
Figure 1. Basic statistics for ascending and descending overpasses Advanced Microwave Scanning Radiometer 2 (AMSR2) 25 km soil moisture (SM) (cm3/cm3) products from September 2012 to January 2017: (a) maximum; (b) minimum; (c) mean; and (d) standard deviation.
Hydrology 04 00046 g001
Figure 2. Location of all Soil Climate Analysis Network (SCAN)–Natural Resources Conservation Service (NRCS) stations over Puerto Rico.
Hydrology 04 00046 g002
Figure 3. Moderate Resolution Imaging Spectroradiometer (MODIS) product at 1 km resolution over Puerto Rico: (a) Albedo, (b) Land Surface Temperature (LST) (K); and (c) Normalized Difference of Vegetation Index (NDVI).
Hydrology 04 00046 g003
Figure 4. A sample for the matching of the SCAN–NRCS station with the closest AMSR2 SM pixel.
Hydrology 04 00046 g004
Figure 5. Sample of downscaled AMSR2 SM (cm3/cm3) values over PR using MODIS parameters.
Hydrology 04 00046 g005
Figure 6. AMSR2 25 km SM (cm3/cm3) value (left), AMSR2 SM downscaled using MODIS (middle), and AMSR2 SM downscaled using physical parameters for (a) high humidity; (b) moderate humidity; and (c) low humidity.
Hydrology 04 00046 g006
Table 1. Basic statistics for each SCAN–NRCS station and the ascending AMSR2 SM products.
AscendingMaximumMinimumMeanStd. Deviation
StationNRCSAMSR2NRCSAMSR2NRCSAMSR2NRCSAMSR2
Adjuntas0.6150.6000.1230.0090.3820.1690.1420.137
Cabo Rojo0.3570.5990.1080.0090.1730.1370.0510.138
Corozal0.5710.5420.1200.0080.3650.1190.1220.078
Guánica0.3570.6000.0070.0090.0710.1810.0600.140
Isabela0.4990.5870.1200.0090.3130.1220.0830.103
Juana Díaz0.5120.5990.1160.0100.2160.1610.0710.136
Maricao0.4150.5990.0810.0090.1990.1370.0800.138
Mayagüez0.5850.5870.4540.0090.5520.1340.0240.111
Table 2. Basic statistics for each SCAN–NRCS station and the descending AMSR2 SM products.
DescendingMaximumMinimumMeanStd. Deviation
StationNRCSAMSR2NRCSAMSR2NRCSAMSR2NRCSAMSR2
Adjuntas0.6330.5770.1190.0210.3790.1640.1390.109
Cabo Rojo0.3480.5980.1090.0100.1680.1400.0510.097
Corozal0.5640.5810.1260.0160.3720.1350.1190.091
Guánica0.3220.5760.0030.0220.0690.1690.0580.110
Isabela0.4780.5840.1160.0120.3130.1540.0850.103
Juana Díaz0.5120.5860.1100.0160.2130.1630.0750.111
Maricao0.3980.5980.0820.0100.2020.1440.0810.105
Mayagüez0.5840.5770.4540.0250.5510.1570.0240.104
Table 3. Basic statistics for each SCAN–NRCS station and the ascending AMSR2 SM products.
Station(%)Distance (km)MERMSER
Adjuntas329.00.0740.0810.823
Cabo Rojo7424.90.0790.0870.273
Corozal279.60.0750.0860.777
Guánica6718.80.0630.0750.470
Isabela3012.60.0850.0950.776
Juana Díaz6810.60.0770.0870.490
Maricao7111.90.0810.0900.590
Mayagüez418.30.0890.1030.559
Table 4. Basic statistics for each SCAN–NRCS station and the descending AMSR2 SM products.
Station(%)Distance (km)MERMSER
Adjuntas336.10.0760.0870.765
Cabo Rojo8721.40.0640.0760.356
Corozal2710.30.0690.0800.829
Guánica7016.10.0650.0770.421
Isabela408.80.0830.0930.758
Juana Díaz7310.70.0720.0830.552
Maricao808.00.0670.0780.630
Mayagüez314.60.0560.0750.735
Table 5. Calculated values and T-statistics of the regression coefficients.
CoefficientValueSquared ErrorT-StatisticP (%)
a0000.150.005349.120.0014
a1001.33 × 10−43.66 × 10−52.980.1432
a0104.70 × 10−51.84 × 10−51.970.1276
a001−1.06 × 10−66.67 × 10−7−1.660.1113
a110−4.28 × 10−71.01 × 10−7−3.240.1354
a1017.31 × 10−101.89 × 10⁻⁹−0.120.2927
a011−3.20 × 10−92.31 × 10−90.110.1160
Table 6. Basic statistics for the comparison of each SCAN–NRCS station and the downscaled AMSR2 SM products using Albedo, NDVI, and LST.
AscendingDescending
Station(%)MERMSER(%)MERMSER
Adjuntas340.0760.0880.607330.0740.0850.725
Cabo Rojo840.0630.0750.243880.0540.0660.253
Corozal350.0710.0820.731310.0690.0810.755
Guánica760.0700.0810.455810.0760.0850.604
Isabela420.0790.0910.643420.0790.0900.661
Juana Díaz770.0700.0810.390800.0620.0740.424
Maricao860.0660.0770.529880.0550.0660.634
Mayagüez20.1060.1120.66520.0740.0850.807
Table 7. Basic statistics for the comparison of each SCAN–NRCS station and the downscaled AMSR2 SM products using sand fraction, elevation, and NDVI.
AscendingDescending
Station(%)MERMSER(%)MERMSER
Adjuntas320.0800.0910.820220.0790.0910.786
Cabo Rojo730.0720.0830.423740.0740.0830.348
Corozal370.0820.0920.777400.0810.0900.699
Guánica720.0750.0850.378790.0790.0860.341
Isabela420.0840.0930.672410.0810.0900.688
Juana Díaz710.0740.0850.389710.0710.0810.410
Maricao770.0640.0750.516880.0720.0830.205
Mayagüez290.0880.0950.965550.0870.0910.945

