Assessing the Impacts of Climate Change on River Discharge Dynamics in Oueme River Basin (Benin, West Africa)

Laboratory of Applied Hydrology, University of Abomey-Calavi (UAC), Cotonou 01 BP 4521, Benin
Hydrology 2017, 4(4), 47; https://doi.org/10.3390/hydrology4040047
Submission received: 27 September 2017
/
Revised: 20 October 2017
/
Accepted: 24 October 2017
/
Published: 25 October 2017
(This article belongs to the Special Issue Climatic Change Impact on Hydrology)
Abstract
:Understanding the impacts of climate change on water resources is of utmost importance to successful water management and further adaptations strategies. The objective of this paper is to assess the impacts of climate change on river discharge dynamics in Oueme River basin in Benin. To this end, this paper used the distribution based scaling approach to improve usability of regional climate model projections for hydrological climate change impacts studies. Hydrological simulations in Bétérou and Bonou sub-catchments of the Oueme River were carried out with a lumped conceptual hydrological model. The main contribution of this paper is to use the hydrological model based on the least action principle (HyMoLAP), which is designed to minimize uncertainties related to the rainfall-runoff process and scaling law, for this assessment. The bias correction approach allows reducing the differences between the observed rainfall and the regional climate model (HIRHAM5 and RCA4) rainfall data. Corrected and raw HIRHAM5 and RCA4 rainfall data were compared with the observed rainfall using Mean Absolute Error (MAE) and Root Mean Square error (RMSE). The results of the bias correction show a decrease in the RMSE and MAE of the raw HIRHAM5 and RCA4 rainfall data of approximately 91% to 98% in both catchments. The results of the simulation indicate that the HyMoLAP is suitable for modelling river discharge in the Oueme River basin. For the future projection based on RCP4.5 scenarios, the projected mean annual river discharge by using HIRHAM5 and RCA4 in Bétérou and Bonou decrease with the magnitude ranging respectively from −25% to −39% and −20% to −37% in the three time horizons 2020s (2011–2040), 2050s (2041–2070) and 2080s (2071–2100), representing the early, middle and late of 21st century. As regards the future projection based on RCP8.5 scenarios, the projected mean annual river discharge by using HIRHAM5 and RCA4 in Bétérou and Bonou decrease with the magnitude ranging respectively from −15% to −34% and −18% to −36% in the three time horizons. The model uncertainties projections indicated that the entire discharge distribution shifted toward more extreme events (such as drought) compared to the baseline period.
1. Introduction
Water resources are fundamental for many sectors in West Africa, including agriculture, power generation and fisheries. One of the major challenges with climate change is its impact on water resources and extreme hydrological events. Extreme precipitation is projected to increase significantly, especially in regions that are already relatively wet under present climate conditions, whereas dry spells are predicted to increase particularly in regions characterized by dry conditions in present-day climate [1,2]. Indeed, the last decades have witnessed an increasing concern among the international scientific community about climate change and its impacts on hydrological cycle [3]. Today, evidence has been gained that the planet is warming up, largely as a result of human generated greenhouse gases [4,5]. Therefore, managing water resources is more challenging than ever, largely due to the risks associated with the multiple types of uncertainty (i.e., aleatory and epistemic) [6].
Since the seventies Sub-Saharan Africa and in particular West Africa is facing water related uncertainties posed by global change pressure. A shortage in rainfall ranging from 20% to 30% was observed throughout the region, which led to a decrease in river flows ranging from 40% to 60% [7] and an increasing vulnerability to natural disasters. All sectors depending on water availability are now highly vulnerable to the impacts of climate change. Nowadays, floods and flash floods occur more frequently with greater intensity and have become one of the most devastating natural hazards in West African countries. In 2009 severe flooding were observed in Burkina-Faso and Mali; in 2010 flood disaster affected more than 680,000 people and caused the death of 46 people in Benin [8]. In 2012, “Killer floods” inducing more than 50 fatalities each occurred in Niger and Nigeria [5]. Moreover, the hydrology in Benin is caused by a unimodal rainy season in the North, while it is caused by a bimodal rainy season in the South. So exploring the impacts of projected climate change on river discharge in southern and northern Benin will be interesting. This will be helpful to efficiently adapt to the extreme events that result from climate change.
Amidst serious concerns over climate change, the Intergovernmental Panel on Climate Change (IPCC) published its 4th report in 2007. The report suggests that it will be as important to promote “adaptation” to the impacts of global warming as to promote “mitigation” since global warming “mitigation” centered around the reduction of greenhouse gases has limitations, and global warming impacts would continue over centuries even when “mitigation” is implemented. Temperature and precipitation projections, in different scenarios, showed that climate change will have different impacts on the regions of the globe, with spatio-temporal changes in the occurrence and amounts of rainfall, but usually with increasing temperature [9,10,11,12,13,14]. Therefore, the impacts of climate change vary according to regions and populations with space and time, depending on multiple factors, including non-climate stress and the extent of mitigation and adaptation [4].
Global climate models (GCM) are useful tools for simulating climate systems and developing climate change research, which generate possible future climate scenarios. Within the IPCC AR5 (Intergovernmental Panel on Climate Change, Fifth Assessment Report) water sector, most hydrological projection studies use the precipitation and temperature downscaled from GCM to driven hydrological models. From these studies, it is abundantly clear that climate change has the potential to substantially impact water resources. It highlights the uncertainties in projected changes to river runoff constrained by the uncertainties in regional climate projections. Generally, GCM are considered to be the largest source of uncertainty for quantifying the impacts of climate change revealed by previous research [15,16,17,18,19]. Considering the usefulness of climate scenarios for the decision-making and substantial uncertainties in climate projection, better quantification of the uncertainties is helpful to reduce the future risk and adopt adaptive water management.
In the recent past, the assessment of climate change in West Africa was made with the outputs of the GCM [20]. With grid ranging from 150 to 400 km2, GCM have great difficulties to take into account regional heterogeneities of variability and changes of climate. This means that these models are not suitable to produce climate projections at regional, national and local scale, which are necessary to assess the impacts of climate change and to develop adaptation policies [21]. Faced with this situation, projects such as AMMA (African Monsoon Multidisciplinary Analyses), ENSEMBLE (project that produced a multi-model ensemble at approximately 25 km resolution) and CORDEX AFRICA (Coordinated Regional Climate Downscaling Experiment) have been developed to produce variables at regional scale. Regional Climate Models (RCM) were therefore forced by GCM outputs in West Africa region with a spatial resolution of 50 km. To date, relatively few studies have assessed the impacts of climate change on water resources and a clear picture of possible changes is lacking. In order to fill this gap, this study assesses the impacts of climate changes on river discharge dynamics in the Oueme River basin in Benin by using bias corrected data from two Regional Climate Models (SMHI-RCA4 and DMI-HIRHAM5) simulations. These corrected data are used as input of the Hydrological Model based on the Least Action Principle (HyMoLAP).
2. Study Areas and Methodology
2.1. Characteristics the Study Areas
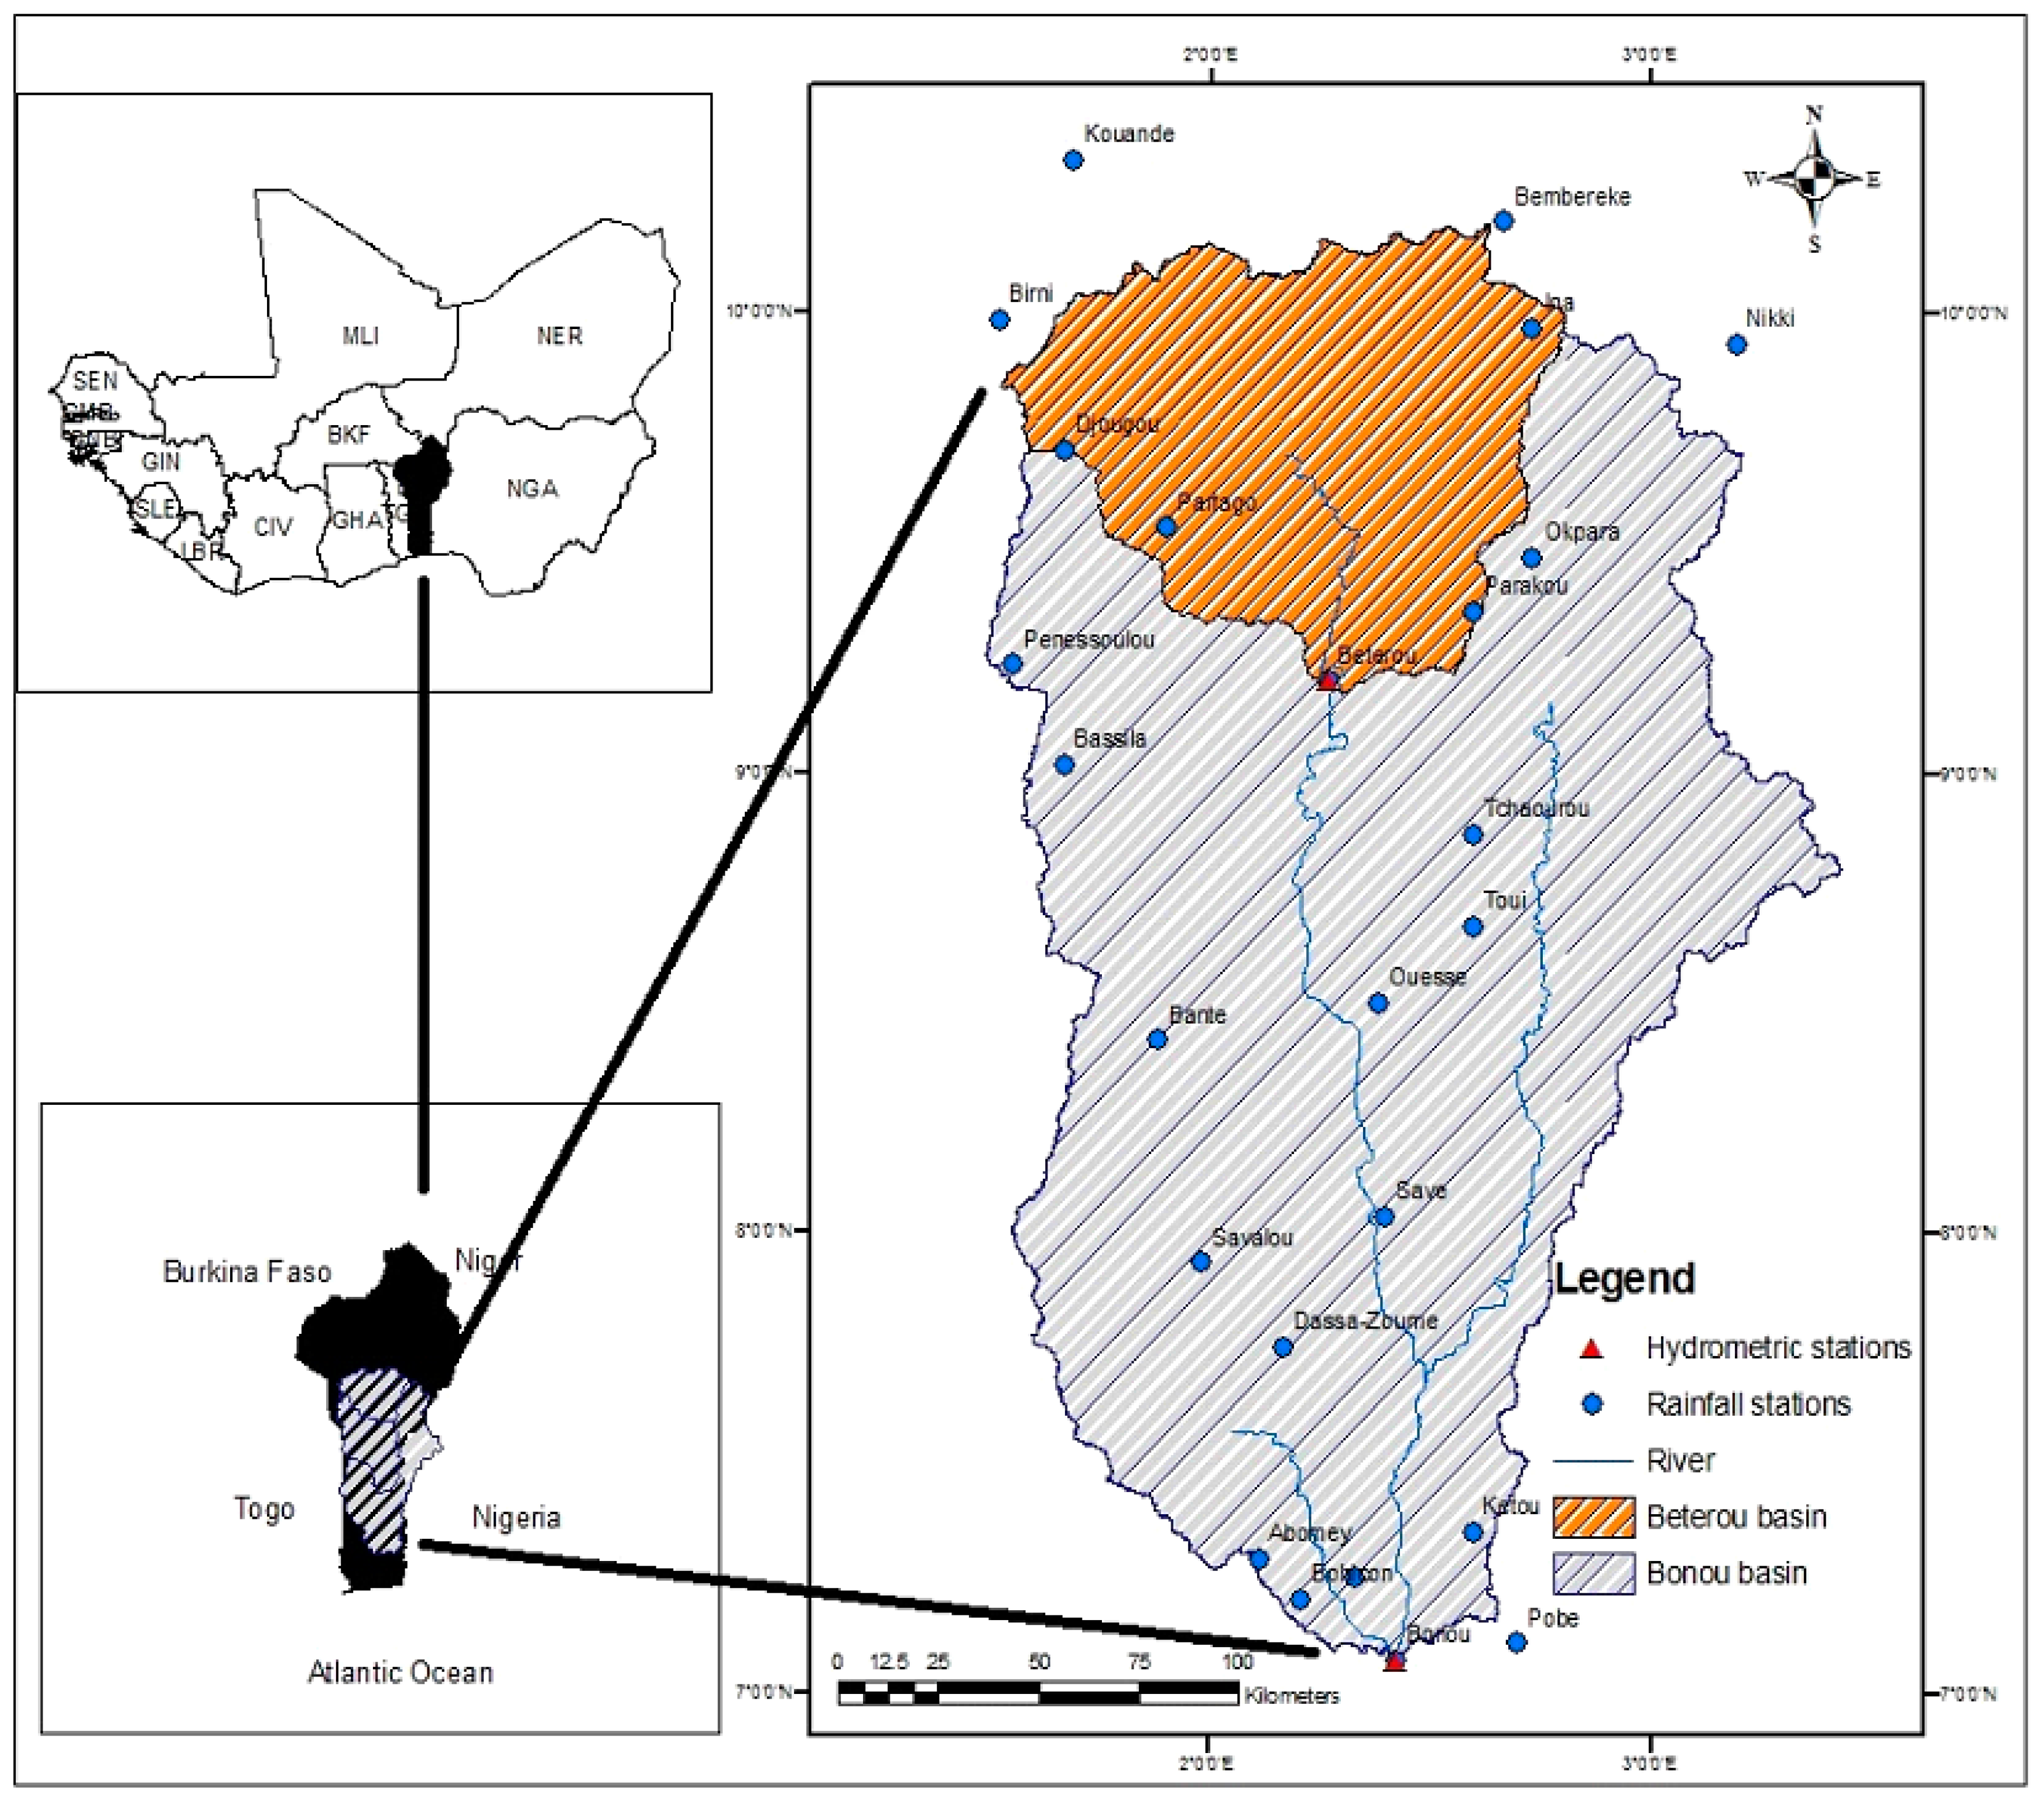
At the scale of West Africa, Oueme is a small coastal river that covers at Bonou, the most advanced hydrological station before the delta, an area of 49,256 km2. Oueme is the largest river of Benin and it springs from the classified forest of Tanéka (Atacora). Benin shares the Guinea Coast of West Africa (between 6°25′ and 12°30′ North latitude and between 0°45′ and 4° East longitude) and is bordered to the west by Togo, to the east by Nigeria, and to the north by Niger and Burkina Faso. The Oueme catchment covers two climatic zones: the Guinea savanna zone and the Soudanese savanna zone. This study covers the Bétérou and Bonou sub-catchments of the Oueme River (Figure 1). These two sub-catchments have different climate conditions. The Oueme River basin at Bétérou outlet covers an area of 14,000 km2 and is located in northern Benin. This catchment lies in the Soudanese savanna zone and has a unimodal rainfall season (from mid-March to October) that peaks in August. The interannual mean rainfall on the Oueme at Bétérou is around 1160 mm, the minimum is 743 mm (in 1983) and the peak is 1587 mm (in 1963) over the period 1961–2010 [22]. The river discharge dynamic is characterized by high flow during the rainy season. From December to May nearly all rivers dry out. The Oueme River basin at the Bonou outlet covers a surface area of 49,256 km2 between 6.8–10.2° N latitude and 1.3–3.45° E longitude. It lies in the Guinea savanna zone and exhibits a bimodal rainfall season (from March to July and from August to October) that peaks in June and September. The interannual mean rainfall on the Oueme at Bonou is around 1100 mm, the minimum is 652 mm (in 1983) and the peak is 1536 mm (in 1963) over the period 1961–2010 [22]. The mean annual daily flow of the Oueme River at Bonou for the last 5 decades is around 170 m3/s. In the Oueme catchment, land use is largely characterized by small-scale agriculture. Major soil types are: ferruginous tropical soil in the north and sand-stone plain in the south of Oueme catchment. Peak discharge occurs in August to October.
On a global scale, Benin extends from the Niger River to the Atlantic Ocean, with relatively flat terrain, small mountains (about 600 m), and low coastal plains with marshlands, lakes and lagoons. The investigated catchments lie extensively on Precambrian crystalline basement, known as the Dahomeyides or the Benino-Nigerian shield. It consists predominantly of granites, granitoid gneisses, and gneisses. The mean annual temperature of Oueme catchment varies between 26° and 30°. The landscape is characterized by forest, gallery forest, savanna, woodlands, and agricultural as well as pasture land. Rainfall–runoff variability is high in the catchment, leading to runoff coefficients varying from 0.10 to 0.26, with the lowest values for the savanna and forest landscapes [23]. When compared with the standardized rainfall time series for the Sahelian region and the Guinean coast, it appeared that the Oueme regions exhibit similar rainfall variability to the Guinean coast rainfall index [24]. However, the northern Oueme region exhibits a strong coherence with rainfall anomalies of the Sahel on decadal time scales [25]. Daily WMO (World Meteorological Organization) Class A pan evaporation data for 2006 at six Beninese stations indicate a typical potential evaporation of 10–12 mm/day during the peak of the dry season in northern Benin and this drops to 2–4 mm/day at all stations during the rainy season [25].
2.2. Methodology
2.2.1. Observed and Regional Climate Models (RCM) Data Used
Observed meteorological data (daily rainfall data and daily potential evapotranspiration, calculated by the Penman formula) and daily discharge data were provided, respectively, by the Benin Meteorological Department, i.e., ASCENA (Agency for Air Navigation Safety in Africa and Madagascar) and the National Directorate of Water (DG-Eau). The observed data are considered for the period 1961–2010.
The historical and future projections (RCP4.5 and RCP8.5 scenarios) rainfall data of two regional climate models (SMHI-RCA4, DMI-HIRHAM5) were obtained from CORDEX Africa project (http://www.cordex.org). These two RCM were chosen to test their ability to reproduce the observed rainfall data in Oueme catchment for impact studies, since only REMO data are usually used for impact studies in Oueme catchment. The reference period selected for examining the rainfall bias was the period 1961–1990 (baseline period). This is regarded as the World Meteorological Organization (WMO) standard normal period. For future projections, the RCP4.5 and RCP8.5 scenarios are considered over the period 2011–2100. RCP4.5 is a stabilization scenario, it is chosen because it represents somewhat the medium-low RCP (representative concentration pathways). As for the increasing greenhouse gas emissions RCP8.5 over time, its choice is based in the fact that it reflects the impact of the largest potential climate change. The baseline period 1961–1990 was used to represent the ‘present day’ climatology of the study areas. Climate scenarios were centered around three time periods: 2020s (2011–2040), 2050s (2041–2070) and 2080s (2071–2100), representing the early, middle and late of 21st century. The HIRHAM5 and RCA4 simulations were forced respectively with data from the global climate model GFDL-ESMLM and EC-EARTH. The entire simulated period spans from 1951 to 2100 with the first 54 years (historical: 1951–2005). The remaining period (2006–2100) was forced by the RCP scenarios RCP4.5 and RCP8.5.
2.2.2. Bias Correction
Due to the well known bias of climate model output, a bias correction technique is applied to correct the two RCM (DMI-HIRHAM5 and RCA4) simulations for the present day and the future climate. In this study, we apply the Distribution-Based Scaling (DBS) to improve usability of regional climate model projections for hydrological climate change impacts studies [26,27,28,29]. The DBS approach aims to maximize utilization of RCM outputs to obtain more realistic input data for hydrological studies. It takes the covariance between precipitation and temperature into account. It reproduces the variations generated from the RCM-projected climate evolution and preserves them in adjustments to the key hydro-meteorological variables: precipitation and temperature.
The DBS approach used two steps: (1) spurious drizzle generated by the RCM was removed to obtain the correct percentage of wet days and (2) the remaining precipitation was transformed to match the observed frequency distribution. To obtain the percentage of wet days correctly, a cut-off value was identified. Simulated and observed daily precipitation was sorted in descending order. The cut-off value was then defined as the threshold that reduced the percentage of wet days in the simulation to that of the observations. Days with precipitation amount larger than the threshold value were considered as wet days and all other days as dry days. There are various theoretical distributions available to describe the probability distribution function (PDF) of precipitation intensities [26,28]. A commonly used distribution is the gamma distribution, because of its ability to represent the typically asymmetrical and positively skewed distribution of daily precipitation intensities [26,28]. The gamma distribution is a two-parameter distribution whose density distribution is expressed as [26]:
where α is the shape parameter, β is the scale parameter and Γ(x) is the inverse gamma function. The distribution parameters were estimated using maximum likelihood estimation (MLE).
Compared to precipitation, temperature is more symmetrically distributed. It can be accurately described by a normal distribution with mean μ and standard deviation σ:
Considering dependence between precipitation and temperature, temperature time series were described with distribution parameters conditioned by the wet or dry state of the day. The DBS parameters for temperature were calculated for both observations and RCM-simulated data series.
2.2.3. Hydrological Modelling
In order to assess the impact of climate change on river discharge dynamics, the corrected outputs from the two RCM are used as input of the hydrological model based on the least action principle (HyMoLAP). HyMoLAP uses the principle of minimum energy expenditure. This principle can be stated as follows: “Nature always follows the simplest way…. And the simplest way is the one which minimizes the energy expenditure of the nature” [30]. HyMoLAP has been used successfully in rainfall-runoff modelling for the Bétérou, Save and Bonou catchments of the Oueme River [22,24,30,31]. Details of the model can be found therein. HyMoLAP is described by the two Equations (3) and (4).
where: Z describes the variation of the initial state of the catchment; ψ describes the model input, i.e. the rainfall intensity (mm/day), Y describes the model structure, λ and μ are the physical parameters of the model and have no unit, Q stands for the river discharge (m3/s or mm/day), q is the effective rainfall (mm) and t is the time (day). Assuming λ to be constant, a comparison has been made by [31] between the numerical value calculated from the model and the results from direct field measurement and thus confirm the physical meaning of this parameter. Clearly λ is the recession coefficient. Thus, the lumped properties of the river basin are described by λ while the hydrological properties are captured in the dynamical Equations (3) and (4). The parameter μ describes the non-linearity of the transformation of rainfall into runoff.
Equation (3) describes explicitly the production process (i.e., the action of the unsaturated zone which accounts for evaporation and evapotranspiration and divides the resulting rainfall event into two components: overland and underground) and Equation (4) describes the transformation process (i.e., the process by which the amount of rainfall volumes for overland component and underground component are transformed into runoff). The application of the least action principle (LAP) results in the following differential equation [30].
where describes the state (dry or wet) of the catchment. μ and λ are the physical parameters of the model (they describe the physical structure of the system). It is noticed that the hydrological response of rainfall processing to runoff on day t − 1 at the outlet of the catchment occurs on day t [31]. Therefore, the discretisation of Equation (5) gives:
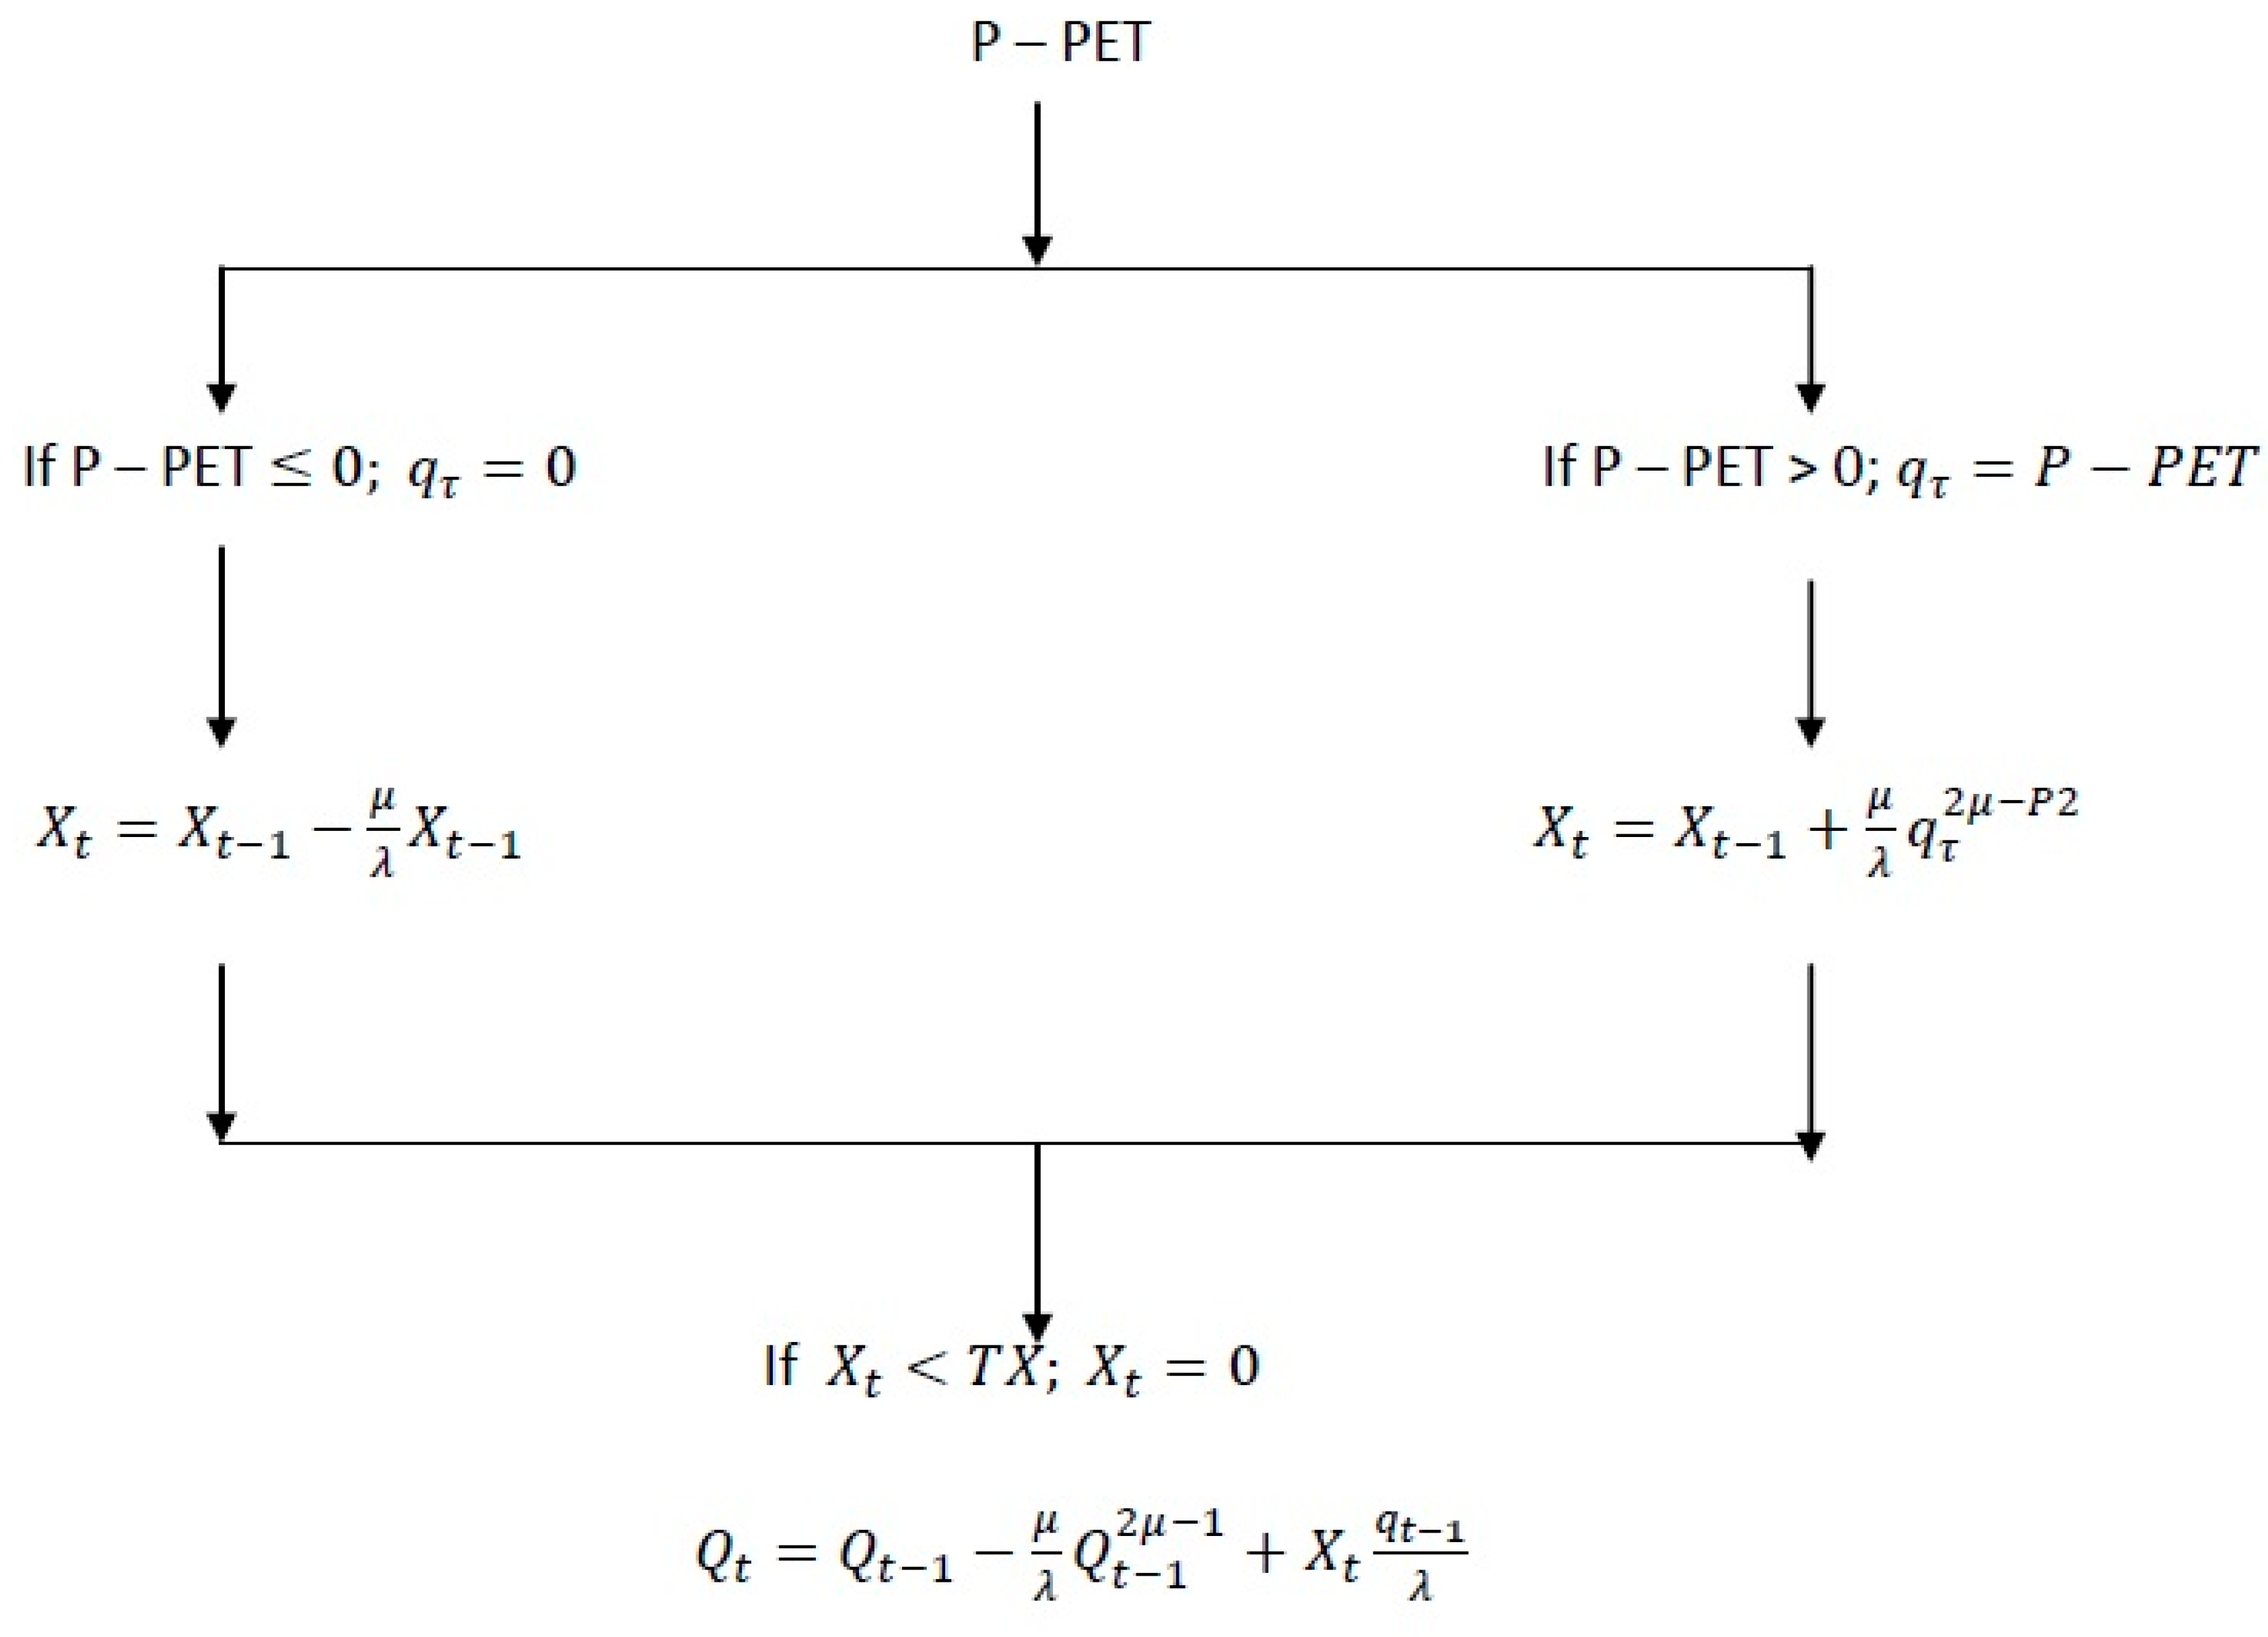
where and denote respectively the discharge at the outlet on day t and on day t − 1; describes the state of the catchment (dry or wet) on day t, expressed in mm, and represents the effective rainfall on day t − 1 (i.e., the subtraction of potential evapotranspiration from rainfall). Figure 2 presents the schematic structure of HyMoLAP. It describes how the model computes the river discharge from the inputs (rainfall P and potential evapotranspiration PET). The first operation is the subtraction of PET from P to determine the effective rainfall q. Then, taking into account the state of the soil , the river discharge is computed according to the expression given by Equation (6).
This model uses daily data (i.e., daily rainfall data and daily potential evapotranspiration) as input. HyMoLAP was calibrated for the average daily river discharge of Bétérou and Bonou catchments for the period 1961–1980 and validated for the period 1981–1990. For hydrological projection, the average hydrograph were calculated using 30 years of projected river discharge data over each of the three time horizons (2020s, 2050s and 2080s). The average hydrograph and changes of annual river discharge were compared with the simulated river discharge for the baseline period rather than the actual observed discharge data. This technique was used to avoid systematic errors that the hydrological model would introduce in comparing the projection period with the baseline period.
The rate of mean annual river discharge variations were calculated as follows:
Analysis of the rate of variation of river discharge allowed us to determine future river discharge trends. Using the result from 30 years simulations, empirical probability distributions functions (PDF) of the projected mean annual river discharge were generated. The PDF indicate the range of possible values for the variable and for each time horizon.
3. Results and Discussion
3.1. Evaluation of the DBS Bias Correction
The DBS approach produced a more realistic representation of local hydrology than by using raw RCM output. After applying the DBS approach, the large differences in the cumulative distribution function (CDF) between the observation and simulation were reduced considerably. Figure 3 shows the results of the application of the DBS approach for daily precipitation for some selected years in Bétérou and Bonou catchments. It can be seen from this figure that the CDF of the bias corrected data are close to the CDF of the observed data.
We now present how the RCM used in this study reproduce past rainfall. Figure 4 shows the annual observed, simulated and corrected rainfall. Compared to observations, the RCM differ in how they reproduce the annual rainfall, due mainly to their different dynamical schemes and physical parameterizations of the West African monsoon [21]. The underestimation of annual observed rainfall by the raw RCM data used in this study is well noticeable in Figure 4. This is the reason why a bias correction of these RCM is performed in order to have reliable climate input for hydrological impact studies. After performing the DBS bias correction, the underestimation of observed annual rainfall before correction is reduced. Nevertheless, to better evaluate the bias correction, we look at parameters such as the root mean square error (RMSE) and the mean absolute error (MAE).
The performance statistics for comparing observed annual rainfall, raw annual HIRHAM5 rainfall, corrected annual HIRHAM5, raw annual RCA4 rainfall and corrected annual RCA4 rainfall are presented in Table 1. The results of the bias correction show a decrease in the RMSE and MAE of the raw HIRHAM5 and RCA4 rainfall data of approximately 91% to 98%.
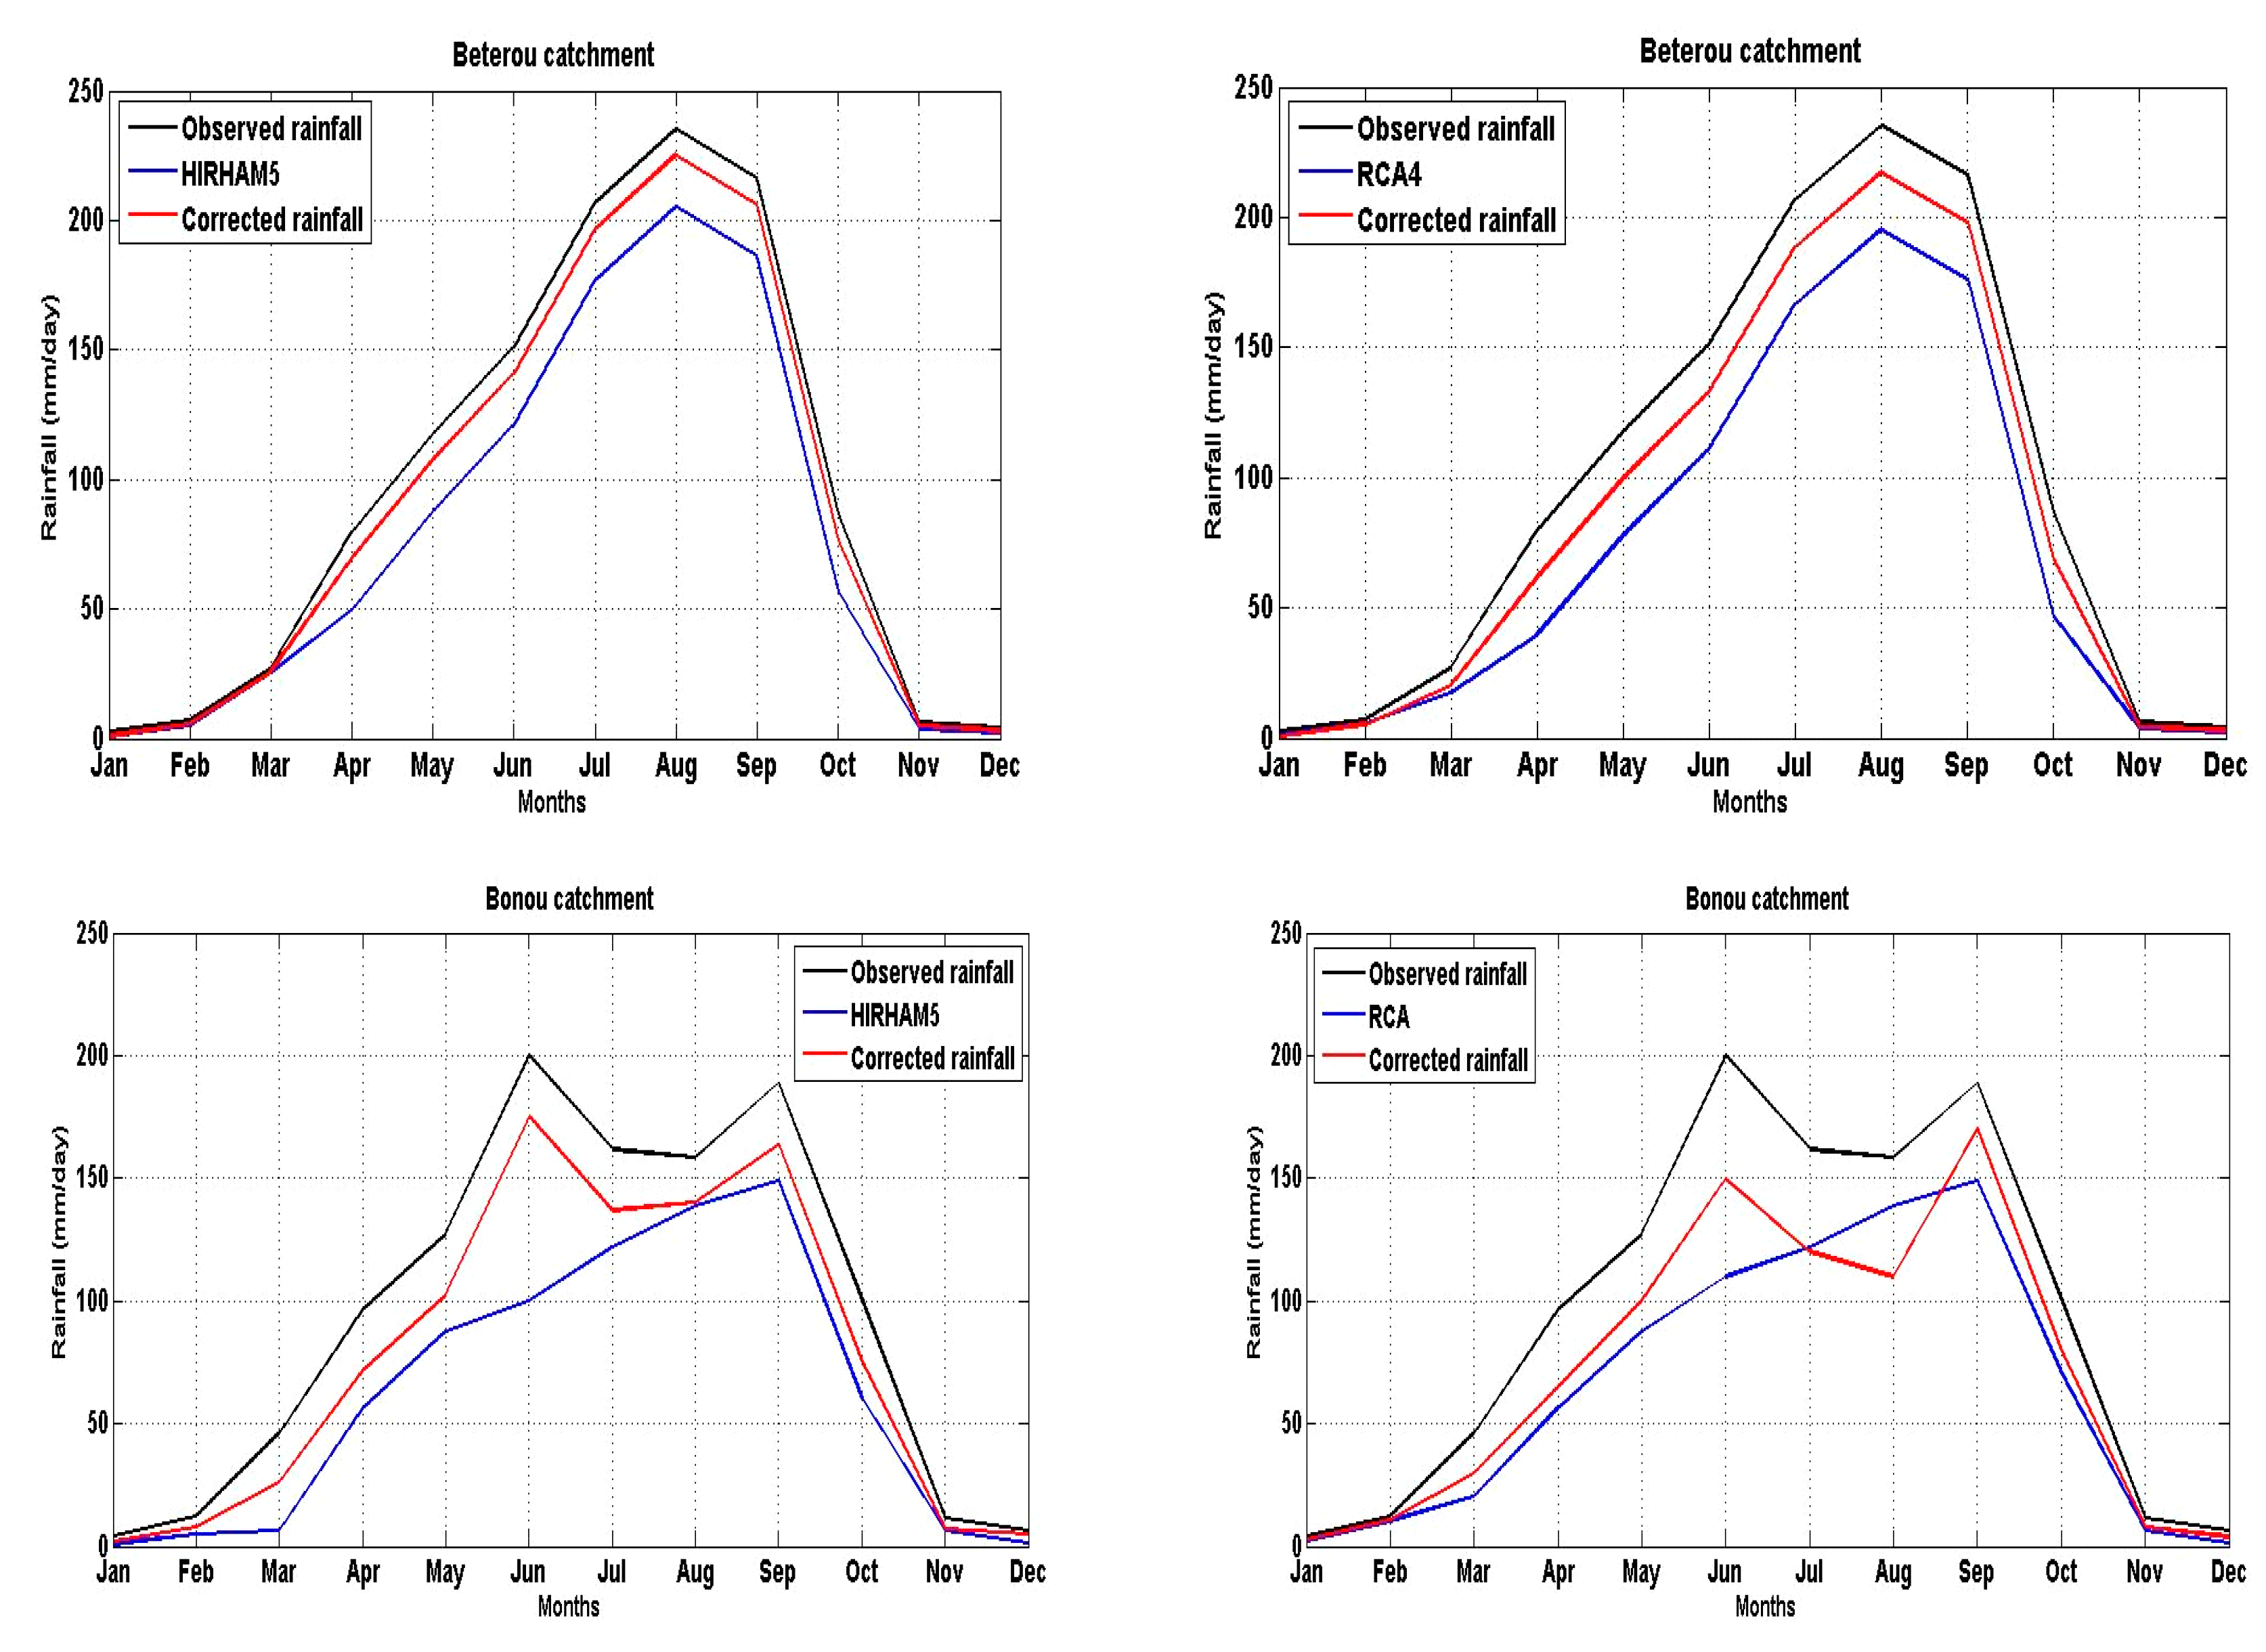
The performance statistics presents in Table 1 confirms the fact that the bias correction reduces the differences between the observed annual rainfall and annual HIRHAM5 and annual RCA4 rainfall. Moreover, the seasonal cycles of HIRHAM5 and RCA4 rainfall are displayed (Figure 5). This figure also shows that the bias correction improves the results. The corrected two RCM rainfall data reproduce quite well the seasonal cycle. The underestimation is large between June and September, which correspond to the period of heavy rain in the study catchments.
Figure 6 gives an example of the results of the temperature bias correction. It can be seen from this figure that the bias between the observations and the raw HIRHAM5 temperatures is reduced. The bias corrected temperatures are then used in the Penman-Monteith equation to estimate the potential evapotranspiration (PET), which constitutes, in addition to rainfall, the input of the hydrological model used in this study for impact studies.
3.2. Projected River Discharge Based on HyMoLAP
3.2.1. Simulation of River Discharge with HyMoLAP
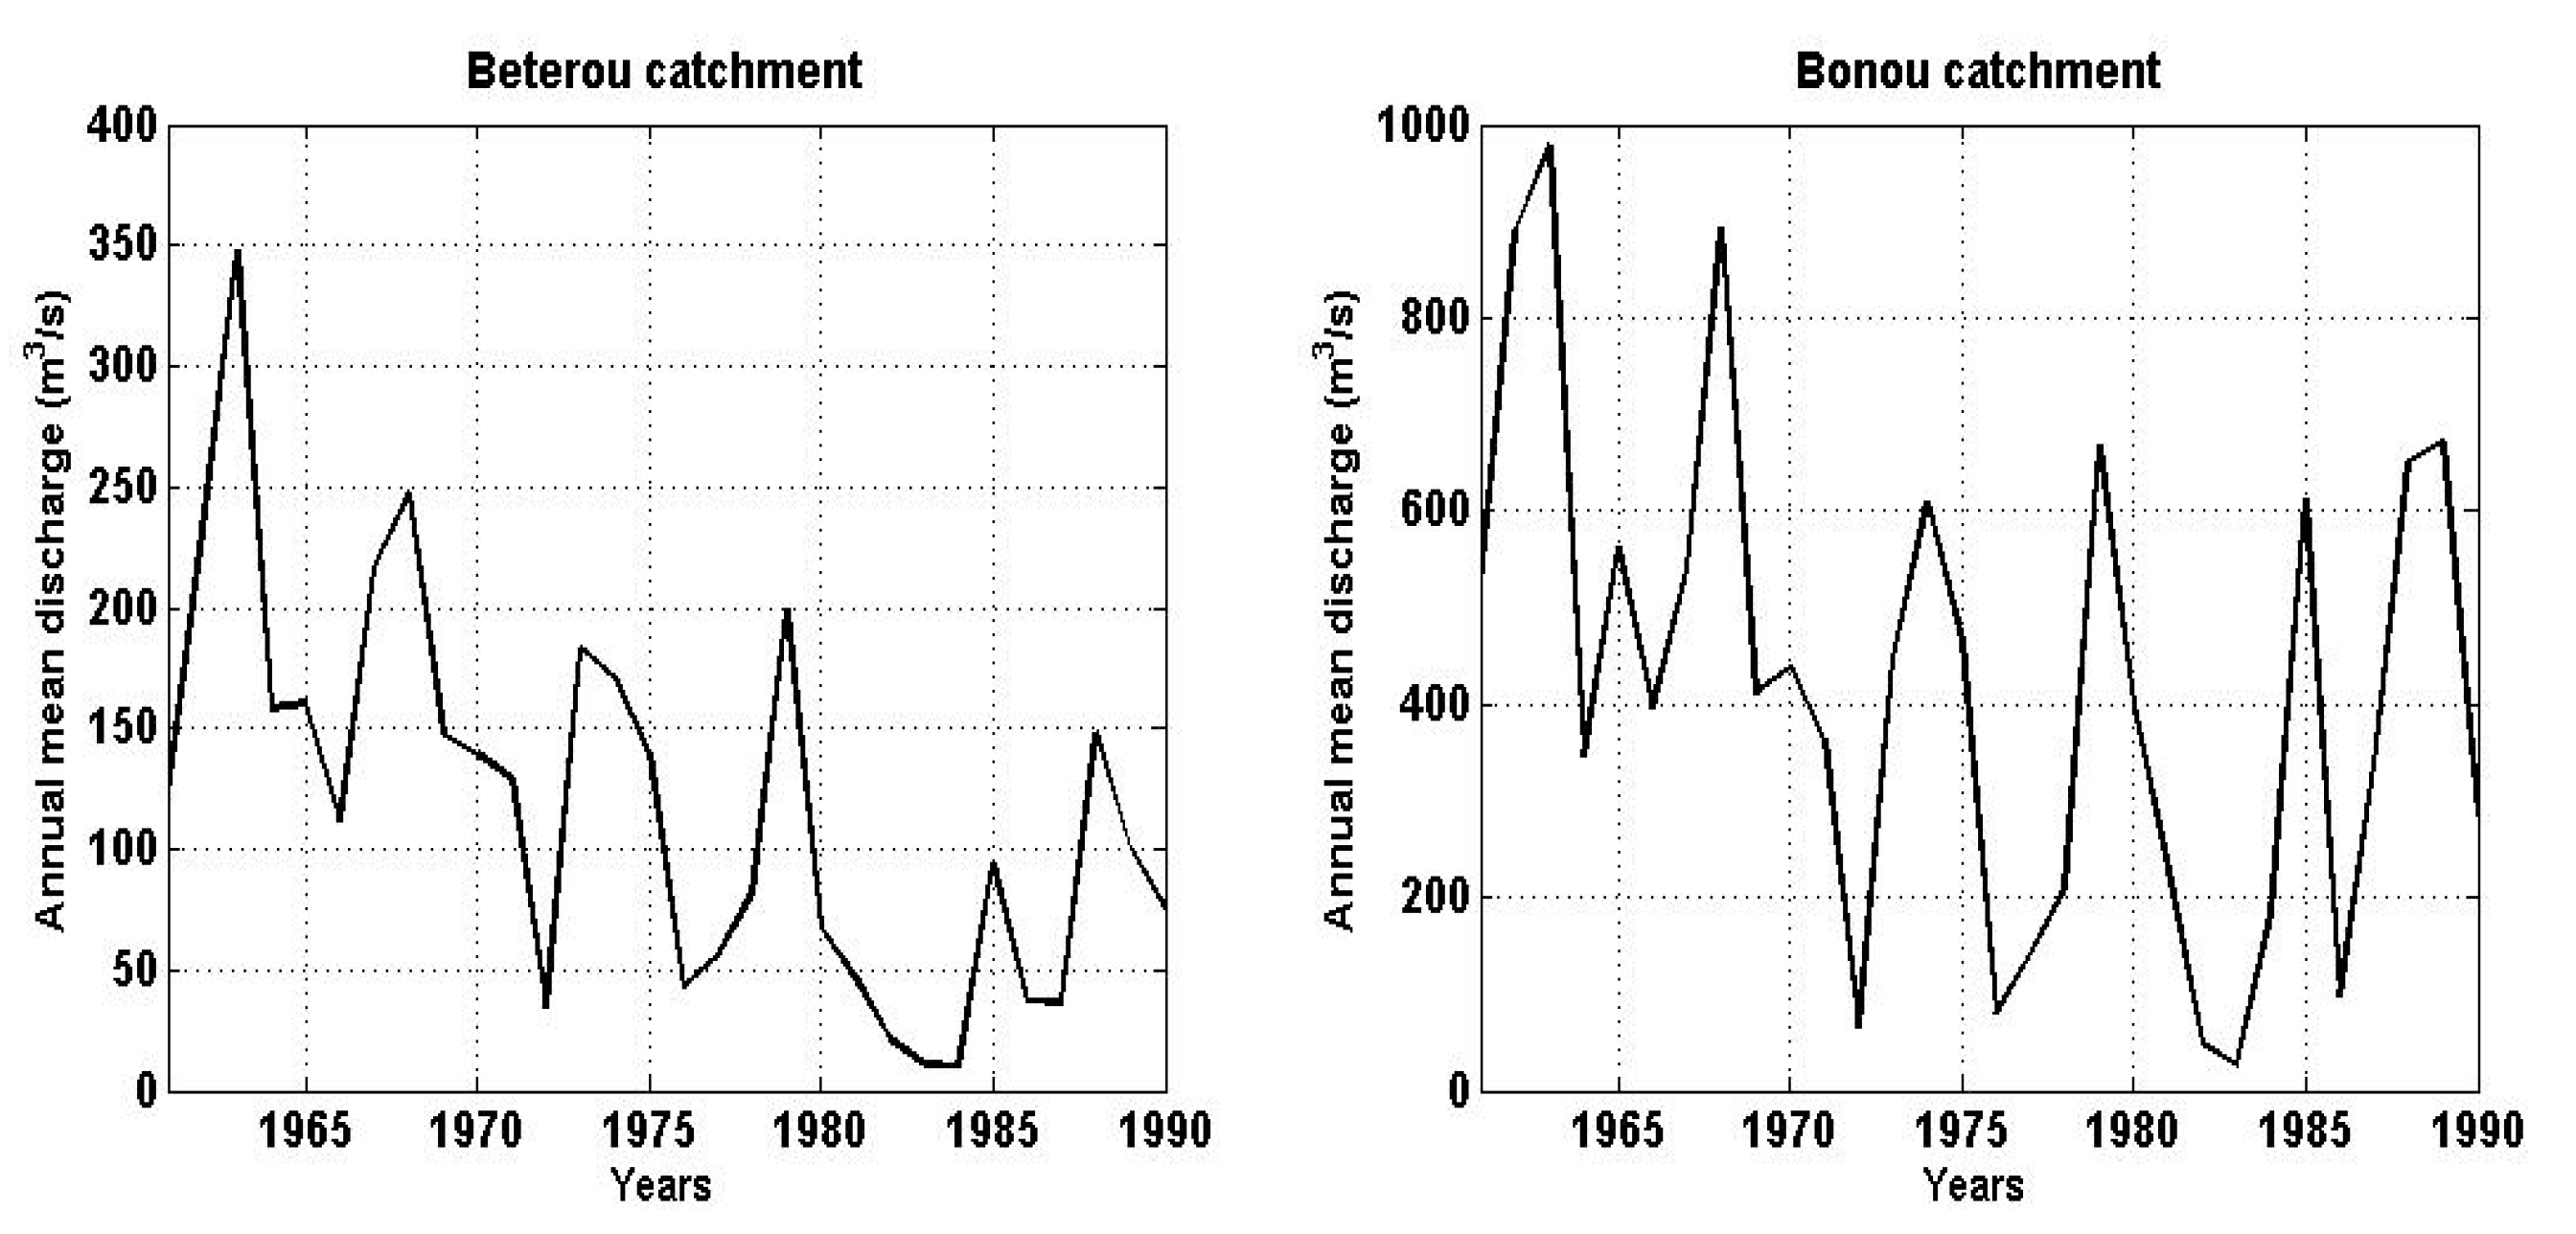
The annual mean of river discharges in the investigated catchments as plotted in Figure 7 show that the decade 1961–1968 has the higher river discharge (up to 350 m3/s in Bétérou and 1000 m3/s in Bonou), then it decreases from the years 70s to the year 1990.
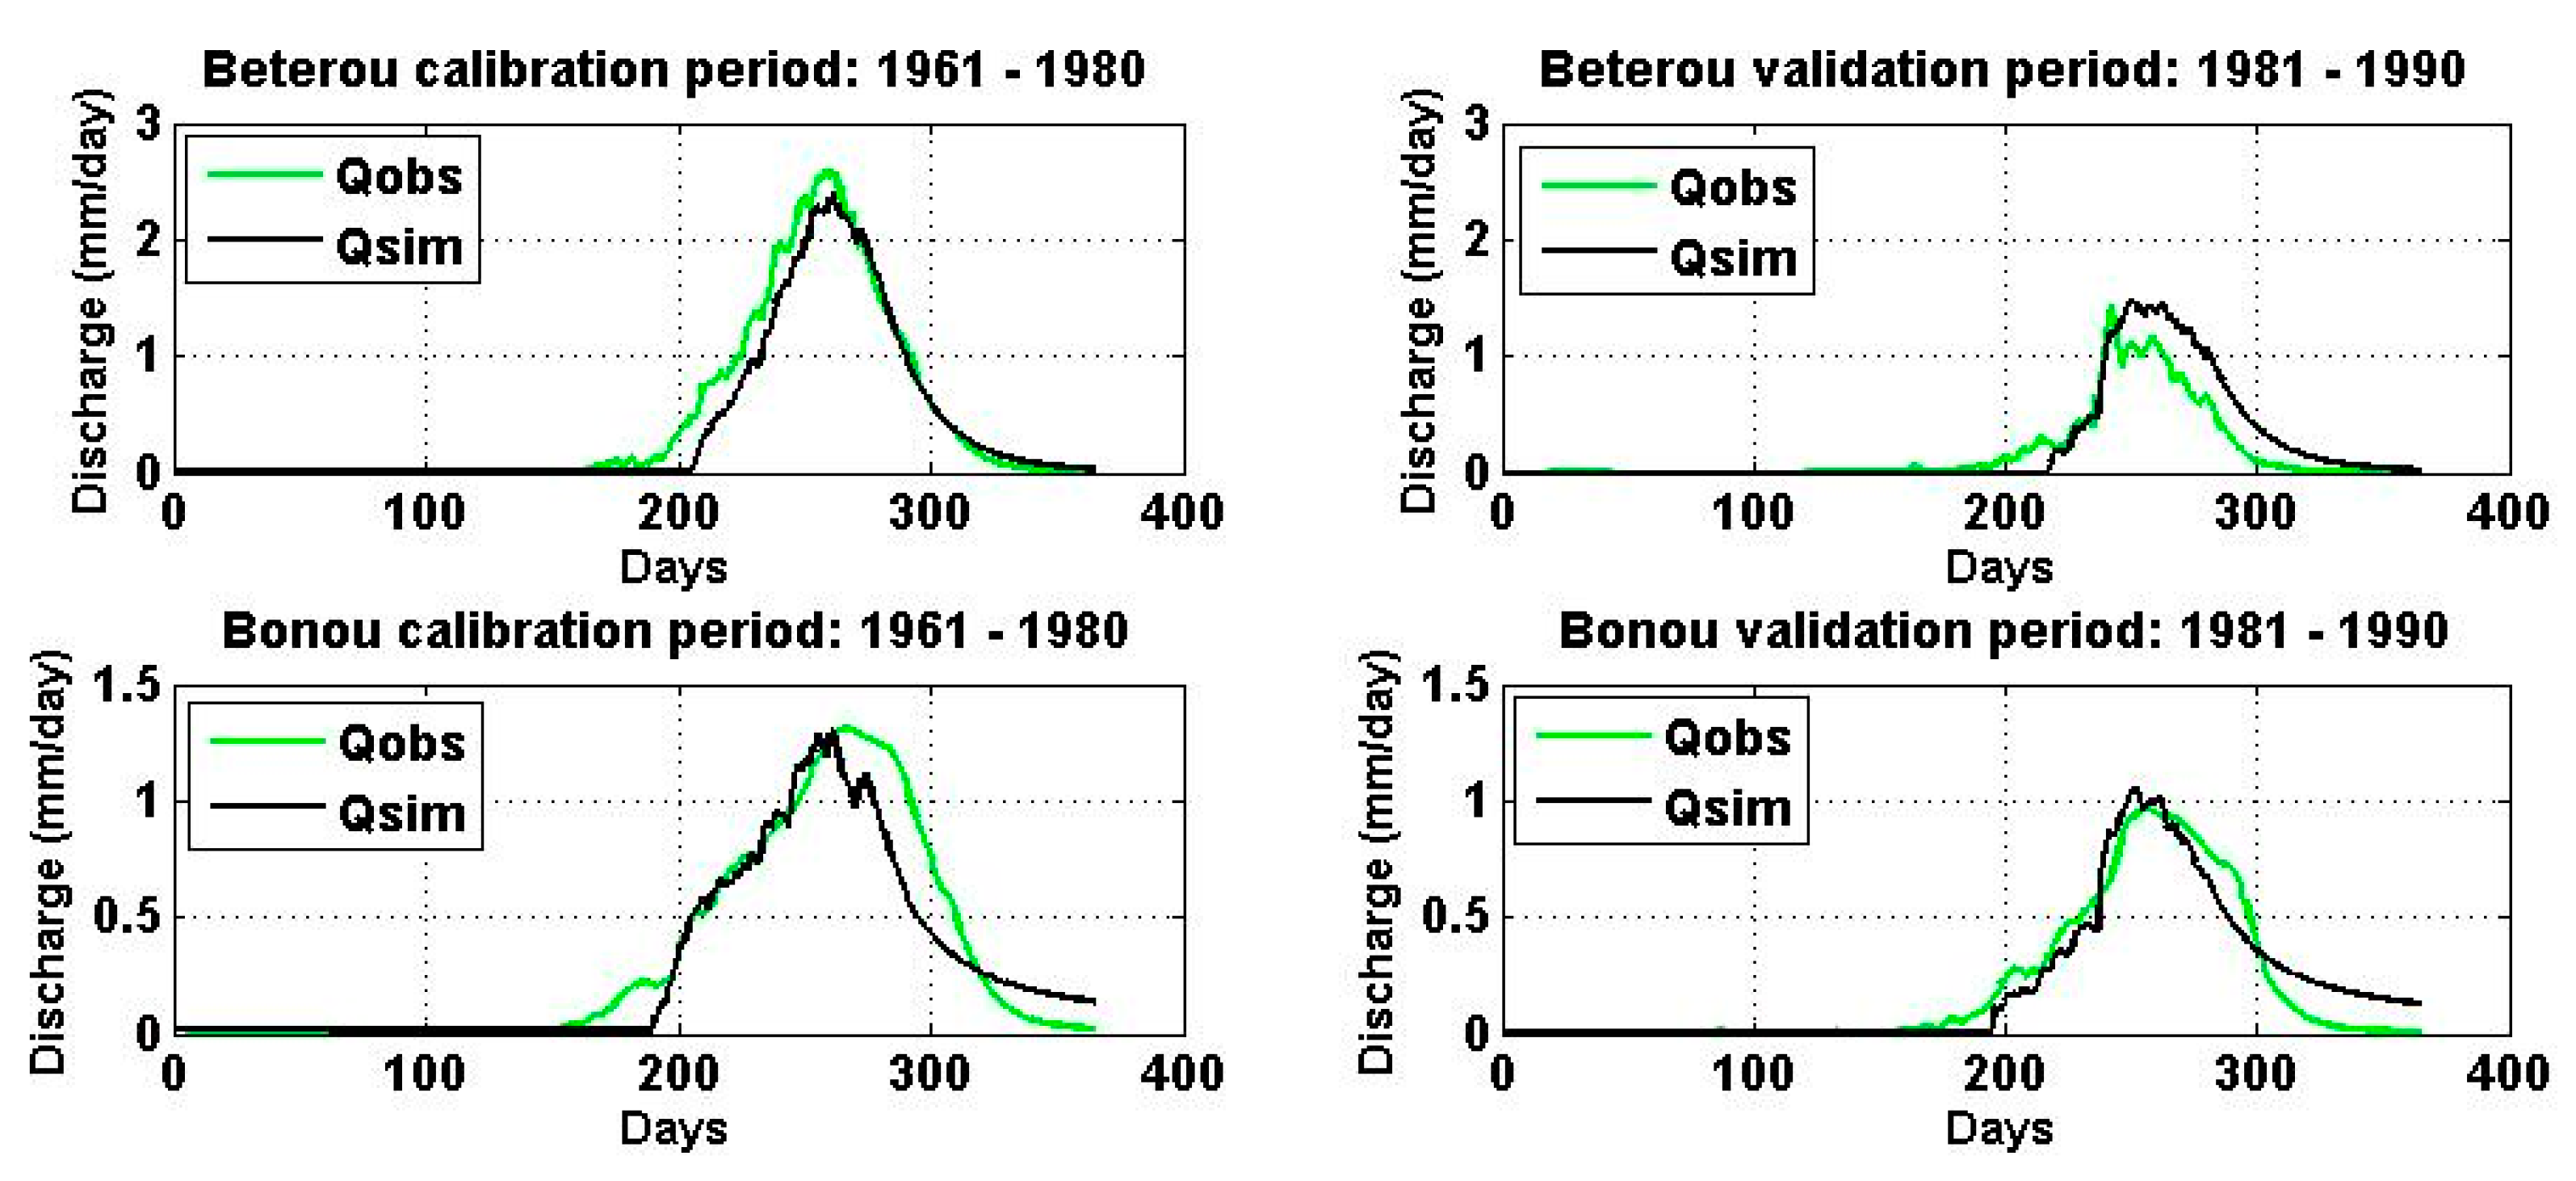
Model calibration was performed over the period 1961–1980 and validation over the period 1981–1990. In order to evaluate the model performance for the calibration, the following criteria were taken into account: the coefficient of model efficiency CE [32], the coefficient of determination R2 and the absolute percentage bias (APB). We can see that the hydrograph is adequately simulated by HyMoLAP; despite that the recession curve is not well simulated, in both calibration and validation for Bonou catchment (Figure 8). This means that the uncertainties associated with the low flow are greater than those associated with the peaks. The difference between the observed and simulated results can be seen by a simple visual control and also by the numerical values for CE, R2 and APB as presented in Table 2. For both calibration and validation periods the CE and R2 are greater than 0.75 in the investigated catchments, while APB of 13.05% for the calibration period and 39.1% for the validation period were achieved at Bétérou. In Bonou catchment, we notice an APB of 25.17% for the calibration period and 29.27% for the validation period. These results indicate that the HyMoLAP is suitable for simulation of river discharge in the Oueme River basin and can be therefore used for the projection of river discharge.
3.2.2. Changes of Average Hydrograph
Figure 9 and Figure 10 show the projected river discharges for both catchments. There was general decrease in the river discharge for both catchments in the three time horizons (2020s, 2050s and 2080s) for the two investigated scenarios (RCP4.5 and RCP8.5).
For the future projection based on RCP4.5 scenarios, the projected mean annual river discharge by using HIRHAM5 and RCA4 in Bétérou decreases with the magnitude ranging respectively from −25% to −31% and −20% to −35% in the three time horizons. For the same scenarios and also for the same two RCM data, the projected mean annual river discharge in Bonou decreases with the magnitude ranging respectively from −34% to −39% and −30% to −37% in the three time horizons.
As regards the future projection based on RCP8.5 scenarios, the projected mean annual river discharge by using HIRHAM5 and RCA4 in Bétérou decreases with the magnitude ranging respectively from −28% to −34% and −26% to −36% in the three time horizons. For the same scenarios and also for the same two RCM data, the projected mean annual river discharge in Bonou decreases with the magnitude ranging respectively from −15% to −26% and −18% to −29% in the three time horizons. The comparison between the two catchments shows that, for future projection based on RCP4.5, Bonou catchment has a substantially greater decrease in mean annual river discharge than Bétérou catchment in the three time horizons, whereas, for the future projection based on RCP8.5, it is Bétérou catchment which has the greater decrease in mean annual river discharge.
3.2.3. Uncertainty in River Discharge Projections
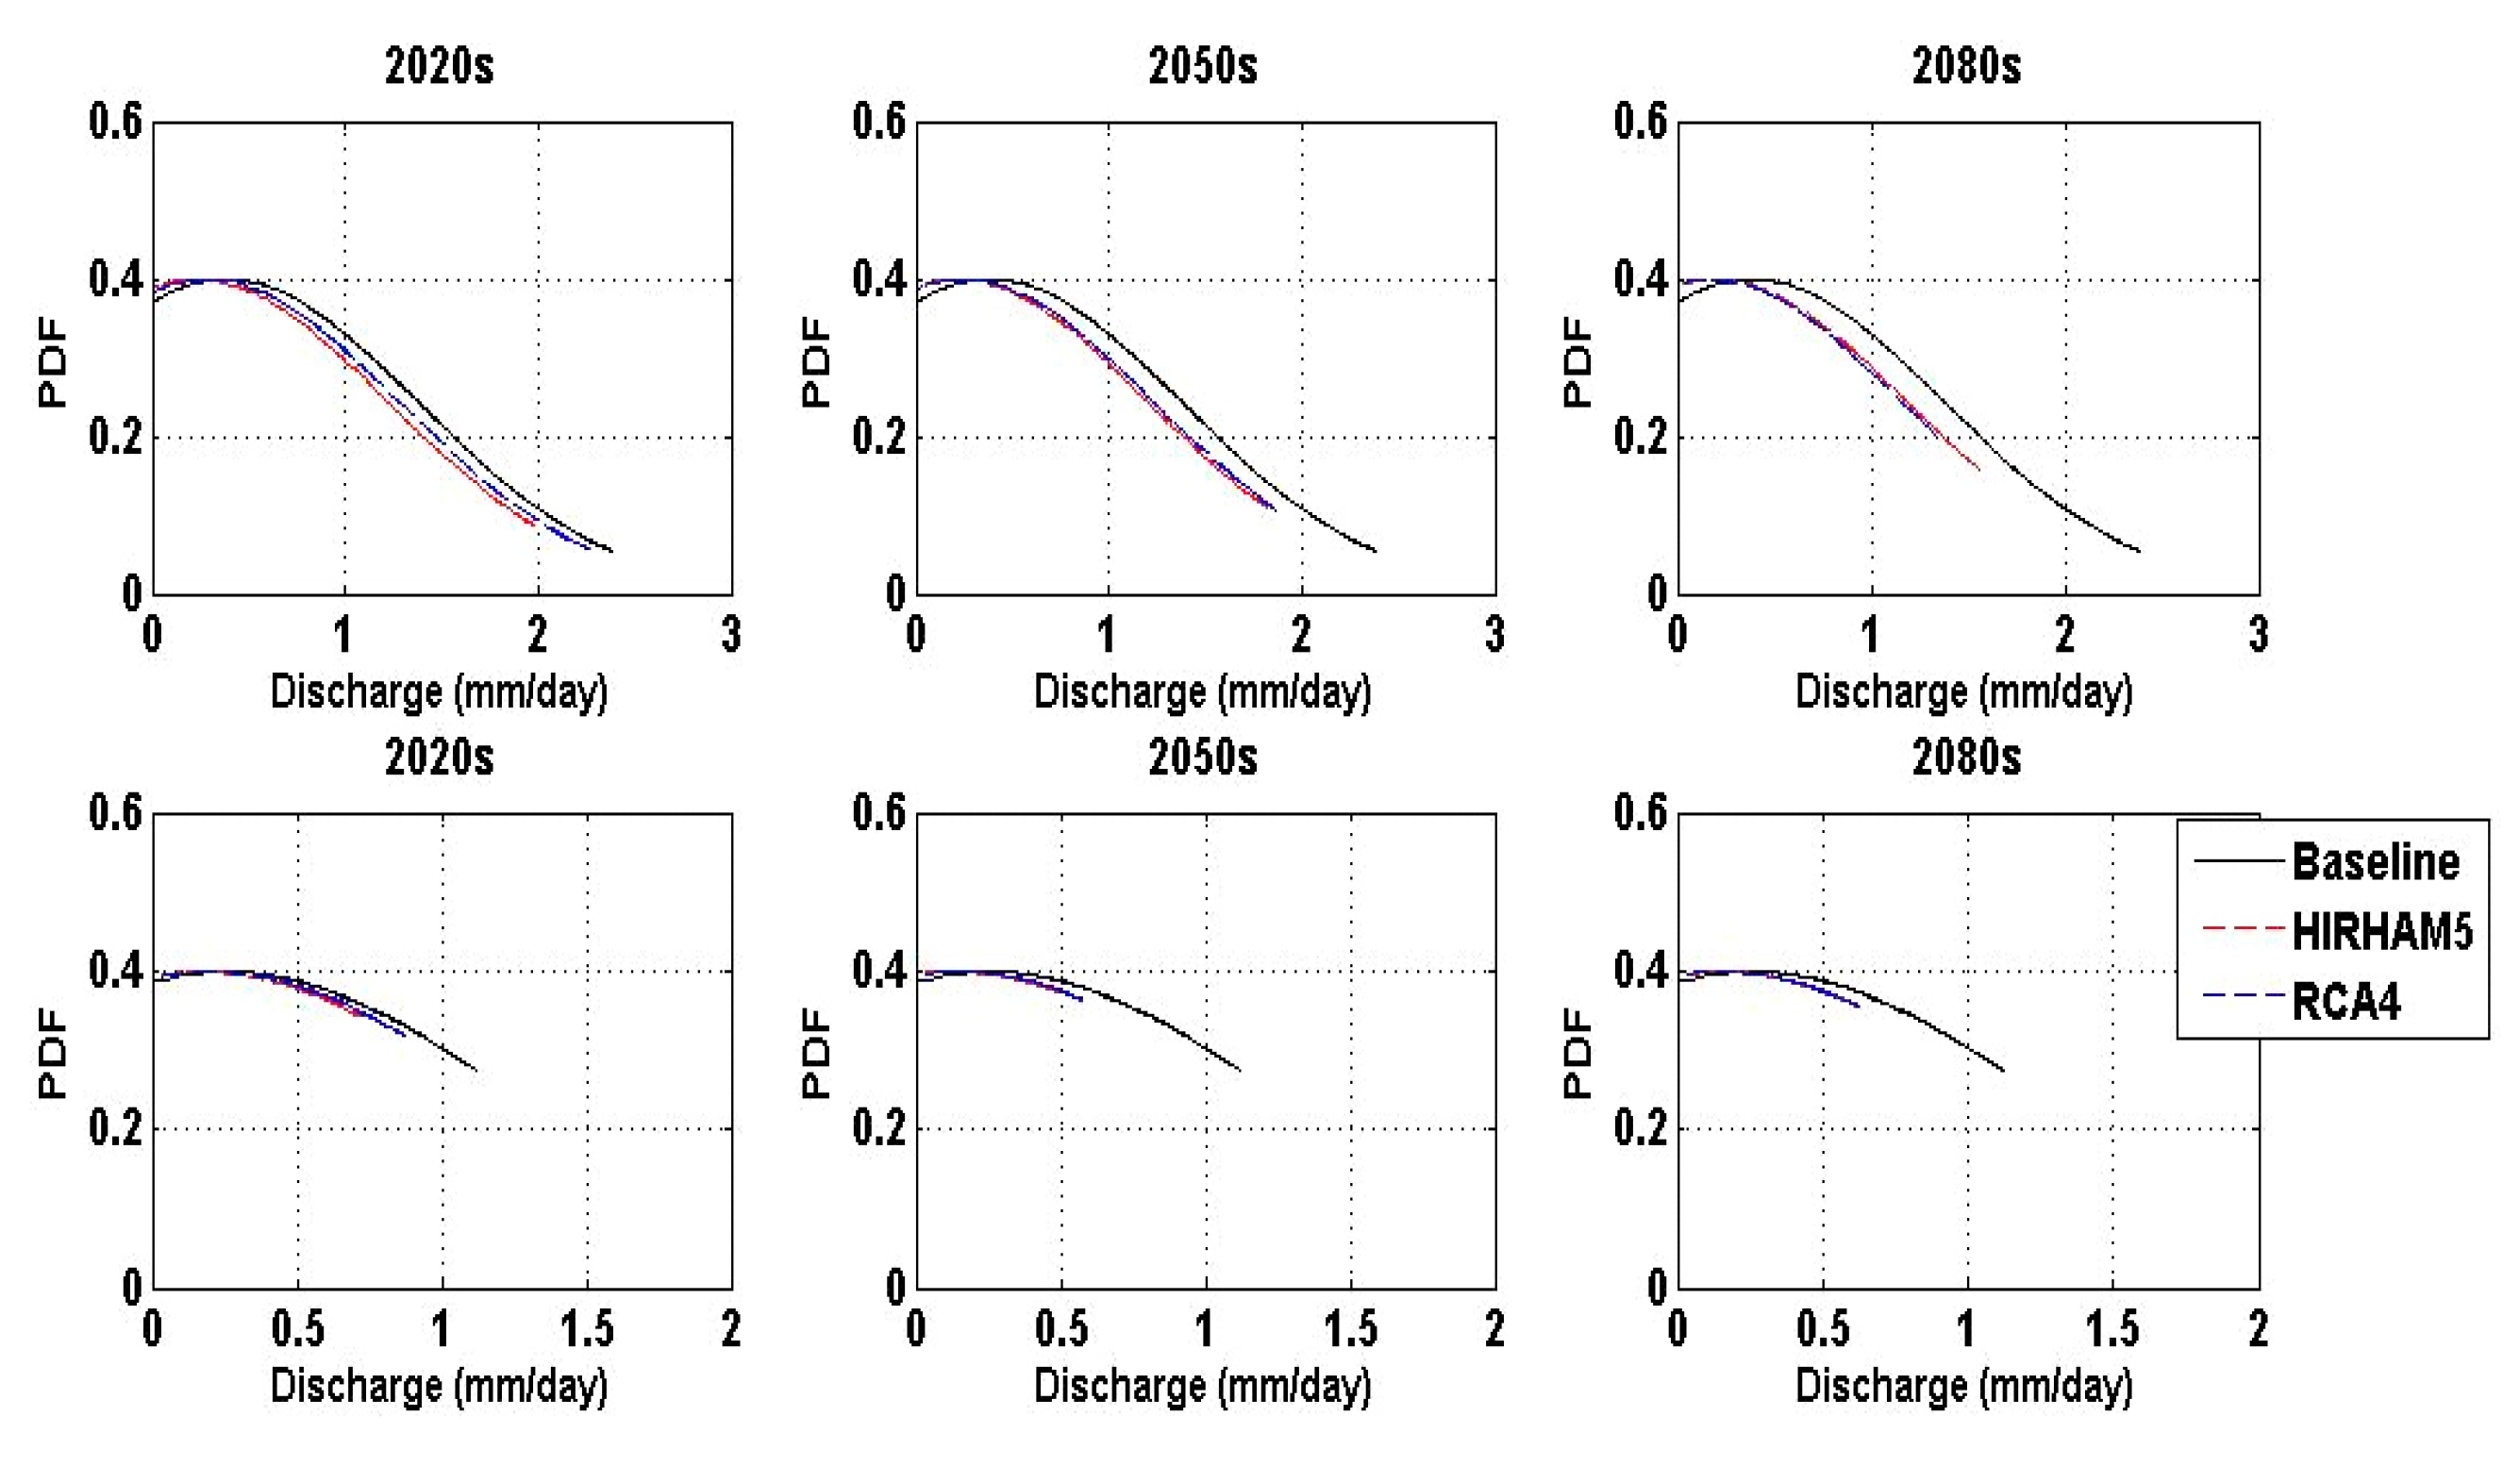
The PDF of the mean annual river discharges for the RCP4.5 scenarios for the two catchments are shown in Figure 11. There were uncertainties in the model projections, especially toward the end of the 21st century. The model uncertainties projections indicated that the entire discharge distribution shifted toward more extreme events (such as drought) compared to the baseline period. The future mean annual river discharge decreases for the two catchments of the Oueme River basin.
3.3. Discussion
The lumped model used in the present study (i.e., HyMoLAP) adequately approximates historical climate data. Although lumped forecasting does not constitute a guarantee, it should be more likely to accurately simulate future climate conditions [33]. That is why this approach was adopted. The results’ analysis showed that we should expect a decrease in river discharge throughout the two investigated catchments. With both scenarios (RCP4.5 and RCP8.5), the mean annual river discharge reduction ranges from −15% to −39%. Practically, the two RCM (HIRHAM5 and RCA4) agree on such trend. These findings are consistent with the results of [33] who found that the reduction in mean monthly flows in the dry season in Bonou catchment reach 20%, while in the rainy season, this reduction reach 30%. The probability of the two catchments of the Oueme River experiencing future warming is very high [34]. One of the consequences of such warming will be increased evapotranspiration, one of the components of the water balance of the catchment. If this increased evapotranspiration is not counterbalanced by increased precipitation, the result would be a reduction in river discharge. Thus, the results of the works of [34] are consistent with the one derived in the present study. The impact of climate change is more evident in West Africa in the late 21st century, especially when the emission scenario taken into account has very contrasted radioactive forcing between late and mid-century [35]. However, the reduction in mean annual river discharge in Bonou catchment could somewhat alleviate the flooding in this area.
The changes in annual river discharge for Bétérou and Bonou catchments are variables from one RCM to another and from RCP4.5 to RCP8.5 scenarios. The decrease in annual river discharge reveal by RCA4 data is more pronounced than the one depict by HIRHAM5, especially for the 2020s in Beterou catchment and for the 2080s in Bonou catchment for the RCP8.5 scenarios, whereas for the RCP4.5 scenarios the projected annual river are almost the same for both RCM. For this reason, to quantify the climate change impacts and assess the uncertainties, several RCM should be used to capture the probability of future change. The projected climate changes show obvious differences, in term of rate of change in mean annual river discharge, in the two catchments. The results highlight the uncertainty in climate change impacts due to choice of RCM. This study uses HIRHAM5 and RCA4 to quantify the uncertainties and ranges of impacts on river discharge and provides the basis for water management and further adaptations to climate change.
4. Conclusions
The Distribution-Based Scaling was used to improve usability of regional climate model projections for hydrological climate change impacts studies. This bias correction approach allows reducing the differences between the observed rainfall and the HIRHAM5 and RCA4 rainfall data. The decrease in the RMSE and MAE of the raw HIRHAM5 and RCA4 rainfall data ranges from 91% to 98%. HyMoLAP is used for the simulation of river discharge in the investigated catchments. For both calibration and validation periods the CE and R2 are greater than 0.75 in the investigated catchments, while APB of 13.05% for the calibration period and 39.1% for the validation period were achieved at Bétérou. In Bonou catchment, we notice an APB of 25.17% for the calibration period and 29.27% for the validation period. These results indicate that HyMoLAP is suitable for simulation of river discharge in the Oueme River basin and is therefore used for the projection of river discharge. For the future projection based on RCP4.5 scenarios, the projected mean annual river discharge by using HIRHAM5 and RCA4 in Bétérou and Bonou decrease with the magnitude ranging respectively from −25% to −39% and −20% to −37% in the three time horizons 2020s, 2050s and 2080s, representing the early, middle and late of 21st century. As regards the future projection based on RCP8.5 scenarios, the projected mean annual river discharge by using HIRHAM5 and RCA4 in Bétérou and Bonou decrease with the magnitude ranging respectively from −15% to −34% and −18% to −36% in the three time horizons. The model uncertainties projections indicated that the entire discharge distribution shifted toward more extreme events (such as drought) compared to the baseline period. This study provides the basis for water management and further adaptations to climate change. Future studies should take into account the other factors influencing river discharge, especially land use changes in order to get a more comprehensive assessment and to guide the elaboration of sound adaptation strategies.
Acknowledgments
The author thanks the Benin Meteorological Department and the National Directorate of Water who provided data sets for this work. The author would like to thank the two anonymous reviewers, as well as the Academic Editor, for their constructive comments and suggestions.
Conflicts of Interest
The author declares no conflict of interest.
References
- Christensen, J.H.; Hewitson, B.; Busuioc, A.; Chen, A.; Gao, X.; Held, R.; Jones, R.; Kolli, R.K.; Kwon, W.K.; Laprise, R.; et al. Regional climate projections. In Climate Change 2007: The Physical Science Basis; Contribution of Working Group I to the Fourth Assessment Report of the Intergovernmental Panel on Climate Change; Solomon, S., Qin, D., Manning, M., Chen, Z., Marquis, M., Averyt, K.B., Tignor, M., Miller, H.L., Eds.; Cambridge University Press: Cambridge, UK; New York, NY, USA, 2007. [Google Scholar]
- Sillmann, J.; Roeckner, E. Indices for extreme events in projections of anthropogenic climate change. Clim. Chang. 2008, 86, 83–104. [Google Scholar] [CrossRef]
- Van Dam, J.C. Impacts of Climate Change and Climatic Variability on Hydrological Regimes; International Hydrology Series; Cambridge University Press: Cambridge, UK, 1999. [Google Scholar]
- Intergovernmental Panel on Climate Change (IPCC). Climate Change: Impacts, Adaptation, and Vulnerability: Part A: Global and Sectoral Aspects; Contribution of Working Group II to the Fifth Assessment Report of the Intergovernmental Panel on Climate Change; Field, C.B., Barros, V.R., Dokken, D.J., Mach, K.J., Mastrandrea, M.D., Bilir, T.E., Chatterjee, M., Ebi, K.L., Estrada, Y.O., Genova, R.C., et al., Eds.; Cambridge University Press: Cambridge, UK; New York, NY, USA, 2014. [Google Scholar]
- Kundzewicz, Z.W.; Kanae, S.; Seneviratne, S.I.; Handmer, J.; Nicholls, N.; Peduzzi, P.; Mechler, R.; Bouwer, L.M.; Arnell, N.; Mach, K.; et al. Flood risk and climate change: Global and regional perspectives. Hydrol. Sci. J. 2014, 59, 1–28. [Google Scholar] [CrossRef]
- Khatri, K.B. Risk and Uncertainty Analysis for Sustainable Urban Water Systems. Ph.D. Thesis, UNESCO-IHE Delft Institute for Water Education, Delft, The Netherlands, 2013. [Google Scholar]
- Afouda, A.; Ould Baba Sy, M.; Gaye, A.T.; Cabral, A.; Nazoumou, Y.; Compaore, A.J.; Sanoussi, R. Impact of Climate Change and Variability on Water Resources in West African Watersheds: What Are the Prospects? Synthesis Report-Writeshop: Dakar, Senegal, 2007. [Google Scholar]
- World Bank. Inondations au Benin: Rapport d’Evaluation des Besoins Post Catastrophe; World Bank: Washington, DC, USA, 2011. [Google Scholar]
- Barrios, S.; Ouattara, B.; Strobl, E. The impact of climatic change on agricultural production: Is it different for Africa? Food Policy 2008, 33, 287–298. [Google Scholar] [CrossRef] [Green Version]
- Dang, H.; Gillett, N.P.; Weaver, A.J.; Zwiers, F.W. Climate change detection over different land surface vegetation classes. Int. J. Climatol. 2007, 27, 211–220. [Google Scholar] [CrossRef]
- Intergovmmental Panel on Climate Change (IPCC). Climate Change: The Climate Change; Contribution of the Working Group I to the third Asseesment Report of the Intergovmmental Panel on Climate Change; Cambridge University Press: Cambridge, UK, 2001. [Google Scholar]
- Meissner, K.; Weaver, A.; Matthews, H.; Cox, P. The role of land surface dynamics in glacial inception: A study with the UVic, Earth System Model. Clim. Dyn. 2003, 21, 515–537. [Google Scholar] [CrossRef]
- Snyder, P.; Delire, C.; Foley, J. Evaluating the influence of different vegetation biomes on the global climate. Clim. Dyn. 2004, 23, 279–302. [Google Scholar] [CrossRef]
- Tarhule, A. Damaging rainfall and flooding: The other Sahel hazards. Clim. Chang. 2005, 72, 355–377. [Google Scholar] [CrossRef]
- Rowell, D.P. A demonstration of the uncertainty in projections of UK climate change resulting from regional model formulation. Clim. Chang. 2006, 79, 243–257. [Google Scholar] [CrossRef]
- Prudhomme, C.; Davies, H. Assessing uncertainties in climate change impact analyses on the river flow regimes in the UK. Part 2: Future climate. Clim. Chang. 2009, 93, 197–222. [Google Scholar] [CrossRef]
- Wilby, R.L.; Harris, I. A framework for assessing uncertainties in climate change impacts: Low-flow scenarios for the River Thames, UK. Water Resour. Res. 2006, 42. [Google Scholar] [CrossRef]
- Xu, H.; Taylor, R.G.; Xu, Y. Quantifying uncertainty in the impacts of climate change on river discharge in sub-catchments of the Yangtze and Yellow River Basins, China. Hydrol. Earth Syst. Sci. 2011, 15, 333–344. [Google Scholar] [CrossRef]
- Kay, A.L.; Davies, H.N.; Bell, V.A.; Jones, R.G. Comparison of uncertainty sources for climate change impacts: Flood frequency in England. Clim. Chang. 2009, 92, 41–63. [Google Scholar] [CrossRef] [Green Version]
- Intergovernmental Panel on Climate Change (IPCC). Climate Change—Synthesis Report; Cambridge University Press: Cambridge, UK, 2007; p. 73. [Google Scholar]
- Paeth, H.; Hall, N.M.; Gaertner, M.A.; Alonso, M.D.; Moumouni, S.; Polcher, J.; Ruti, P.M.; Fink, A.H.; Gosset, M.; Lebel, T. Progress in regional downscaling of West African precipitation. Atmos. Sci. Lett. 2011, 12, 75–82. [Google Scholar] [CrossRef]
- Biao, I.E.; Alamou, A.E.; Afouda, A. Improving rainfall-runoff modelling through the control of uncertainties under increasing climate variability in the Oueme River basin (Benin, West Africa). Hydrol. Sci. J. 2016, 61, 2902–2915. [Google Scholar] [CrossRef]
- Diekkrüger, B.; Busche, H.; Giertz, S.; Steup, G. Hydrology. In Impacts of Global Change on the Hydrological Cycle in West and Northwest Africa; Speth, P., Christoph, M., Diekkrüger, B., Eds.; Springer: Berlin/Heidelberg, Germany, 2010; pp. 60–64. [Google Scholar]
- Biao, I.E.; Gaba, C.O.U.; Alamou, A.E.; Afouda, A.A. Influence of the uncertainties related to the random component of rainfall inflow in the Oueme river basin (Benin, West Africa). Int. J. Curr. Eng. Technol. 2015, 5, 1618–1629. [Google Scholar]
- Fink, A.H.; Christhoph, M.; Born, K.; Brücher, T.; Piecha, K.; Pohle, S.; Schulz, O.; Ermert, V. Climate. In Impacts of Global Change on the Hydrological Cycle in West and Northwest Africa; Speth, P., Christoph, M., Diekkrüger, B., Eds.; Springer: Berlin/Heidelberg, Germany, 2010. [Google Scholar]
- Yang, W.; Andreasson, J.; Graham, L.P.; Olsson, J.; Rosberg, J.; Wetterhall, F. Distribution-based scaling to improve usability of regional climate model projections for hydrological climate change impacts studies. Hydrol. Res. 2010, 41, 211–229. [Google Scholar] [CrossRef]
- Wilks, D.S. Statistical Methods in the Atmospheric Sciences: An Introduction; Academic Press, Inc.: Burlington, MA, USA, 1995; p. 86. [Google Scholar]
- Haylock, M.R.; Cawley, G.C.; Harpham, C.; Wilby, R.L.; Goodess, C.M. Downscaling heavy precipitation over the United Kingdom: A comparison of dynamical and statistical methods and their future scenarios. Int. J. Climatol. 2006, 26, 1397–1415. [Google Scholar] [CrossRef]
- Yang, W.; Andreasson, J.; Graham, P.L.; Olsson, J.; Rosberg, J.; Wetterhall, F. A scaling method for applying RCM simulations to climate change impact studies in hydrology. In Proceedings of the XXV Nordic Hydrological Conference, Reykjavik, Iceland, 11–13 August 2008. [Google Scholar]
- Alamou, E. Application du Principe de Moindre Action a la Modélisation Pluie-Débit. Ph.D. Thesis, Université d’ Abomey Calavi, Abomey Calavi, Bernin, 2011. [Google Scholar]
- Afouda, A.; Alamou, E. Modèle hydrologique basé sur le principe de moindre action (MODHYPMA). Ann. Sci. Agron. Bénin 2010, 13, 23–45. [Google Scholar] [CrossRef]
- Nash, J.E.; Sutcliffe, J.V. River flow forecasting through conceptual models part I—A discussion of principles. J. Hydrol. 1970, 10, 282–290. [Google Scholar] [CrossRef]
- Essou, G.R.C.; Brissette, F. Climate change impacts on the Oueme river, Benin, West Africa. J. Earth Sci. Clim. Chang. 2013, 4, 161. [Google Scholar] [CrossRef]
- Boko, M.; Niang, A.; Nyong, C.; Vogel, A.; Githeko Medany, M. Impacts, Adaptation and Vulnerability; Contribution of Working Group II to the Fourth Assessment Report of the Intergovernmental Panel on Climate Change; Cambridge University Press: Cambridge, UK, 2007. [Google Scholar]
- Roudier, P.; Ducharne, A.; Feyen, L. Climate change impacts on runoff in West Africa: A review. Hydrol. Earth Syst. Sci. 2014, 18, 2789–2801. [Google Scholar] [CrossRef]
Figure 1.
Study areas and the hydrometeorological stations used.

Figure 2.
Schematic structure of HyMoLAP

Figure 3.
Distribution based scaling for Bétérou catchment daily precipitations (top): HIRHAM5 for 1962 (left) RCA4 for 1988 (right) and for Bonou catchment daily precipitations (bottom): HIRHAM5 for 1962 (left); RCA4 for 1988 (right).
Figure 3.
Distribution based scaling for Bétérou catchment daily precipitations (top): HIRHAM5 for 1962 (left) RCA4 for 1988 (right) and for Bonou catchment daily precipitations (bottom): HIRHAM5 for 1962 (left); RCA4 for 1988 (right).
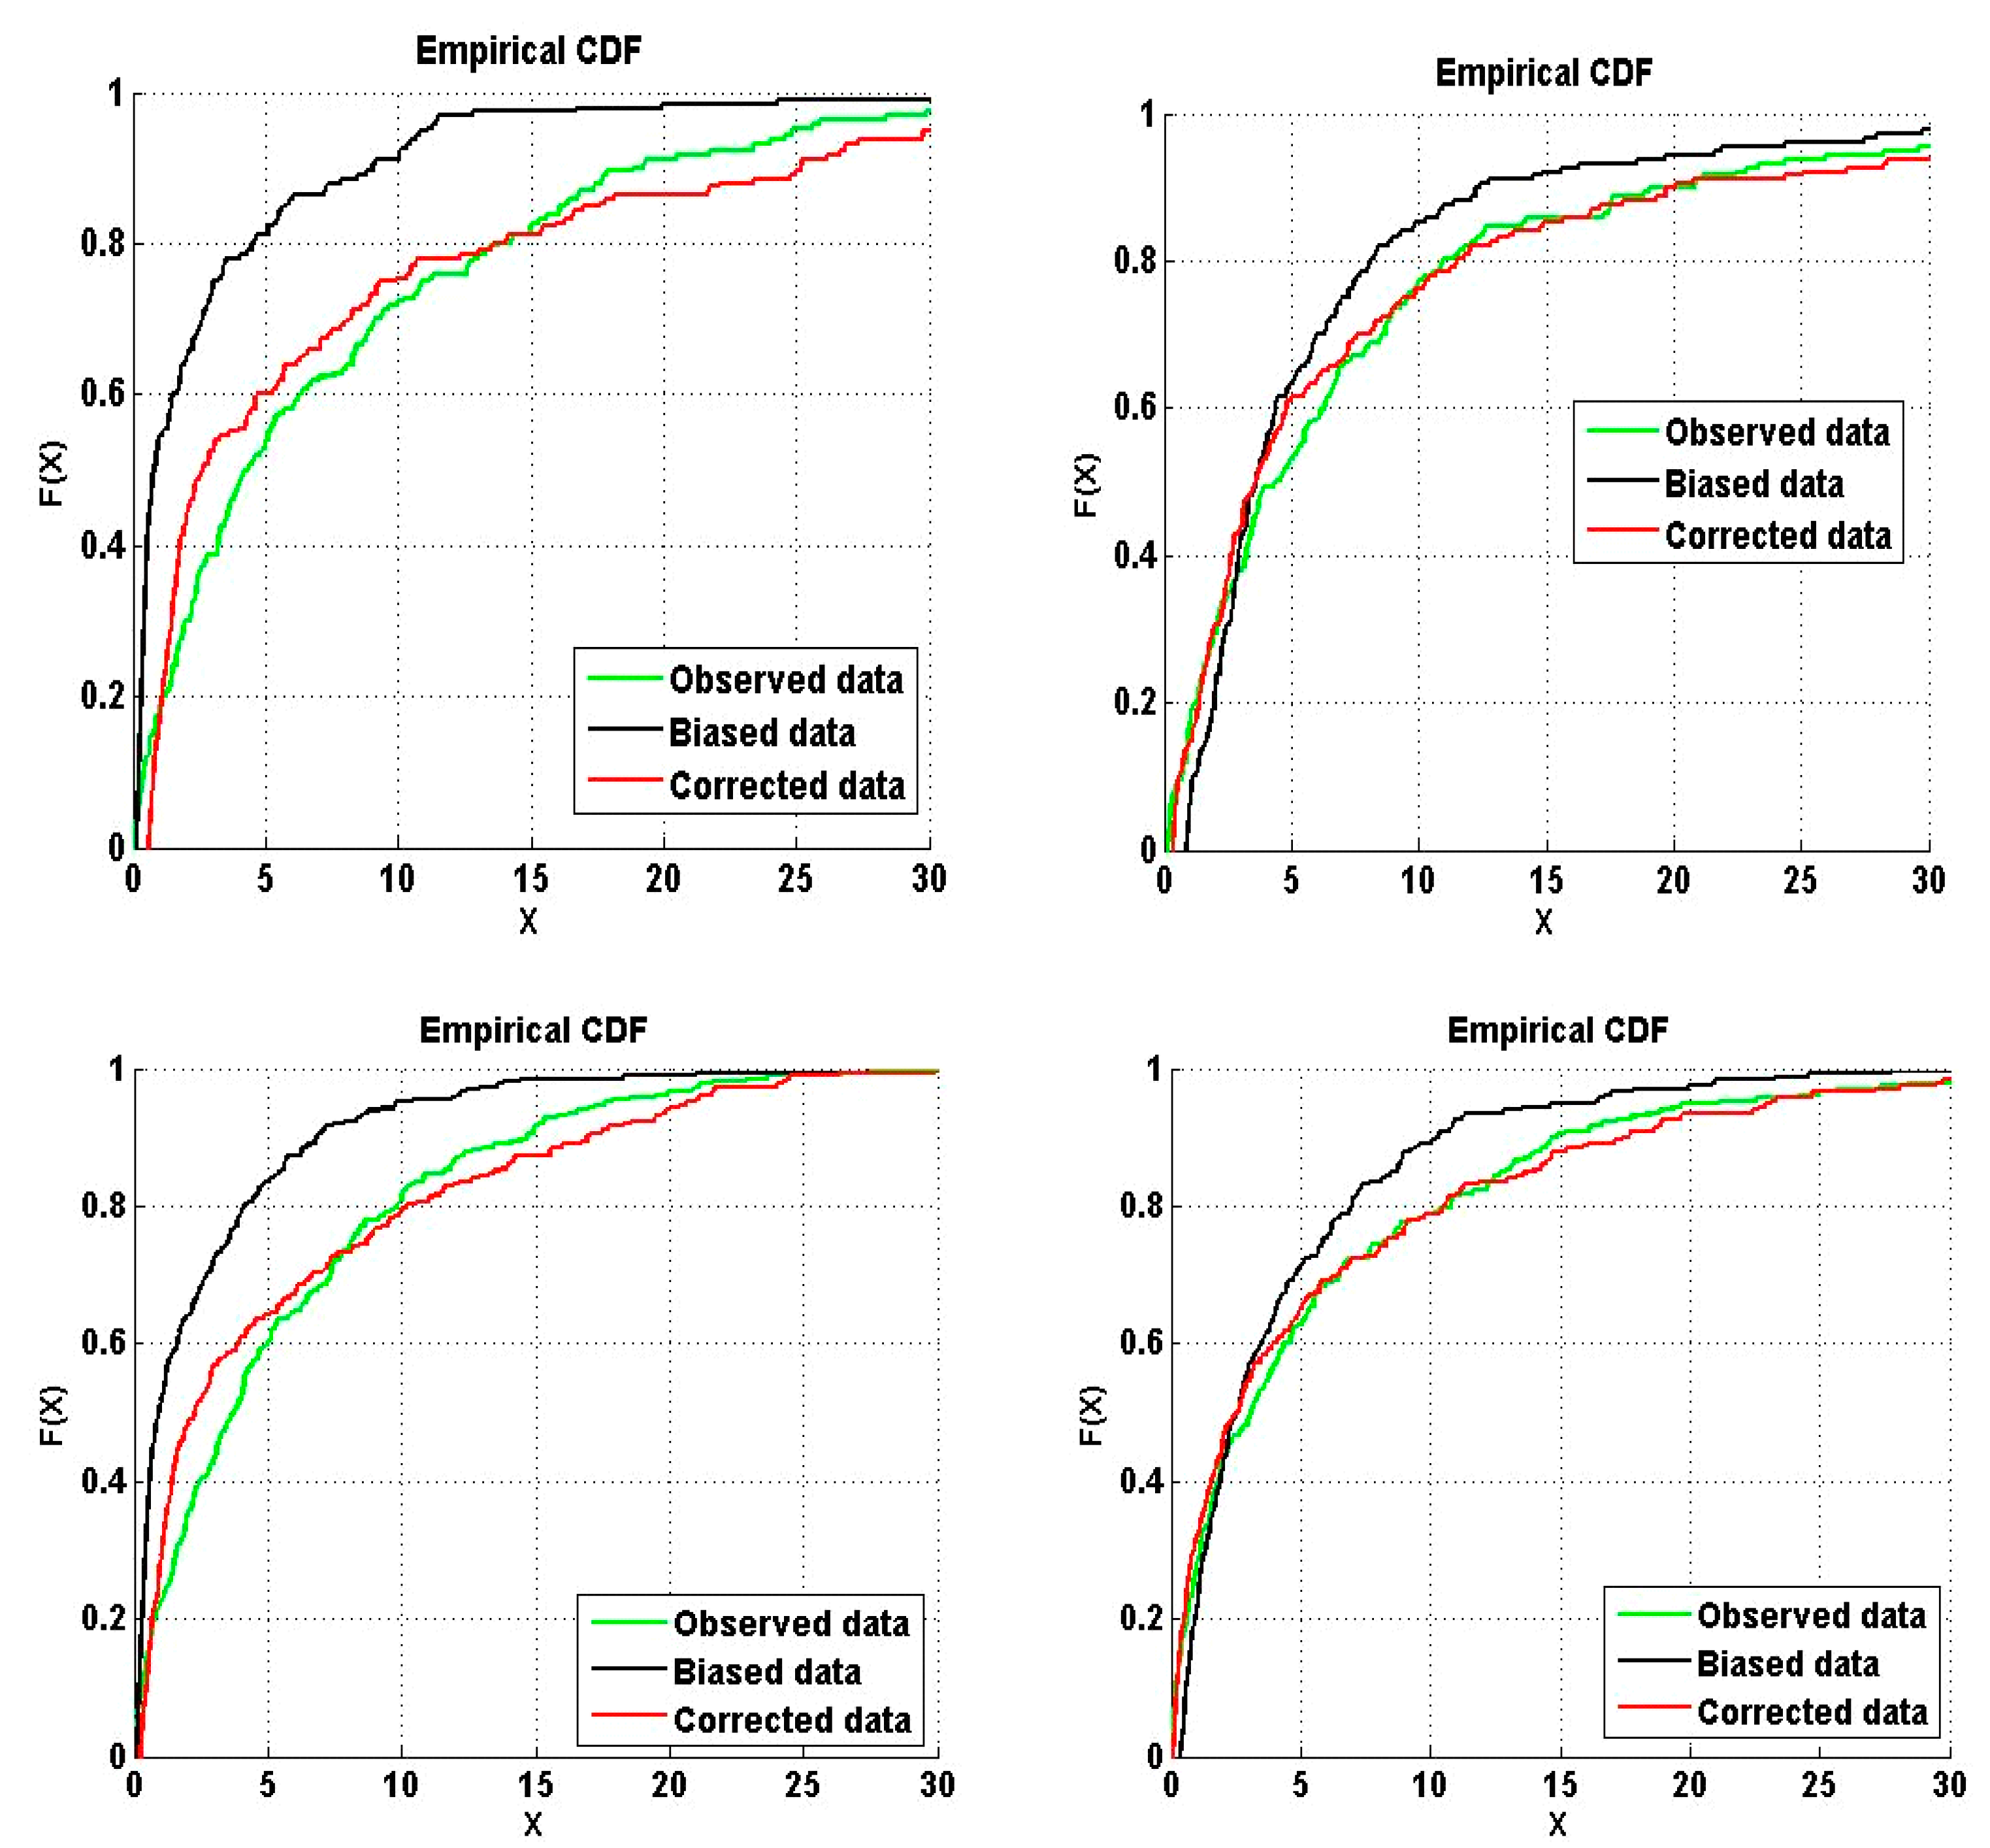
Figure 4.
Observed annual, raw RCM and corrected bias rainfall over the period 1961–1990 for Bétérou (top): HIRHAM5 rainfall (left), RCA4 rainfall (right) and Bonou (bottom): HIRHAM5 rainfall (left), RCA4 rainfall (right) catchments of the Ouémé River.
Figure 4.
Observed annual, raw RCM and corrected bias rainfall over the period 1961–1990 for Bétérou (top): HIRHAM5 rainfall (left), RCA4 rainfall (right) and Bonou (bottom): HIRHAM5 rainfall (left), RCA4 rainfall (right) catchments of the Ouémé River.
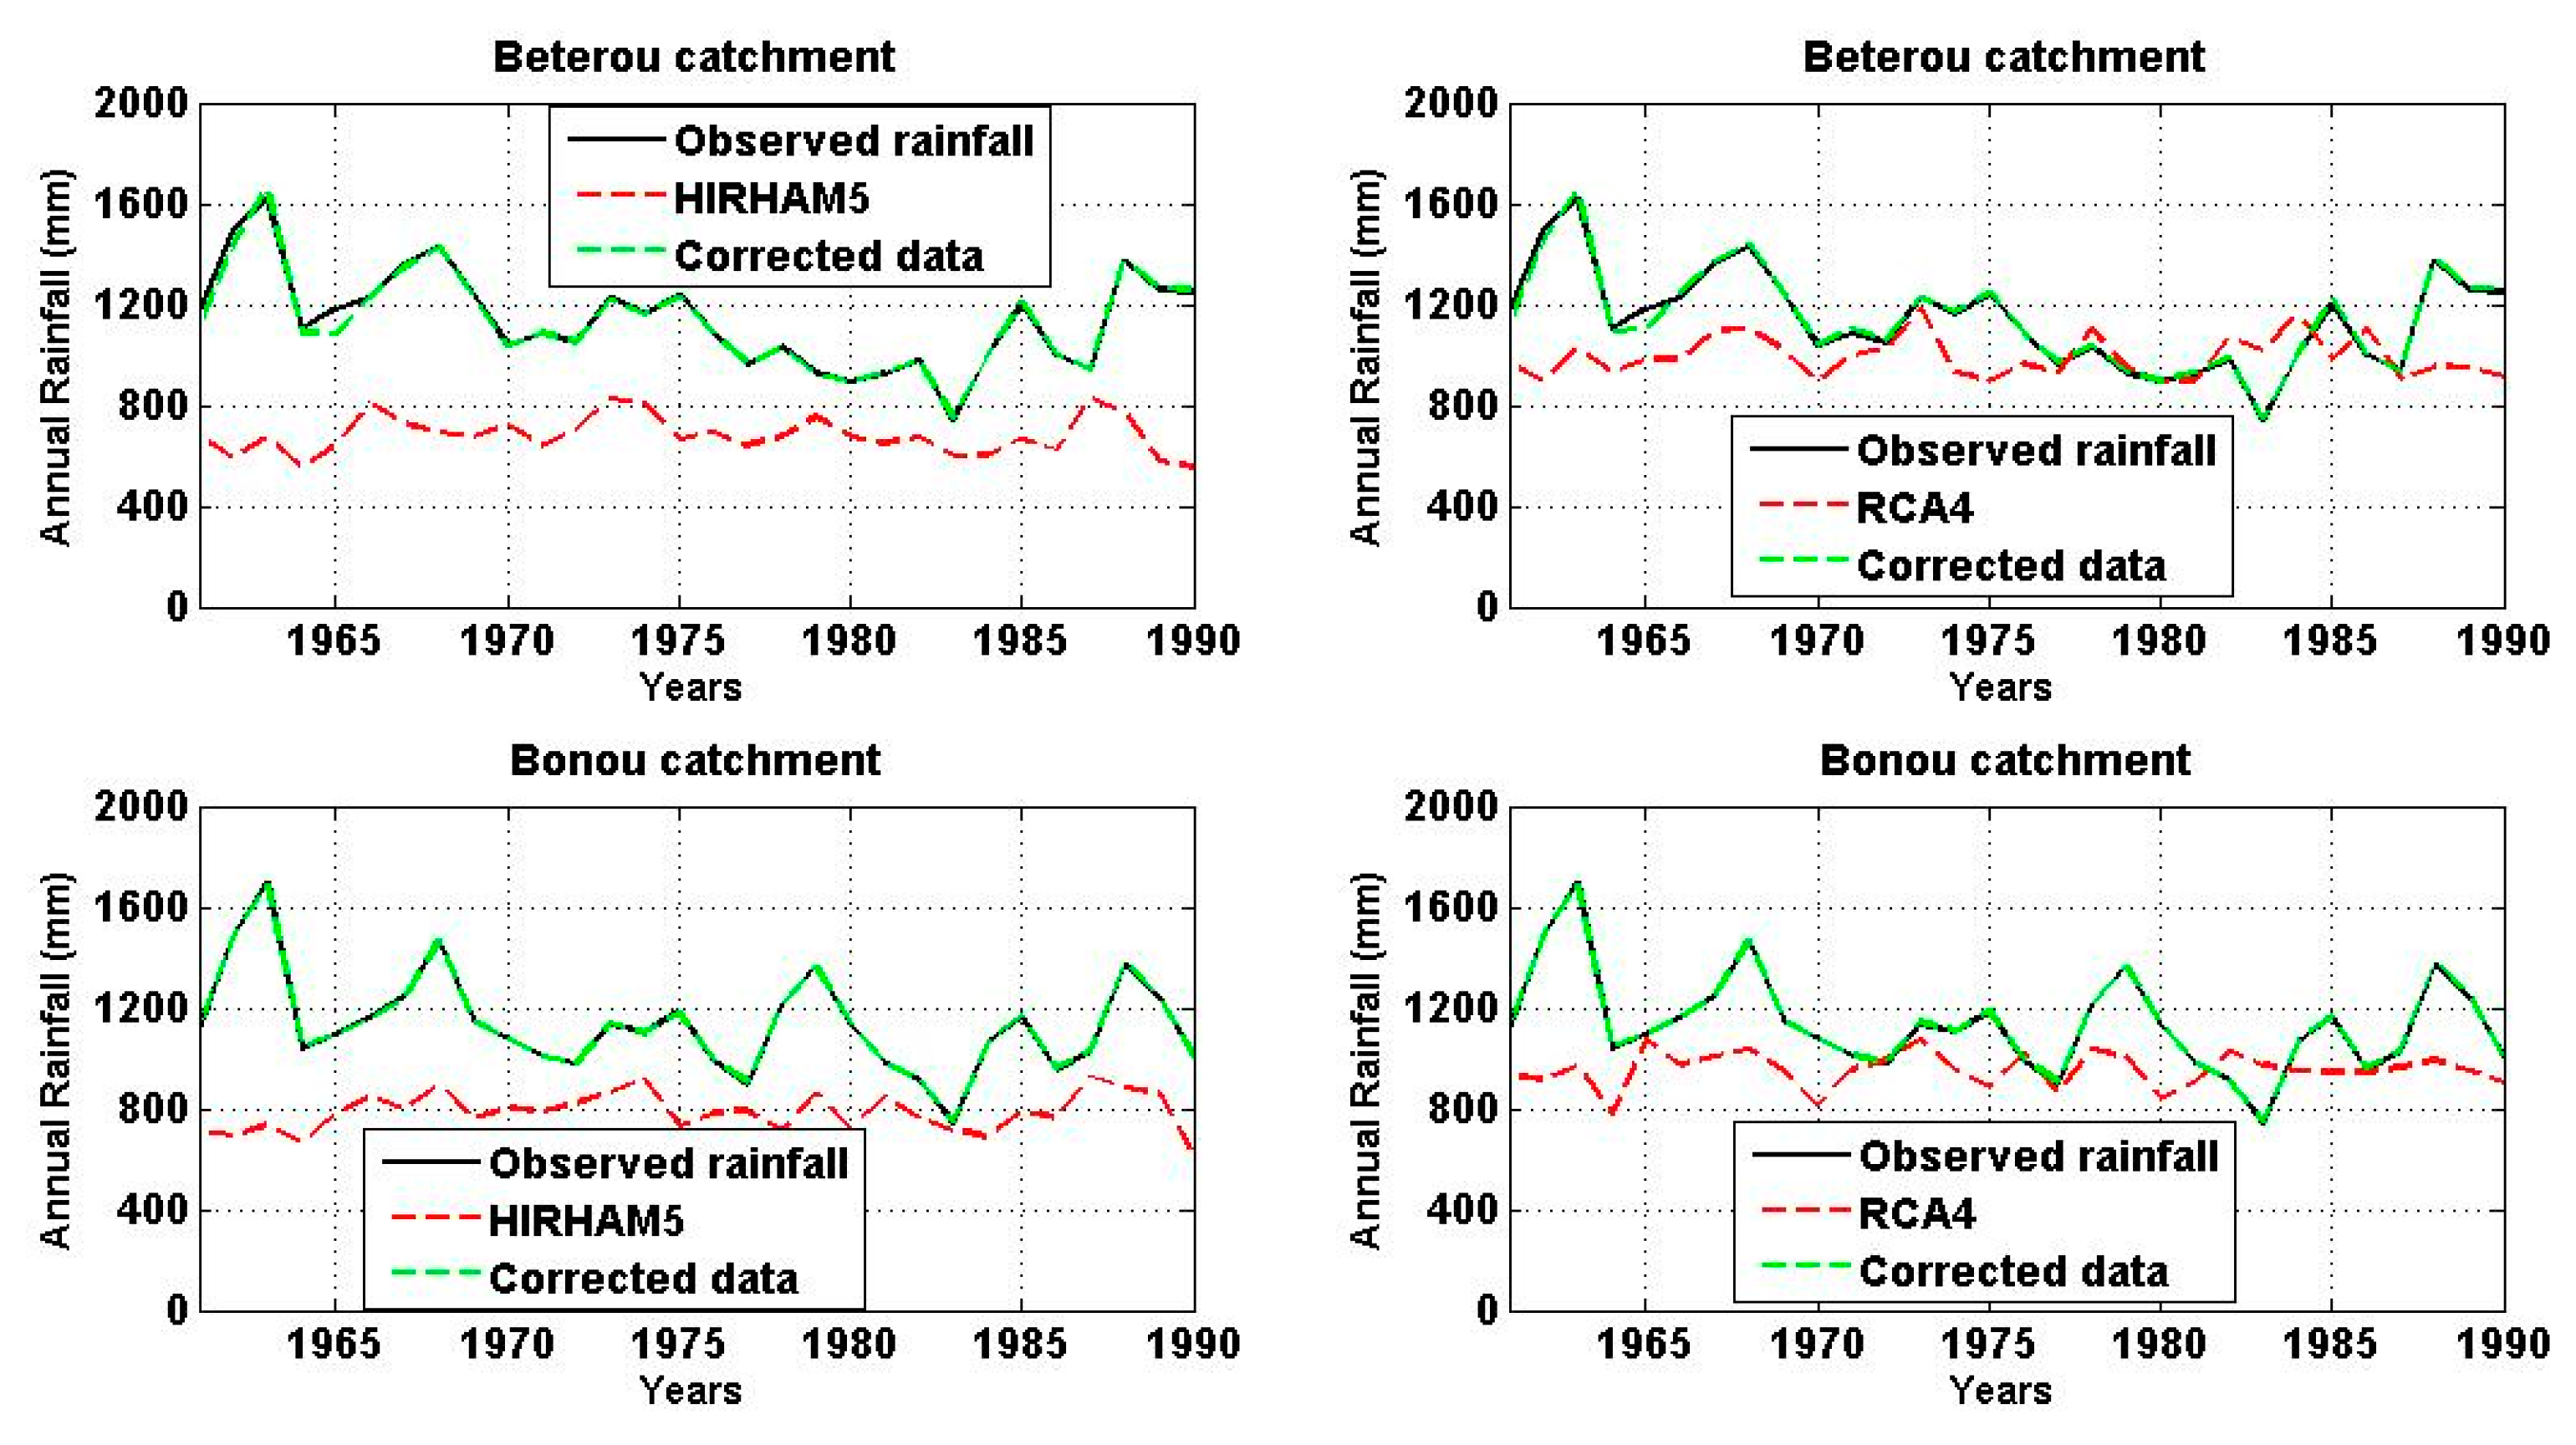
Figure 5.
Seasonal cycle of raw and corrected RCM over the period 1961–1990 in Bétérou (top): HIRHAM5 rainfall (left), RCA4 rainfall (right) and Bonou (bottom): HIRHAM5 rainfall (left), RCA4 rainfall (right) catchments.
Figure 5.
Seasonal cycle of raw and corrected RCM over the period 1961–1990 in Bétérou (top): HIRHAM5 rainfall (left), RCA4 rainfall (right) and Bonou (bottom): HIRHAM5 rainfall (left), RCA4 rainfall (right) catchments.

Figure 6.
Example based on mean daily temperature in Bétérou catchment from observations (1961–1990), HIRHAM5 and corrected temperature.
Figure 6.
Example based on mean daily temperature in Bétérou catchment from observations (1961–1990), HIRHAM5 and corrected temperature.
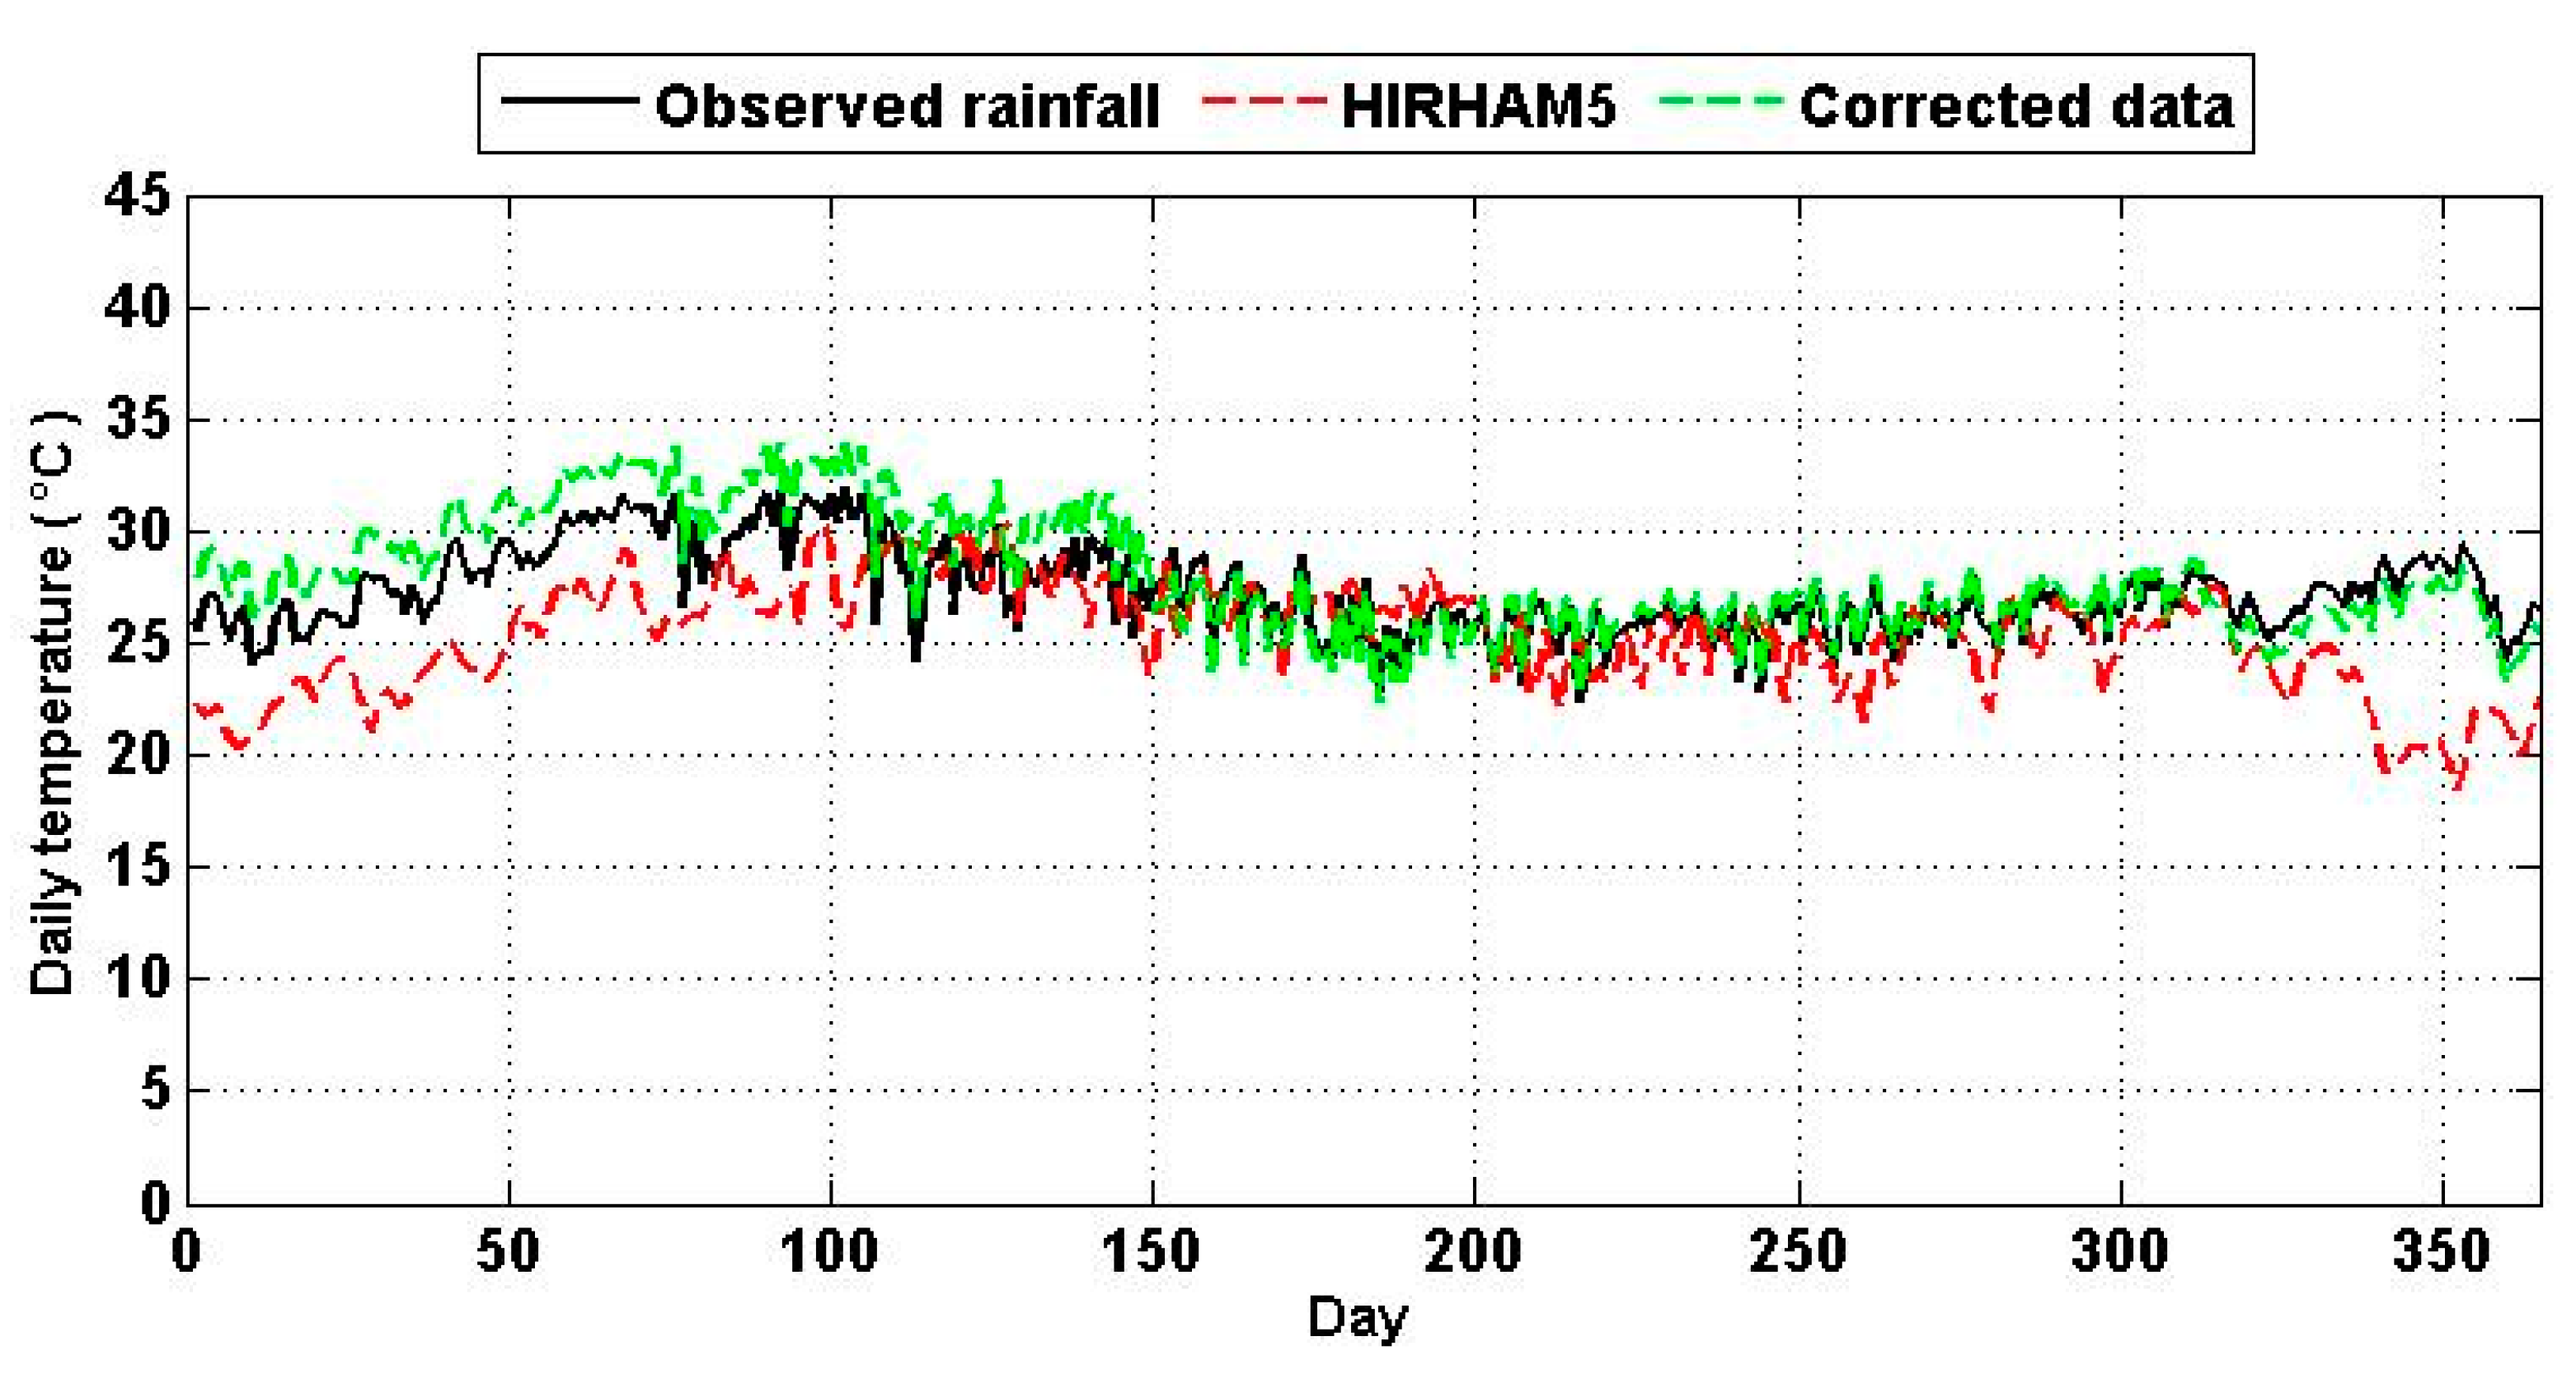
Figure 7.
Annual mean of river discharge in Bétérou (left) and Bonou (right) catchments.

Figure 8.
Observed and simulated mean hydrographs for Bétérou (top) and Bonou (bottom) catchments for calibration and validation periods.
Figure 8.
Observed and simulated mean hydrographs for Bétérou (top) and Bonou (bottom) catchments for calibration and validation periods.

Figure 9.
Average hydrographs for HIRHAM5 and RCA4 projections for the 2020s, 2050s and 2080s time horizons and the 1961–1990 baseline for the Bétérou catchment (top) and Bonou catchment (bottom) derived from RCP4.5 scenarios.
Figure 9.
Average hydrographs for HIRHAM5 and RCA4 projections for the 2020s, 2050s and 2080s time horizons and the 1961–1990 baseline for the Bétérou catchment (top) and Bonou catchment (bottom) derived from RCP4.5 scenarios.
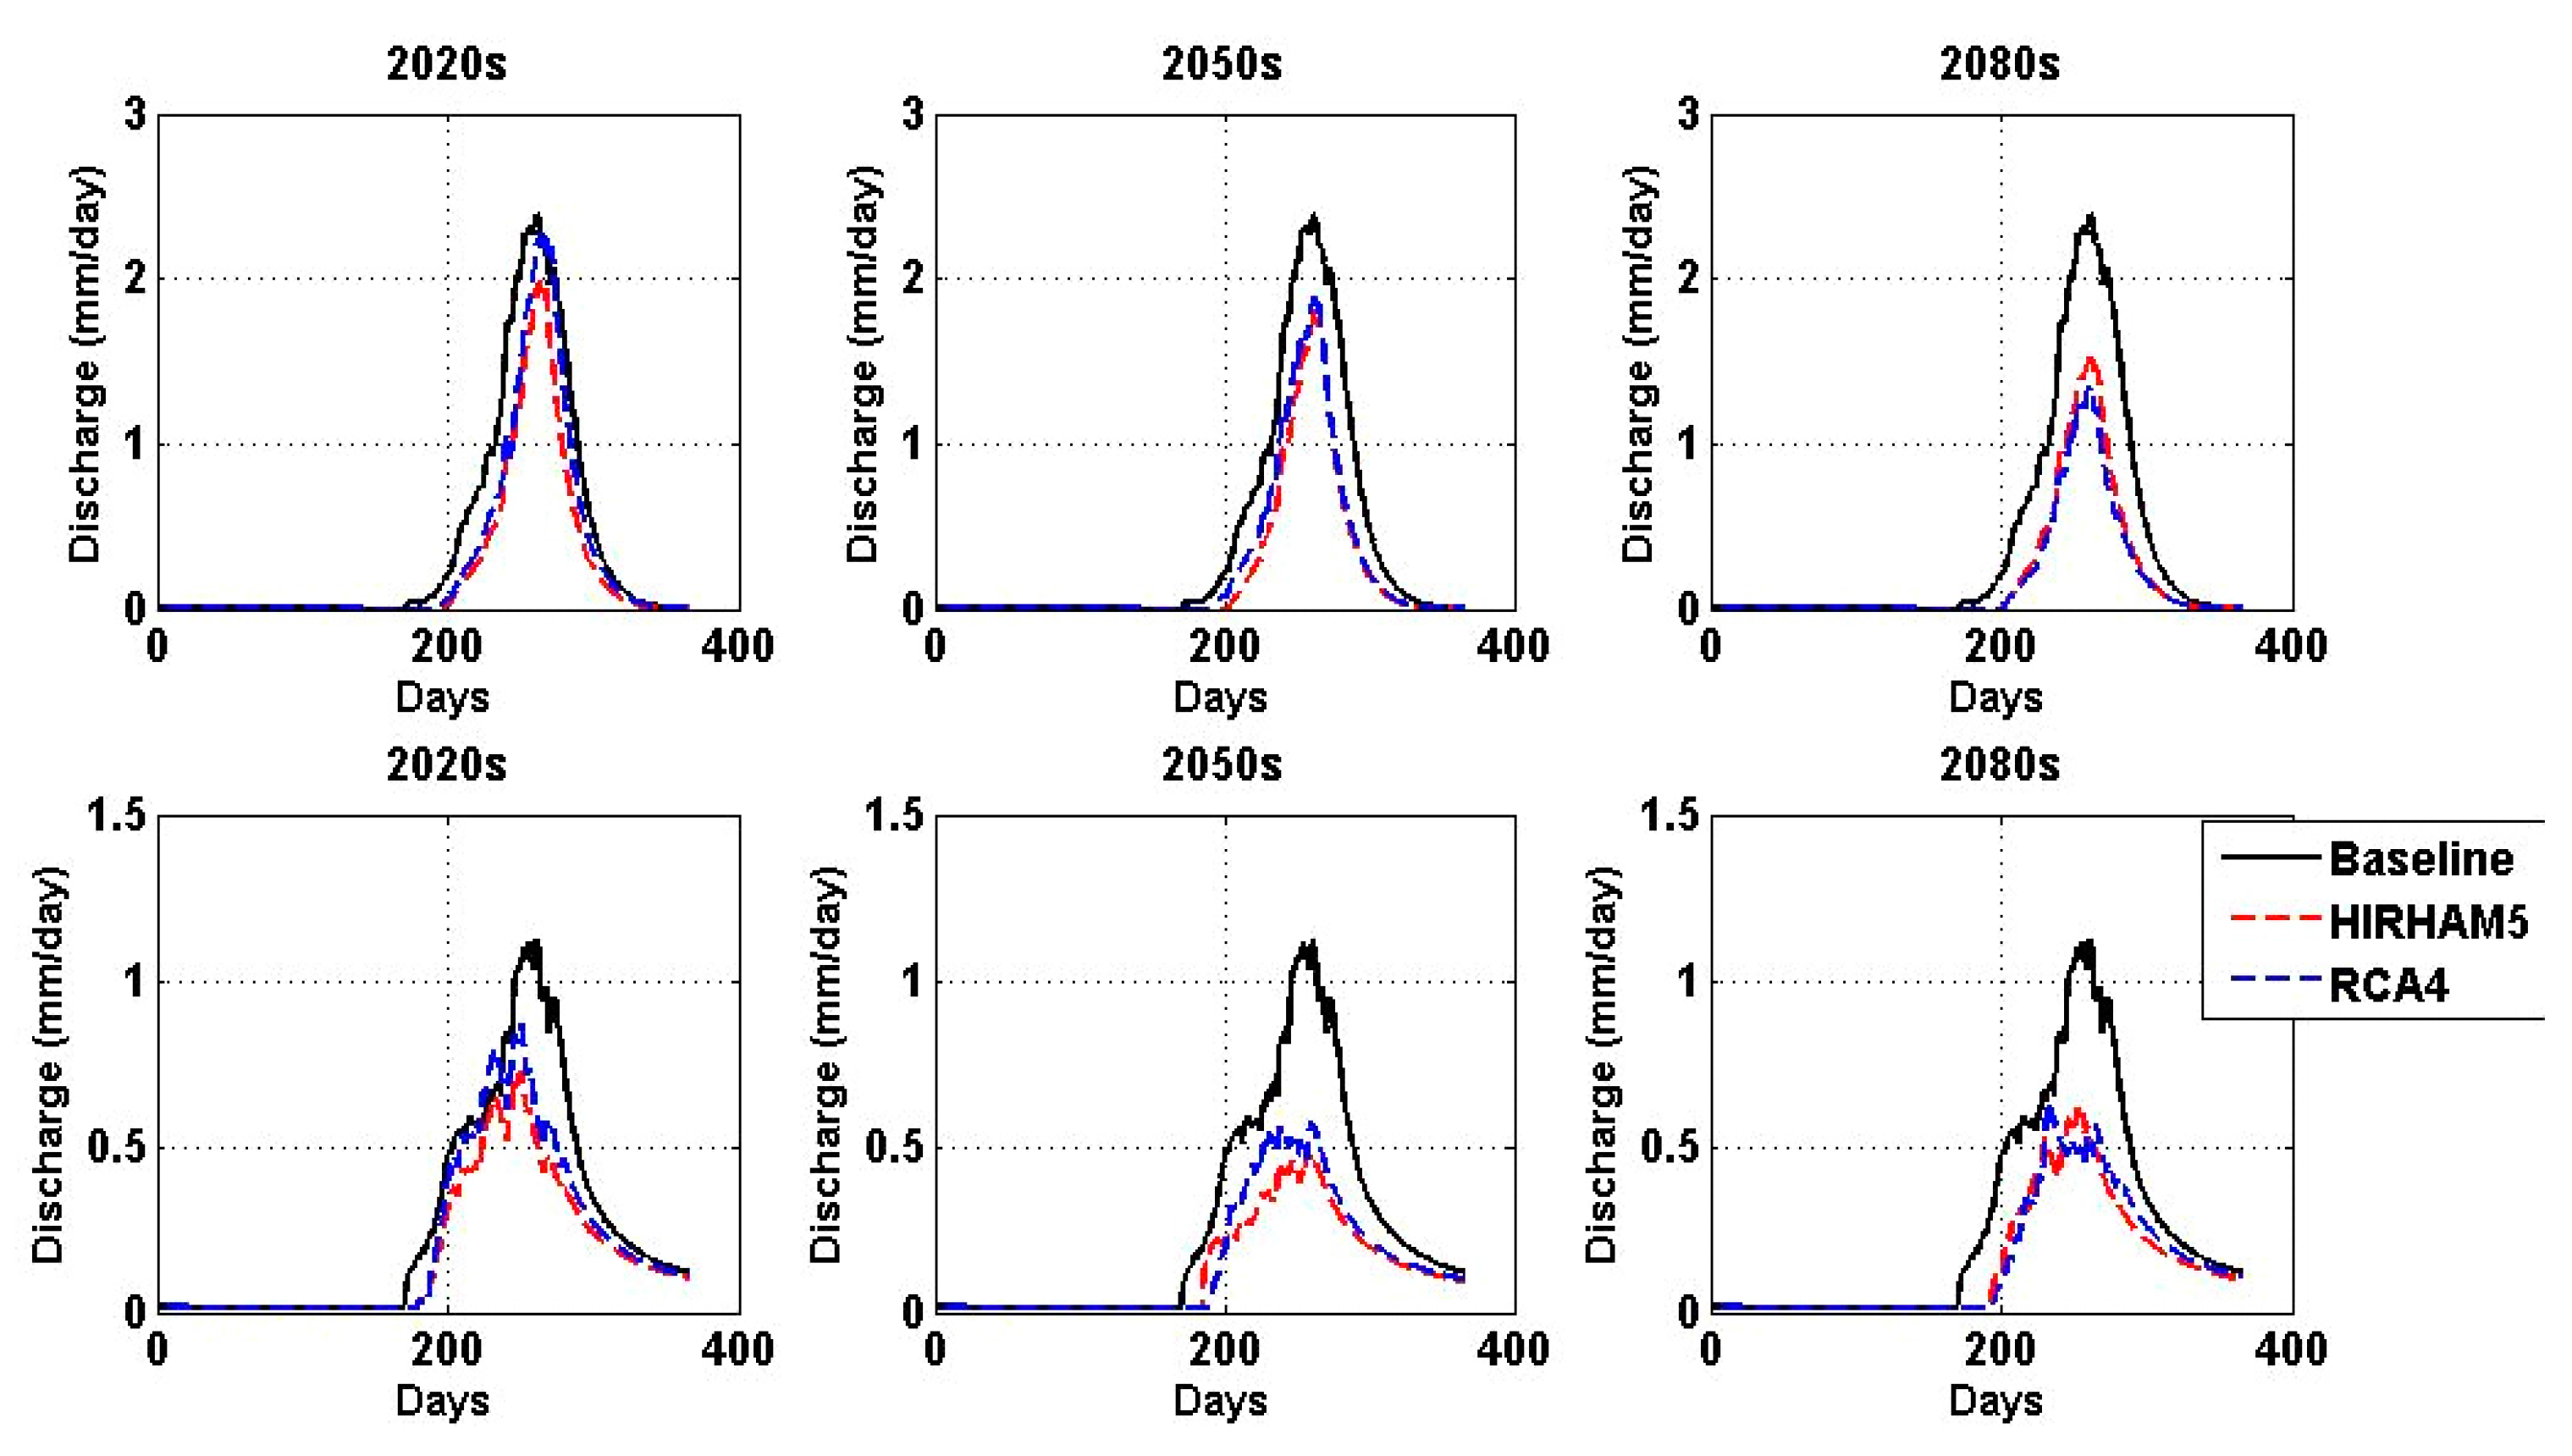
Figure 10.
Average hydrographs for HIRHAM5 and RCA4 projections for the 2020s, 2050s and 2080s time horizons and the 1961–1990 baseline for the Bétérou catchment (top) and Bonou catchment (bottom) derived from RCP8.5 scenarios.
Figure 10.
Average hydrographs for HIRHAM5 and RCA4 projections for the 2020s, 2050s and 2080s time horizons and the 1961–1990 baseline for the Bétérou catchment (top) and Bonou catchment (bottom) derived from RCP8.5 scenarios.
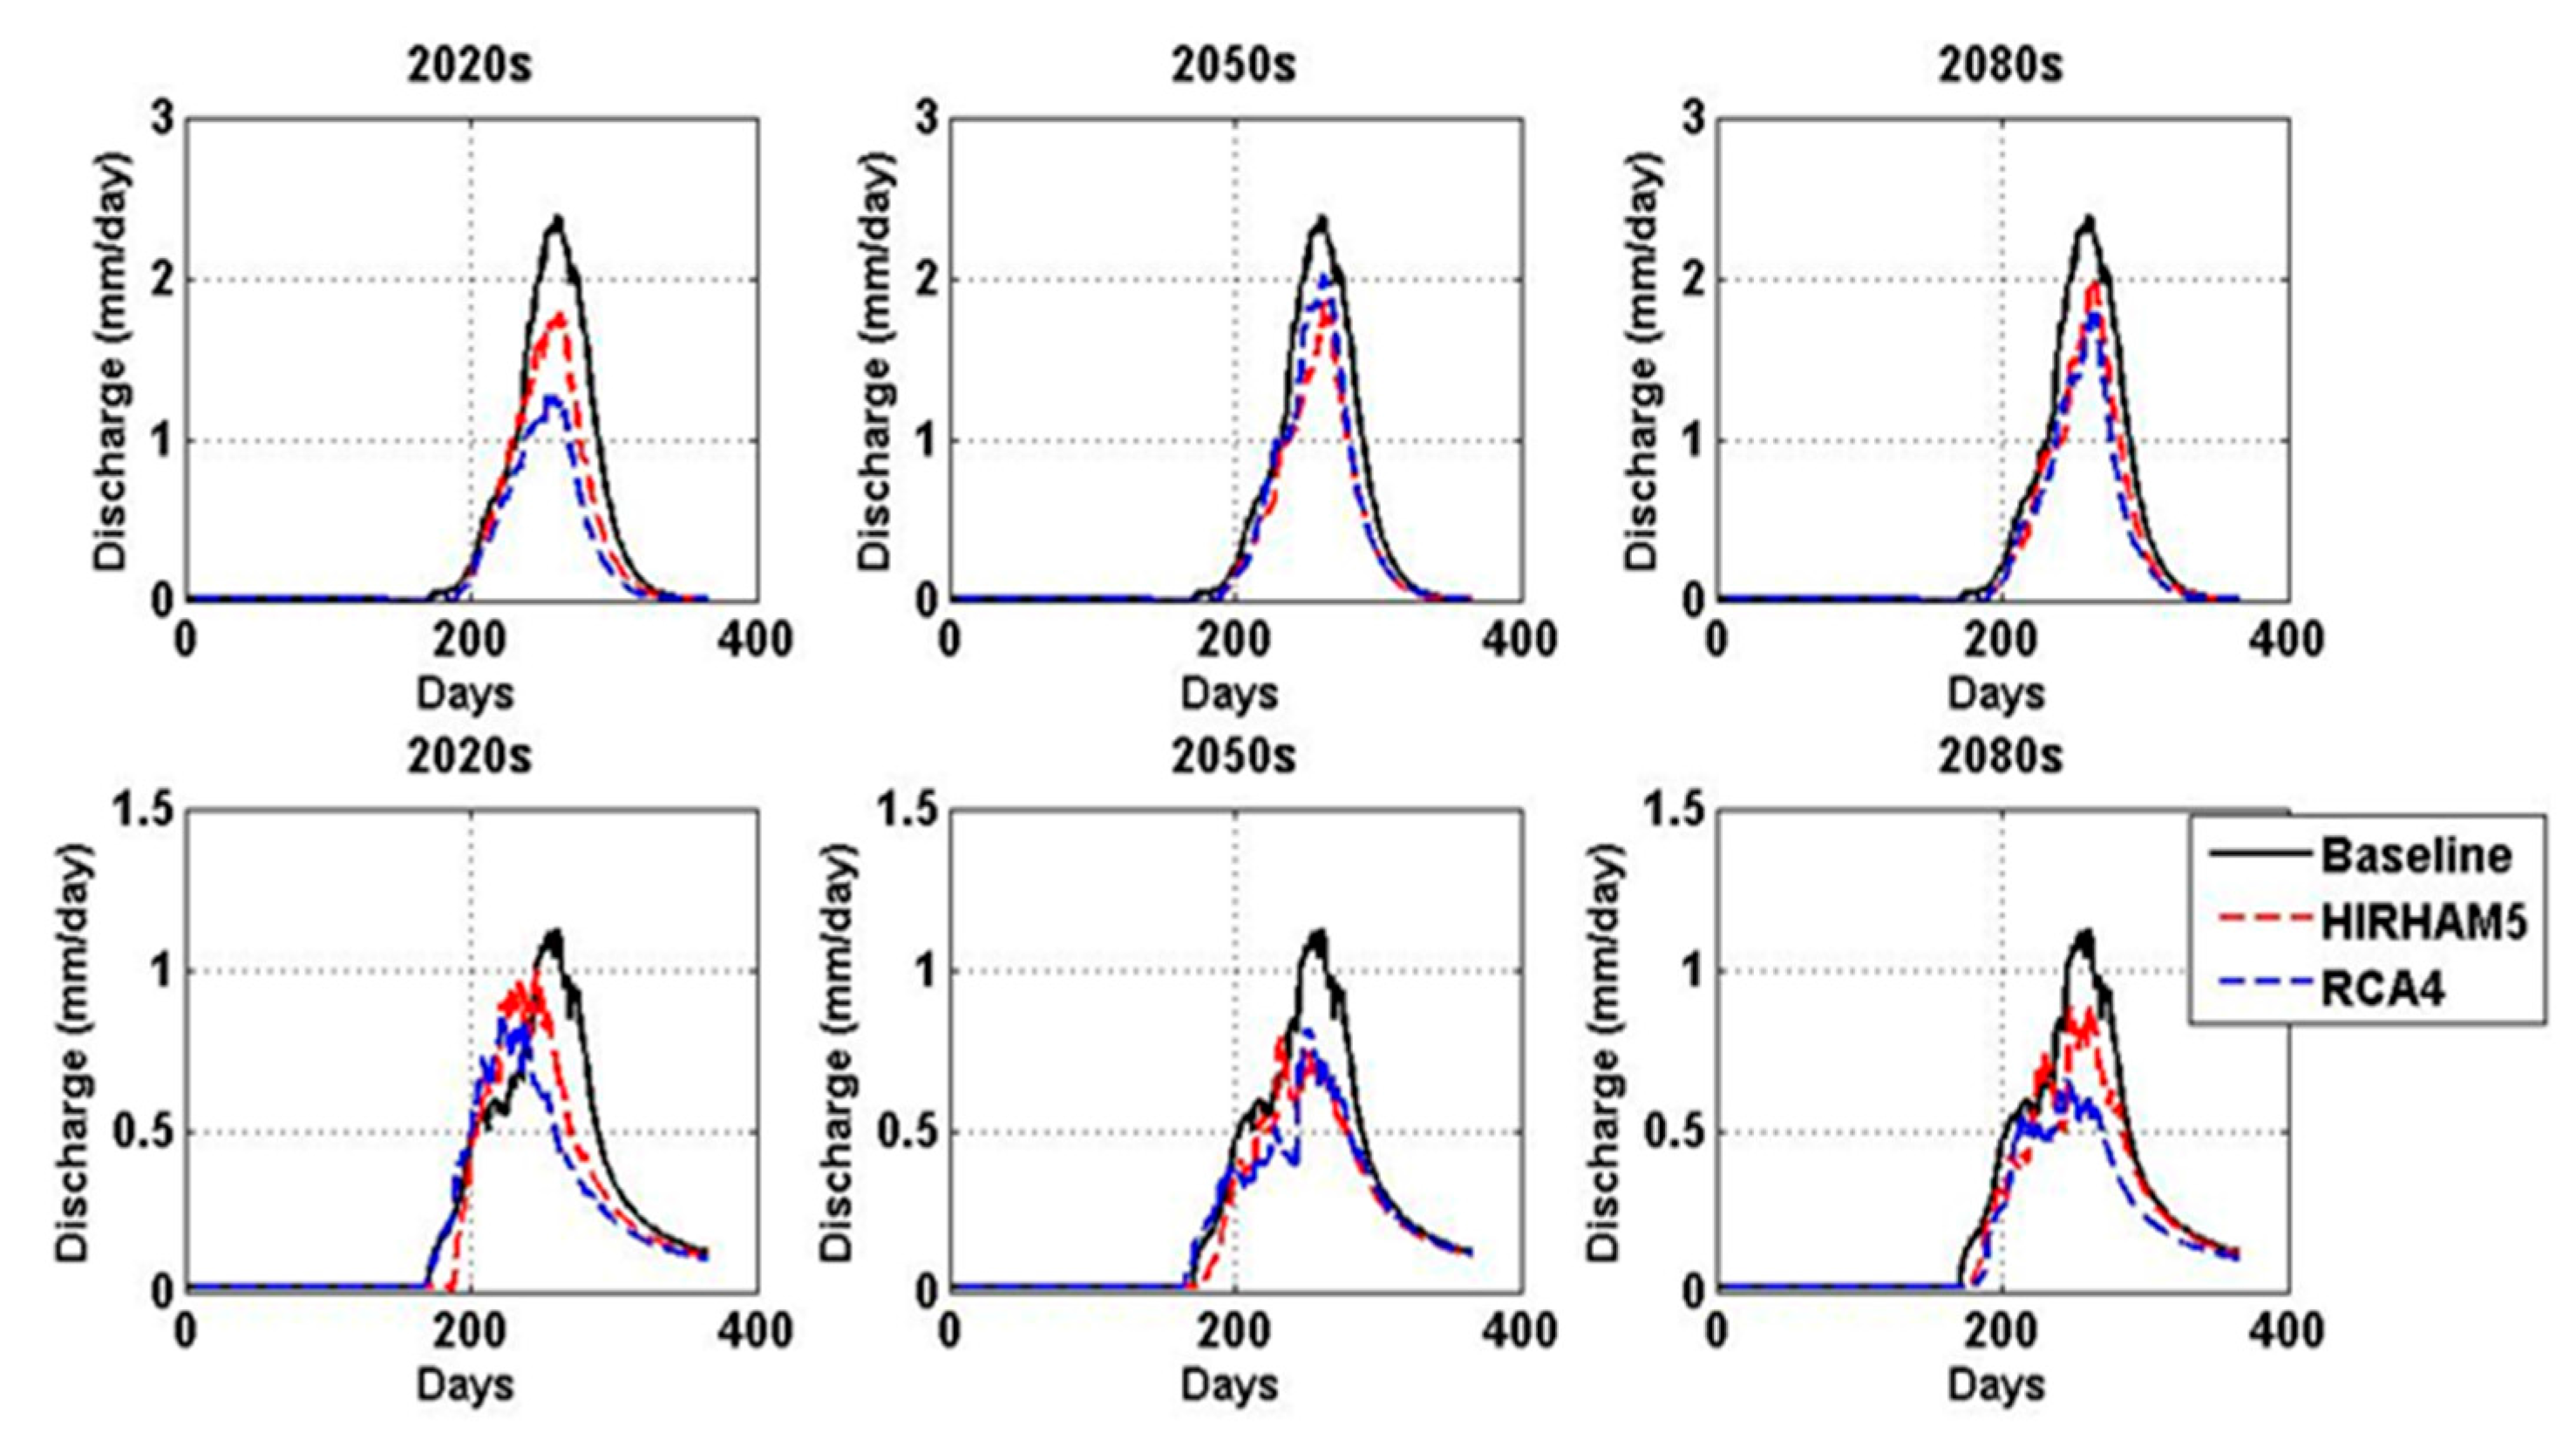
Figure 11.
Probability distribution functions of annual mean discharge for the 2020s, 2050s and 2080s time horizons and the 1961–1990 baseline for the Bétérou catchment (top) and Bonou catchment (bottom) derived from RCP4.5 scenarios.
Figure 11.
Probability distribution functions of annual mean discharge for the 2020s, 2050s and 2080s time horizons and the 1961–1990 baseline for the Bétérou catchment (top) and Bonou catchment (bottom) derived from RCP4.5 scenarios.


Table 1.
Performance statistics comparing observed annual rainfall, raw annual HIRHAM5 rainfall, corrected annual HIRHAM5, raw annual RCA4 rainfall and corrected annual RCA4 rainfall.
Table 1.
Performance statistics comparing observed annual rainfall, raw annual HIRHAM5 rainfall, corrected annual HIRHAM5, raw annual RCA4 rainfall and corrected annual RCA4 rainfall.
| Beterou | Bonou | |||||||
|---|---|---|---|---|---|---|---|---|
| HIRHAM5 | Corrected HIRHAM5 | RCA4 | Corrected RCA4 | HIRHAM5 | Corrected HIRHAM5 | RCA4 | Corrected RCA4 | |
| RMSE (mm/year) | 502.201 | 25.238 | 250.385 | 21.145 | 399.884 | 5.228 | 262.164 | 5.349 |
| MAE (mm/year) | 460.029 | 12.734 | 197.437 | 13.568 | 348.198 | 4.340 | 203.665 | 4.610 |
Table 2.
Performance criteria of the hydrological model based on the least action principle (HyMoLAP) for the Bétérou and Bonou catchments, of the Oueme River.
Table 2.
Performance criteria of the hydrological model based on the least action principle (HyMoLAP) for the Bétérou and Bonou catchments, of the Oueme River.
| Calibration | Validation | |||||
|---|---|---|---|---|---|---|
| CE | R2 | APB (%) | CE | R2 | APB (%) | |
| Bétérou | 0.93 | 0.93 | 13.05 | 0.76 | 0.87 | 39.1 |
| Bonou | 0.90 | 0.89 | 25.17 | 0.88 | 0.69 | 29.27 |
© 2017 by the author. Licensee MDPI, Basel, Switzerland. This article is an open access article distributed under the terms and conditions of the Creative Commons Attribution (CC BY) license (http://creativecommons.org/licenses/by/4.0/).
Share and Cite
MDPI and ACS Style
Biao, E.I. Assessing the Impacts of Climate Change on River Discharge Dynamics in Oueme River Basin (Benin, West Africa). Hydrology 2017, 4, 47. https://doi.org/10.3390/hydrology4040047
AMA Style
Biao EI. Assessing the Impacts of Climate Change on River Discharge Dynamics in Oueme River Basin (Benin, West Africa). Hydrology. 2017; 4(4):47. https://doi.org/10.3390/hydrology4040047
Chicago/Turabian StyleBiao, Eliézer Iboukoun. 2017. "Assessing the Impacts of Climate Change on River Discharge Dynamics in Oueme River Basin (Benin, West Africa)" Hydrology 4, no. 4: 47. https://doi.org/10.3390/hydrology4040047
Note that from the first issue of 2016, this journal uses article numbers instead of page numbers. See further details here.