RCP8.5-Based Future Flood Hazard Analysis for the Lower Mekong River Basin
by
 and
and
Edangodage Duminda Pradeep Perera
1,*, 
Takahiro Sayama
2,
Jun Magome
3,
Akira Hasegawa
4 and
Yoichi Iwami
5 1
United Nations University–Institute forWater, Environment and Health, Hamilton, ON L8P 0A1, Canada
2
Disaster Prevention Research Institute, Kyoto University, Kyoto 611-0011, Japan
3
International Research Centre for River Basin Environment, University of Yamanashi, Kofu 400-8511, Japan
4
International Centre for Water Hazard and Risk Management, Public Works Research Institute, Tsukuba, Ibaraki 302-8516, Japan
5
Nagasaki Prefectural Civil Engineering Department, Nagasaki 850-8570, Japan
*
Author to whom correspondence should be addressed.
Hydrology 2017, 4(4), 55; https://doi.org/10.3390/hydrology4040055
Submission received: 13 September 2017
/
Revised: 17 November 2017
/
Accepted: 21 November 2017
/
Published: 23 November 2017
(This article belongs to the Special Issue Advances in Large Scale Flood Monitoring and Detection)
Abstract
:Climatic variations caused by the excessive emission of greenhouse gases are likely to change the patterns of precipitation, runoff processes, and water storage of river basins. Various studies have been conducted based on precipitation outputs of the global scale climatic models under different emission scenarios. However, there is a limitation in regional- and local-scale hydrological analysis on extreme floods with the combined application of high-resolution atmospheric general circulation models’ (AGCM) outputs and physically-based hydrological models (PBHM). This study has taken an effort to overcome that limitation in hydrological analysis. The present and future precipitation, river runoff, and inundation distributions for the Lower Mekong Basin (LMB) were analyzed to understand hydrological changes in the LMB under the RCP8.5 scenario. The downstream area beyond the Kratie gauging station, located in the Cambodia and Vietnam flood plains was considered as the LMB in this study. The bias-corrected precipitation outputs of the Japan Meteorological Research Institute atmospheric general circulation model (MRI-AGCM3.2S) with 20 km horizontal resolution were utilized as the precipitation inputs for basin-scale hydrological simulations. The present climate (1979–2003) was represented by the AMIP-type simulations while the future (2075–2099) climatic conditions were obtained based on the RCP8.5 greenhouse gas scenario. The entire hydrological system of the Mekong basin was modelled by the block-wise TOPMODEL (BTOP) hydrological model with 20 km resolution, while the LMB area was modelled by the rainfall-runoff-inundation (RRI) model with 2 km resolution, specifically to analyze floods under the aforementioned climatic conditions. The comparison of present and future river runoffs, inundation distributions and inundation volume changes were the outcomes of the study, which can be supportive information for the LMB flood management, water policy, and water resources development.
1. Introduction
Reports published by the Intergovernmental Panel on Climate Change (IPCC) [1,2] have mentioned that the intensity and frequency of heavy precipitation will increase in the future due to climate change. The projections given by the IPCC reports were based on simulation results from several general circulation models (GCMs), and many studies have assessed changes in hydrological characteristics due to climate change by using those GCM outputs. Such changes may be catastrophic by the end of the 21st century due to climate change impacts unless sustainable mitigation actions are not taken in a prompt manner. Researchers suggest that there is a high possibility that the frequency and magnitude of flood disasters will increase globally [2,3,4]. Therefore, quantitative and qualitative assessments of changes in flood characteristics under climate change in river basins are critically important, and are strongly requested by policy-makers, river engineers, and flood fighters for practical river basin management against increasing flood risk. In this context, a study of future extreme flood events is essential. Overwhelming emissions of greenhouse gases are likely to alter the global climate and, consequently, the hydrological characteristics of river basins would be affected significantly, causing severe droughts and floods. Changes in patterns, intensity, and frequency of precipitation should be assessed to understand future extreme floods more deeply because such climate variations are threats to the existence of all ecosystems. Understanding of future rainfall and river discharge variations, trends, and volumes is also essential, considering the impacts on river basins from extreme floods, long-lasting droughts, water storage, and other events due to climate change. Flood risk management procedures that are carefully designed will benefit communities vulnerable to extreme floods in the future. Scientific understanding of climatic conditions and technical advances in climatic and hydrological modelling can make climate change studies more sophisticated and rational.
GCMs are used as the main tool to produce climatic variables under various greenhouse gas emission scenarios. Past, present, and future conditions of climatic variables can be produced by GCMs under given various driving forces. Still, their future predictions remain uncertain to some degree due to uncertainties in the emission scenarios [1]. Moreover, factors, such as limited spatial resolutions, simplified physics and thermodynamic processes, numerical schemes, or incomplete knowledge of climate system processes can increase the uncertainty of the GCM outputs [5]. Uncertainties arising from GCMs and emission scenarios have been investigated by several studies [6,7,8,9]. Despite uncertainties in GCM predictions, their approximations for future climatic conditions are still useful to understand and prepare for possible future climatic hazards.
Studies have shown that possible impact of climate change varies significantly, depending on the selection of emission scenarios [10,11]. The IPCC 5th Assessment Report (AR5), published in 2013, introduced “Representative Concentration Pathways (RCPs)” as a new set of greenhouse gas emission scenarios. There are four RCPs, namely, RCP2.6, RCP4.5, RCP6.0, and RCP8.5. Those RCPs were determined considering the possible range of radiative forcing values (W/m2) in the year 2100, with their numbers referring to low, intermediate, moderate, and excessive levels of greenhouse gas emissions. RCP8.5 corresponds to the highest greenhouse gas emissions pathway among the four. Its main assumptions are relatively slow income growth, high population, modest rates of technological advances, and high energy consumption which leads to long-term high emissions of greenhouse gases in the absence of climate change policy [12]. It is termed as the ‘baseline’ scenario since no other specific climate mitigation targets are included in RCP8.5. Therefore, the RCP8.5 scenario should be used in a study where the most extreme disasters under climate change are analyzed.
GCMs are generally recognized as capable of producing global climatic parameters reasonably well. However, they are not advanced enough to produce accurate climatic parameters on a local or regional scale due to their coarse resolutions. Hence, the application of different downscaling techniques is inevitable to use coarse-resolution GCM outputs. Basically, two categories of downscaling techniques, i.e., statistical downscaling and dynamical downscaling, are commonly used. Dynamical downscaling extracts regional-scale information from coarse-resolution GCMs and produces regional climatic dynamics [13]. Statistical downscaling develops empirical relationships between local climate variables (e.g., surface air temperature and precipitation) and large-scale predictors (e.g., pressure fields), and applies those relationships to GCM outputs [14]. The comparison of those two techniques and their merits and demerits are explained in several studies [15,16,17].
Uncertainties caused by coarse-resolution GCMs and limitations of downscaling techniques can be minimized by utilizing super high-resolution GCM outputs. To this end, the 20 km high-resolution atmospheric general circulation model (AGCM), a state-of-art AGCM developed by the Meteorological Research Institute of Japan and commonly called MRI-AGCM3.2S [18,19], can be utilized to produce future climatic conditions without conducting downscaling. It covers the entire globe with 20 km spatial resolution and its model output is highly expected to serve for improving flood impact assessment.
Even though various studies have been conducted using climatic models, more research on regional- and local-scale hydrology should be conducted through the combined application of high-resolution AGCMs and physically-based hydrological models under extreme climatic conditions. To this end, the application of high-resolution MRI-AGCM3.2S precipitation outputs for RCP8.5 with a physically-based river runoff model and a flood simulation model is ideal to study future extreme flood events. This study was planned to analyze future possible extreme floods by applying this ideal combination to the Lower Mekong Basin (LMB). In the recent past, several studies discussed the climate change impact on the Mekong basin [20,21,22,23,24]. However, those studies aimed to elaborate climate change by only considering rainfall or river runoff variations under different climate scenarios, and less effort has been devoted to simulating floods in the Mekong basin considering the RCP8.5 scenario, which projects extreme flood events. Moreover, previous studies have used climatic models with coarse resolutions, which require downscaling. This study was conducted to overcome such limitations in previous studies.
This study analyzed the climate change impact on the LMB in a cross-boundary region of Cambodia and Vietnam, which lies downstream of the Kratie gauging station (Figure 1), utilizing bias-corrected 20-km high-resolution MRI-AGCM3.2S precipitation outputs with two physically-based hydrological models named the block-wise TOPMODEL (BTOP) [25] and the rainfall-runoff-inundation (RRI) model [26]. We produced inundation maps for different climatic conditions, and analyzed river runoffs, rainfalls, and inundations in the LBM for time durations defined by MRI-AGCM3.2S, i.e., present (1979–2003) and future (2075–2099). Flooding in the LMB causes intolerable difficulties to people living in vulnerable areas, causing human casualties in some cases, and imposes damage to agriculture, fisheries and physical properties. Therefore, it is essential to identify flood events in the future and assess the possible hydrological impacts they may cause. Assessment results will provide insights to update existing plans and policies for agriculture, fisheries, and future developers to build a more resilient basin community.
2. Study Area
The Mekong River is the 12th largest river in the world with the largest river basin in Southeast Asia, which expands across six riparian countries of China, Myanmar, Laos, Thailand, Cambodia, and Vietnam. It is also the seventh longest river in Asia with a length of about 4620 km. The hydrological nature of the basin is governed by the monsoon climate, generating a mono-peak flood pulse during the monsoon season from July to September. The Mekong River extends from the Tibetan Plateau in China to the Mekong Delta in Vietnam. The river basin is located between the latitudes of 8° N to 34° N and the longitudes of 94° E to 110° E. The alpine climate prevails in the northern part of the basin, and a large tropical floodplain lies in the downstream part of the basin. The basin area is approximately 795,000 km2 and its annual average discharge to the South China Sea is 475 km3. Geographically, the basin can be divided into upper and lower parts. The upper part has a steep slope from the headwaters, while the river bed is more or less flat along the slope from Kratie to the ocean through the Mekong Delta shared by Cambodia and Vietnam. The lower part of the basin belongs mostly to a tropical monsoon climate zone, where the year is divided into dry and wet seasons. The wet season lasts from approximately early May to October, and the dry season from November to April. The wet season climate is dominated by the summer monsoon, arriving partly from the southwest and partly from the southeast. The uppermost part of the basin is located on the Tibetan plateau, where the precipitation pattern is similar to that in the lower part of the basin with most of the precipitation occurring during the summer. Due to lower temperatures at higher elevations, the precipitation during winter falls mainly as snow. Due to the monsoonal climate and the steepness of the river bed in the upper basin, the hydrograph of the Mekong River is single-peaked with large differences between high and low flow values. Average annual precipitation from 1964–2005 in the basin ranged from 850 mm to 2500 mm [27]. The flood season in the Mekong River Basin lasts from June to November and accounts for 80–90% of the total annual flow [28]. The annual flood season is especially important for the LMB because it shapes the environment and inhabitants in the basin. The LMB, the focus area of the present study, is shown in Figure 1a,b, which also illustrates respective model domains for the river runoff model of BTOP and the inundation simulation model of RRI.
3. Methodology and Models
3.1. Methodology
The most widely used approach in simulating the hydrological impacts of climate change is to combine GCM outputs with hydrological models. The proposed methodology in this study employs models with different scales to simulate climate change impact on the LBM. The global-scale AGCM, the regional-scale BTOP model, and the local-scale RRI model were employed to analyze plausible future extreme flood situations. Cascade linking of global-, regional-, and local-scale models has been proven productive in carrying out inundation simulations and hydrological assessments for the LMB, which is systematically explained in Figure 2.
The MRI-AGCM3.2S precipitation outputs based on the RCP8.5 scenario were utilized for the future climate simulation in this study while the present climatic simulation was conducted using MRI-AGCM3.2S under the AMIP-type scenario [29]. The horizontal grid size is about 20 km in MRI-AGCM3.2S [19,30]. While the resolution is satisfactory for regional-scale hydrological modelling, the MRI-AGCM3.2S precipitation still has bias. However, MRI-AGCM3.2S precipitation can be bias-corrected without modification of its horizontal resolution, which is the main advantage of the MRI-AGCM3.2S dataset. According to Chen [31], in the process of studying climate change impact, the main uncertainties are from GCMs and downscaling. GCMs provide information at a resolution that is too coarse to give results that can be used directly in hydrological modelling [32]. In this study, however, that was not an issue due to the utilization of 20-km high-resolution AGCM outputs. BTOP, a physically-based hydrological model, was used to simulate river runoff for the present and future periods based on bias-corrected 20-km MRI-AGCM3.2S precipitations for the entire Mekong Basin. BTOP-simulated daily river discharges for present and future at Kratie station were used as the boundary condition for the RRI model, which simulated LMB floods with relevant rainfall. Considering the computational time, available resources, and the physically-based nature of the BTOP model, it was selected to perform the simulation for the entire Mekong Basin at a 20-km regional scale. The RRI model, which is more sophisticated in simulating river runoff and inundations under the diffusive wave model framework, however, needs a longer computational time and, thus, was employed only for the LMB area with a 2-km gridded model at a local scale. Figure 1a,b illustrates the respective model domains for the BTOP and RRI models. The RRI model simulated the river flow system downstream of the Kratie station. The flow system consisted of flow reversal in the Tonle Sap River, bank overflows, flood occurrences due to river runoff and rainfall, and varying inflows from Kratie station (as the boundary condition).
The study utilized observed and calculated datasets for precipitation and river runoffs. The observed precipitation data from the time period of 1951 to 2007 was obtained from the Asian Precipitation—Highly-Resolved Observational Data Integration towards Evaluation of Water Resources—APHRODITE [33], which is a gridded daily precipitation dataset based on rain gauges in Asia. The data are in the resolution of 20 km. APHRODITE was developed by the Japan Meteorological Agency and the Meteorological Research Institute of Japan, which succeeded the APHRODITE project [33,34,35], an observational dataset of daily precipitation and the prototype of gridded daily rain gauge datasets on the global land surface. The hydrological models used in this study were calibrated to the observed daily discharge data received from the Mekong River Commission (MRC).
3.2. MRI-AGCM3.2S
MRI-AGCM3.2S has the finest AGCM resolution so far available and its outputs have been used in several studies to project future climatic conditions [36,37,38]. The model is based on a hydrostatic primitive equation system using a spectral transform method of spherical harmonics [19]. MRI-AGCM3.2S data were made available for the present and future, each of which was a 25-year period of 1979–2003 and 2075–2099, respectively. An Atmospheric Model Inter-comparison Project (AMIP)-type [29] simulation using the observed boundary conditions from 1979 to 2003 was treated as the present climate experiment outputs, labelled as “SPA_m01” in this study for the present. The sea surface temperature (SST) is used in the MRI-AGCM3.2S as the temperature boundary condition. For the future climate experiments under the RCP8.5 greenhouse gas emission scenario, four different SST distributions from 28 coupled models in Couple Model Inter-comparison Project Phase 5 (CMIP5) [39] were considered. As explained in Mizuta [18], it is expected that an AGCM generates different precipitation distributions as a response to different SST distribution. Considering different SSTs, the SST uncertainty under the RCP8.5 emission scenario can be assessed.
The RCP8.5 future climate projections from 2075 to 2099 with the SST distributions were grouped as Cluster 1, 2, 3, and Total (28-model average), which were respectively labelled as “SFA_rcp85_c1”, “SFA_rcp85_c2”, “SFA_rcp85_c3”, and “SFA_rcp85” [18] in this study. These clusters represent different sets of SSTs. Cluster 1 (eight-model average) is characterized by a nearly uniform warming in the northern and southern hemispheres; Cluster 2 (14-model average) shows an El Nino-like pattern with a larger warming belt in the central equatorial Pacific; Cluster 3 (six-model average) is dominated by a larger warming in the northern hemisphere than in the southern hemisphere; and Total is the intermediate between the clusters [18]. These characteristics of the four clusters are explained by Mizuta [18].
MRI-AGCM3.2S precipitation outputs were corrected for their bias using a statistical method developed by Inomata [40]. The statistical method appropriately corrects biases in both monthly and extreme daily precipitations. The concept of the bias correction method is to adjust the probability distribution of GCM daily precipitation to that of its observed counterpart. The method was tested for the Yoshino River basin of Japan, and the results showed appropriate corrections of GCM biases in both monthly and extreme daily precipitations. Datasets of daily precipitation bias-corrected using this statistical method have been widely used for hydrological model simulations and risk assessments to assess the climate impacts of floods and droughts in Asia [41,42,43].
3.3. BTOP Mode
The BTOP model is a distributed hydrological model, which was developed based on the TOPMODEL [25,44,45]. This model uses a topographic index with a block-wise concept and simulates watershed-scale rainfall runoff processes, including snowmelt, overland flow, soil moisture in the root zone and unsaturated zones, subsurface flow, river flow routing, and dam operation. For river flow routing, a modified Muskingum-Cunge (MC) routing method is integrated to conserve water at each river segment [46]. The detailed description of the BTOP model is provided by Takeuchi [25,45]. Until now, the BTOP model has been employed in various hydrological applications, such as large-basin long-term simulations [47], poorly or ungauged basins [25,45], flood hazard assessment [48], drought analysis with standardized indices [49], dam operation for flood and drought reduction [49,50,51], now-casting, basin-scale scenario analyses of future projection on hydro-meteorological conditions [52], and nutrient loading [53]. The BTOP model, employed in the present study, covered the entire Mekong Basin under 20 km resolution, and it was calibrated and validated for the river runoff at the Pakse gauging station (Figure 1).
3.4. RRI Model
The rainfall-runoff-inundation (RRI) model is a two-dimensional model which is capable of simulating rainfall-runoff and flood inundation simultaneously. The model deals with slopes and river channels separately [26,54]. At a grid cell, in which a river channel is located, the model assumes that both the slope and river are positioned within the same grid cell. The channel is discretized as a single line along its center line of the overlying slope grid cell. Figure 3 depicts a schematic diagram of the RRI model’s concept of the river channel and the slope. The flow of the slope grid cells is calculated with a two-dimensional diffusive wave model, while the channel flow is calculated with a one-dimensional diffusive wave model. For better representation of rainfall-runoff-inundation processes, the RRI model simulates lateral subsurface flow, vertical infiltration flow, and surface flow. The lateral subsurface flow, which is typically more important in mountainous regions, is treated in terms of the discharge-hydraulic gradient relationship, which considers both saturated subsurface and surface flows. On the other hand, vertical infiltration flow is estimated by using the Green-Ampt model [55,56]. The flow interaction between the river channel and the slope is estimated based on different overflowing formulae, depending on water-level and levee-height conditions. A storage cell-based inundation model [57] was used to calculate lateral flows on slope grid cells. The model equations were derived based on the following mass balance equation, momentum equations, and gradually-varied unsteady flow. The RRI model setup and its equations are explained in Sayama [26,54]. The various applications of the RRI model in hydrological studies can be found in several studies [26,41,54,58,59].
The model equations are derived based on the following mass balance Equation (1) and momentum Equations (2) and (3) for gradually varied unsteady flow:
The second terms of the right side of Equations (2) and (3) are calculated with Manning’s Equations (4) and (5).
- h = height of the water from the local surface
- = unit width discharges in x and y directions
- = flow velocity in x and y directions
- = rainfall intensity
- = infiltration rate
- = height of the water from the datum
- = density of water
- = gravitational acceleration
- = shear stress in x and y directions
- n = Manning’s toughness parameter
4. BTOP and RRI Model Setup for the Study Area
4.1. BTOP Model Application
Magome [42] calibrated and validated the BTOP model for the entire Mekong basin considering the observed and simulated river runoff at the Pakse gauging station (Figure 1). The river network dataset, used in the BTOP modelling for the whole Mekong basin, was up-scaled from 3-arcsec (~90 m) HydroSHEDS [60] to 10 arcmin (~20 km), while preserving river network features, the up-stream catchment area, and river length and slope calculated from the original HydroSHEDS, which employed the river-network upscaling algorithm developed by Masutani and Magome [46]. Land cover data from the USGS International Geosphere-Biosphere Program (IGBP) and soil type data from the Food and Agriculture Organization soil map [61] were used for the root zone depth and soil properties. Precipitation data were used from APHRODITE [34] for calibration and validation. The CRU TS3.1 climate forcing data [62], a fourteen-day global Normalized Difference Vegetation Index (NDVI) dataset from the Global Inventory Modelling and Mapping Studies (GIMMS) [63], were used to simulate long-term potential evapotranspiration using the Shuttleworth-Wallace model. Model parameters, dischargeability D, decay factor m, drying function parameter α, Manning’s coefficient n, and the groundwater parameter b, were tuned during the calibration for reasonable performance using observed discharge time series of Pakse station, provided by the Mekong River Commission. The BTOP model was calibrated for the period of 11 years from 1980 to 1990 and validated for a 10-year period starting from 1991. The Nash-Sutcliffe Coefficient (NSC) was estimated to be 86.9% and 90.3% for calibration and validation, respectively [43].
4.2. RRI Model Application
The resolution corresponded approximately to 2.0 km × 2.0 km in the RRI model developed for the LMB. The model domain for the LMB was about 187,000 km2. As the model was being set up, the digital elevation model (DEM), flow direction, and flow accumulation were delineated from HydroSHED’s 30 s resolution [55] and up-scaled to a 60 s (~2 km) resolution [64]. Other model inputs were precipitation, potential evapotranspiration, and river channel dimensions. Four land-use types, i.e., forests, agricultural lands, wetlands, and water bodies, were considered in the LMB inundation simulation as shown in Figure 1c.
The model parameters adjusted during the calibration process include: hydraulic conductivity k, Manning’s roughness for the river bed nr, and Manning’s roughness for the slope ns. The Manning’s roughness coefficients used in this study were based on the different land use types, as illustrated in Chow [65]. RRI model parameters were manually tuned until the simulation discharges reasonably matched the observed values. The RRI model was calibrated for river runoff and inundation distribution. Figure 4 depicts simulated and observed daily discharges for the selected stations named Kampong Cham, Prak Kdam, Chroy Changver, Neak Luoung, and Koh Khol (Figure 1). The model performance for the calibration and validation processes was estimated using the relative root mean squire error (RRMSE), Nash-Sutcliffe Coefficient (NSC), and coefficient of determination (R2), as shown in Table 1. The estimated model performance indicators for the model calibration and validation showed acceptable values relative to the optimal value of each index. The RRI model was able to achieve the flood peak in all the simulated flood events reasonably. Prek Kdam is at a special location, where the river flows towards the Tonle Sap Lake during the flood season, and in the reverse direction during the dry season. Tonle Sap is the largest freshwater lake in Southeast Asia which covers an area of 8800 km2. At Phnom Phen, Cambodia, it connects to the mainstream of the Mekong River. According to the Cochrane [66], the volume of water flowing into Tonle Sap from the Mekong mainstream during the rainy season (June to October) is nearly six times greater than the volume of water during the dry season (November to May). The Prek Kdam’s discharge direction varies according to the season and it was correctly simulated by the RRI model. The discharge towards the Tonle Sap during the rainy season is indicated by negative values, while the discharge in the mainstream during the dry season is considered as positive, as shown in Figure 4. The RRI model was able to simulate the water flow from the Tonle Sap Lake correctly according to the obtained results for the Prek Kdan station. Since the river flow division of the Bassak River was not exactly known, combined discharges of Koh Khel and Neak Luong were considered in the calibration and validation. Kampong Cham, Chroy Changver, Neak Luong, and Koh Khol stations show very good error estimations, while Prek Kdam shows relatively poor error estimations due to the dynamic nature of its location. The justification of the inundation distribution simulated by RRI was carried out by comparing the inundation maps published by MRC for 1998 (dry year) and 2000 (flood year). Comparison of the inundations in these two years showed reasonable matches with the MRC published figures.
5. Discussion
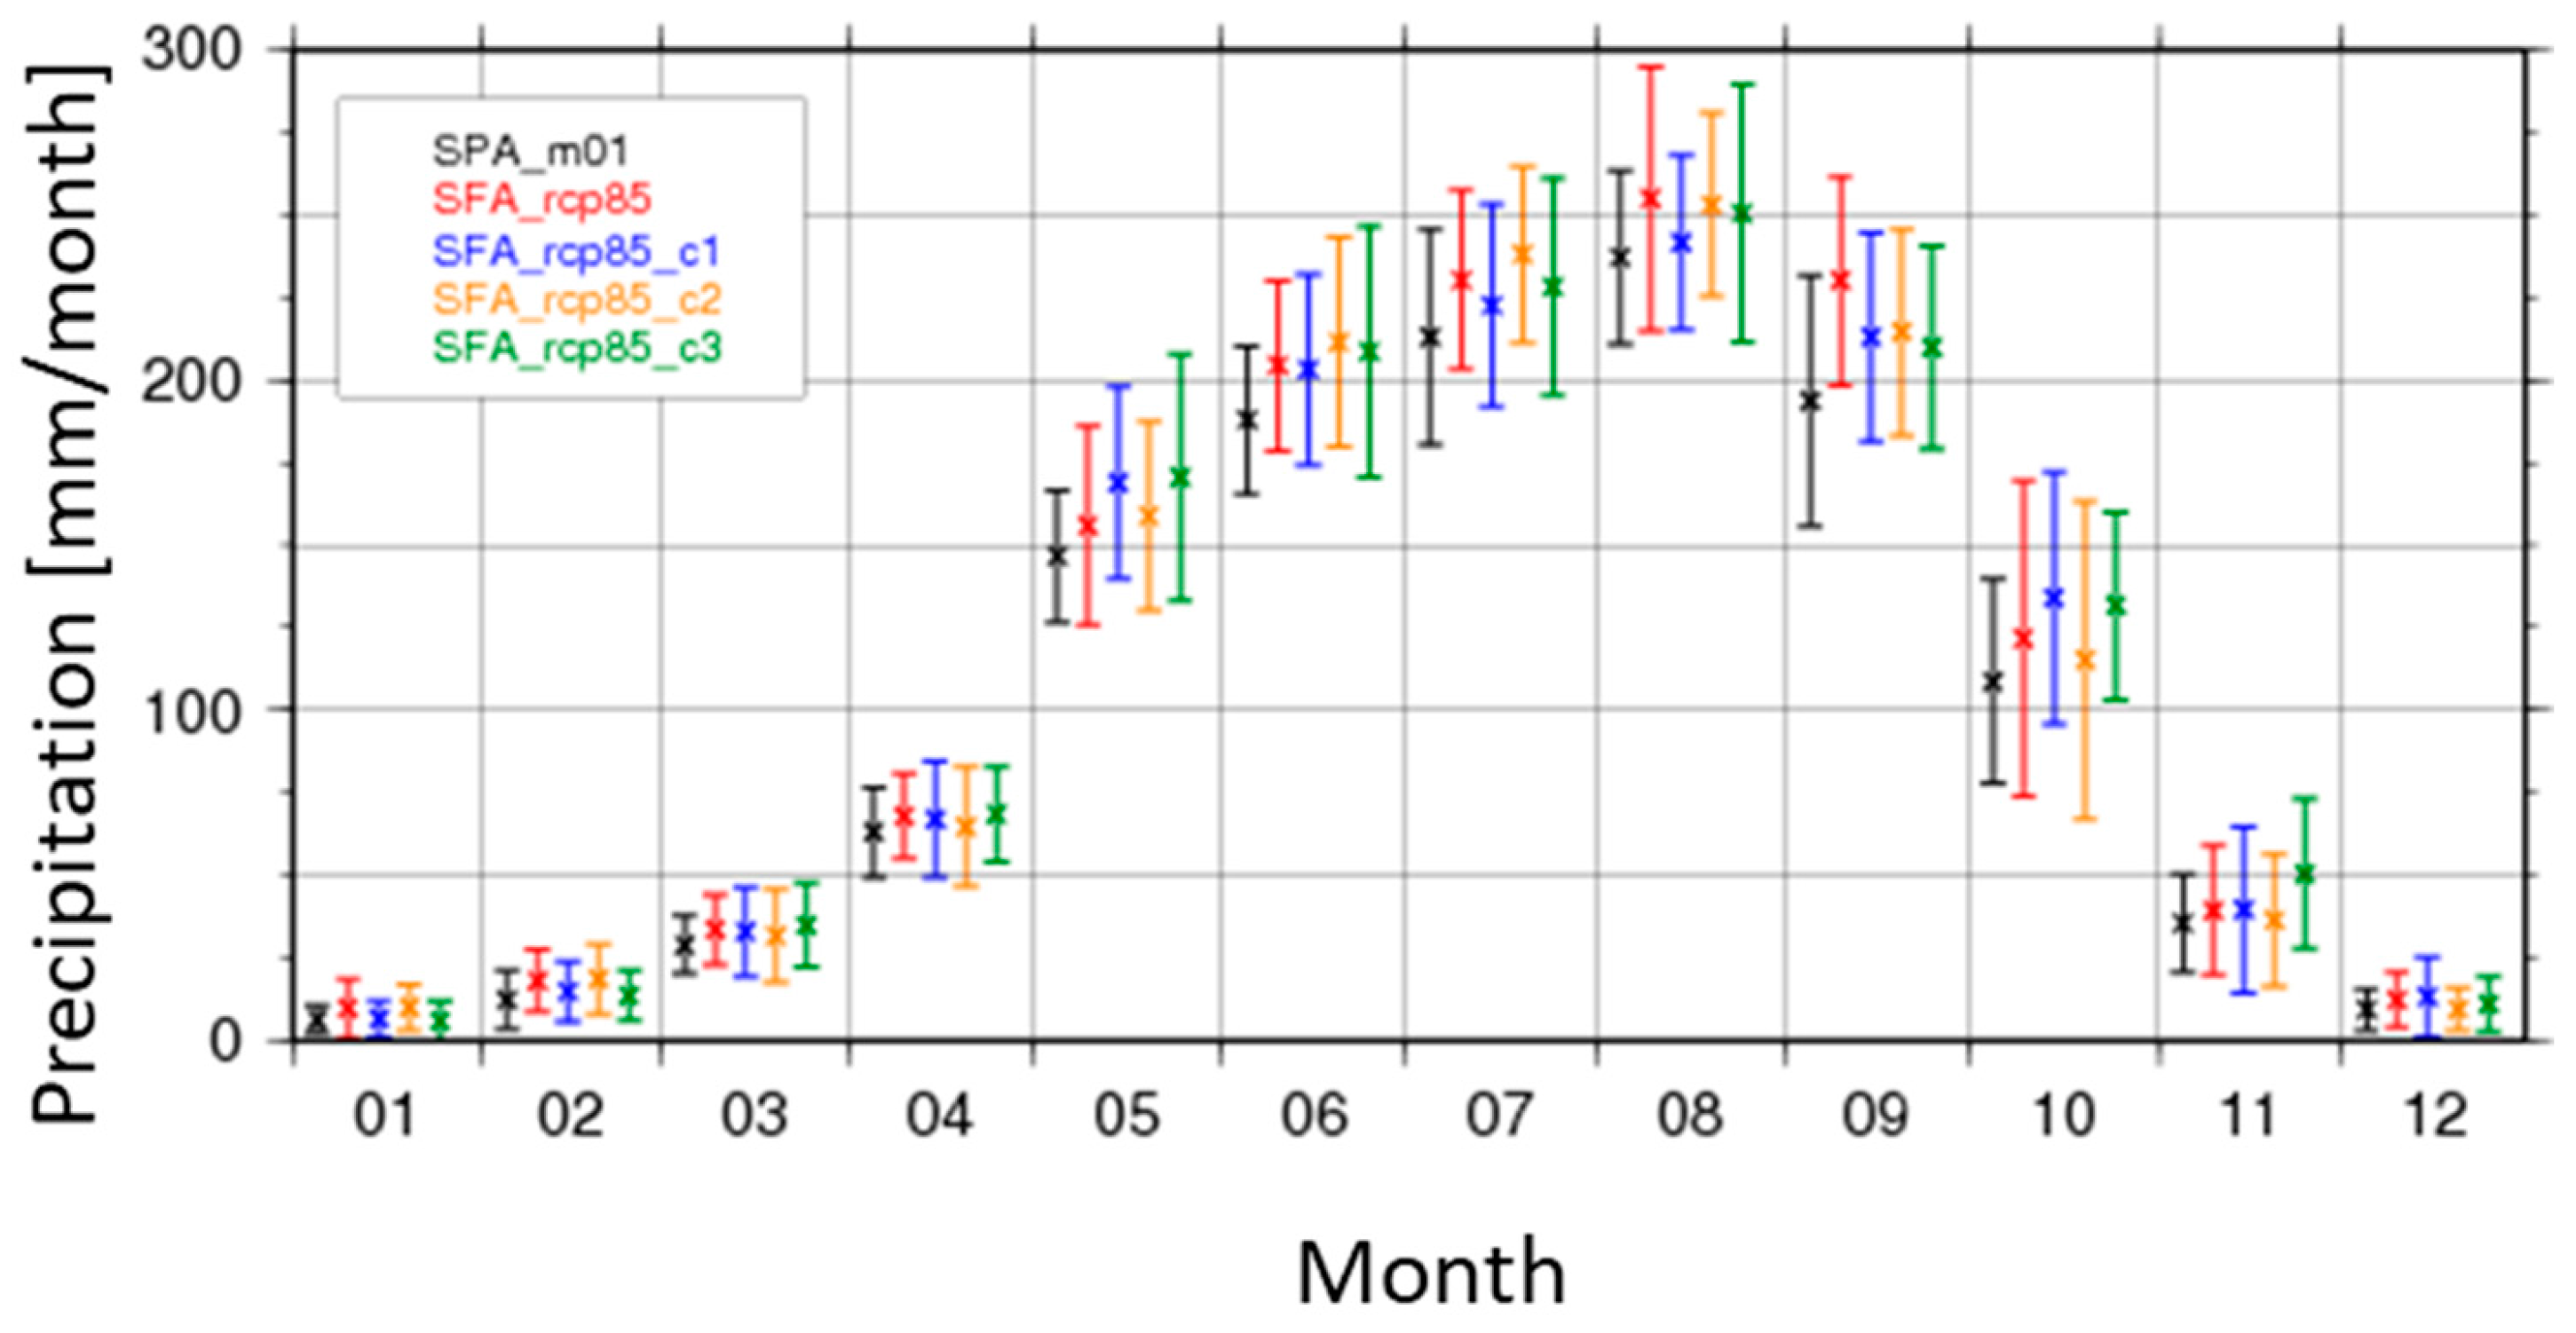
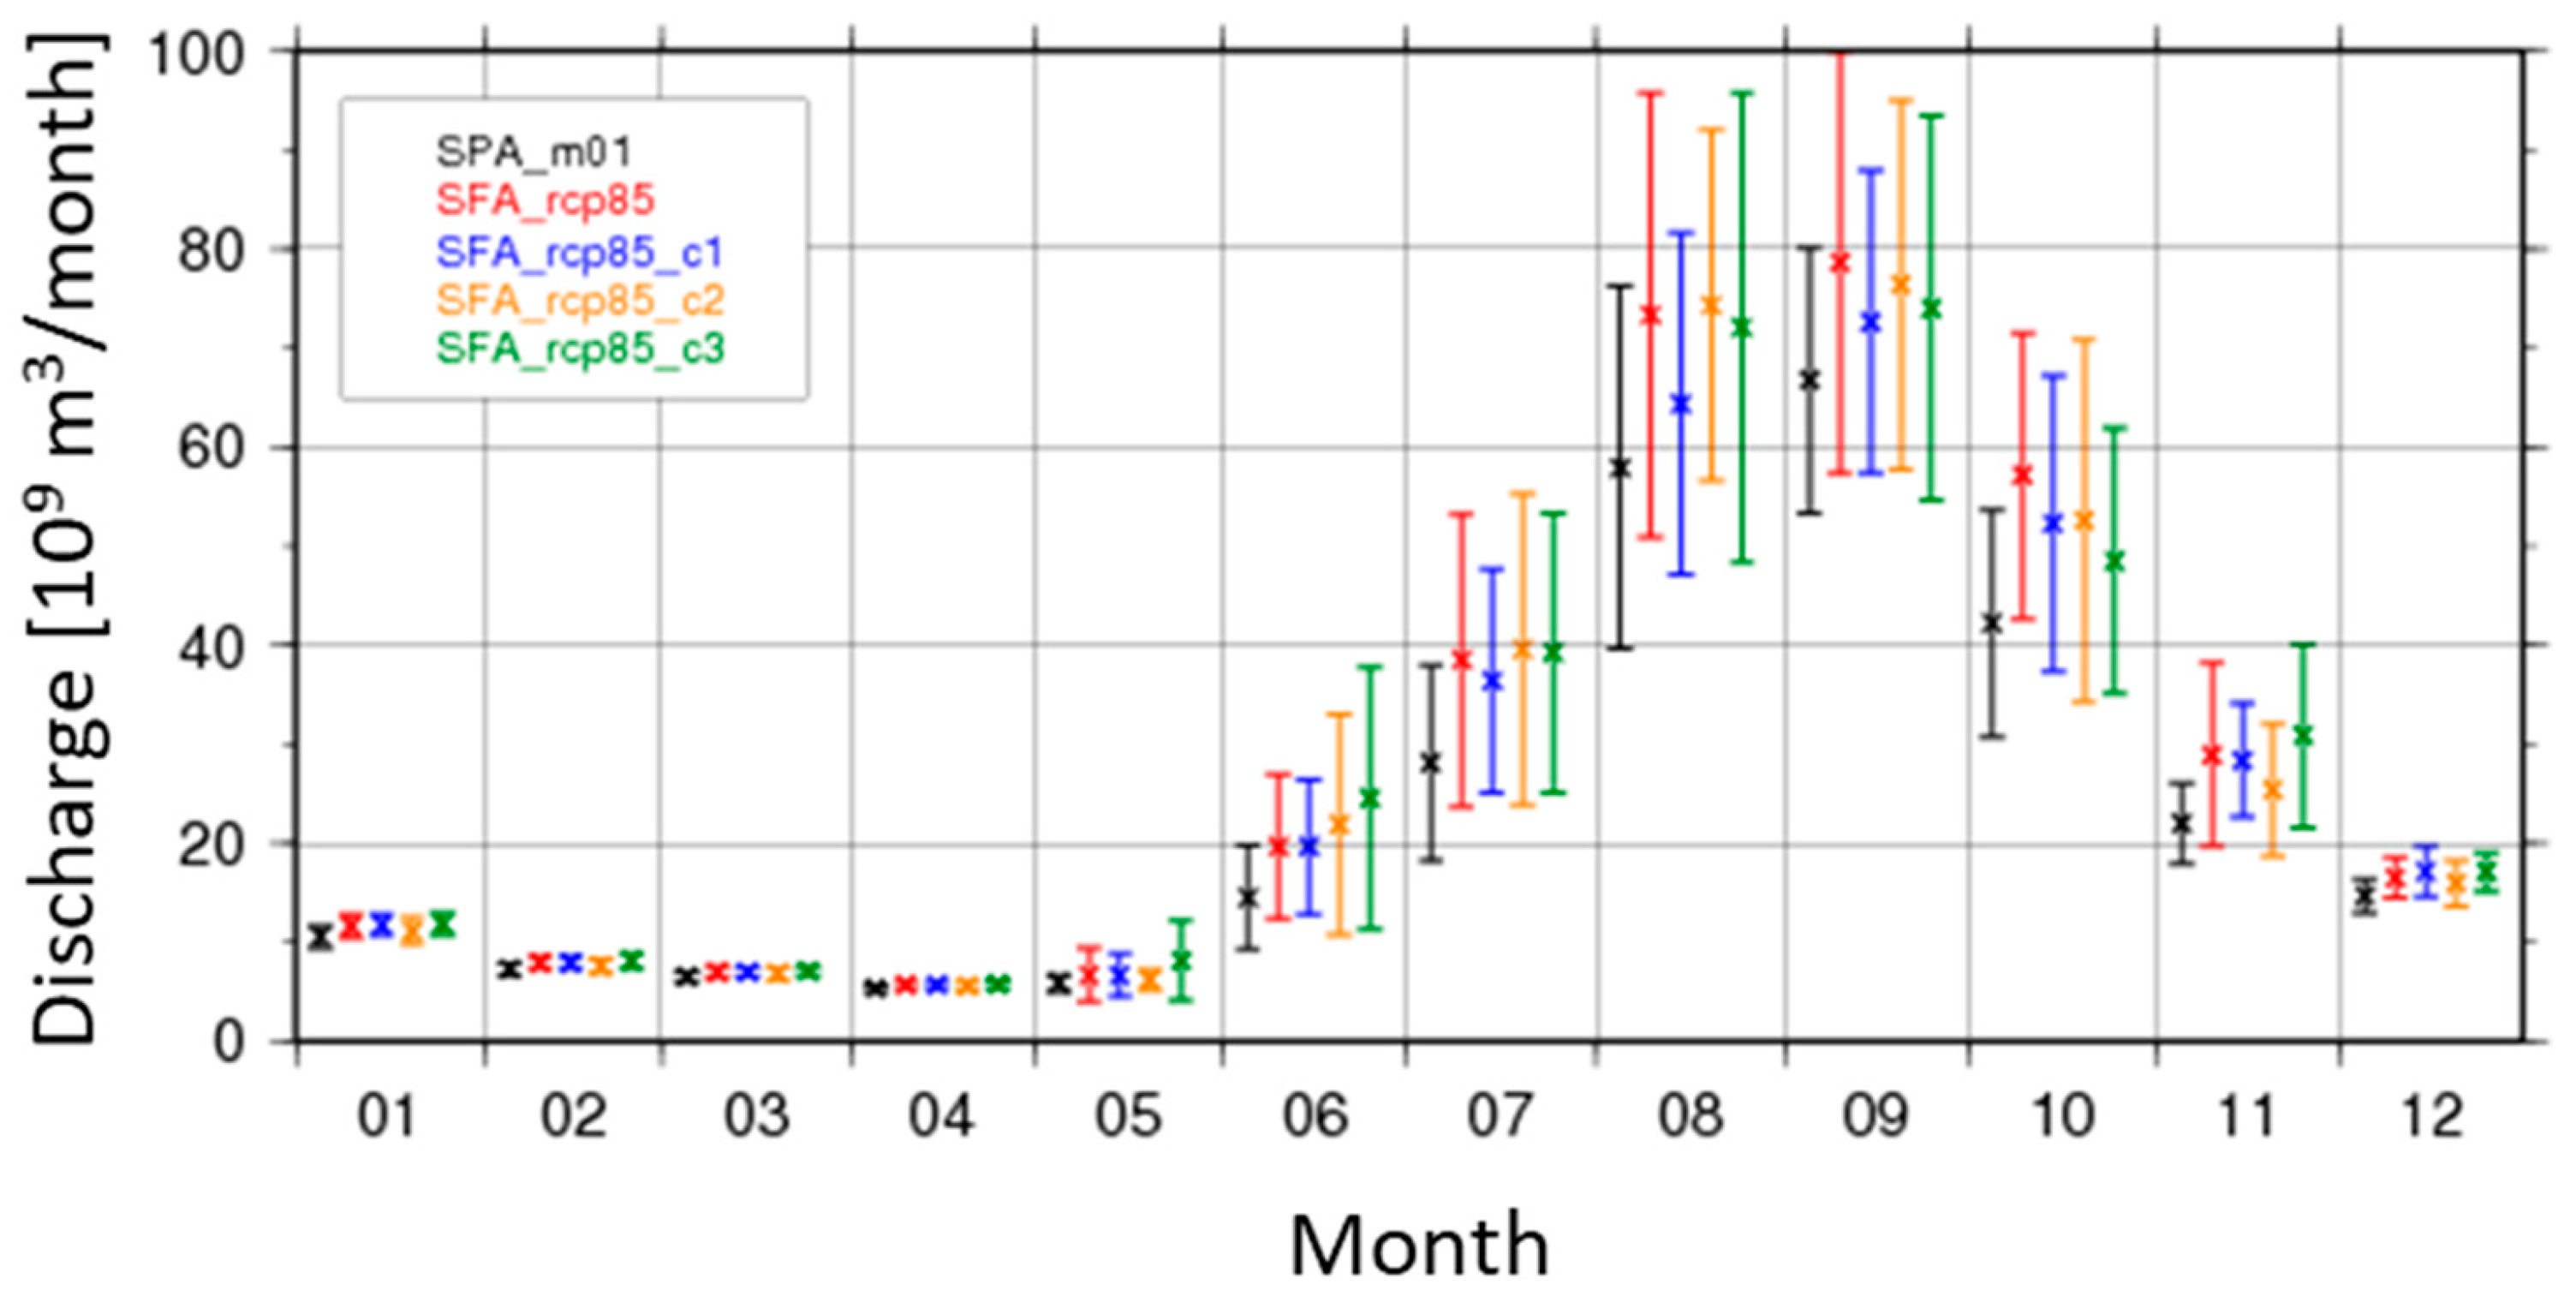
Variability, trends, and shifts in precipitation are crucial in assessing climate change impacts on water availability, floods, droughts, and agricultural productivity. Several basic statistical and physical properties of rainfall should be considered in characterizing the variability of rainfall in the context of climate change [67]. As far as the inter-annual variability of the Mekong River Basin’s precipitation is concerned, 25-year average and ±σ (standard deviation) were selected to illustrate the variability, as shown in Figure 5. The variability increases as the precipitation increases. However, both in the present and future cases, the maximum monthly averaged precipitation occurs in August and the variability is higher in the future than in the present. The ratios of the maximum average values of the precipitation in the future to that value in the present were calculated for SFA_rcp85, c1, c2, and c3 and achieved as 1.07, 1.02, 1.07, and 1.06 for the respective scenarios. A similar pattern occurs in the 25-year averaged monthly discharge at Kratie, as shown in Figure 6. The maximum monthly average discharge for each scenario takes place in September. When the discharge increases, the variability also rises. Among all the cases, SFA_rcp85 shows the highest peak average values. The increment ratios of the monthly averaged discharges at the Kratie station for the future relative to those for the present were 1.18, 1.09, 1.14, and 1.14. SFA_rcp85 and c2 scenarios show the highest ratios in both precipitation and monthly averaged discharge at Kratie.
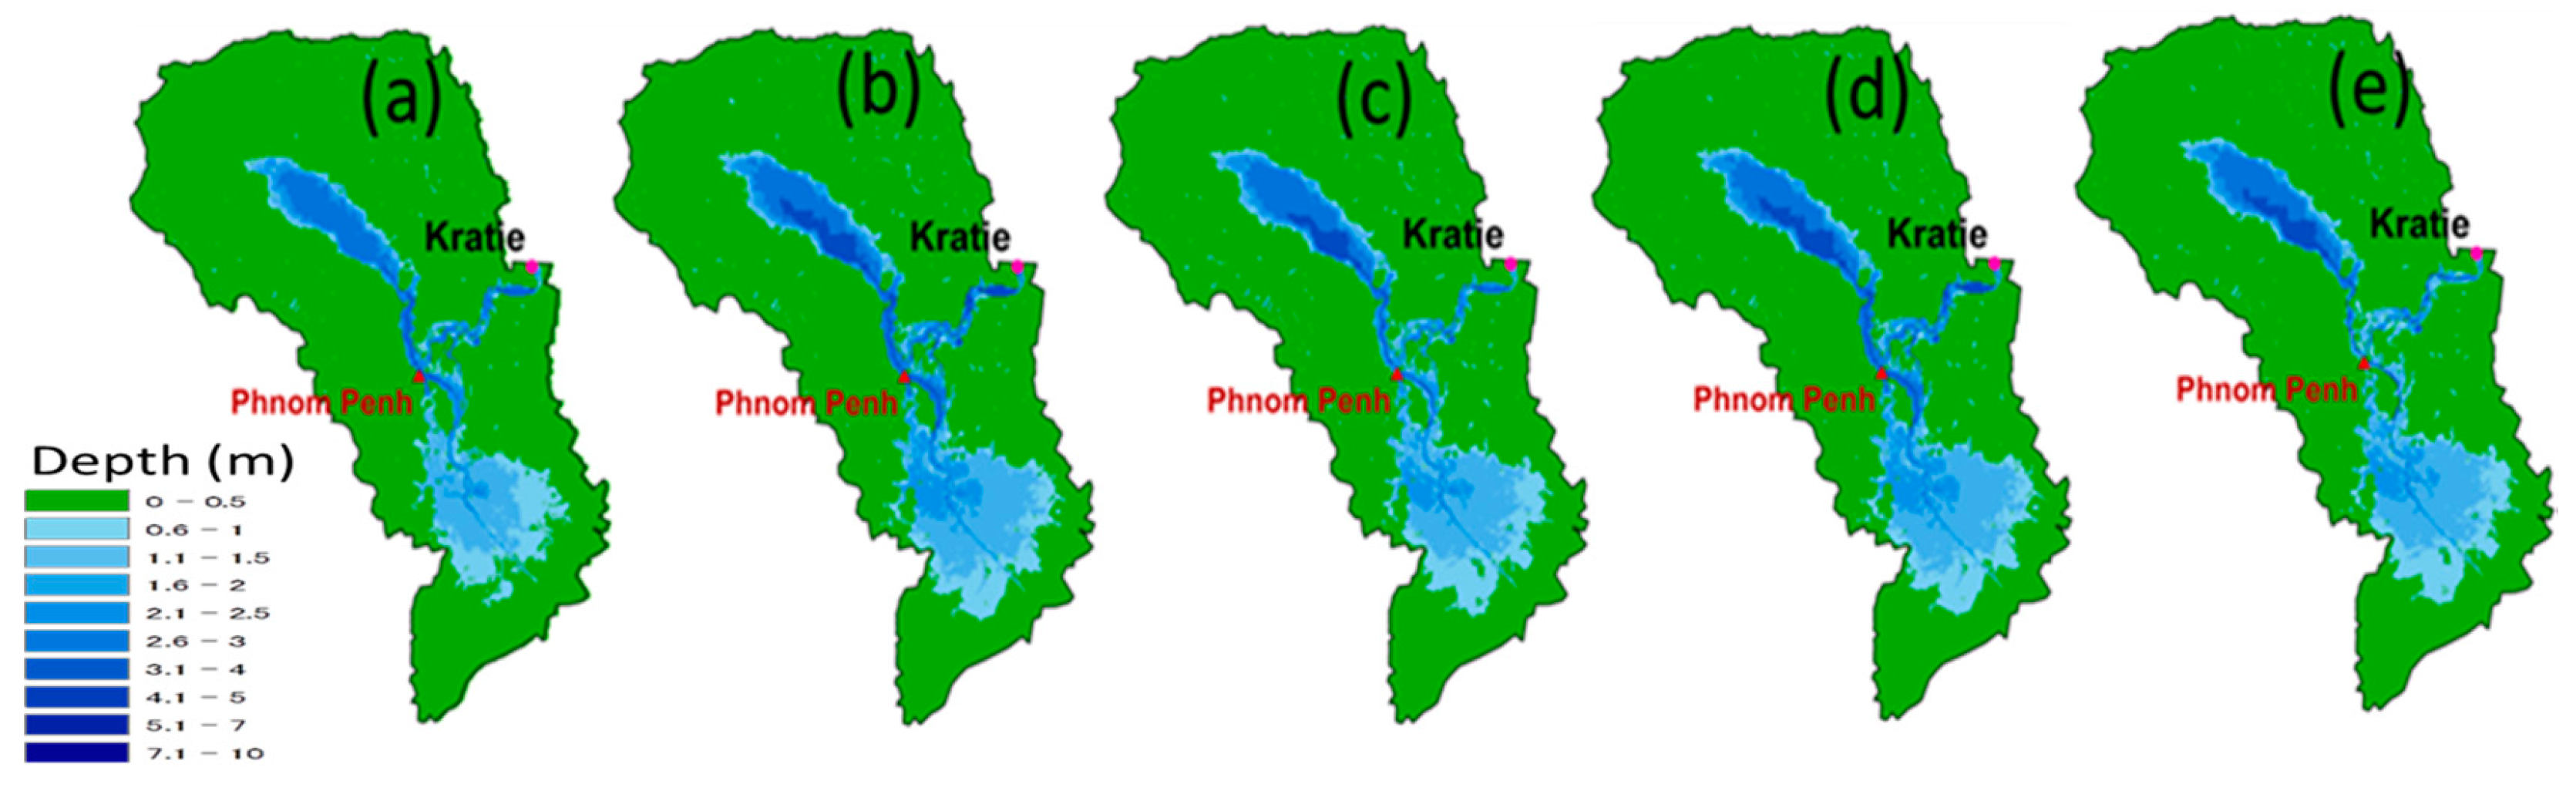
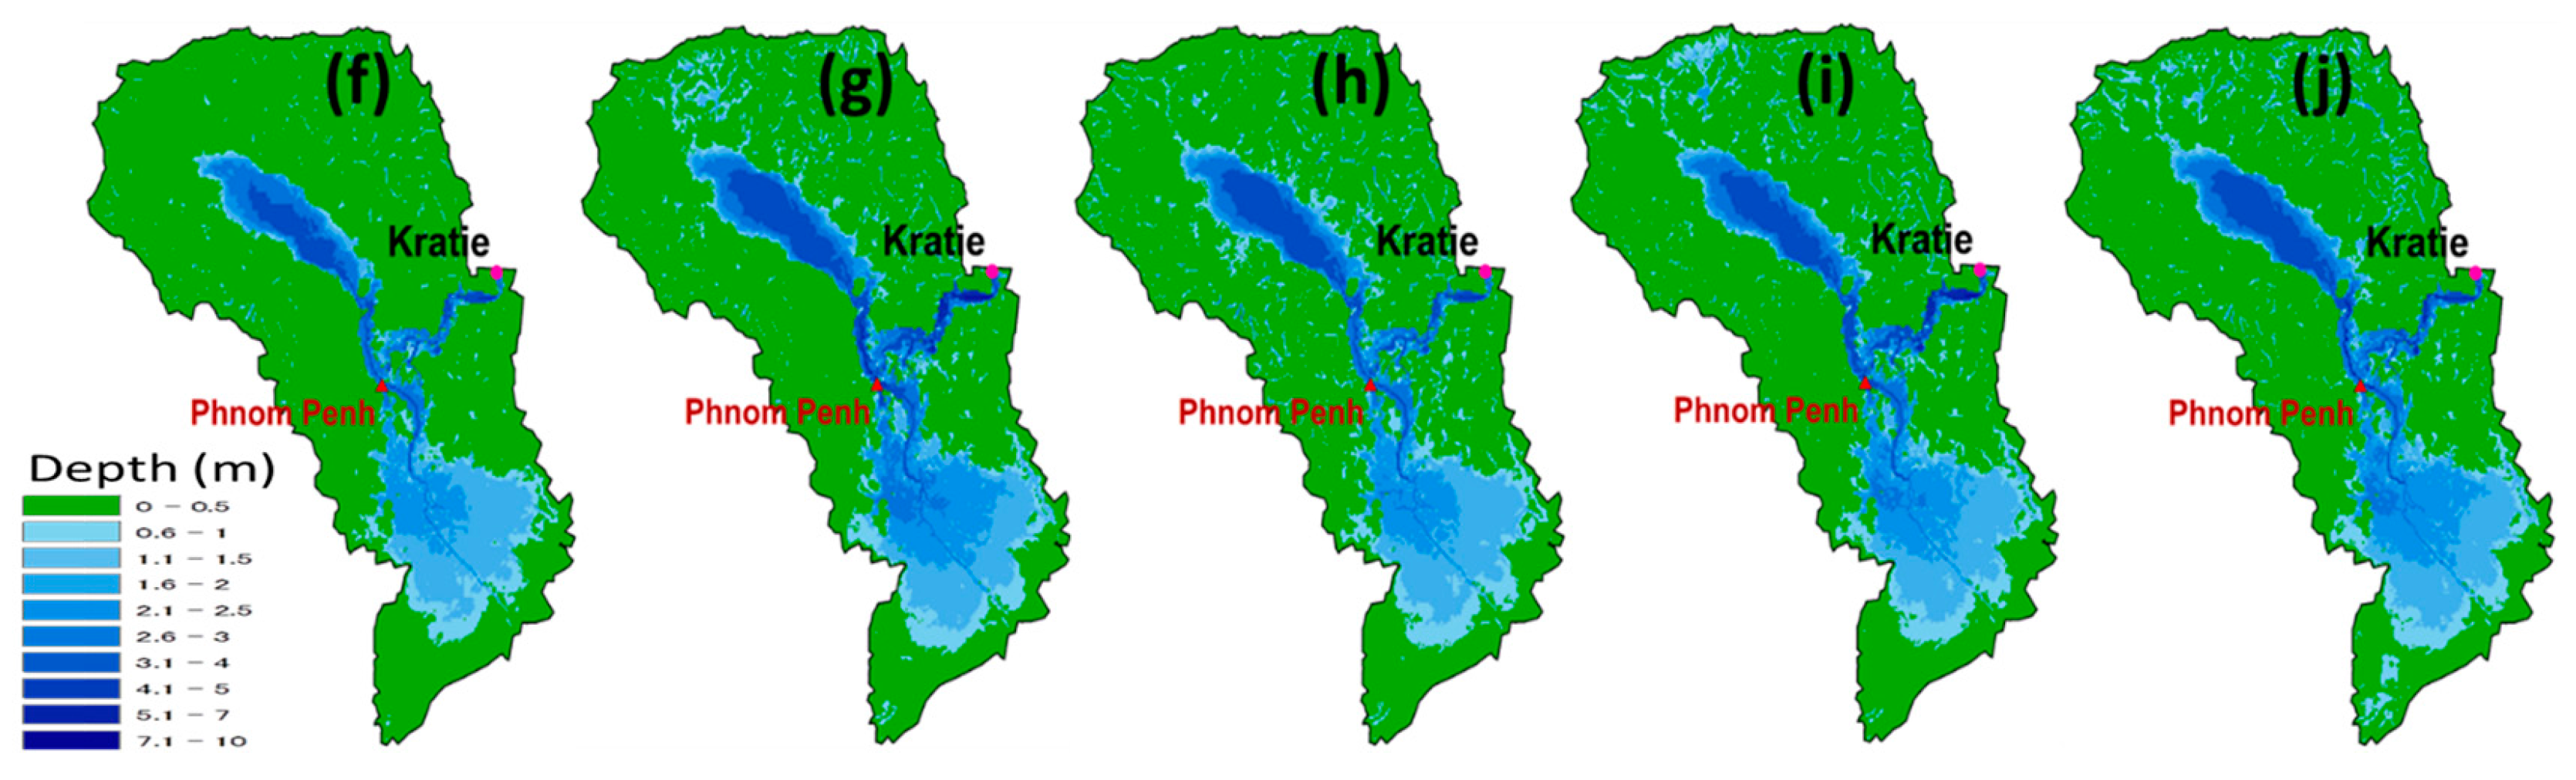
According to the RRI simulation results for the LMB, a significant increment in inundation distribution can be observed in the RCP8.5 future inundation distribution outputs compared with the AMIP-type present experiment. Each MRI-AGCM3.2S dataset comprises 25 years’ worth of data. Figure 7a shows a 25-year averaged inundation distribution for the SPA, present case, while the other four figures are on the order of (b–e) illustrate the 25-year averaged inundation distributions for the scenarios of SFA_rcp85, c1, c2, and c3. The increment ratios in inundation extent in future climatic conditions were calculated by dividing the future inundation areas (SFA) by the present (SPA) inundation area. Compared to the present AMIP-type experiment, the future inundation areas are in the ratios of 1.34, 1.26, 1.35, and 1.24, respectively, for RCP8.5 experiments with four SST distributions (Table 2). The increment ratios for the inundation distributions provide an alarm for future extreme flood events which may occur due to climate change. Figure 8 illustrates the maximum inundation for each 25-year dataset. The SFA_rcp85 case shows the highest maximum inundation distribution among the simulated datasets. The increase in inundation vulnerability of Phnom Penh, the capital of Cambodia, is significant, according to the obtained inundation results for Future. The Mekong Delta (MD), which is of ~55,000 km2 area and located downstream of Phnom Penh, will be at high flood risk according to the obtained results. Of the 60 million people living in the LMB, about 40% live within a 15 km range along the Mekong River with most within a 5 km range from the mainstream. The communities located within 5 km from the mainstream have high exposure to floods, and their flood risk will be higher in the future, according to the obtained results. Although minor and moderate floods are advantageous to agriculture and fisheries in the MD area, future extreme rainfalls and floods may cause severe damage to infrastructure, agriculture, transportation, and community properties in the MD area. The obtained flood increment ratios indicate possible future flood risk in the MD and provide insights for policy-makers to take actions to protect communities in the MD through the introduction of flood mitigation and risk reduction actions.
According to Figure 9, for the future experiments, the increase in cumulative rainfall is nearly the same; however, the river runoff and inundation volumes show considerable increments. The main reason for this situation is the intensity, distribution of rainfall across the basin, and the variability of rainfall, as explained in Figure 5. Even the increment ratios of cumulative rainfall spread in a narrow range due to their distributions and intensities, and the river runoff and inundation generations are different. This phenomenon should be further analyzed as the next step of the study.
The specific discharge volume for Kratie’s river runoff was calculated by dividing the 25-year averaged discharge volume by the upstream basin area of the Mekong. The Kratie’s river runoff volume has a significant impact on the LMB flood generation. Therefore, understanding its increment in the future is a good indicator to identify extreme climatic conditions anticipated in the future. Figure 10 illustrates the cumulative specific runoff volume at Kratie for the present and future climatic experiments. The most important indicator of the LMB flood, and the inundation volume averaged for 25 years for the present and future experiments are also summarized in Figure 10. The total volume, which can cause an inundation of over 0.5 m deep was considered in calculating the inundation volume. This was converted to a specific volume by dividing the LMB basin area. The two figures (Figure 9 and Figure 10) show significant increments in rainfalls, river runoffs and inundation volumes relative to the Present-SPA_m01 climatic condition. Among the four future climatic experiments, SFA_rcp85 shows the highest increment compared to SPA_m01. The SFA_rcp85 cumulative basin rainfall increased by 135 mm compared to SPA_m01. The increment in discharge at Kratie under SFA_rcp85 was 115 mm, and the increment in inundation volume under SFA_rcp85 was 68 mm relative to the present. Such increased water volumes are a very clear indicator to identify future extreme flood conditions in the LMB region.
Table 2 summarizes the comparison of present and future rainfall, Kratie’s river runoff, and LMB inundation volume increments as ratios. The highest ratio in each category comes from the ratio of the SFA_rcp85 scenario. The inundation increment ratio for SFA_rcp85 compared to SPA_m01 is 1.6, which shows the vulnerability of the LMB area to inundation in future climate change. The ratio of SFA_rcp85_c2 for future inundation is also critical compared to the present situation.
One of the limitations of the study is that the flood assessments were only based on precipitation outputs of MRI-AGCM3.2S for the RCP8.5 scenario, rather than several GCM or AGCM outputs. Furthermore, consideration of other RCP scenarios would be beneficial for policy-makers and river engineers to foresee future flood threats of different intensities. Different flood projections may result if several GCM outputs are considered. In the case of flood risk assessment, fine resolution inundation model would be beneficial to identify the floods more precisely. Unfortunately, this study had to limit the resolution of the inundation model to 2 km because running large-scale and long-term inundation simulations are still computationally expensive. In future research, it would be important to consider several AGCMs’ outputs and other RCP scenarios, as well to view the future anticipated floods in the LMB in a broad way.
6. Conclusions
The use of climate and hydrological models to better understand extreme floods is an important method and widely used in the context of climate change impact studies. We adopted a methodology to utilize global-, regional-, and local-scale models to produce future floods under extreme climatic conditions. The impact of climate change on hydrological features in the LMB in the cross-boundary region of Cambodia and Vietnam was analyzed by feeding MRI-AGCM3.2S precipitations projected for the present and the future into two distributed hydrological models. The obtained results are alarming and provide useful information for policy-makers and river engineers to understand future extreme floods. Moreover, the results enable comparisons between present and future extreme floods considering different hydrological aspects of floods, such as inundation area, inundation volume, cumulative rainfall, and specific discharge. The results indicate a significant increase in flood severity in the LMB, predicting extreme floods possibly disastrous to the paddy cultivation in the MD area, which accounts for more than 50% of the rice production in Vietnam [68]. Although studies have been conducted in the recent past on the climate change impact on the Mekong Basin, they have limited the discussion to river runoffs. In the present study, we focused not only on river runoff, but also inundation extent. The hydrological analysis was conducted based on the 25-year bias-corrected precipitation datasets of the present and future. In the case of the future, we used four datasets of the RCP8.5 scenario considering different SST boundary conditions. The 2 km-resolution RRI model developed for the LMB area is a rather fine-resolution model applied to the Mekong Basin compared with those used in past studies. Due to the fine resolution of the inundation model, the obtained flood depths and distributions should be beneficial to understand the possible flood damage in the future. According to the obtained results, the increment ratios of averaged flood area in the future compared to that in the present are 1.34, 1.26, 1.35, and 1.24 for the SFA_rcp85 and the other three cases, respectively. The specific inundation volumes for different cases were also estimated and presented in this study. Those estimates are useful indicators to understand future extreme flood events in the LMB basin. Further research should be conducted to analyze flood risk in the LMB considering other AGCM outputs and other emission scenarios. The present study can be considered as the baseline for future studies on the LMB for extreme floods and their impacts.
Acknowledgments
This work was conducted under the framework of the “Precise Impact Assessments on Climate Change” of the Program for Risk Information on Climate Change (SOUSEI Program) supported by the Ministry of Education, Culture, Sports, Science, and Technology-Japan (MEXT). The authors sincerely thank the Mekong River Commission for providing us with river discharge data to calibrate the hydrological models. Moreover, the authors are grateful to the reviewers and journal editors for their constructive comments and helpful suggestions, which resulted in this improved manuscript.
Author Contributions
E.D.P.P., T.S. and Y.I. conceived and designed the research; E.D.P.P. and T.Y. performed the RRI simulations; J.M. conducted the BTOP simulations; A.H. carried out the bias correction and simulation data preparation for RRI and BTOP simulations; E.D.P.P. analyzed the data and results; and E.D.P.P. wrote the paper.
Conflicts of Interest
The authors declare no conflict of interest.
References
- Solomon, S.; Qin, D.; Manning, M.; Chen, Z.; Marquis, M.; Averyt, K.B.; Tignor, M.; Miller, H.L. The Physical Science Basis; Contribution of Working Group I to the Fourth Assessment Report of the Intergovernmental Panel on Climate Change; Cambridge University Press: Cambridge, UK, 2007. [Google Scholar]
- Intergovernmental Panel on Climate Change (IPCC). Summary for policymakers. In Climate Change 2013: The Physical Science Basis; Contribution of WGI to the Fifth Assessment Report of the Intergovernmental Panel on Climate Change; Stocker, T.F., Qin, D., Plattner, G.-K., Tignor, M., Allen, S.K., Boschung, J., Nauels, A., Xia, Y., Bex, V., Midgley, P.M., Eds.; Cambridge University Press: Cambridge, UK; New York, NY, USA, 2013. [Google Scholar]
- Schmocker-Fackel, P.; Naef, F. More frequent flooding? Changes in flood frequency in Switzerland since 1850. J. Hydrol. 2010, 381, 1–8. [Google Scholar] [CrossRef]
- Hirabayashi, Y.; Mahendran, R.; Koirala, S.; Konoshima, L.; Yamazaki, D.; Watanabe, S.; Kim, H.; Kanae, S. Global flood risk under climate change. Nat. Clim. Chang. 2013, 3, 816–821. [Google Scholar] [CrossRef]
- Ramirez-Villegas, J.; Challinor, A.J.; Thornton, P.K.; Jarvis, A. Implications of regional improvement in global climate models for agricultural impact research. Environ. Res. Lett. 2013, 8, 1–12. [Google Scholar] [CrossRef]
- Allen, M.R.; Stott, P.A.; Mitchell, J.F.B.; Schnur, R.; Delworth, T.L. Quantifying the uncertainty in forecasts of anthropogenic climate change. Lett. Nat. 2000, 407, 617–620. [Google Scholar] [CrossRef] [PubMed]
- Webster, M.D.; Babiker, M.; Mayer, M.; Reilly, J.M.; Harnisch, J.; Hyman, R.; Sarofim, M.C.; Wang, C. Uncertainty in emissions projections for climate models. Atmos. Environ. 2002, 36, 3659–3670. [Google Scholar] [CrossRef]
- Khoi, D.N.; Hang, P.T.T. Uncertainty Assessment of Climate Change Impacts on Hydrology: A Case Study for the Central Highlands of Vietnam. In Managing Water Resources under Climate Uncertainty; Shrestha, S., Anal, A., Salam, P., van der Valk, M., Eds.; Springer: Cham, Switzerland, 2015. [Google Scholar]
- Fang, G.; Yang, J.; Chen, Y.; Li, Z.; De Maeyer, P. Impact of GCM structure uncertainty on hydrological processes in an arid area of China. Hydrol. Res. 2017. [Google Scholar] [CrossRef]
- Hurkmans, R.; Moel, H.; Aerts, J.C.J.H.; Troch, P.A. Water balance versus land surface model in the simulation of Rhine River discharges. Water Resour. Res. 2008, 44, 1–14. [Google Scholar] [CrossRef]
- Montenegro, R.; Ragab, R. Hydrological response of a Brazilian semi-arid catchment to different land use and climate change scenarios: A modelling study. Hydrol. Process. 2010, 24, 2705–2723. [Google Scholar] [CrossRef]
- Zhang, Y.; Wang, Y.; Niu, H. Spatio-temporal variations in the areas suitable for the cultivation of rice and maize in China under future climate scenarios. Sci. Total Environ. 2017, 601, 518–531. [Google Scholar] [CrossRef] [PubMed]
- Lenderink, G.; Van Ulden, A.P.; Van den Hurk, B.; Van Meijgaard, E. A study on combining global and regional climate model results for generating climate scenarios of temperature and precipitation for the Netherlands. Clim. Dyn. 2007, 29, 157–176. [Google Scholar] [CrossRef]
- Wilby, R.L.; Charles, S.P.; Zorita, E.; Timbal, B.; Whetton, P.; Mearns, L.O. Guidelines for Use of Climate Scenarios Developed from Statistical Downscaling Methods; IPCC Task Group on Data and Scenario Support for Impact and Climate Analysis (TGICA): Geneva, Switzerland, 2004; Available online: http://www.narccap.ucar.edu/doc/tgica-guidance-2004.pdf (accessed on 20 November 2017).
- Mearns, L.O.; Bogardi, I.; Giorgi, F.; Matyasovszky, I.; Palecki, M. Comparison of climate change scenarios generated from regional climate model experiments and statistical downscaling. J. Geophys. Res. 1999, 104, 6603–6621. [Google Scholar] [CrossRef]
- Yarnal, B.; Comrie, A.C.; Frakes, B.; Brown, D.P. Developments and prospects in synoptic climatology. Int. J. Climatol. 2001, 21, 1923–1950. [Google Scholar] [CrossRef]
- Haylock, M.R.; Cawley, G.C.; Harpham, C.; Wilby, R.L.; Goodess, C.M. Downscaling heavy precipitation over the United Kingdom: A comparison of dynamical and statistical methods and their future scenarios. Int. J. Climatol. 2006, 26, 1397–1415. [Google Scholar] [CrossRef]
- Mizuta, R.; Arakawa, O.; Ose, T.; Kusunoki, S.; Endo, H.; Kitoh, A. Classification of CMIP5 future climate responses by the tropical sea surface temperature changes. SOLA 2014, 10, 167–171. [Google Scholar] [CrossRef]
- Kitoh, A.; Endo, H. Changes in precipitation extremes projected by a 20-km mesh global atmospheric model. Weather Clim. Extrem. 2016, 11, 41–52. [Google Scholar] [CrossRef]
- Gosling, S.N.; Taylor, R.G.; Arnell, N.W.; Todd, M.C. A comparative analysis of projected impacts of climate change on river runoff from global and catchment-scale hydrological models. Hydrol. Earth Syst. Sci. 2011, 15, 279–294. [Google Scholar] [CrossRef]
- Kingston, D.G.; Thompson, J.R.; Kite, G. Uncertainty in climate change projections of discharge for the Mekong River Basin. Hydrol. Earth Syst. Sci. 2011, 15, 1459–1471. [Google Scholar] [CrossRef]
- Lauri, H.; de Moel, H.; Ward, P.J.; Räsänen, T.A.; Keskinen, M.; Kummu, M. Future changes in Mekong River hydrology: Impact of climate change and reservoir operation on discharge. Hydrol. Earth Syst. Sci. 2012, 6, 4603–4619. [Google Scholar] [CrossRef] [Green Version]
- Artlert, K.; Chaleeraktrakoon, C.; Nguyen, V.T.V. Modeling and analysis of rainfall processes in the context of climate change for Mekong, Chi, and Mun River Basins (Thailand). J. Hydro-Environ. Res. 2013, 7, 2–17. [Google Scholar] [CrossRef]
- Thompson, J.R. Assessment of uncertainty in river flow projections for the Mekong River using multiple GCMs and hydrological models. J. Hydrol. 2013, 486, 1–30. [Google Scholar] [CrossRef]
- Takeuchi, K.; Hapuarachchi, P.; Zhou, M.; Ishidaira, H.; Magome, J. A BTOP model to extend TOPMODEL for distributed hydrological simulation of large basins. Hydrol. Process. 2008, 22, 3236–3251. [Google Scholar] [CrossRef]
- Sayama, T.; Ozawa, G.; Kawakami, T.; Nabesaka, S.; Fukami, K. Rainfall-runoff-inundation analysis of the 2010 Pakistan flood in the Kabul River basin. Hydrol. Sci. J. 2012, 57, 298–312. [Google Scholar] [CrossRef]
- Thilakarathne, M.; Sridhar, V. Characterization of future drought conditions in the Lower Mekong River Basin. Weather Clim. Extrem. 2017. [Google Scholar] [CrossRef]
- Mekong River Commission. State of the Basin Report 2010; Mekong River Commission: Vientiane, Laos, 2010. [Google Scholar]
- Gates, W.L. AMIP—The atmospheric model inter-comparison project. Bull. Am. Meteorol. 1992, 73, 1962–1970. [Google Scholar] [CrossRef]
- Mizuta, R.; Yoshimura, H.; Murakami, H.; Matsueda, M.; Endo, H.; Ose, T.; Kamiguchi, K.; Hosaka, M.; Sugi, M.; Yukimoto, S.; et al. Climate simulations using MRI-AGCM3.2 with 20-km grid. J. Meteorol. Soc. Jpn. 2012, 90, 233–258. [Google Scholar] [CrossRef]
- Chen, H.; Xiang, T.; Zhou, X.; Xu, C.Y. Impacts of climate change on the Qingjiang Watershed’s runoff change trend in China. Stoch. Environ. Res. Risk Assess. 2012, 26, 847–858. [Google Scholar] [CrossRef]
- Vaze, J.; Teng, J. Future climate and runoff projections across New South Wales, Australia: Results and practical applications. Hydrol. Process. 2011, 25, 18–35. [Google Scholar] [CrossRef]
- Yatagai, A.; Kamiguchi, K.; Arakawa, O.; Hamada, A.; Yasutomi, N.; Kitoh, A. APHRODITE: Constructing a long term daily gridded precipitation dataset for Asia based on a dense network of rain gauges. Bull. Am. Meteorol. Soc. 2012, 96, 283–296. [Google Scholar] [CrossRef]
- Kamiguchi, K.; Arakawa, O.; Kitoh, A.; Yatagai, A.; Hamada, A.; Yasutomi, N. Development of APHRO_JP, the first Japanese high-resolution daily precipitation product for more than 100 years. Hydrol. Res. Lett. 2010, 4, 60–64. [Google Scholar] [CrossRef]
- Yasutomi, N.; Hamada, A.; Yatagai, A. Development of a long-term daily gridded temperature dataset and its application to rain/snow discrimination of daily precipitation. Glob. Environ. Res. 2011, 15, 165–172. [Google Scholar]
- Yasuda, T.; Nakajo, S.; Kim, S.; Mase, H.; Mori, N.; Horsburgh, K. Evaluation of future storm surge risk in East Asia based on state-of-the-art climate change projection. Coast. Eng. 2014, 83, 65–71. [Google Scholar] [CrossRef]
- Shou, K.J.; Yang, C.M. Predictive analysis of landslide susceptibility under climate change conditions—A study on the Chingshui River Watershed of Taiwan. Eng. Geol. 2015, 192, 46–62. [Google Scholar] [CrossRef]
- Mori, N.; Tetsuya, T. Impact assessment of coastal hazards due to future changes of tropical cyclones in the North Pacific Ocean. Weather Clim. Extrem. 2016, 11, 53–69. [Google Scholar] [CrossRef]
- Taylor, K.E.; Stouffer, R.J.; Meehl, G.A. An overview of CMIP5 and the experiment design. Bull. Am. Meteorol. Soc. 2012, 93, 485–498. [Google Scholar] [CrossRef]
- Inomata, H.; Takeuchi, K.; Fukami, K. Development of a statistical bias correction method for daily precipitation data of GCM20. Ann. J. Hydraul. Eng. JSCE 2011, 55, 247–252. [Google Scholar] [CrossRef]
- Perera, E.D.P.; Hiroe, A.; Shrestha, D.; Fukami, K.; Basnyat, D.B.; Gautam, S.; Hasegawa, A.; Uenoyama, T.; Tanaka, S. Community based flood damage assessment approach for lower West Rapti River basin in Nepal under the impact of climate change. Nat. Hazards 2014, 75, 669–699. [Google Scholar] [CrossRef]
- Magome, J.; Gusyev, M.; Hasegawa, A.; Takeuchi, K. River discharge simulation of a distributed hydrological model on global scale for the hazard quantification. In Proceedings of the 21st International Congress on Modelling and Simulation (MODSIM 2015), Broadbeach, QLD, Australia, 29 November–4 December 2015. [Google Scholar]
- Kwak, Y.; Magome, J.; Hasegawa, A.; Iwami, Y. Global Flood Exposure Assessment under Climate and Socio-economic Scenarios for Disaster Risk Reduction. In Proceeding of the 7th International Conference on Water Resources and Environment Research—ICWRER2016, Kyoto, Japan, 5–9 June 2016. [Google Scholar]
- Ao, T.; Ishidaira, H.; Takeuchi, K. Study of distributed runoff, simulation model based on block type TOPMODEL and Musskingum-Cunge method. Ann. J. Hydraul. Eng. JSCE 1999, 43, 7–12. [Google Scholar] [CrossRef]
- Takeuchi, K.; Ao, T.; Ishidaira, H. Introduction of block-wise use of TOPMODEL and Muskingum-Cunge method for the hydro-environmental simulation of a large ungauged basin. Hydrol. Sci. J. 1999, 44, 633–646. [Google Scholar] [CrossRef]
- Masutani, K.; Magome, J. An application of modified Muskingum-Cunge routing method with water conservation condition to a distributed runoff model. J. Jpn. Soc. Hydrol. Water Resour. 2009, 22, 294–300. [Google Scholar] [CrossRef]
- Hapuarachchi, H.A.P.; Zhou, M.C.; Kiem, A.S.; Geogievsky, M.V.; Magome, J.; Ishidaira, H. Investigation of the Mekong River basin hydrology for 1980–2000 using the YHyM. Hydrol. Process. 2008, 22, 1246–1256. [Google Scholar] [CrossRef]
- Gusyev, M.A.; Kwak, Y.; Khairul, M.I.; Arifuzzaman, M.B.; Magome, J.; Sawano, H.; Takeuchi, K. Effectiveness of water infrastructure for river flood management: Part 1—Flood Hazard Assessment using hydrological models in Bangladesh. Proc. IAHS 2015, 370, 75–81. [Google Scholar] [CrossRef]
- Navarathinam, K.; Gusyev, M.; Hasegawa, A.; Magome, J.; Takeuchi, K. Agricultural flood and drought risk reduction by a proposed multi-purpose dam: A case study of the Malwathoya River Basin, Sri Lanka. In Proceedings of the 21st International Congress on Modelling and Simulation (MODSIM 2015), Broadbeach, QLD, Australia, 29 November–4 December 2015. [Google Scholar]
- Nawai, J.; Gusyev, M.; Hasegawa, A.; Takeuchi, K. Flood and drought assessment with dam infrastructure: A case study of the Ba River basin, Fiji. In Proceedings of the 21st International Congress on Modelling and Simulation (MODSIM 2015), Broadbeach, QLD, Australia, 29 November–4 December 2015. [Google Scholar]
- Odhiambo, O.; Gusyev, M.; Hasegawa, A.; Magome, J.; Takeuchi, K. Flood and drought hazard reduction by proposed dams and a retarding basin: A case study of the Upper Ewaso Ngiro North River basin, Kenya. In Proceedings of the 21st International Congress on Modelling and Simulation (MODSIM 2015), Broadbeach, QLD, Australia, 29 November–4 December 2015. [Google Scholar]
- Kiem, A.S.; Ishidaira, H.; Hapuarachchi, H.P.; Zhou, M.C.; Hirabayashi, Y.; Takeuchi, K. Future hydro-climatology of the Mekong River basin simulated using the high-resolution Japan Meteorological Agency (JMA) AGCM. Hydrol. Process. 2008, 22, 1382–1394. [Google Scholar] [CrossRef]
- Yoshimura, C.; Zhou, M.; Kiem, A.S.; Fukami, K.; Prasantha, H.H.; Ishidaira, H.; Takeuchi, K. 2020s scenario analysis of nutrient load in the Mekong River Basin using a distributed hydrological model. Sci. Total Environ. 2009, 407, 5356–5366. [Google Scholar] [CrossRef] [PubMed]
- Sayama, T.; Tatebe, Y.; Iwami, Y.; Tanaka, S. Hydrologic sensitivity of flood runoff and inundation: 2011 Thailand floods in the Chao Phraya River basin. Nat. Hazards Earth Syst. Sci. 2015, 15, 1617–1630. [Google Scholar] [CrossRef] [Green Version]
- Hutten, N.C.; Gifford, G.F. Using the Green and Ampt infiltration equation on native and plowed rangeland soils. J. Range Manag. 1988, 41, 159–162. [Google Scholar] [CrossRef]
- Kidwell, M.R.; Weltz, M.A.; Guertin, P.R. Estimation of Green-Ampt effective hydraulic conductivity for rangelands. J. Range Manag. 1997, 50, 290–299. [Google Scholar] [CrossRef]
- Hunter, N.M.; Bates, P.D.; Horritt, M.S.; Wilson, M.D. Simple spatially-distributed models for predicting flood inundation: A review. Geomorphology 2007, 90, 208–225. [Google Scholar] [CrossRef]
- Kudo, S.; Sayama, T.; Hasegawa, A.; Iwami, A. Analysis of Flood Risk Change in Future Climate in terms of Discharge and Inundation in the Solo River Basin. In Proceedings of the 7th International Conference on Water Resources and Environment Research—ICWRER 2016, Kyoto, Japan, 5–9 June 2016. [Google Scholar]
- Shrestha, B.B.; Okazumi, T.; Miyamoto, M.; Sawano, H. Flood damage assessment in the Pampanga river basin of the Philippines. J. Flood Risk Manag. 2015, 9, 355–369. [Google Scholar] [CrossRef]
- Lehner, B.; Verdin, K.; Jarvis, A. New global hydrography derived from space born elevation data. Eos Trans. AGU 2008, 89, 93–94. [Google Scholar] [CrossRef]
- Food and Agriculture Organization (FAO). Digital Soil Map of the World; Version 3.6; Food and Agriculture Organization (FAO): Rome, Italy, 2007. [Google Scholar]
- Harris, I.; Jones, P.D.; Osborn, T.J.; Lister, D.H. Updated high-resolution grids of monthly climatic observations—the CRU TS3.10 Dataset. Int. J. Climatol. 2014, 34, 623–642. [Google Scholar] [CrossRef] [Green Version]
- Tucker, C.J.; Pinzon, J.E.; Brown, M.E. Global Inventory Modelling and Mapping Studies; NA94apr15b.n11-VIg, 2.0; Global Land Cover Facility, University of Maryland: College Park, MD, USA, 2004. [Google Scholar]
- Masutani, K.; Akai, K.; Magome, J. A new scaling algorithm of gridded river networks. J. Jpn. Soc. Hydrol. Water Resour. 2006, 19, 139–150, (In Japanese with English Abstract). [Google Scholar] [CrossRef]
- Chow, V.T. Open-Channel Hydraulics; McGraw-Hill: New York, NY, USA, 1959. [Google Scholar]
- Cochrane, T.A.; Arias, M.E.; Piman, T. Historical impact of water infrastructure on water levels of the Mekong River and the Tonle Sap system. Hydrol. Earth Syst. Sci. 2014, 18, 4529–4541. [Google Scholar] [CrossRef]
- Gachon, P.; St-Hilaire, A.; Ouarda, T.; Nguyen, V.T.V.; Lin, C.; Milton, J.; Chaumont, D.; Goldstein, J.; Hessami, M.; Nguyen, T.D. A First Evaluation of the Strength and Weaknesses of Statistical Downscaling Methods for Simulating Extremes over Various Regions of Eastern Canada; Final Report, Sub-Component; Climate Change Action Fund (CCAF), Environment Canada: Montréal, QC, Canada, 2005; p. 209.
- Ngoc Thuy, N.; Thuy, N.N.; Anh, H.H. Vulnerability of rice production in Mekong River delta under impacts from floods, salinity and climate change. Int. J. Adv. Sci. Eng. Inf. Technol. 2015, 5, 272–279. [Google Scholar] [CrossRef]
Figure 1.
Study area and river gauging stations (a) Mekong River Basin (BTOP model domain) , (b)LMB area (RRI model domain), and (c) LMB land use map used in RRI model.
Figure 1.
Study area and river gauging stations (a) Mekong River Basin (BTOP model domain) , (b)LMB area (RRI model domain), and (c) LMB land use map used in RRI model.

Figure 2.
Flowchart of the modelling process.
Figure 3.
Schematic diagram of rainfall-runoff-inundation (RRI) model.
Figure 4.
Comparison of observed and simulated discharges at the river gauging stations located in the LMB.
Figure 4.
Comparison of observed and simulated discharges at the river gauging stations located in the LMB.
Figure 5.
Monthly precipitation variability for the considered present and future climatic durations (cross: 25-year average, bar: ±1σ range).
Figure 5.
Monthly precipitation variability for the considered present and future climatic durations (cross: 25-year average, bar: ±1σ range).

Figure 6.
Monthly Kratie discharge variability for the considered present and future climatic durations (cross: 25-year average, bar: ±1σ range).
Figure 6.
Monthly Kratie discharge variability for the considered present and future climatic durations (cross: 25-year average, bar: ±1σ range).

Figure 7.
25-year averaged inundation distributions: (a) SPA_m01; (b) SFA_rcp85; (c) SFA_rcp85-c1; (d) SFA_rcp85-c2 and (e) SFA_rcp85-c3.
Figure 7.
25-year averaged inundation distributions: (a) SPA_m01; (b) SFA_rcp85; (c) SFA_rcp85-c1; (d) SFA_rcp85-c2 and (e) SFA_rcp85-c3.

Figure 8.
Maximum inundation out of 25 years simulation: (f) SPA_m01; (g) SFA_rcp85; (h) SFA_ rcp85-c1; (i) SFA_ rcp85-c2 and (j) SFA_ rcp85-c3.
Figure 8.
Maximum inundation out of 25 years simulation: (f) SPA_m01; (g) SFA_rcp85; (h) SFA_ rcp85-c1; (i) SFA_ rcp85-c2 and (j) SFA_ rcp85-c3.

Figure 9.
The 25-year averaged cumulative rainfall of the Mekong basin for the present and future climate experiments.
Figure 9.
The 25-year averaged cumulative rainfall of the Mekong basin for the present and future climate experiments.

Figure 10.
The 25-year averaged cumulative specific river runoff volume at the Kratie station and 25-year averaged cumulative specific inundation volume (above 0.5 m) in the LMB.
Figure 10.
The 25-year averaged cumulative specific river runoff volume at the Kratie station and 25-year averaged cumulative specific inundation volume (above 0.5 m) in the LMB.


Table 1.
Performance indicators for RRI simulated river runoff of selected gauging stations in the LMB.
Table 1.
Performance indicators for RRI simulated river runoff of selected gauging stations in the LMB.
| Performance Indicators | Kampong Cham | Prak Kdam | Chroy Changver | Neak Luoung + Koh Khol | ||||
|---|---|---|---|---|---|---|---|---|
| Calibration | Validation | Calibration | Validation | Calibration | Validation | Calibration | Validation | |
| RRMSE | 0.16 | 0.14 | 2.14 | 3.47 | 0.12 | 0.16 | 0.25 | 0.21 |
| NSC | 0.96 | 0.98 | 0.67 | 0.65 | 0.97 | 0.93 | 0.82 | 0.92 |
| R2 | 0.96 | 0.99 | 0.72 | 0.72 | 0.97 | 0.97 | 0.93 | 0.95 |
Table 2.
Comparison of present and future hydrological features of the LMB.
| Inundation area | 1.34 | 1.26 | 1.35 | 1.24 |
| Specific discharge volume at Kratie | 1.25 | 1.16 | 1.21 | 1.21 |
| Specific inundation volume | 1.60 | 1.30 | 1.52 | 1.29 |
| Cumulative rainfall | 1.11 | 1.09 | 1.10 | 1.11 |
© 2017 by the authors. Licensee MDPI, Basel, Switzerland. This article is an open access article distributed under the terms and conditions of the Creative Commons Attribution (CC BY) license (http://creativecommons.org/licenses/by/4.0/).
Share and Cite
MDPI and ACS Style
Perera, E.D.P.; Sayama, T.; Magome, J.; Hasegawa, A.; Iwami, Y. RCP8.5-Based Future Flood Hazard Analysis for the Lower Mekong River Basin. Hydrology 2017, 4, 55. https://doi.org/10.3390/hydrology4040055
AMA Style
Perera EDP, Sayama T, Magome J, Hasegawa A, Iwami Y. RCP8.5-Based Future Flood Hazard Analysis for the Lower Mekong River Basin. Hydrology. 2017; 4(4):55. https://doi.org/10.3390/hydrology4040055
Chicago/Turabian StylePerera, Edangodage Duminda Pradeep, Takahiro Sayama, Jun Magome, Akira Hasegawa, and Yoichi Iwami. 2017. "RCP8.5-Based Future Flood Hazard Analysis for the Lower Mekong River Basin" Hydrology 4, no. 4: 55. https://doi.org/10.3390/hydrology4040055
Note that from the first issue of 2016, this journal uses article numbers instead of page numbers. See further details here.