Article

Mineralization and Characterization of Composite Lyophilized Gelatin Sponges Intended for Early Bone Regeneration

1
Department of Biomedical Engineering, The University of Memphis and Joint University of Memphis-UTHSC-Memphis Biomedical Engineering Program, 119D Engineering Technology, Memphis, TN 38152, USA
2
Department of Biomedical Sciences, Heritage College of Osteopathic Medicine, Ohio University, Grosvenor Hall, Athens, OH 45701, USA
3
Department of Biomedical Engineering, Parks College of Engineering, Aviation, and Technology, Saint Louis University, 3507 Lindell Blvd., St. Louis, MO 63103, USA
*
Author to whom correspondence should be addressed.
Bioengineering 2014, 1(1), 62-84; https://doi.org/10.3390/bioengineering1010062
Submission received: 13 November 2013 / Revised: 11 December 2013 / Accepted: 24 December 2013 / Published: 8 January 2014

Abstract

:
The application of freeze-dried gelatin sponges as alternative bone grafting substitutes has many advantages, including the ability to swell, high porosity, tailorable degradation, and versatility to incorporate multiple components such as growth factors and nanofillers. The purpose of this study was to mineralize (M) and further characterize 1-Ethyl-3-[3-dimethylaminopropyl]carbodiimide hydrochloride (EDC) cross-linked gelatin sponges enhanced with preparations rich in growth factors, hydroxyapatite, and chitin whiskers (PHCE). Sponges were characterized for their swelling and in vitro mineralization potential, surface characteristics, protein release, mechanical properties, and MG-63 cell attachment and infiltration. All sponges swelled up to 50% of their original volume upon hydration. Scanning electron microscopy showed sparse mineral deposition for gelatin-M scaffolds while PHCE-M scaffolds exhibited more uniform mineral nucleation. Over 21 days, PHCE-M scaffolds cumulatively released significantly more (30%) of its initial protein content than all other scaffolds. PHCE-M scaffolds reported lower modulus values (1.3–1.6 MPa) when compared to gelatin control scaffolds (1.6–3.2 MPa). Increased cell attachment and infiltration was noticed on PHCE and PHCE-M scaffolds. The results of the study demonstrate the enhanced performance of PHCE and PHCE-M scaffolds to serve as bone healing scaffolds. Their potential to release incorporated factors, comparable composition/mechanical properties to tissues developed in the early stages of bone healing, and enhanced initial cellular response make them suitable for further studies evaluating more complex cellular interactions.

Graphical Abstract

1. Introduction

Common procedures to supplement bone repair in larger defects include implantation of bone graft materials such as autografts, allografts, xenografts, and synthetic biomaterials (i.e., ceramics, cements, glasses, metals, polymers, and composites) [1,2,3,4,5]. Autologous bone grafting (patient’s own bone) is the current gold-standard procedure to replace or repair missing or damaged bone. Autografts are advantageous in that they possess desirable characteristics of bone grafts: osteogenic, osteoconductive, and osteoinductive [2]. Although autologous bone grafting produces satisfactory results, these grafts carry the risk of donor site morbidity as well as limited availability. Other grafting options such as synthetic materials (metals and ceramics) elicit a foreign body response and are not biodegradable. The increasing number of bone grafts performed in the U.S. annually, combined with the drawbacks of autografts, has created a shortage of cadaver allografts and a need to increase musculoskeletal tissue donation. As a result, there has been an increase in corporate interest in regards to developing alternative bone grafting substitutes which include (but are not limited to) the use of natural, synthetic, human, and animal-derived biomaterials. The sales of bone grafts and bone-graft substitutes in the U.S. have increased from 0.3 to 1.5 billion dollars from 1999–2009 with increased spending on bone substitutes, platelet concentrators, bone morphogenetic proteins, and more [6].
There are several properties and characteristics to consider when fabricating an ideal scaffold intended for bone tissue engineering. These include: biocompatibility, degradability (as scaffold degrades, space is created for new bone), porosity (angiogenesis and migration/infiltration of cells to deposit bone within), mechanical integrity (ability to maintain its structure and mimic mechanical properties found in bone healing microenvironment), osteoconductivity (ability to support bone growth), and osteoinductivity (ability to differentiate osteoprogenitor cells into osteoblasts). A lyophilized gelatin sponge cross-linked with 1-Ethyl-3-[3-dimethylaminopropyl]carbodiimide hydrochloride (EDC) during gelation provides a biocompatible, porous, and degradable scaffold. The addition of preparations rich in growth factors (PRGF, a bioactive lyophilized version of platelet-rich plasma) contains high concentrations of growth factors and cytokines which are known to enhance angiogenesis and osteogenesis. Some of these factors include epidermal growth factor (EGF), vascular endothelial growth factor (VEGF), platelet-derived growth factor (PDGF), transforming growth factor-β (TGF-β), fibroblast growth factor (FGF), insulin-like growth factor-1 (IGF-1), and more [7,8,9,10,11]. The incorporation of hydroxyapatite (HA) and chitin whiskers (CW) are also known to enhance cell attachment, migration, penetration, and scaffold mechanical integrity [12,13,14,15,16,17,18]. The additional deposition of minerals to a scaffold surface via simulated body fluid (SBF) treatment can further enhance the osteoconductivity of scaffolds by providing a bone-like mineral surface prior to cell seeding which is essential for creating a bond with the living host bone [19,20,21,22]. This technique can be used for complex porous scaffolds since the apatite crystals are generated from an aqueous solution. It has been found that the bone-like mineral (carbonated HA) layer generated resembles natural bone mineral in its nano-crystal size and low crystallinity [23]. A previous study demonstrated the enhanced protein release and cell attachment/infiltration in scaffolds cross-linked during gelation and in scaffolds incorporated with biological factors (HA, CW, and PRGF) [24]. The purpose of this study is to further characterize acellular cross-linked lyophilized gelatin sponges enhanced with PRGF, HA, and CW (PHCE). The addition of a bone-like mineral surface via SBF treatment was intended to produce enhanced mineralized (M) scaffolds when compared to their non-mineralized counterparts. A growth factor loading profile of uncross-linked PHC scaffolds and dilutions of PRGF, platelet-rich plasma (PRP), and platelet-poor plasma (PPP) is also of interest to identify key growth factors present at different stages of the PRGF isolation process and incorporated within the sponges. Gelatin controls (GE) will be compared to GE-M, PHCE, and PHCE-M in regards to mineralization, protein release, growth factor loading, compressive mechanical properties, and cell attachment and infiltration to determine if these sponges appropriately meet the design characteristics of an ideal bone tissue engineering scaffold intended for early bone healing.

2. Experimental Section

2.1. Fabrication of Gelatin Composite Sponges

Gelatin+EDC (GE) scaffolds served as a control. Lyophilized GE and PRGF+HA+CW+EDC (PHCE) sponges were prepared following a protocol published in a previous study [24]. Briefly, a 30 mg/mL gelatin solution in deionized (DI) water was used as the base solution for creating gels. For GE scaffolds, 50 mM of EDC was added to 4 mL of the gelatin solution, briefly mixed, pipetted into a 35 × 10 mm Petri dish, and stored in a refrigerator at 4 °C overnight to gel. For PHCE scaffolds, 3.33 mg/mL of both HA and CW were added to 4 mL of the gelatin solution, then sonicated. 3.33 mg/mL of PRGF was then added to the gelatin-HA-CW solution and allowed to completely dissolve (about 3 min). 50 mM EDC was then added to the 4 mL gelatin-PRGF-HA-CW solution, briefly mixed, transferred to a 35 × 10 mm Petri dish, and allowed to gel overnight at 4 °C. After gelation of all solutions, gels were slowly frozen to −70 °C and lyophilized to obtain the composite porous sponges. 6 mm discs were then punched and used for all studies. Materials included gelatin, (Type B from Bovine skin, Sigma, St. Louis, MO, USA), HA nanopowder (particle size < 200 nm (BET), Sigma-Aldrich, St. Louis, MO, USA), CW (prepared by following a published protocol [15]), PRGF (created using published protocol [25]), and EDC (Thermo Scientific, Waltham, MA, USA).

2.2. Swelling Percent

To quantify the initial swelling capability of the GE and PHCE lyophilized sponges, measurements of the scaffold’s dimensions were recorded dry and after 1 day hydration in Dulbecco’s modified Eagle’s medium (DMEM, high glucose) containing 10% fetal bovine serum and 1% penicillin/streptomycin. Volume was calculated using the standard equation for the volume of a cylinder (π × radius2 × height). The formula (hydrated volume–dry volume)/(dry volume) was used to determine the swelling ratio of each scaffold. This ratio was then multiplied by 100 to calculate the percent increase in volume for each scaffold as a result of hydration (swelling percent).

2.3. Scaffold Mineralization

The ionic concentrations of the commonly used SBF, conventional SBF (c-SBF), are not exactly equal to those of blood plasma. This led to the development of various SBFs with ionic concentrations closer or equal to those of blood plasma. Of the compositions, r-SBF was the closest to the concentration of total blood plasma; in fact it is an exact match. For this reason, a r-SBF solution was prepared by following the published protocol for 1×x r-SBF and increasing each ion concentration by a factor of 5 [26]. A higher (5×) concentration of SBF was chosen in order to effectively mineralize the scaffolds with minimal incubation time.
Triplicates of 6 mm diameter discs were punched from each of the composite gelatin sponges and separately incubated in 1 mL of 5× r-SBF for 1 h at 37 °C and 5% CO2 atmosphere. Preliminary studies mineralized scaffolds for 1, 6, and 12 h and determined that 1 h incubation in 5× r-SBF was sufficient to mineralize the scaffold. Mineralization was performed under static conditions with the discs completely submerged in SBF. After 1 h incubation, scaffolds were removed and rinsed with DI water to wash off any minerals that were not bound to the scaffold. To visually inspect surface mineralization, one scaffold disc was dehydrated and used for image analysis. For mineral quantification, Alizarin Red S staining was used. GE and PHCE mineralized scaffolds are denoted as GE-M and PHCE-M, respectively.

2.4. Scanning Electron Microscopy

For acellular scaffolds, scanning electron microscopy (SEM) was performed in order to evaluate the scaffold surface characteristics prior to and following mineralization. GE, GE-M, PHCE, and PHCE-M samples were disinfected (30 min ethanol followed by three washes of 1× phosphate buffered saline, PBS) to simulate preparation for cell studies, air-dried, mounted on an aluminum stub, carbon coated, and examined using a Hitachi SU-70 scanning electron microscope (accelerating voltage at 20 kV).
Cellularized scaffolds were fixed in 1 mL of 10% formalin after 1, 4, 7, 14, and 21 days in culture and stored at 4 °C until further analysis. Prior to imaging, cellularized scaffolds were removed from formalin, briefly rinsed in PBS and DI water, subjected to ethanol dehydration (10 min soaks in 30, 50, 70, 90, and 100% ethanol, subsequently), and air dried overnight. All dry samples were mounted on aluminum stubs, sputter coated in gold for 70 s, and examined using a JEOL JSM-5610LV SEM (accelerating voltage at 20 kV).

2.5. Alizarin Red S Staining

Alizarin Red S (ARS) staining was used to quantify scaffold mineral content by following a modified published protocol [24,27]. ARS was performed on the 6 mm scaffold punches before and directly after mineralization, and after 21 days incubation in 1× PBS at 37 °C and 5% CO2. At the desired time points, scaffolds were stained with 40 mM Alizarin Red for 30 min then washed with DI water to remove any unbound stain. Scaffolds were then de-stained for 1 h in 1.5 mL of 50% acetic acid. The solubilized stain was neutralized to a pH of 4.1 using 1 M NaOH. 200 μL of the neutralized solution was transferred to a 96-well plate and absorbance read at 550 nm using a SpectraMax® Plus 384 Microplate Spectrophotometer (Molecular Devices, Sunnyvale, CA, USA). Absorbance values were compared to each other to determine any change in mineral content as a result of mineralization or degradation.

2.6. Scaffold Protein Release

Release of protein from the scaffolds was measured as one parameter to assess potential degradation. To determine total protein content of each 6 mm scaffold disc, triplicates of non-cross-linked 6 mm punches of each scaffold type were immersed in 1 mL of 1× PBS. Non-cross-linked scaffolds completely degraded within minutes at room temperature; however scaffolds were left overnight to ensure complete degradation. Since scaffolds are primarily comprised of gelatin, the degraded byproducts are detectable using a general protein assay (Pierce BCA, Thermo Scientific). Scaffold release kinetics were studied by quantifying protein release from each scaffold over a period of 21 days. Triplicates of one 6 mm disc of each cross-linked scaffold type were incubated in 1 mL of 1× PBS at 37 °C with PBS replaced on every analysis point. After incubation for 1, 4, 7, 14, and 21 days, the releasate was analyzed for general protein content via the Pierce BCA Protein Assay. Briefly, 200 μL of the assay working reagent was added to wells in a 96-well plate. 25 μL of the releasate was then added to the wells, incubated at 37 °C for 30 min, cooled to room temperature, and absorbance measured at 562 nm using the same plate reader described in the previous section [24].

2.7. Growth Factor Analysis

The same protein release model described in Section 2.6 was used to identify and quantify the PRGF growth factors incorporated and released from PRGF containing scaffolds. After 1, 4, 7, 14, and 21 days the 1 mL of 1× PBS containing released PHCE and PHCE-M scaffold contents in each well was analyzed for specific growth factor content. As a control of total growth factors loaded in each scaffold, triplicates of 6 mm discs of non-cross-linked gelatin+PRGF+HA+CW (PHC) scaffolds were completely degraded in 1 mL of 1× PBS by overnight incubation at 37 °C. Dilutions of pure PRGF (100, 50, 10, 1, and 0.1 mg/mL), PRP (1:10 and 1:20), and platelet-poor plasma (PPP, 1:10, 1:20) in DI water were also analyzed to obtain a profile of growth factors present in PRGF, PRP, and PPP alone at different concentrations. This detection and quantification was accomplished by using a Luminex MAGPIX® multiplexer (fluorescent imager) with the MILLIPLEX® MAP human angiogenesis/growth factor magnetic bead panel 1 and following manufacturer protocol for analysis. The angiogenesis kit contained analytes specific to detecting epidermal growth factor (EGF), granulocyte colony-stimulating factor (G-CSF), fibroblast growth factor-1 (FGF-1), FGF-2, interleukin 8 (IL-8), hepatocyte growth factor (HGF), vascular endothelial growth factor A (VEGF-A), VEGF-C, and VEGF-D.

2.8. Uniaxial Compression Testing

Uniaxial compression testing was performed on acellular 6 mm scaffold discs after 1, 4, 7, 14, and 21 days incubation in media. Mechanical testing was conducted by using 2 flat metal platens from tension grips attached to a Bionix® 200 Mechanical Testing System instrument with a 100 N load cell (MTS Systems Corp., Eden Prairie, MN, USA). The 2 platens spanned the entire 6 mm scaffold disc. Platen compression was performed perpendicular to the scaffold surface without any circumferential constraints to allow for free lateral deformation. Scaffolds were removed from media, dabbed on a kimwipe to remove excess media/liquid, then placed on the flat metal surface (samples were still hydrated). The upper platen was lowered to the surface of the scaffolds and the following parameters were used: test speed of 0.5 mm/min, data acquisition rate of 10 Hz, and a preload of 0.01 N. Compression was continuous until the scaffold was completely flattened (100% strain), the platens were compressing against each other, and terminated just before the system maxed out at 100 N. Peak load and Young’s modulus for compression were extracted and calculated using the graphical value output from the MTS software TestWorks® 4.0. Peak load was extracted from the largest load value before the system began to max out. The compression modulus was calculated using the initial linear region of the stress-strain curve [28].

2.9. Cell Seeding

In the previous study, MG-63 cells were statically seeded on 6 mm-sized scaffold discs in a 96-well plate [24]. Although the static method produced sufficient preliminary results, a more in vivo-mimicking method is appropriate for cell seeding. For this experiment, a dynamic (floating scaffold) cell seeding technique was used to not “force” the cells to attach to the scaffold. To accomplish this, a rotary cell culture system (Synthecon, Inc., Houston, TX, USA) was used. Four bioreactors (60 mL volume capacity each) were autoclaved and attached to the rotary system in a sterile incubator for dynamic cell seeding. Twelve 6 mm discs of each scaffold type (GE, GE-M, PHCE, PHCE-M) were disinfected (30 min ethanol followed by three 10 min washes in 1x PBS) and transferred to separate bioreactors. MG-63 osteoblast-like cells were suspended in control media (DMEM high glucose with 10% fetal bovine serum and 1% penicillin/streptomycin) at a concentration of 50,000 cells/mL. 60 mL of this cell solution was then added to each bioreactor containing disinfected scaffolds. Bioreactors with scaffolds floating in cell suspension were placed in an incubator with standard culture conditions (37 °C and 5% CO2) and turned on (42 rpm) to allow circulation of cell suspension solution and tumbling of floating scaffolds. After dynamic cell seeding for 6 h, scaffolds were then transferred from the bioreactor to a 96-well plate containing 150 µL of culture media and statically cultured for 1, 4, 7, 14, 21 days with media changes every 3 days. Cellular scaffolds were characterized for surface characteristics and cell attachment and infiltration.

2.10. Cell Attachment and Infiltration

After 1, 4, 7, 14, and 21 days in culture, cellularized scaffolds were fixed in 1 mL of 10% formalin and stored at 4 °C until further analysis. Scaffolds were prepared for SEM imaging (described above) and 4′-6-diamidino-2-phenylindole (DAPI) staining [24]. For DAP staining, scaffolds were removed from formalin, immersed in sucrose solution 48 h at 4 °C, suspended in frozen sectioning compound, and frozen at −70 °C overnight. 60 µm slices were cryosectioned and transferred to microscope slides. Sample cross-sections were then stained with DAPI for 5 min and imaged at 10× magnification using a UV fluorescent microscope to display the location of cell nuclei. Multiple scaffold sections and areas were scanned and one image was taken for each condition which represented the overall cell behavior. Cell density for this image was calculated by counting the number of cells per field of view (10× magnification) for each 60 μm thick scaffold section. As previously discovered, the ability to image cells via DAPI staining becomes increasingly difficult after weeks of culture. Therefore, only days 1 and 4 DAPI images are reported and serve as an indication to initial cell attachment and infiltration.

2.11. Statistical Analysis

Statistical analysis was performed using JMP IN 9 statistical software (SAS Institute) to determine significant differences at an apriori level of p < 0.05). Analysis of the data was based on a Kruskal-Wallis one-way analysis of variance on ranks and a Tukey-Kramer pairwise multiple comparison procedure. The results are presented in mean ± standard deviation (SD). Samples were run at least in triplicates (n = 3).

3. Results and Discussion

3.1. Swelling Percent

In a previous study, it was discovered that these lyophilized gelatin composite sponges have the ability to absorb the solution they are hydrated in (media and 1× PBS) and significantly increase their mass [24]. By calculating the swelling percent, we are able to further characterize the hygroscopic nature of these sponges and their ability to potentially fill a void space upon implantation. By calculating changes in volume, it was determined that both GE and PHCE lyophilized sponges swelled approximately 50% of their original volume (Figure 1). There was no statistical difference (p < 0.05) between the swelling of GE and PHCE scaffolds suggesting that the added components of PRGF, HA, and CW neither enhance nor hinder the swelling ability of the scaffold. The result of no statistical differences in swelling could be attributed to the fact that the 3.33 mg/mL of each PRGF, HA, and CW added to the 30 mg/mL gelatin solution was too low to alter the natural swelling properties of the gelatin sponge. The swelling percent of mineralized sponges could not be assessed since mineralization required the immersion of dry scaffolds in a simulated body fluid solution. Therefore, mineralized sponges were already hydrated and expanded to their maximum swelling potential as a result of the mineralizing process.

3.2. Scanning Electron Microscopy

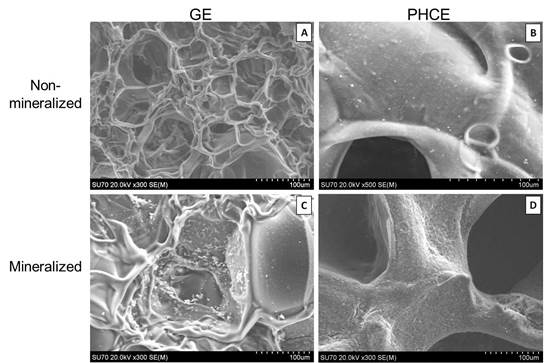
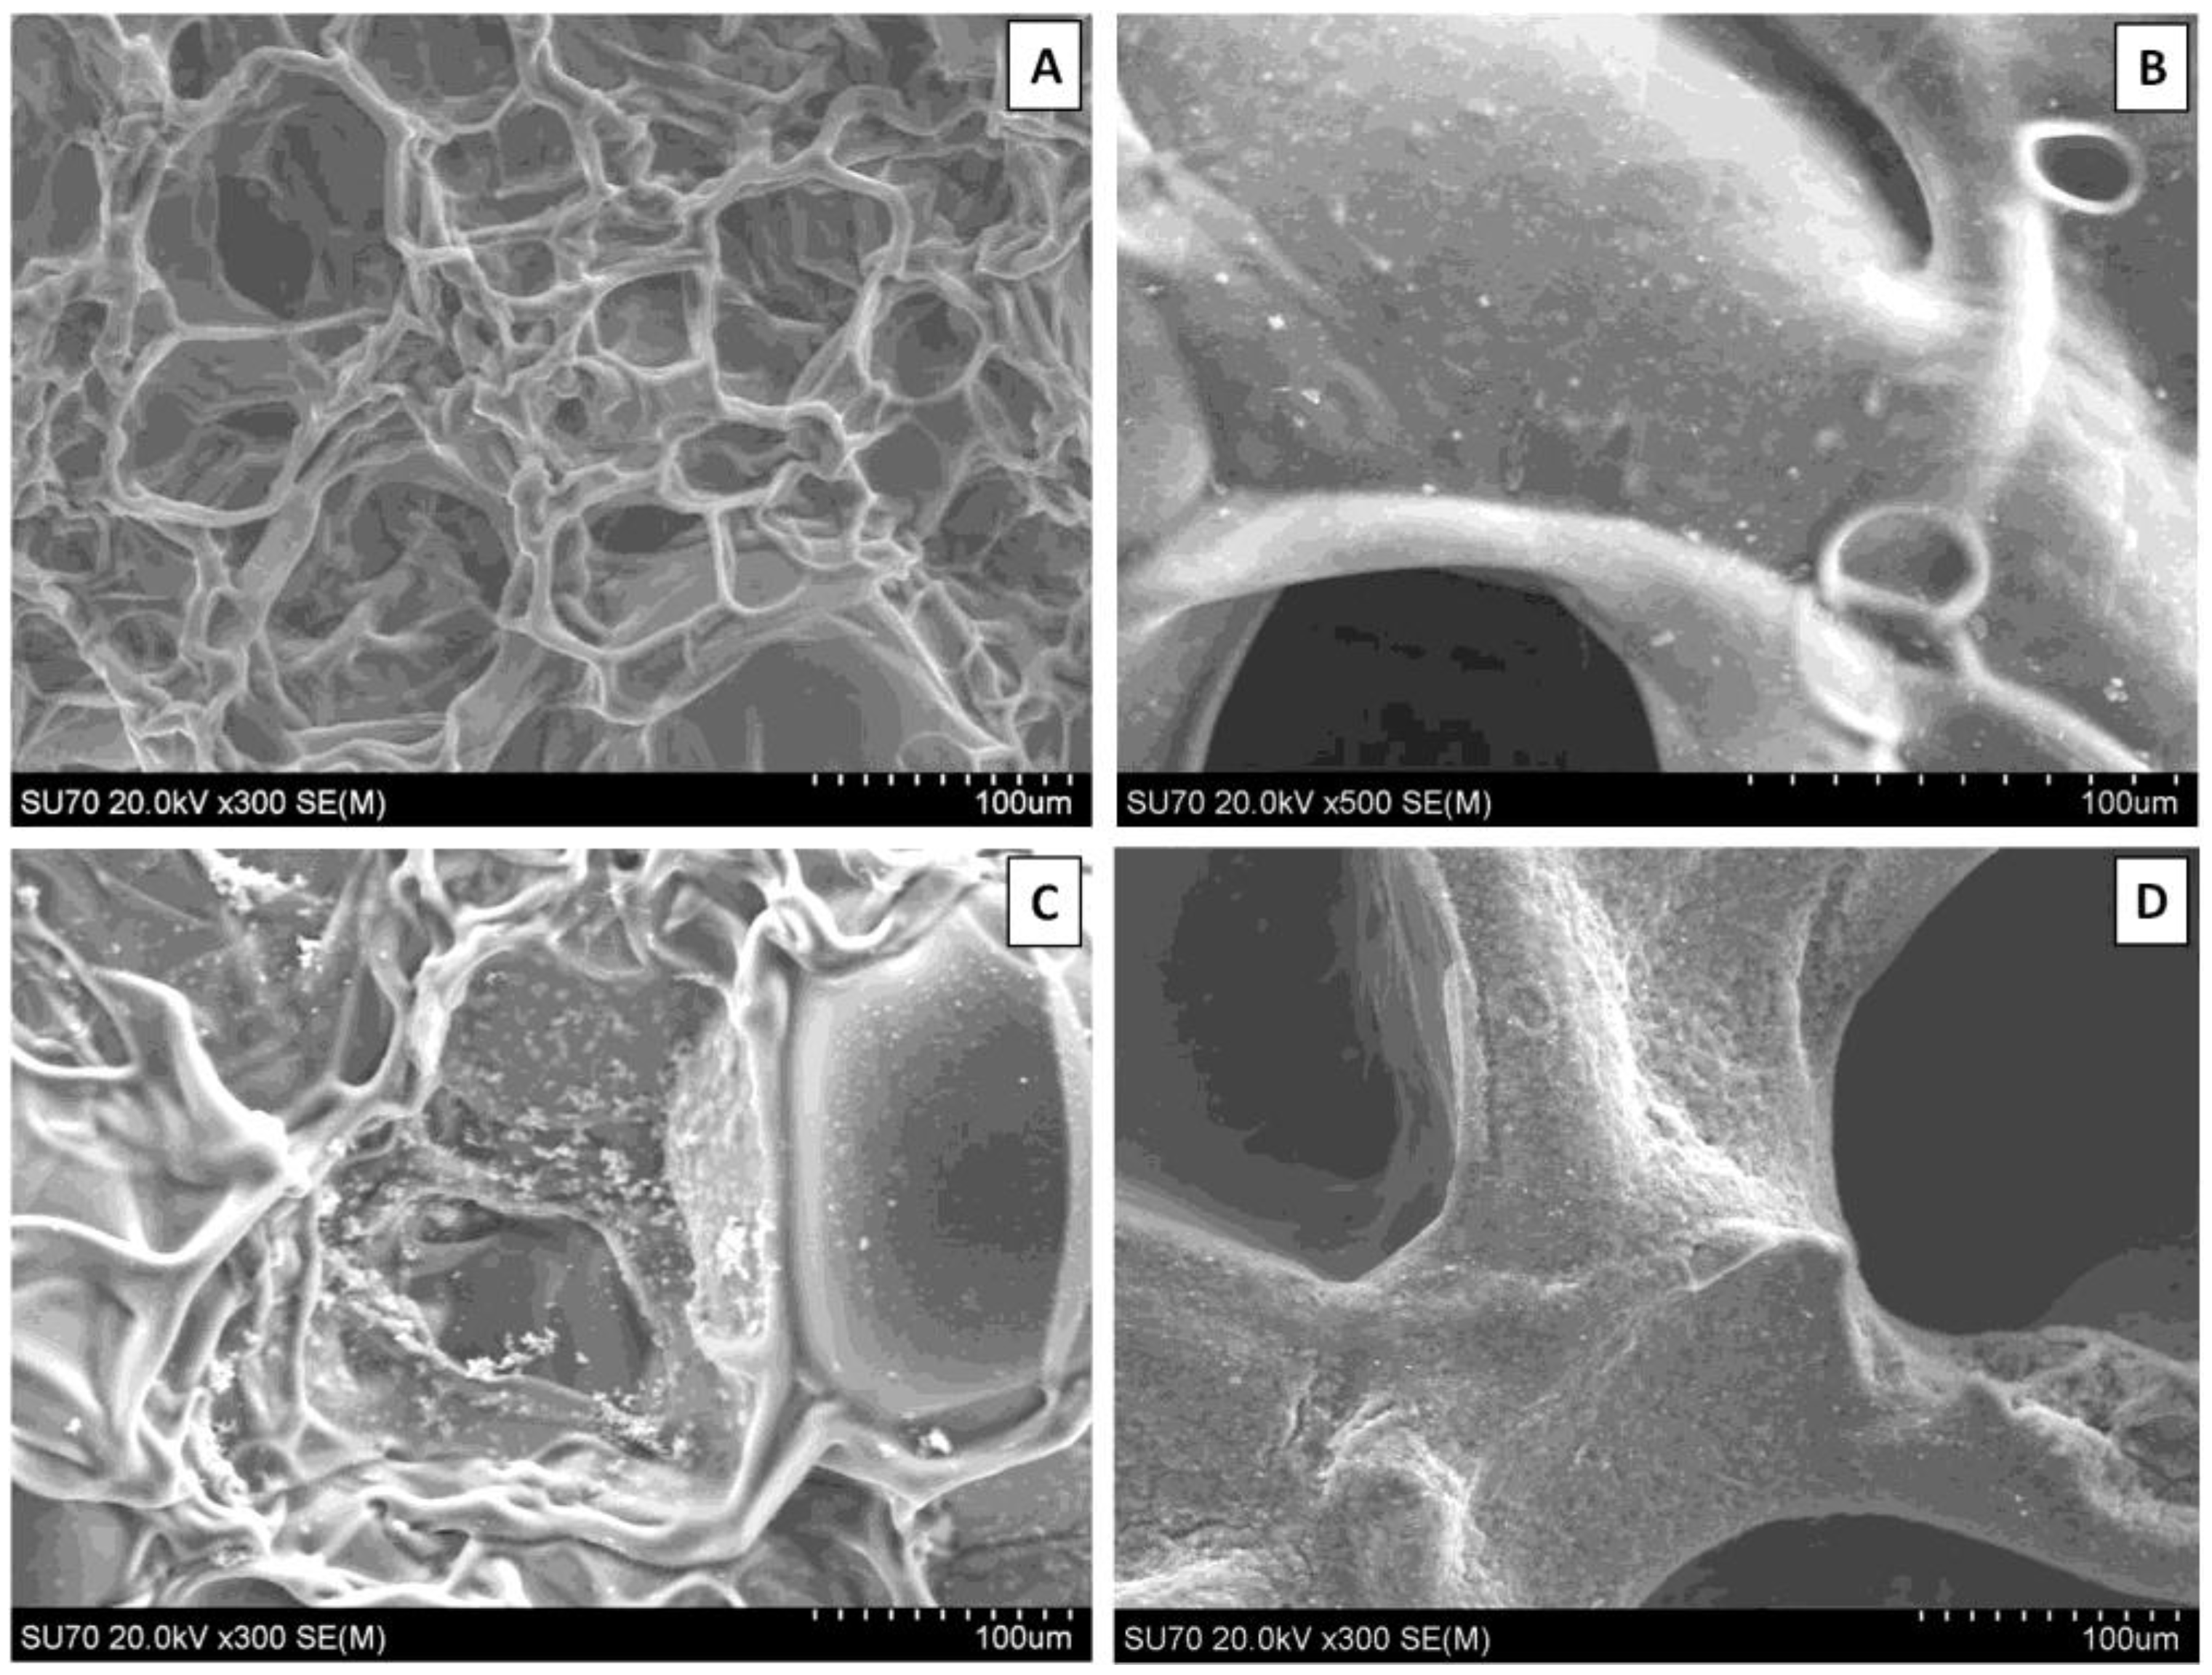
SEM revealed surface differences between GE and PHCE scaffolds, as well as mineralized and non-mineralized scaffolds (Figure 2). GE scaffolds appear to have a smoother material surface with smaller pores while PHCE scaffolds contain a rougher surface with larger pores. Since GE scaffolds are only composed of gelatin, it was expected that they exhibit a more uniform surface composition. The addition of growth factors and nanofillers for PHCE scaffolds altered the scaffold characteristics by having a presence of the added molecules on the surface as well as a larger pore size. It is hypothesized that the small spheres and rougher surface visualized in Figure 2(B) is attributed to the incorporated nanofillers (HA and CW) present on or near the surface of the scaffold. After mineralization, GE-M scaffolds showed small clusters of mineral nucleation while PHCE-M scaffolds exhibited a more uniform attraction. One of the aims of this study is to evaluate differences between mineralized and non-mineralized scaffold protein release, mechanical properties, and cellular response to understand any added benefit to the nucleation of crystals to the scaffold surface.
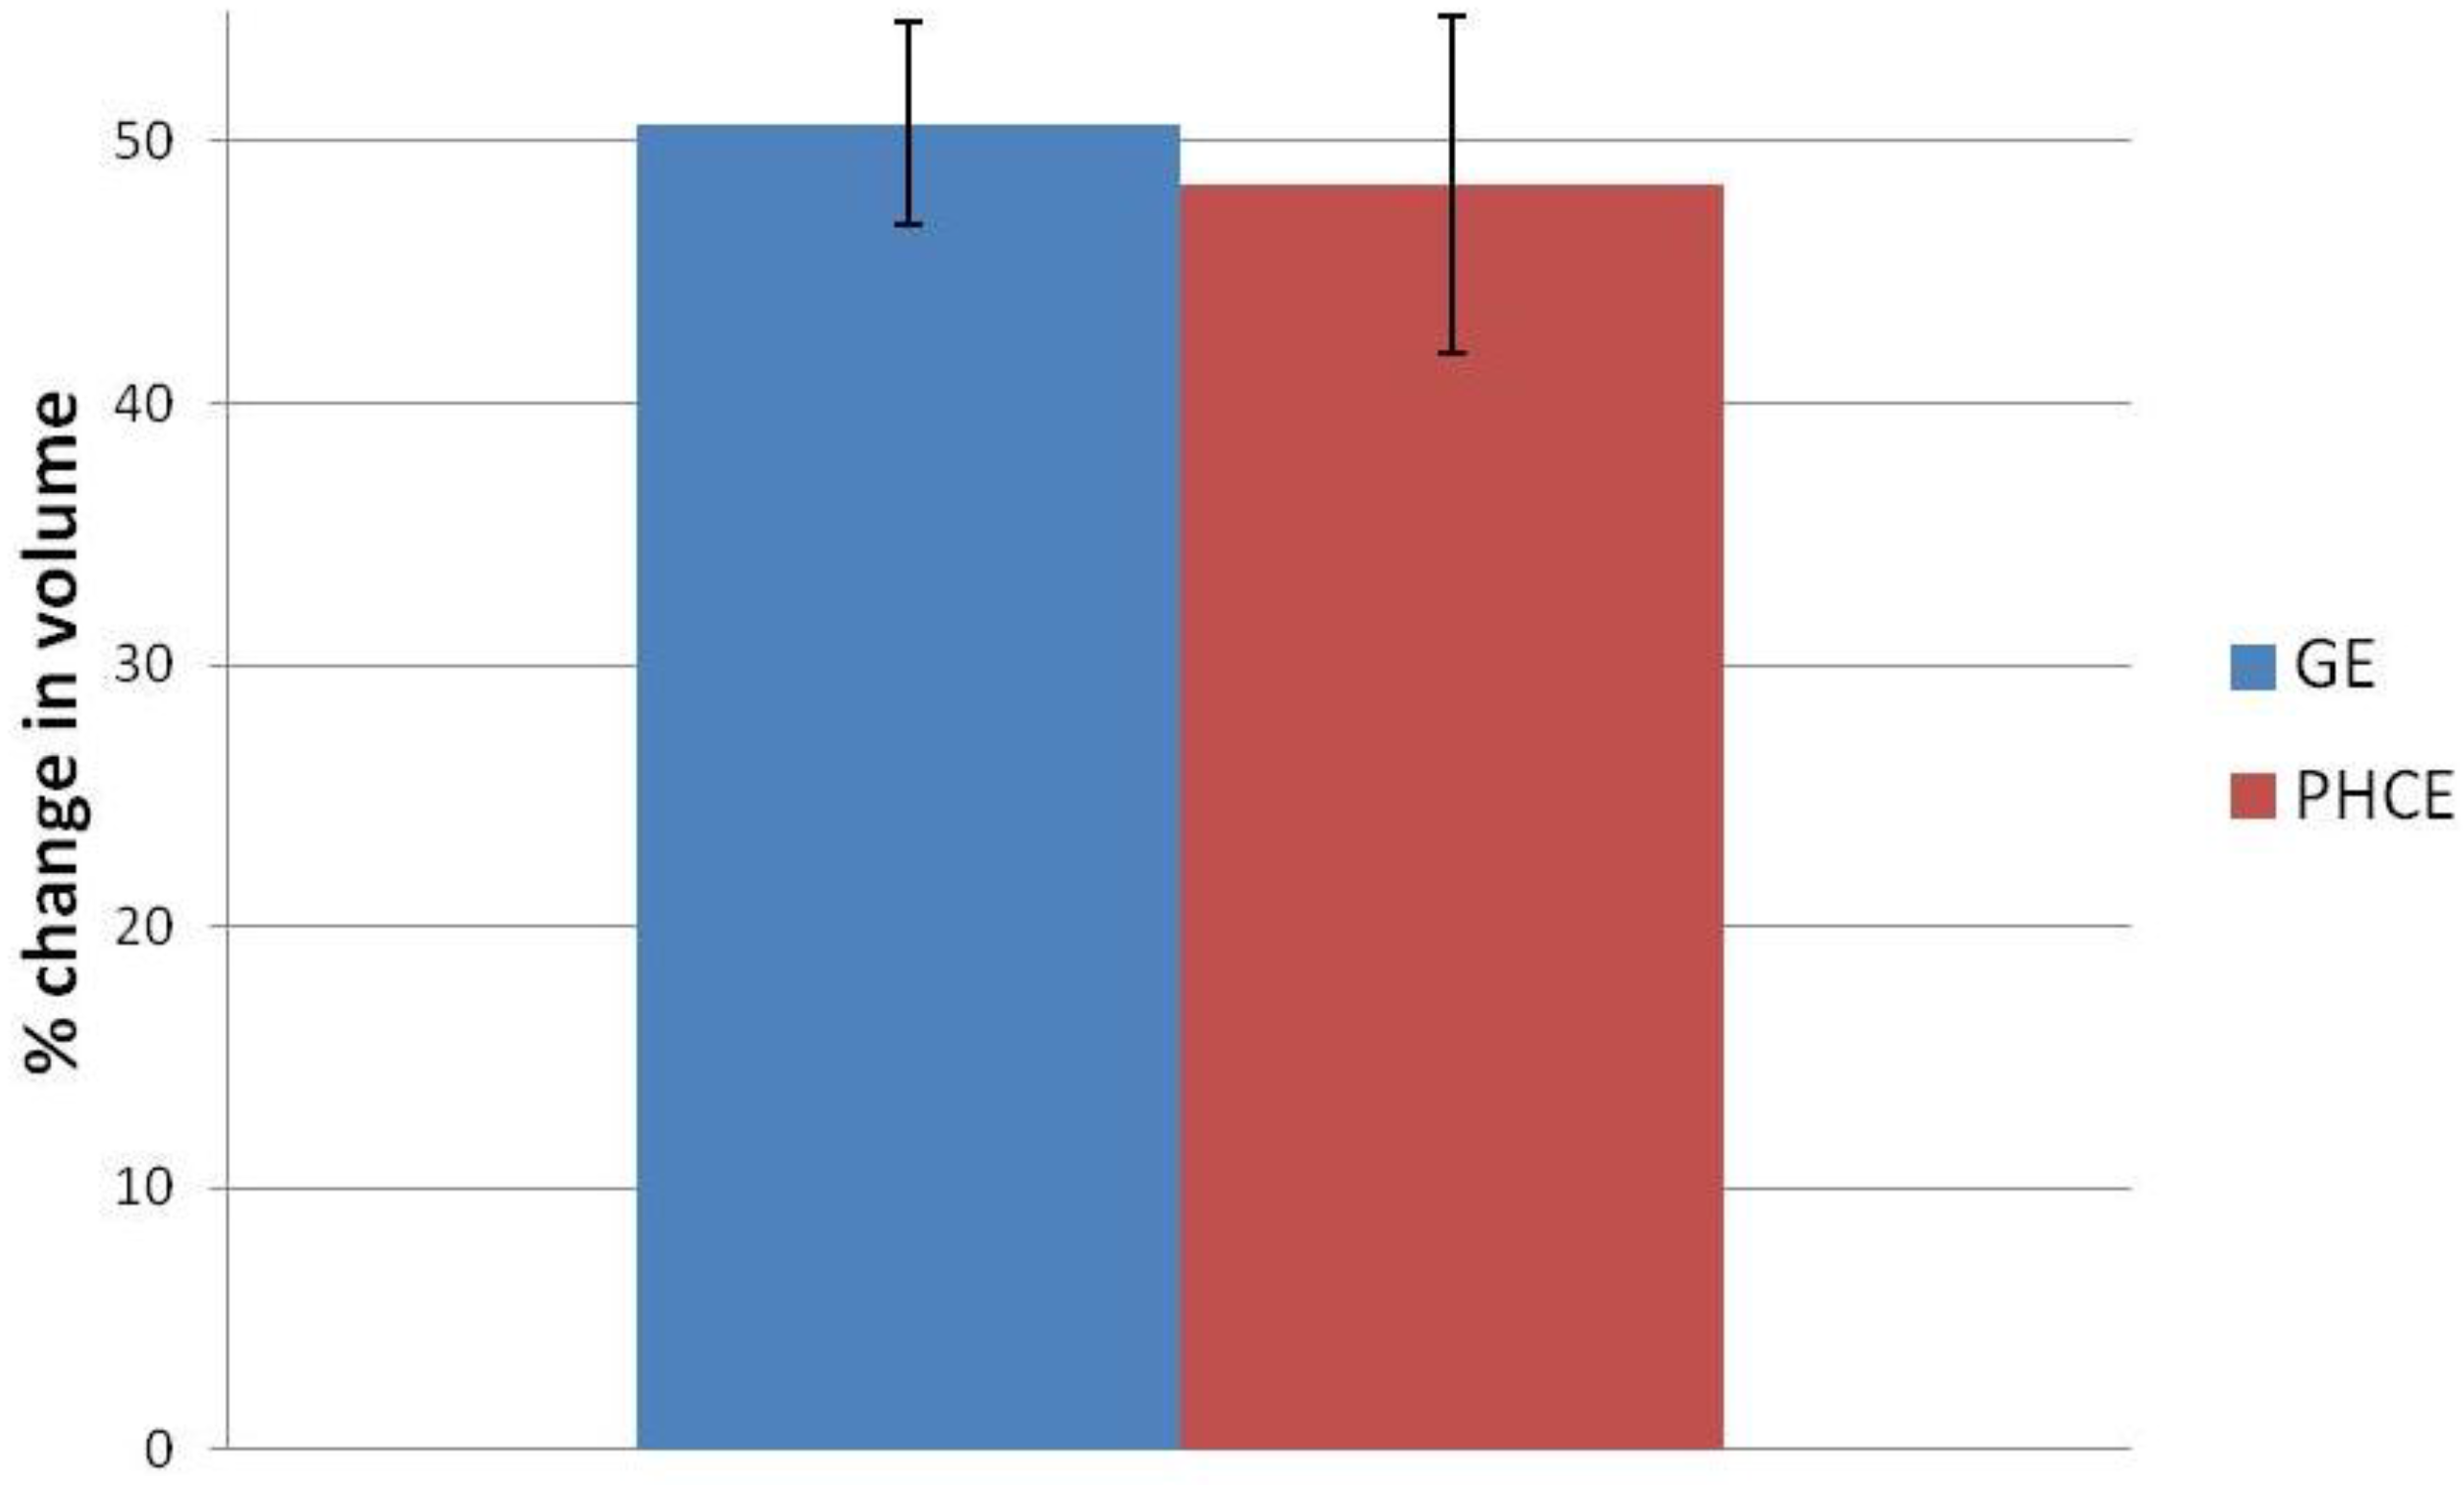
Figure 1. Swelling percentage of gelatin+EDC (GE) and PRGF+HA+CW+EDC (PHCE) scaffolds upon hydration. All scaffolds swelled up to approximately 50% of their original volume with no statistical difference between compositions.
Bioengineering 01 00062 g001
Figure 2. Scanning electron microscope (SEM) images of (A) GE, (B) PHCE, (C) GE-M, and (D) PHCE-M scaffold surfaces (Scale bars at 100 µm). Non-mineralized GE sponges (A) had smaller pores and a more uniform/smooth surface compared to PHCE sponges (B) which exhibited larger pores and a coarser surface as a result of the incorporated nanofillers. GE scaffolds sparsely nucleated crystals upon mineralization (C) while PHCE scaffolds uniformly nucleated a layer of minerals on the surface (D).
Bioengineering 01 00062 g002

3.3. Alizarin Red S Staining

Alizarin Red S staining was performed on GE and PHCE scaffolds before and directly after mineralization (Day 0). ARS was also performed on all scaffold types after 21 days incubation in 1× PBS to asses any potential loss of mineral content as a result of scaffold degradation (Figure 3). Results indicate a significant increase (p < 0.05) in mineral content between GE and PHCE scaffolds. This was expected since HA was incorporated into the PHCE scaffolds and not within GE scaffolds. The ARS assay was not sensitive enough to detect statistical differences between mineralized and non-mineralized scaffolds. There were no significant differences (p < 0.05) in absorbance values between all scaffolds at day 21. In fact, all day 21 absorbance values (with the exception of GE-M) were significantly lower (p < 0.05) than day 0 values for the same scaffold type. This suggests that some minerals are being released as the scaffold degrades. It is unclear as to why the GE scaffolds had lower values at day 21 when compared to day 0. It was noticed that ARS bound to GE scaffolds to some degree and is possible that this baseline affinity binding was decreased as the scaffold degraded.
Figure 3. Alizarin Red S (ARS) staining of GE and PHCE scaffolds directly before and after mineralization (Day 0) and of all scaffolds after 21 days incubation in 1× PBS. PHCE sponges reported a significantly higher initial mineral content than control GE sponges.
Bioengineering 01 00062 g003

3.4. Scaffold Protein Release

In this study, the Pierce BCA assay was used to quantify amounts of general protein released from the lyophilized composite gelatin sponges into solution. This data provides some insight into scaffold degradation in that as the scaffold degrades, it releases its protein contents.
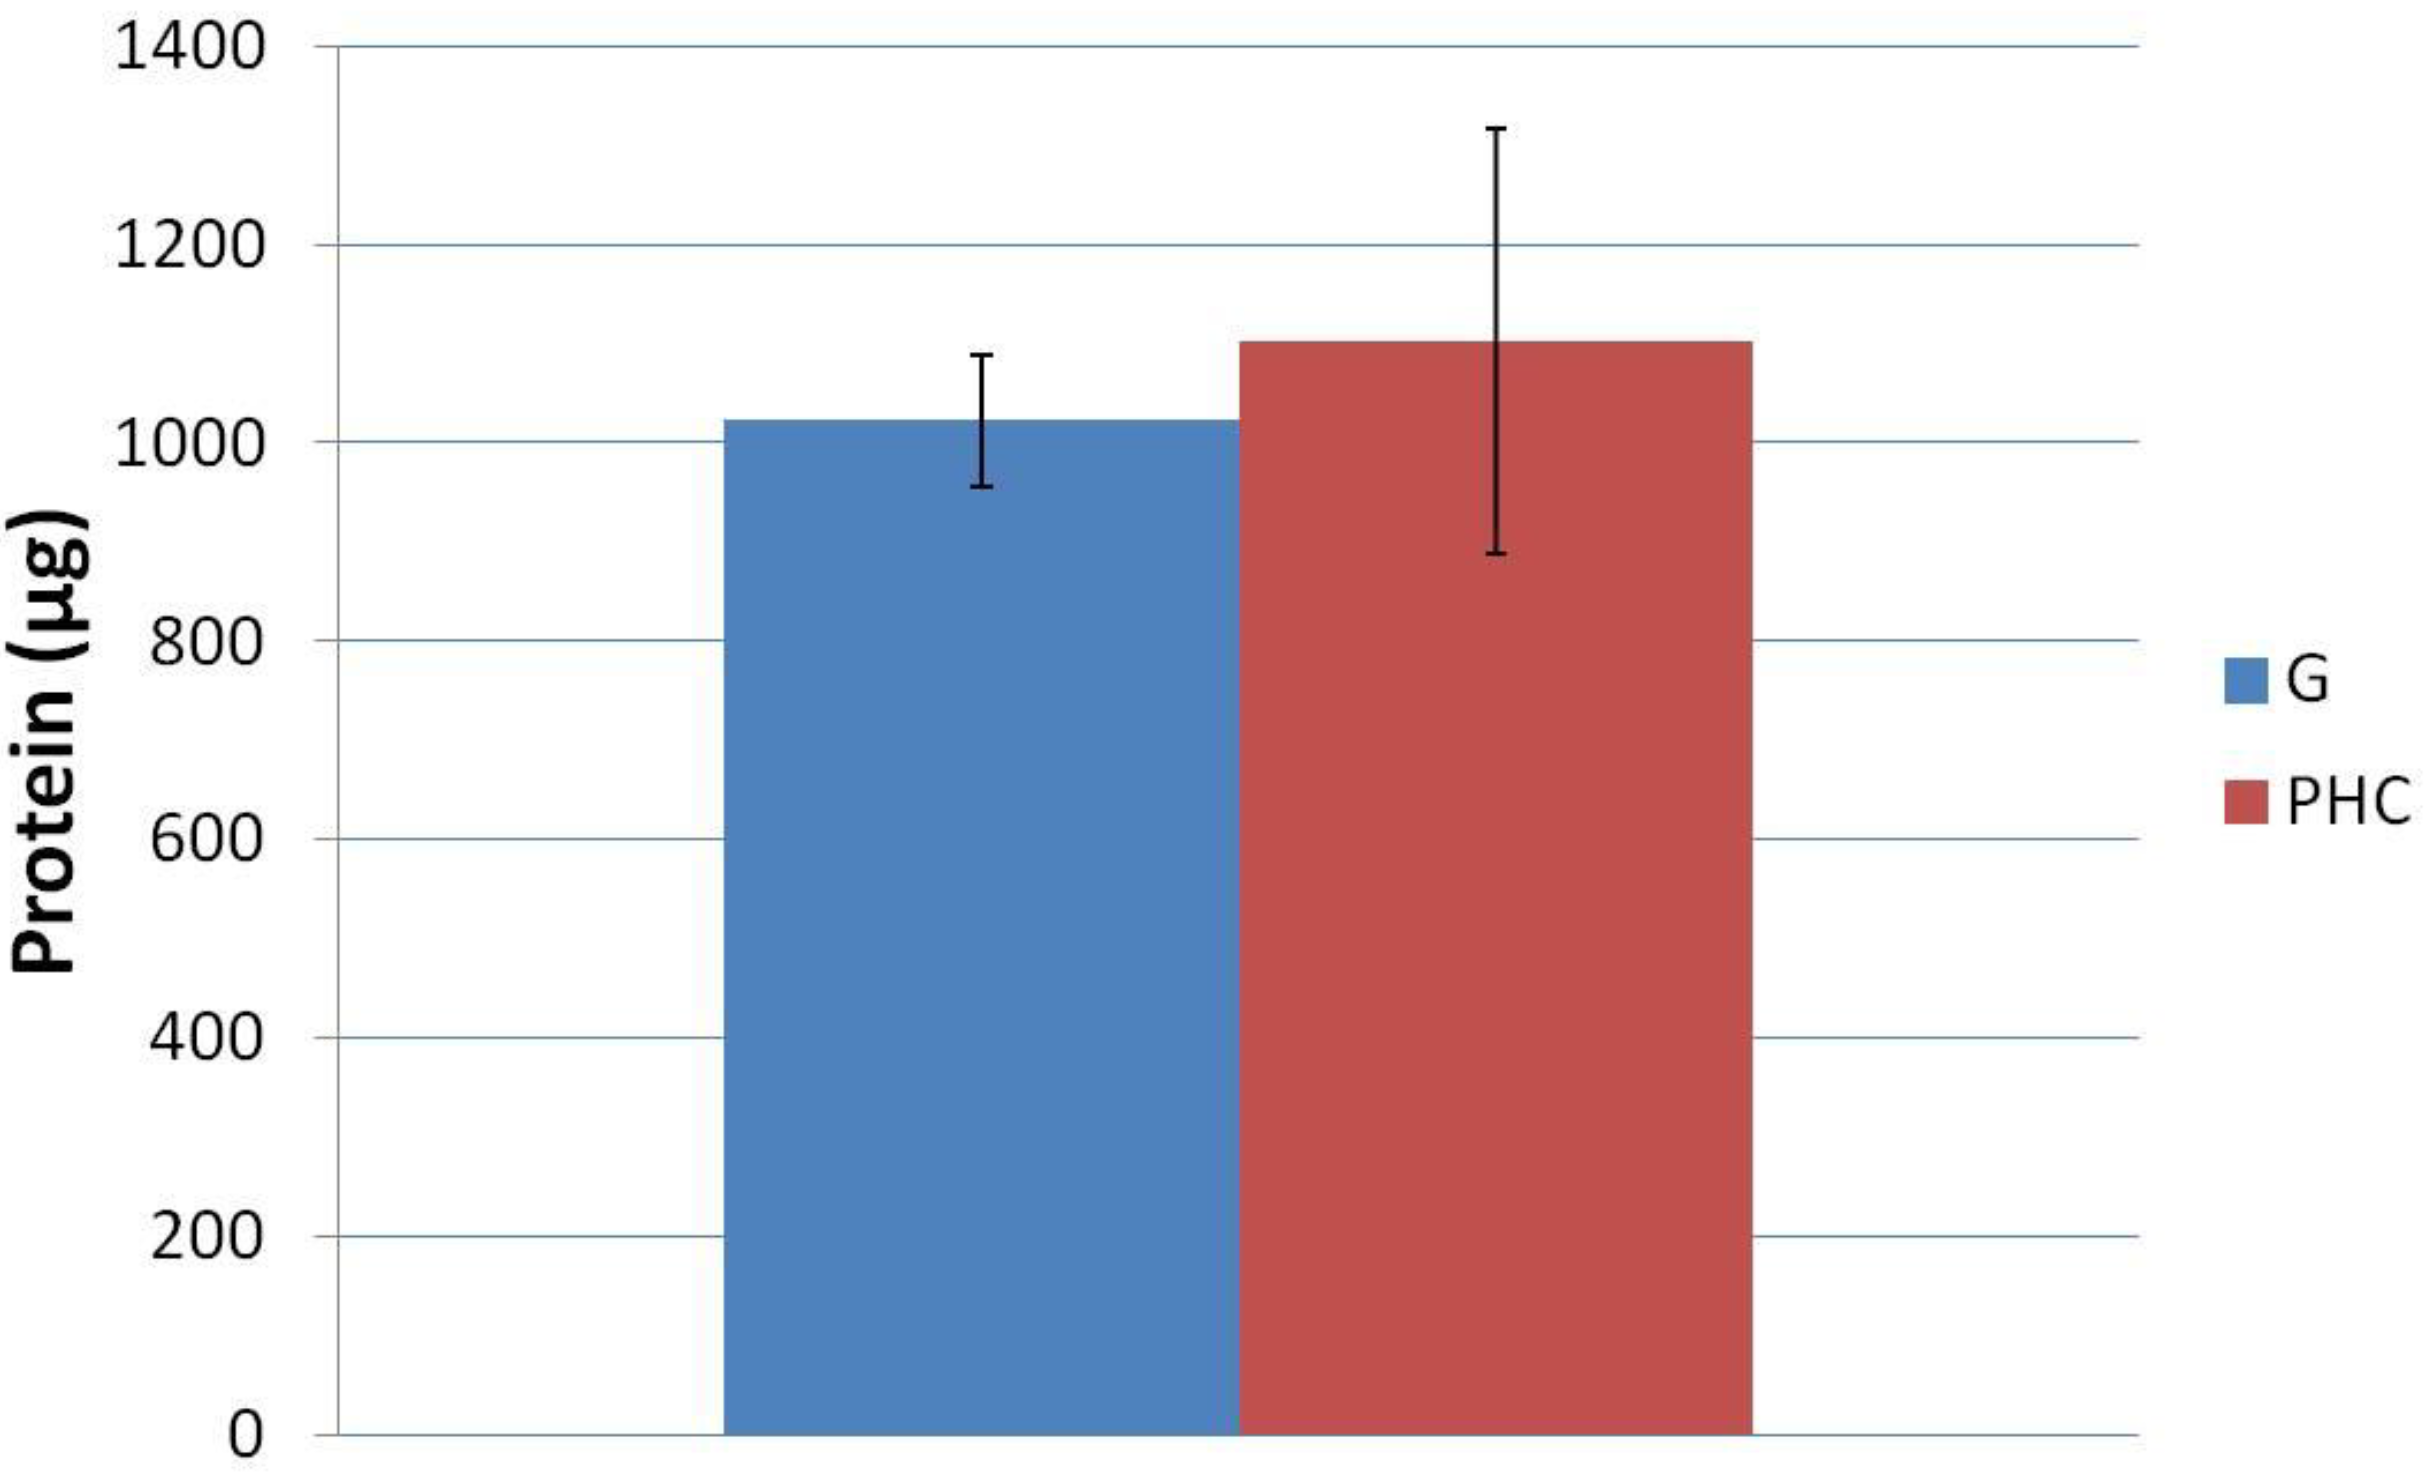
In order to understand the degree to which the scaffold is breaking down, we first must know the original total protein content of the 6 mm discs. The original total protein of each disc was quantified by allowing non-cross-linked gelatin (G) and gelatin+PRGF+HA+CW (PHC) scaffolds to fully degrade in PBS. There was no statistical difference (p < 0.05) between the average original total protein content of the G and PHC scaffolds (Figure 4). It was expected that the PRGF containing scaffolds would record higher initial protein values since it was an additive to the existing gelatin solution. However, the small amounts of PRGF added (3.33 mg/mL) may not be enough protein to record detectable differences when compared to the majority component of gelatin (30 mg/mL). It was hypothesized that if a higher concentration of PRGF was added to the scaffolds, then a detectable increase in protein content would be observed.
Figure 4. Original total protein content of non-cross-linked scaffolds. All scaffolds reported statistically similar values or original protein incorporation.
Bioengineering 01 00062 g004
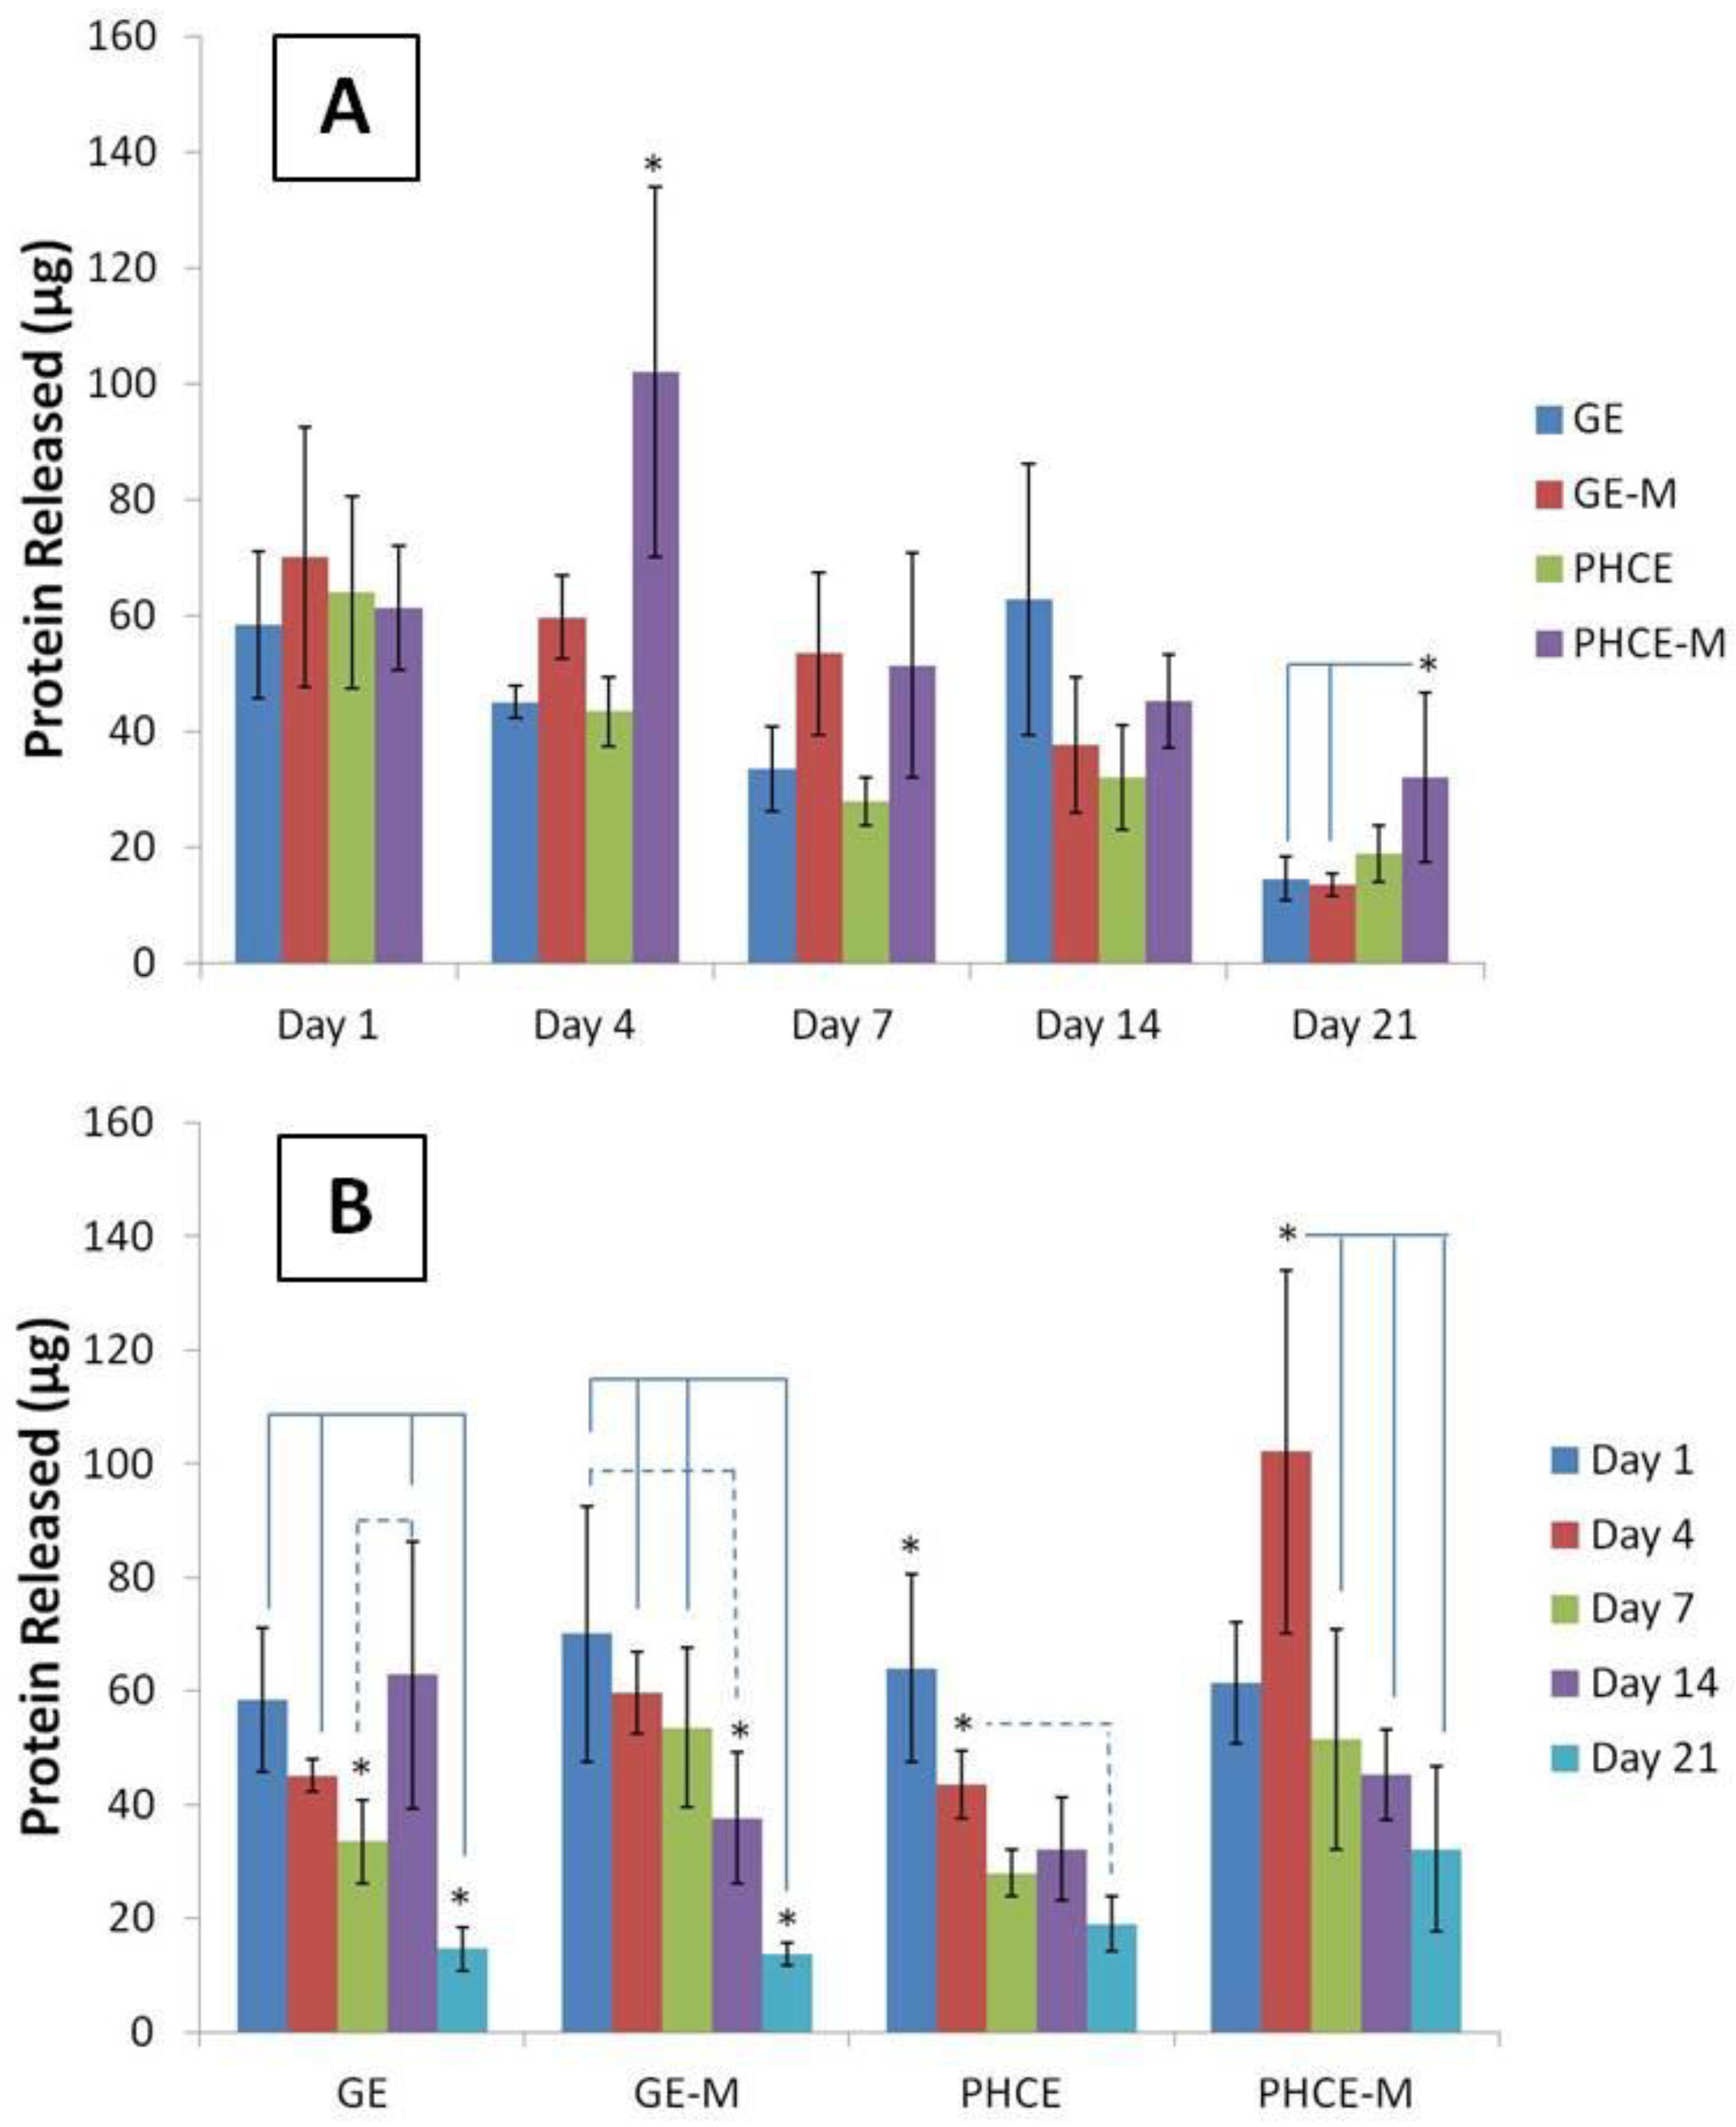
Knowing that the G and PHC scaffolds contain the same amount of total protein, we can now directly compare GE, GE-M, PHCE, and PHCE-M release kinetics over 21 days without standardization. Figure 5(A) displays scaffold protein release quantification over 21 days such that a comparison can be made between which scaffolds released the most protein per time point. Interestingly, all scaffold types released similar amounts of protein (no significant difference, p < 0.05) on days 1, 7, and 14. On the other hand, PHCE-M scaffolds released significantly more protein (p < 0.05) on days 4 and 21 when compared to GE, GE-M, PHCE and GE, GE-M scaffolds, respectively. This data suggests that PHCE-M scaffolds were degrading and releasing their contents at a faster rate than all other scaffolds, particularly on days 4 and 21.
Figure 5(B) contains the same data, but is displayed to examine the protein release kinetics of a given scaffold composition over 21 days incubation in PBS. For GE scaffolds, there was a significant decrease (p < 0.05) in release on day 21 when compared to days 1, 4, and 14. However, a significant increase (p < 0.05) in release was observed between days 7 and 14. GE-M scaffolds exhibited a similar significant decrease (p < 0.05) in release on day 21 when compared to days 1, 4, and 7. Day 14 release from GE-M was also significantly lower than day 1. This suggests that most of the release of GE-M scaffolds occurs within the first 7 days. For PHCE scaffolds, day 1 release was significantly higher (p < 0.05) than all other time points. Day 4 PHCE release was also significantly higher (p < 0.05) than day 21. This data supports that there is a bulk release of PHCE scaffolds on day 1, followed by sustained release of protein at lower doses. For PHCE-M scaffolds, protein release on day 4 was significantly higher (p < 0.05) than on days 7, 14, and 21. These results suggest that for PHCE-M scaffolds, there is normal release on day 1, while day 4 releases more compared to the following time points. Overall, these results show that each scaffold has its own protein release profile which indicates that mineralization can alter the scaffold degradation.
Figure 5. Comparison of protein released (A) by scaffolds at a given time point and (B) over time, specific to each scaffold. PHCE sponges released significantly more protein on days 4 and 21 compared to all other scaffolds. Overall, protein released from all scaffolds significantly decreased by day 21 suggesting the majority of release occurs at earlier time points.
Bioengineering 01 00062 g005
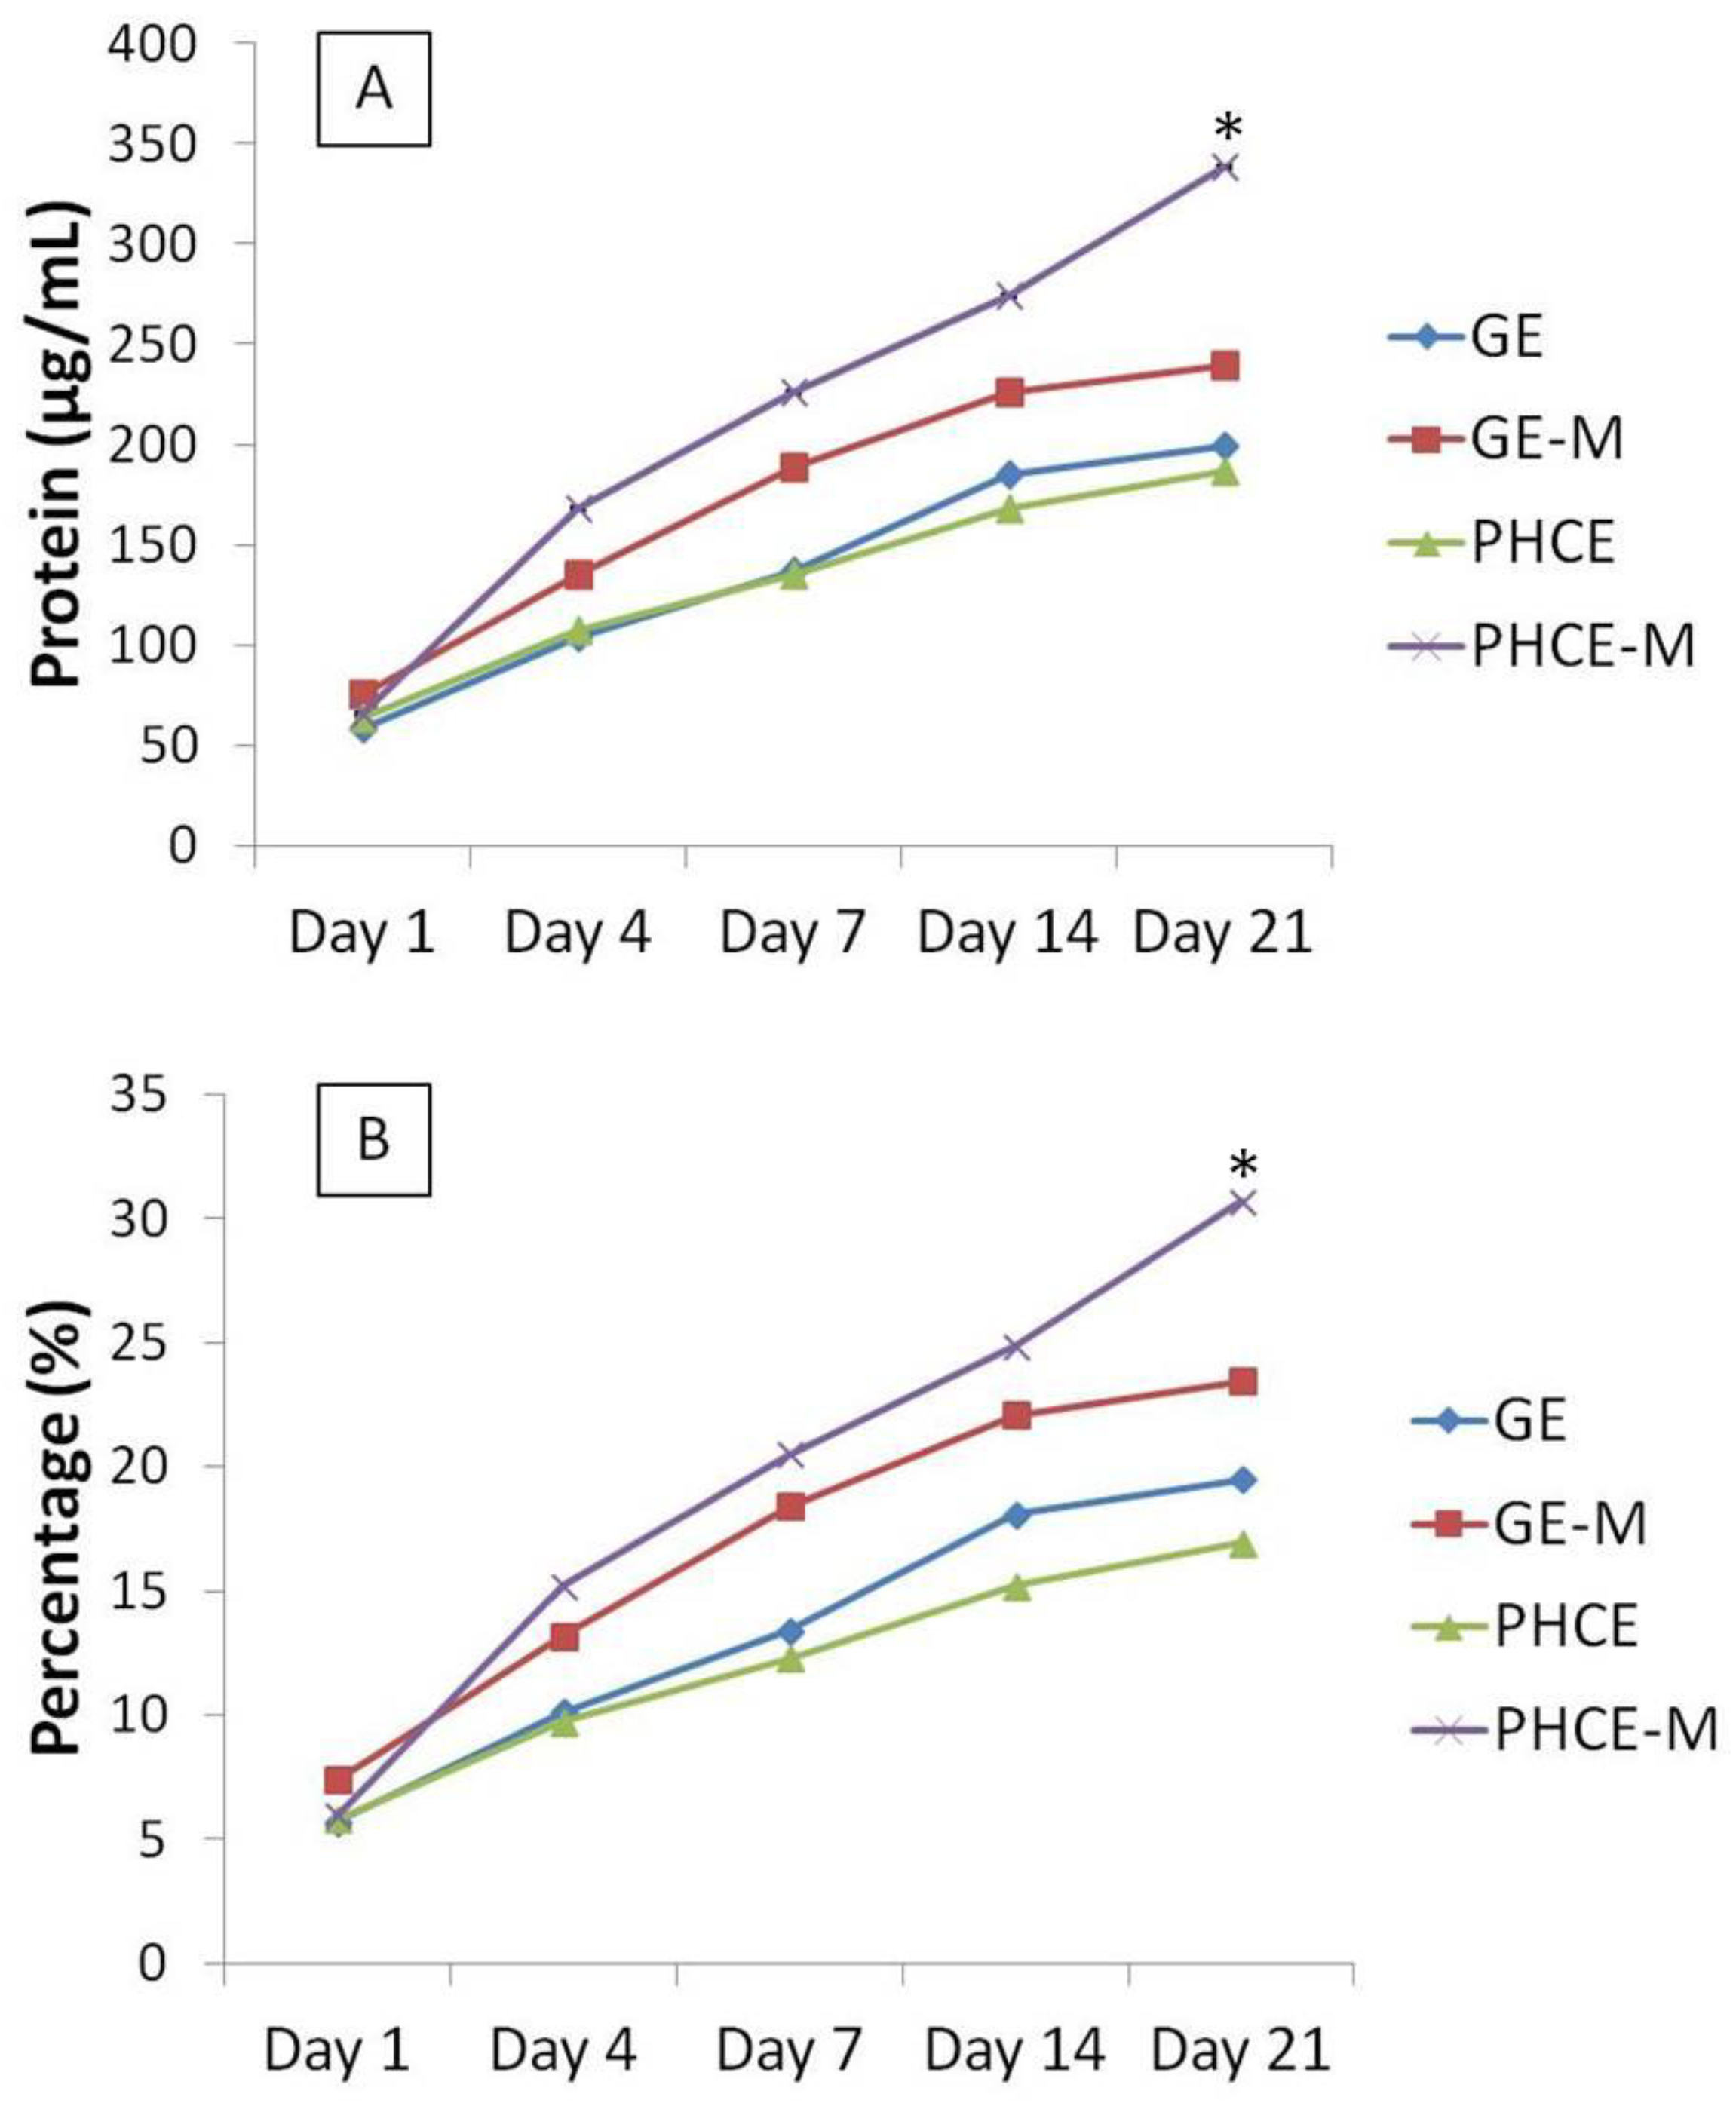
The cumulative protein release as a concentration and percent of total protein released from each scaffold was summed and graphed (Figure 6). These graphs illustrate that starting on day 4, PHCE-M releases more protein overall compared to all other scaffold types. Specifically looking at Figure 6(B), we are able to demonstrate that PHCE-M scaffolds are releasing 5% of its total protein content between days 14 and 21 while all other scaffold types are only releasing approximately 1%. This suggests that PHCE-M scaffolds are capable of sustained release of high quantities of protein even at later time points.
In order to gain a relative understanding of protein quantity released by each scaffold, day 21 cumulative released amounts were compared to non-cross-linked original total protein content to determine the percentage of protein released (Figure 6(B)). GE, GE-M, PHCE, and PHCE-M released 19.5%, 21.4%, 16.9%, 30.7%, respectively. Cumulative protein release from PHCE-M scaffolds was significantly higher (p < 0.05) than all other scaffolds. GE-M cumulative release was also significantly higher (p < 0.05) than only PHCE release. These results show that PHCE-M scaffolds are capable of 30.7% release of its incorporated protein within the first 21 days and that mineralization of PHCE scaffolds increases protein release. The increase in mineralized scaffold protein release could be attributed to the gaps that form during mineralization between the inorganic particles and the polymer matrix which can provide channels for the penetration of water [29]. Continuous elevated sustained release of protein is ideal for tissue engineering scaffolds, rendering PHCE-M scaffolds a viable candidate for tissue regeneration constructs.
Figure 6. Cumulative protein release measured as (A) concentration and (B) percent of total protein from scaffolds over 21 days. PHCE-M sponges released the most protein from day 14 to 21. The continuous release of more protein by PHCE-M scaffolds resulted in a significantly higher percentage of total released contents (30.7%).
Bioengineering 01 00062 g006

3.5. Growth Factor Analysis

The previous generic protein release studies were conducted to gain an understanding of how the scaffolds degrade and release their inherent proteins. The aim of this section was to determine what specific proteins were incorporated within the scaffolds and subsequently present in the releasate. First, understanding which growth factors are present in liquid PRP and PRGF (lyophilized PRP) are important when analyzing cellular responses to scaffolds. Although platelet poor plasma (PPP) was not used in this study, a growth factor analysis of PPP was performed to understand the composition and difference between PRP and PPP. In this study, a PRGF, PRP, and PPP growth factor profile curve was obtained from dilutions of pure PRGF (100, 50, 10, 1, and 0.1 mg/mL), PRP (1:10 and 1:20), and PPP (1:10 and 1:20) in DI water. Although these profiles do not encompass all growth factors present in PRGF, PRP, and PPP, it does provide an analysis of the several key factors (
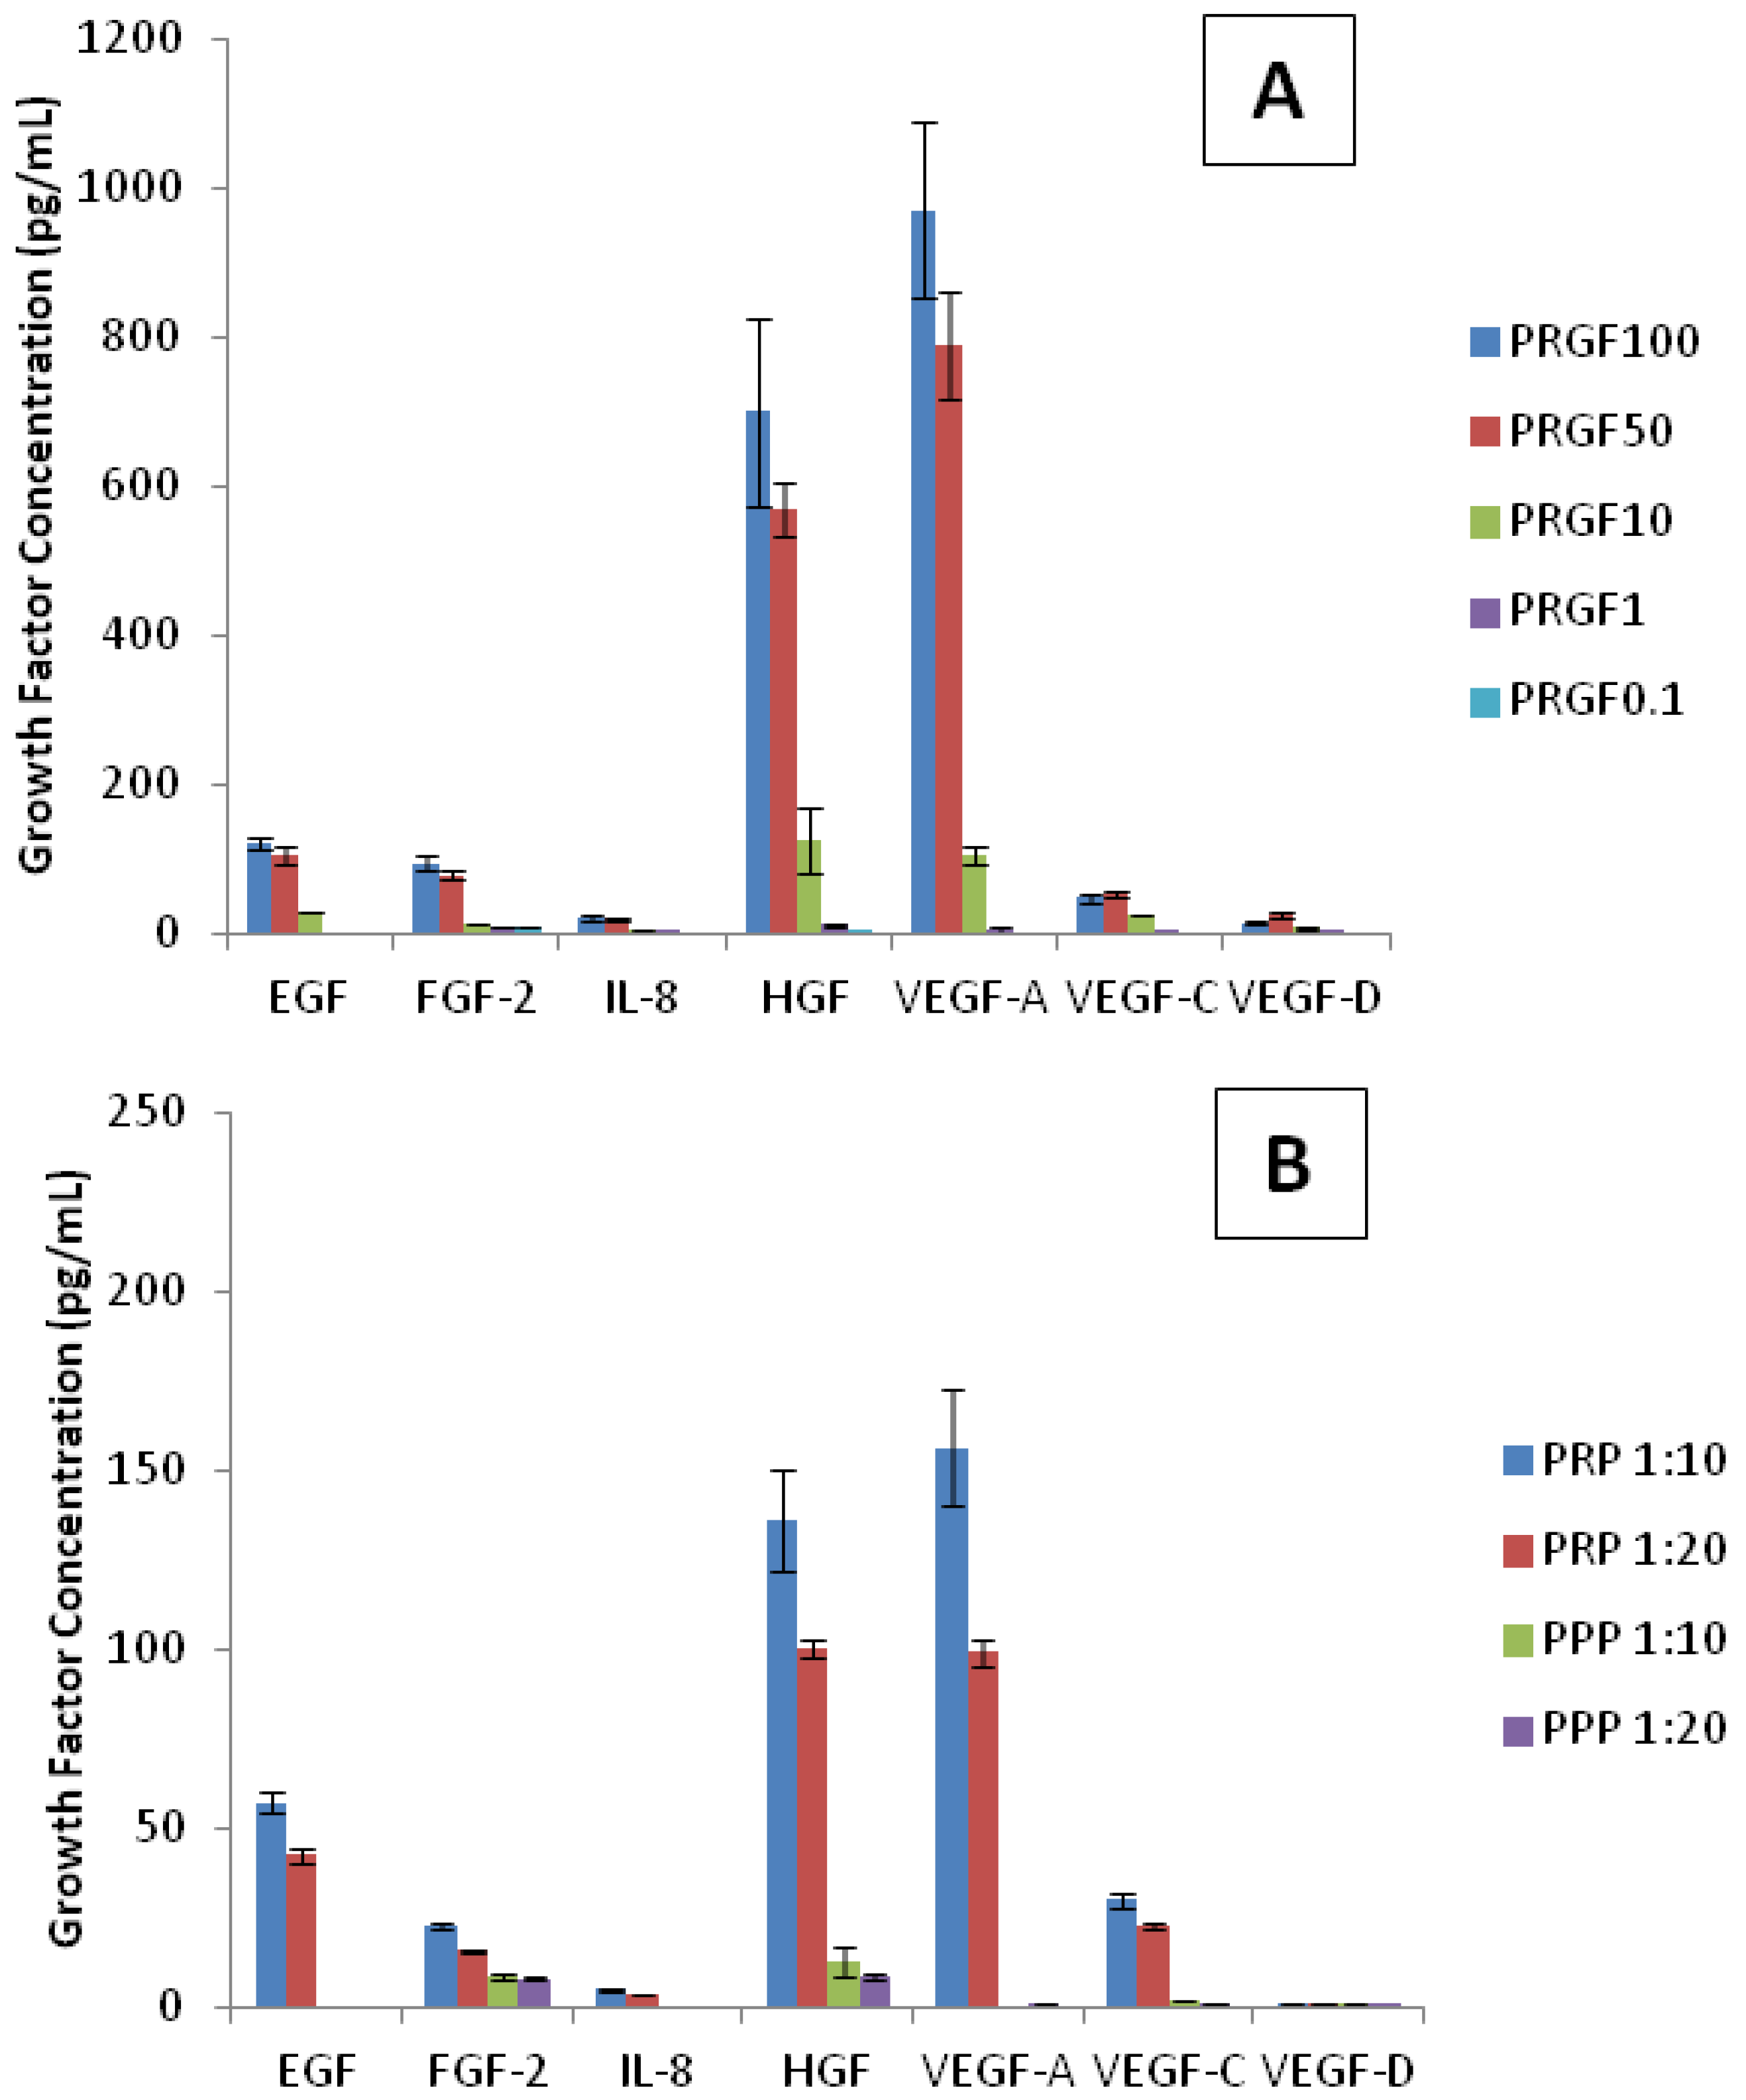
Figure 7). Of the analytes used, only two growth factors (G-CSF and FGF-1) were not detected and therefore not present in PRGF, PRP, or PPP. The highest concentrations of growth factors detected in PRGF and PRP were HGF and VEGF-A. Lower amounts of EGF, FGF-2, and VEGF-C were also present. IL-8 and VEGF-D were detected at even lower concentrations. As expected, the dilutions of PRGF and PRP resulted in low recorded values for all growth factors. However, PRGF (100 and 50 mg/mL) and PRP (1:10 and 1:20) provide a strong profile of growth factors present. It was expected that PRGF and PRP report the same growth factor profile since PRGF is a lyophilized version of PRP. This demonstrates that of the factors analyzed, PRP lyophilization does not affect the growth factors present in PRGF. It was noticed that the concentrations for each growth factor within PRP (1:10 and 1:20) more closely resemble the PRGF values at 10 mg/mL dilution. Since PRP is a liquid, it is measured in volume when administered clinically and experimentally. Alternatively, PRGF is measured as a weight/volume concentration since it is a powdered substance. This analysis suggests that the concentrations of growth factors present in a 1:10 and 1:20 dilution of PRP is comparable that found in 10 mg/mL of PRGF. Table 1 presents the mean value of all growth factor concentrations within PRGF, PRP, and PPP dilutions with PRP (1:10 and 1:20) and PRGF (10 mg/mL) highlighted to show the comparison of similar growth factor concentrations. As previously mentioned, PRGF components have positive effects on angiogenesis and bone remodeling both in vivo and in vitro. PPP was not expected to contain high concentrations of growth factors since there are a low number of platelets. The analysis of PPP dilutions revealed the low presence of FGF-2, HGF, VEGF-A, VEGF-C, and VEGF-D. The growth factor profile of PPP (1:10) more closely resembles that of PRGF (1 and 0.1 mg/mL), both highly diluted solutions. The PPP growth factor analysis profile is also presented in Table 1.
Table 1. Average growth factor concentration (pg/mL) in preparations rich in growth factors (PRGF), platelet-rich plasma (PRP), and platelet-poor plasma (PPP) dilutions. The average of the lowest standard is presented as the minimum level of detection (Min Detection). 6 mm PHC discs reported traces of epidermal growth factor (EGF). All other factors were present in low undetectable concentrations.
EGFFGF-2IL-8HGFVEGF-AVEGF-CVEGF-D
PRGF100121.093.620.5700.2970.848.113.8
PRGF50105.378.019.3569.2789.851.925.6
PRGF1028.90.03.9124.3105.625.67.2
PRGF10.00.00.00.00.00.00.0
PRGF0.10.00.00.00.00.00.00.0
PRP 1:1057.322.84.9135.8156.430.10.0
PRP 1:2042.415.73.2100.499.322.70.0
PPP 1:100.00.00.00.00.00.00.0
PPP 1:200.00.00.00.00.00.00.0
PHC13.90.00.00.00.00.00.0
Min Detection2.713.71.427.213.76.86.9
Figure 7. Growth factor analysis of (A) PRGF, (B) PRP and PPP dilutions. The highest concentrations of growth factors detected in PRGF and PRP were hepatocyte growth factor (HGF) and vascular endothelial growth factor A (VEGF-A). As expected, dilutions of PRGF and PRP recorded lower values for all growth factors.
Bioengineering 01 00062 g007
Multiplexer analysis of the uncross-linked PHC scaffolds provides the growth factor profile of the original loaded content of each scaffold. There were detectable amounts of only EGF in PHC scaffolds with a concentration ranging between PRGF 1 mg/mL and PRGF 10 mg/mL (Table 1). The reported PHC scaffold concentrations of growth factors are expected since 3.33 mg/mL PRGF was used to fabricate PHCE scaffolds. These results confirm that PRGF can successfully be incorporated within lyophilized gelatin sponges and the presence/concentrations of growth factors (specifically EGF) are maintained. Multiplexer analysis of PHCE and PHCE-M scaffold release over 21 days showed no quantifiable traces of the above growth factors. It was expected that some growth factors would be detectable as the scaffold degraded and released its contents. This absence of measurable growth factors from scaffold release could be a result of a highly diluted sample since 6 mm discs were incubated in 1 mL of PBS to assess degradation. In this instance, growth factors released from the scaffold become diluted in the high volume of PBS which may result in no detection (as evident of the dilutions of pure PRGF in Figure 7 and Table 1). It is also possible that there was not enough PRGF originally incorporated within the PHCE scaffolds such that any release is in small amounts and therefore not detected by the multiplexer. On the other hand, it could be stated that there are no detectable growth factors in the releasate because PRGF is simply not being released. This would be a result of the PRGF components being sequestered by HA since HA has the ability to bind a variety of molecules and there are equal amounts of HA and PRGF [30]. The non-release of PRGF can potentially be an added benefit in that the scaffold is able to maintain the incorporated growth factors and constantly provide a bioactive surface for cells to attach, proliferate, and remodel. Future studies are required and will focus on which of these situations is occurring with lyophilized gelatin-PRGF sponges. This will be conducted by degrading the scaffold in less solution (to remove the possibility of severe dilution) and by incorporating higher initial concentrations of PRGF.

3.6. Uniaxial Compression Testing

Uniaxial compression testing using a platen system was used to record peak load (N) and Young’s modulus (MPa) for compression of scaffolds incubated in media for up to 21 days. Day 4 of mechanical testing was not reported as the mechanical properties showed more significant changes weekly. 
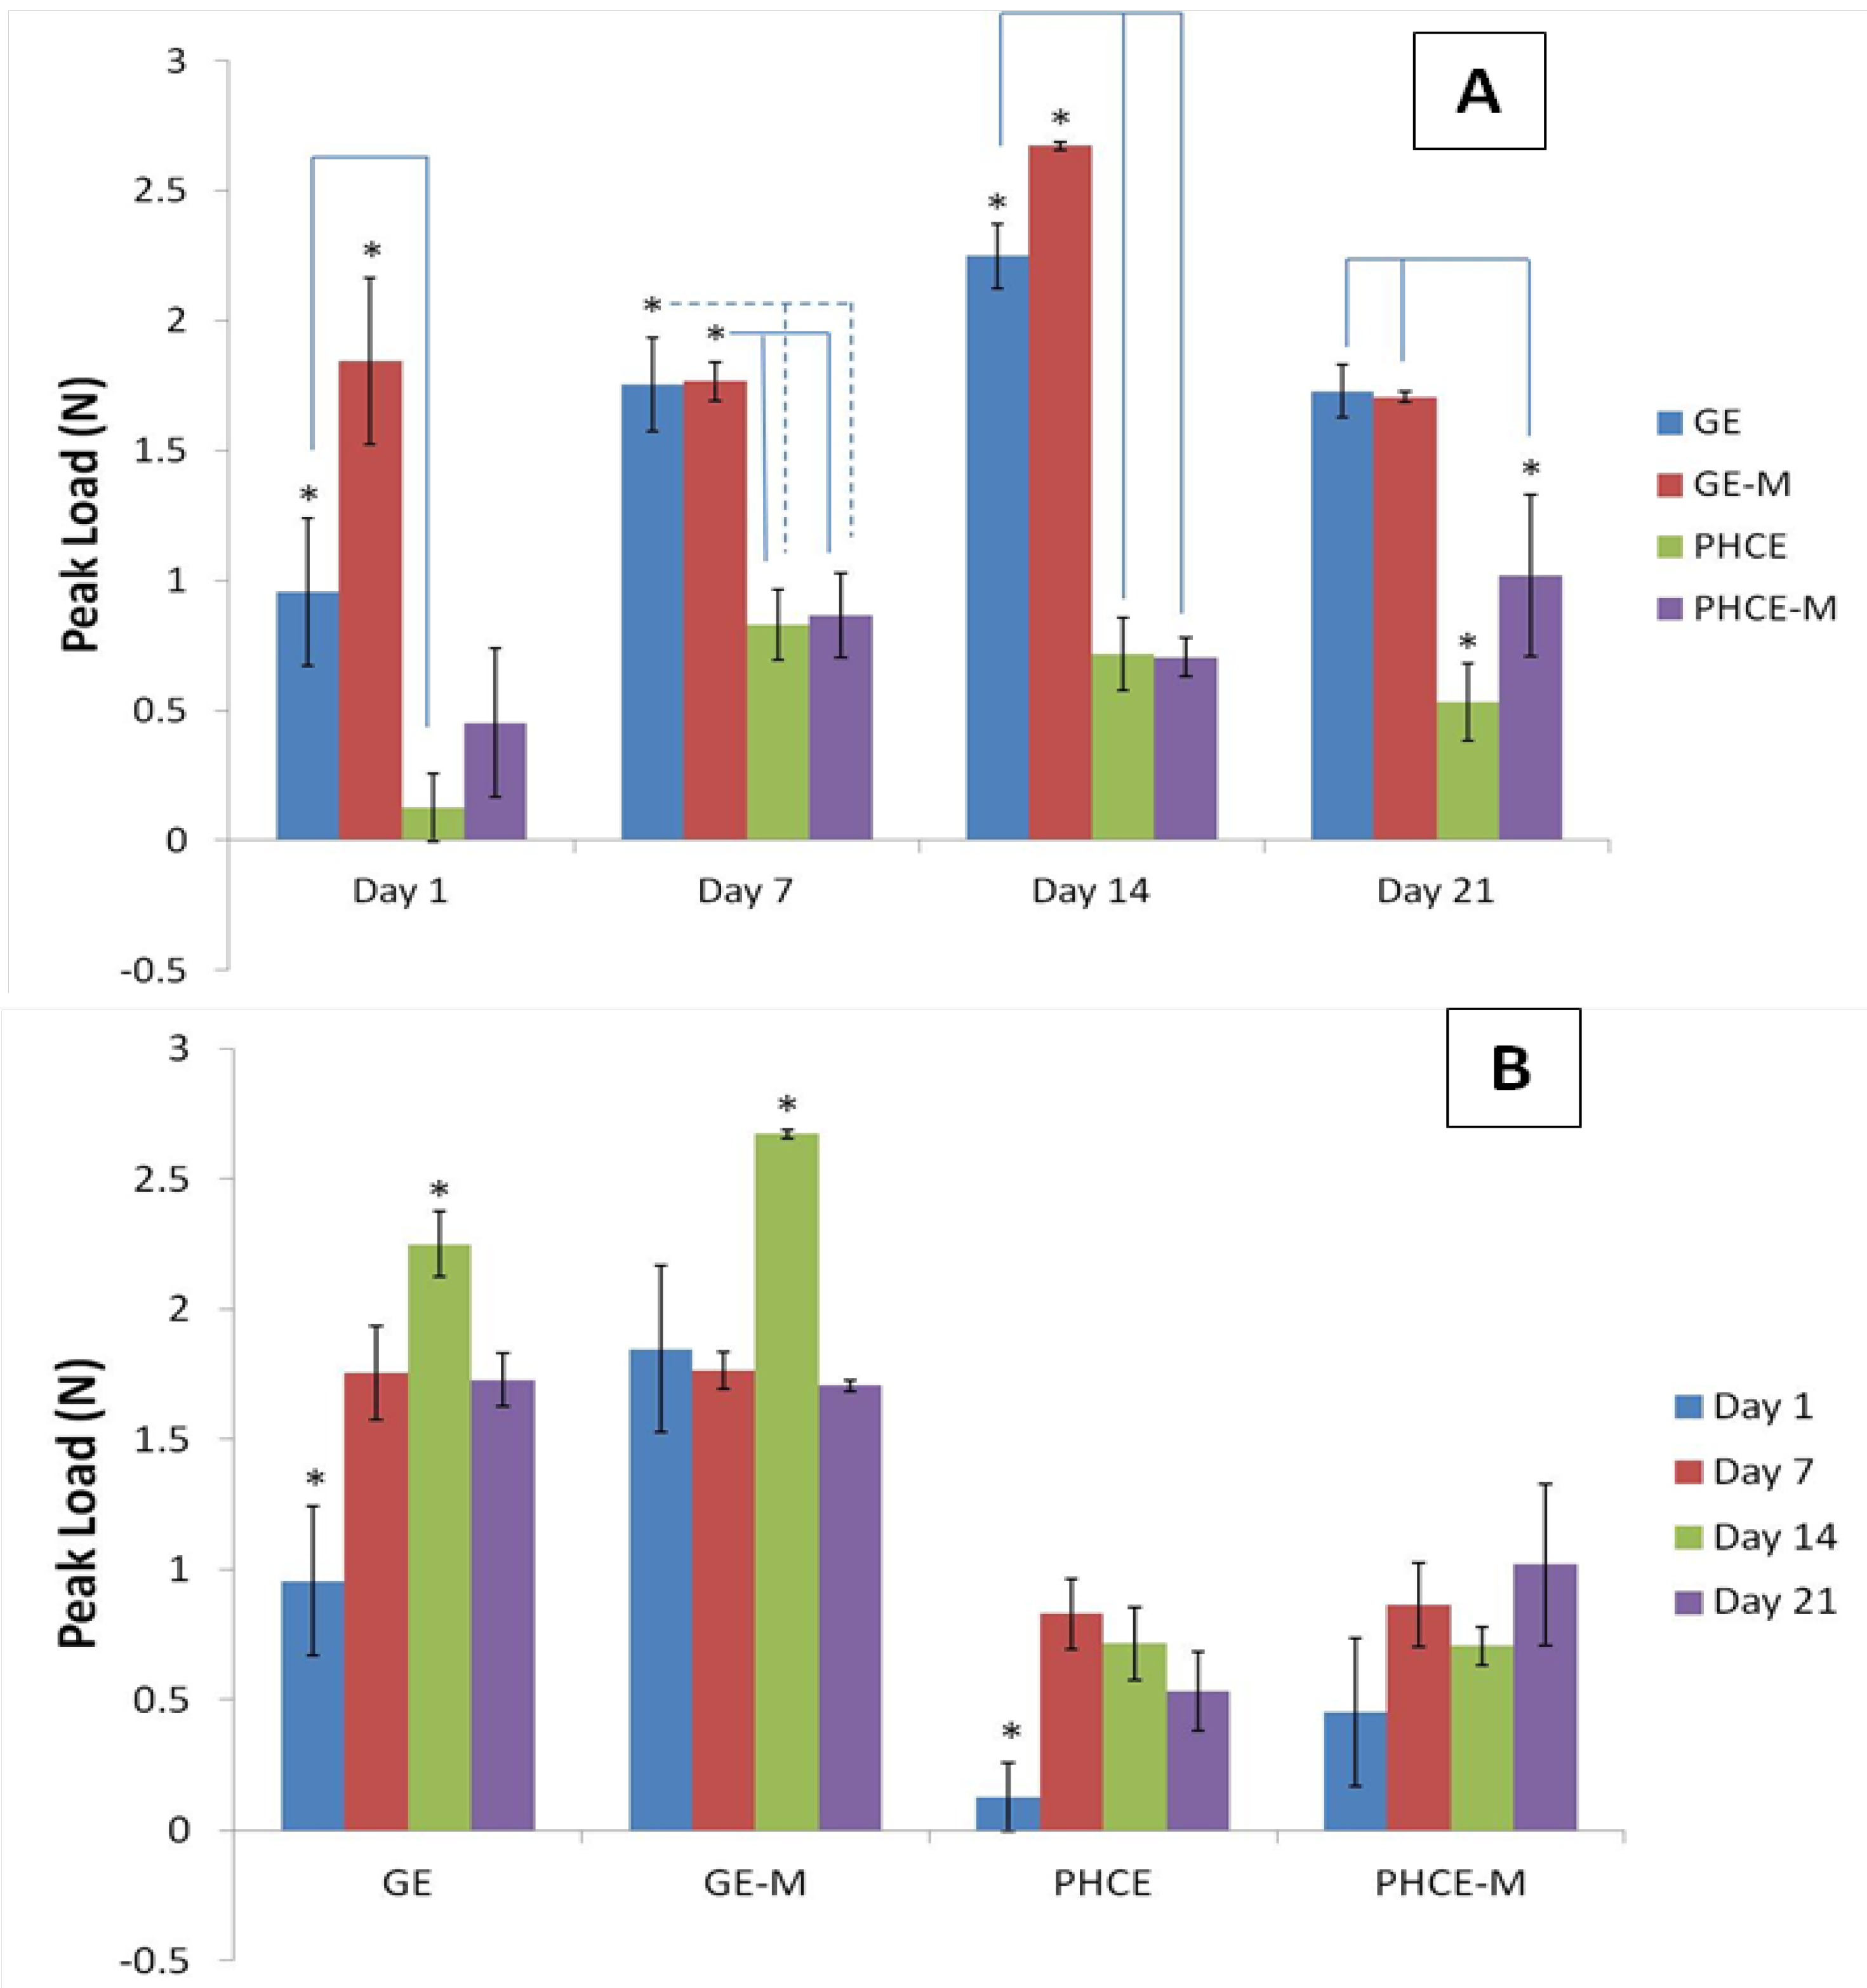
Figure 8(A) reports and analyzes the peak loads of each scaffold type at a given time point. At days 1 and 14, GE-M scaffolds exhibited significantly higher (p < 0.05) peak loads than all other scaffolds. On days 7 and 21, GE and GE-M had significantly higher (p < 0.05) peak values than PHCE and PHCE-M scaffolds. This data suggests that throughout 21 days, PHCE and PHCE-M scaffolds consistently report significantly lower (p < 0.05) peak load values (0.1–1.0 N) when compared to GE and GE-M scaffolds (1.0–2.7 N). It was expected that the sponges incorporated with nanofillers would exhibit higher mechanical properties. The authors speculate that the concentration of the added factors was too high to enhance the peak load of the sponges. Future studies are being considered where incrementing concentrations of nanofillers are added to scaffolds to determine if there is a threshold such that an access of nanofillers begins having adverse effects on mechanical properties. For the purpose of this study, the above results are acceptable and within the same magnitude of values comparable to properties found in the early stages of bone healing.
Figure 8. Peak load of scaffolds (A) at a given time point and (B) over 21 days incubation in media. Over 21 days, PHCE and PHCE-M scaffolds reported lower peak load values than mineralized and non-mineralized gelatin sponges.
Bioengineering 01 00062 g008
The same data was graphed with the axis reversed to compare peak values of a given scaffold throughout 21 days incubation (Figure 8(B)). For GE scaffolds, day 1 and day 14 produced the significantly lowest and highest (p < 0.05) values, respectively. For GE-M scaffolds, incubation for 14 days in media produced the highest (p < 0.05) peak load value compared to all other days. Day 1 for PHCE scaffolds was significantly lower (p < 0.05) than all other days while PHCE-M scaffolds showed no significant changes (p < 0.05) in peak load throughout 21 days. With the exception of PHCE-M scaffolds, this data shows that scaffolds have lower peak loads at earlier time points (days 1 and 7) when compared to later time points (day 14).
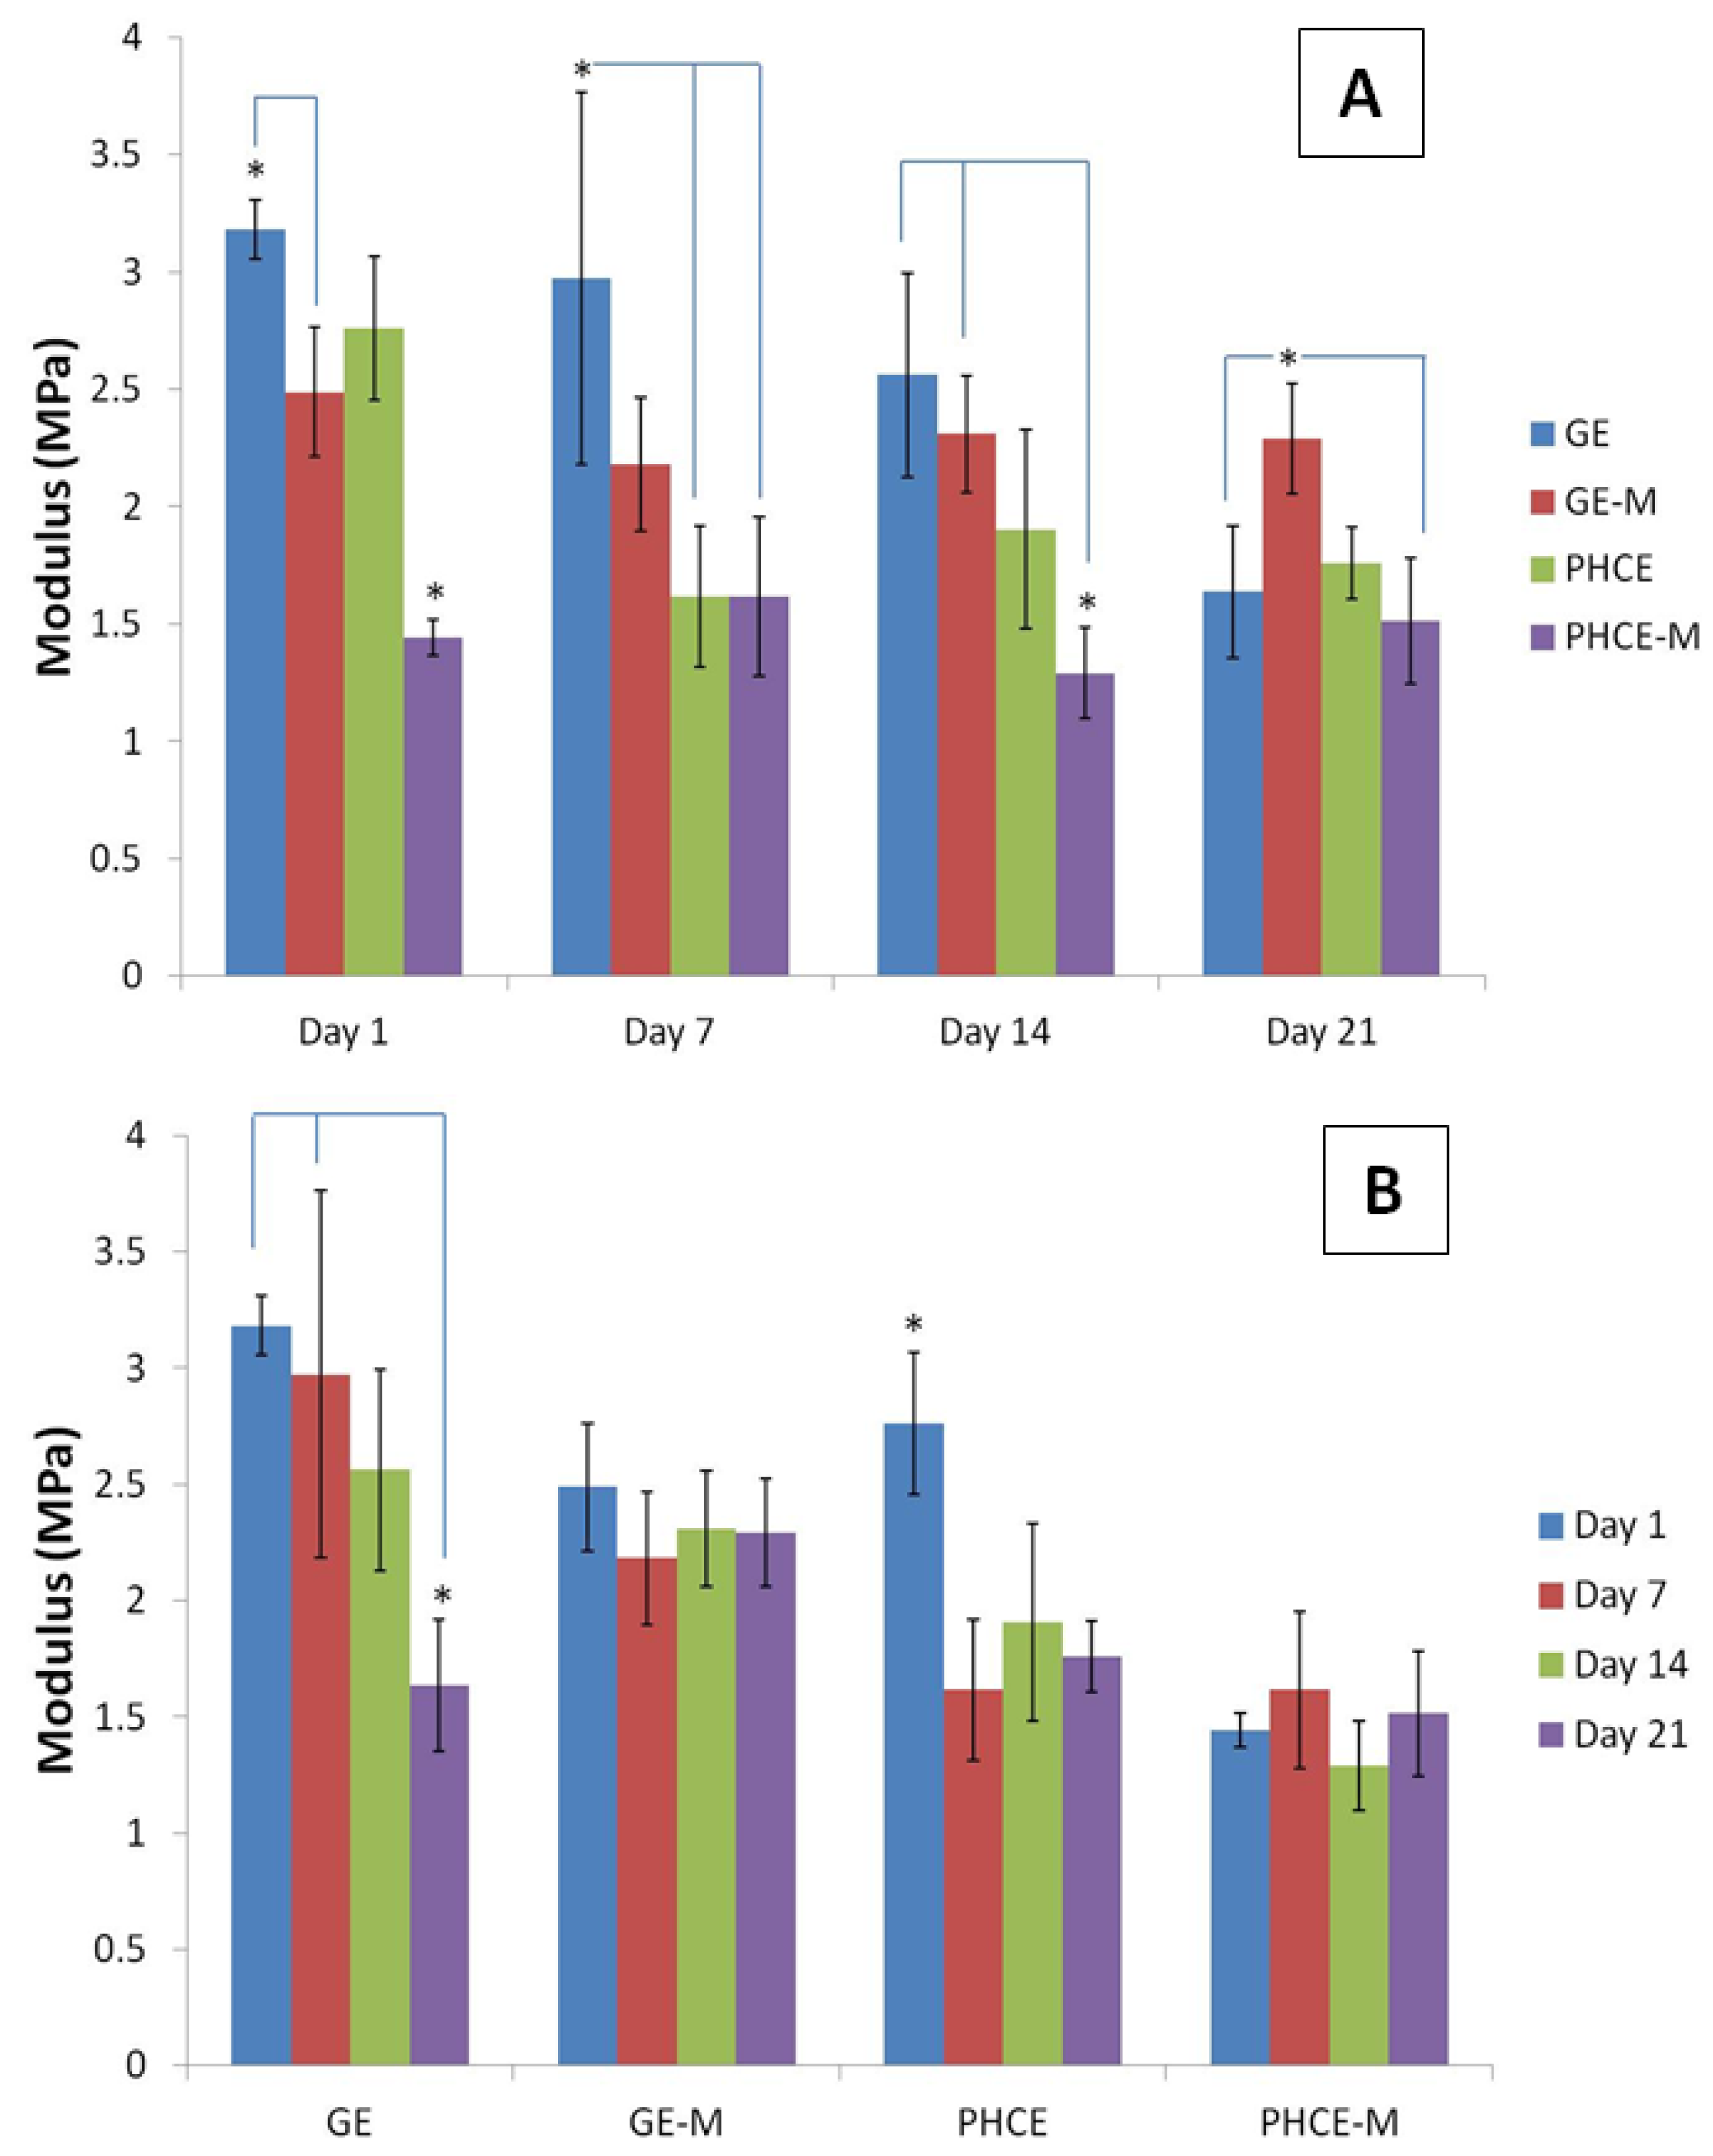
Figure 9(A) reports and analyzes the compressive modulus of each scaffold type at a given time point. After 1 day incubation, PHCE-M scaffolds had a significantly lower (p < 0.05) modulus than all other scaffold types. In fact, GE scaffolds had significantly higher (p < 0.05) values than GE-M and PHCE-M. For day 7, GE scaffolds reported a significantly higher (p < 0.05) modulus than both PHCE and PHCE-M scaffolds. After 14 days incubation, GE and GE-M scaffolds had significantly higher moduli when compared to PHCE-M scaffolds. Day 14 shows a higher modulus for GE-M scaffolds when compared to GE and PHCE-M scaffolds. Overall PHCE-M scaffolds report lower Young’s modulus values (1.3–1.6 MPa) when compared to GE and GE-M scaffolds (1.6–3.2 MPa). One aim of this study is to create a scaffold with similar mechanical properties to that of native bone healing tissue. The first stages of bone healing involve granulation tissue and hyaline cartilage (soft tissue) formation before any mineralization occurs. The Young’s modulus of cartilage in the literature is at similar low values of 0.5–0.8 MPa while mature bone and other materials are in the GPa range [31]. Zhang et al. report similar low compressive Young’s modulus values (0.3–3.0 MPa) for gelatin-hyaluronic acid composite freeze-dried sponges intended for soft tissue engineering applications [28]. The low range of modulus values of these scaffolds provide a mechanical microenvironment similar to that found in the early stages of bone healing.
Evaluating statistical differences in Young’s modulus of a given scaffold over 21 days will provide a different viewpoint on how each scaffold’s properties change over time. To achieve this, the same modulus data was graphed with the legend and x-axis switched and statistics were performed (Figure 9(B)). The modulus for GE and PHCE scaffolds significantly decreased (p < 0.05) after 21 days incubation in media while their mineralized counterparts showed no significant changes (p < 0.05) in modulus within the same time period. This suggests that mineralized scaffolds maintain their modulus throughout incubation while non-mineralized scaffolds show a decrease. It is also noticed from Figure 9(A) that the initial modulus (Day 1) of mineralized scaffolds is significantly lower (p < 0.05) than non-mineralized scaffolds. This could attribute to the decrease in modulus as seen in non-mineralized scaffolds since they start off at higher values.
Figure 9. Young’s modulus for compression of (A) scaffolds at a given time point and (B) a given scaffold over 21 days incubation in media. Overall PHCE-M scaffolds report lower Young’s modulus values when compared to GE and GE-M scaffolds.
Bioengineering 01 00062 g009

3.7. Cell Attachment and Infiltration

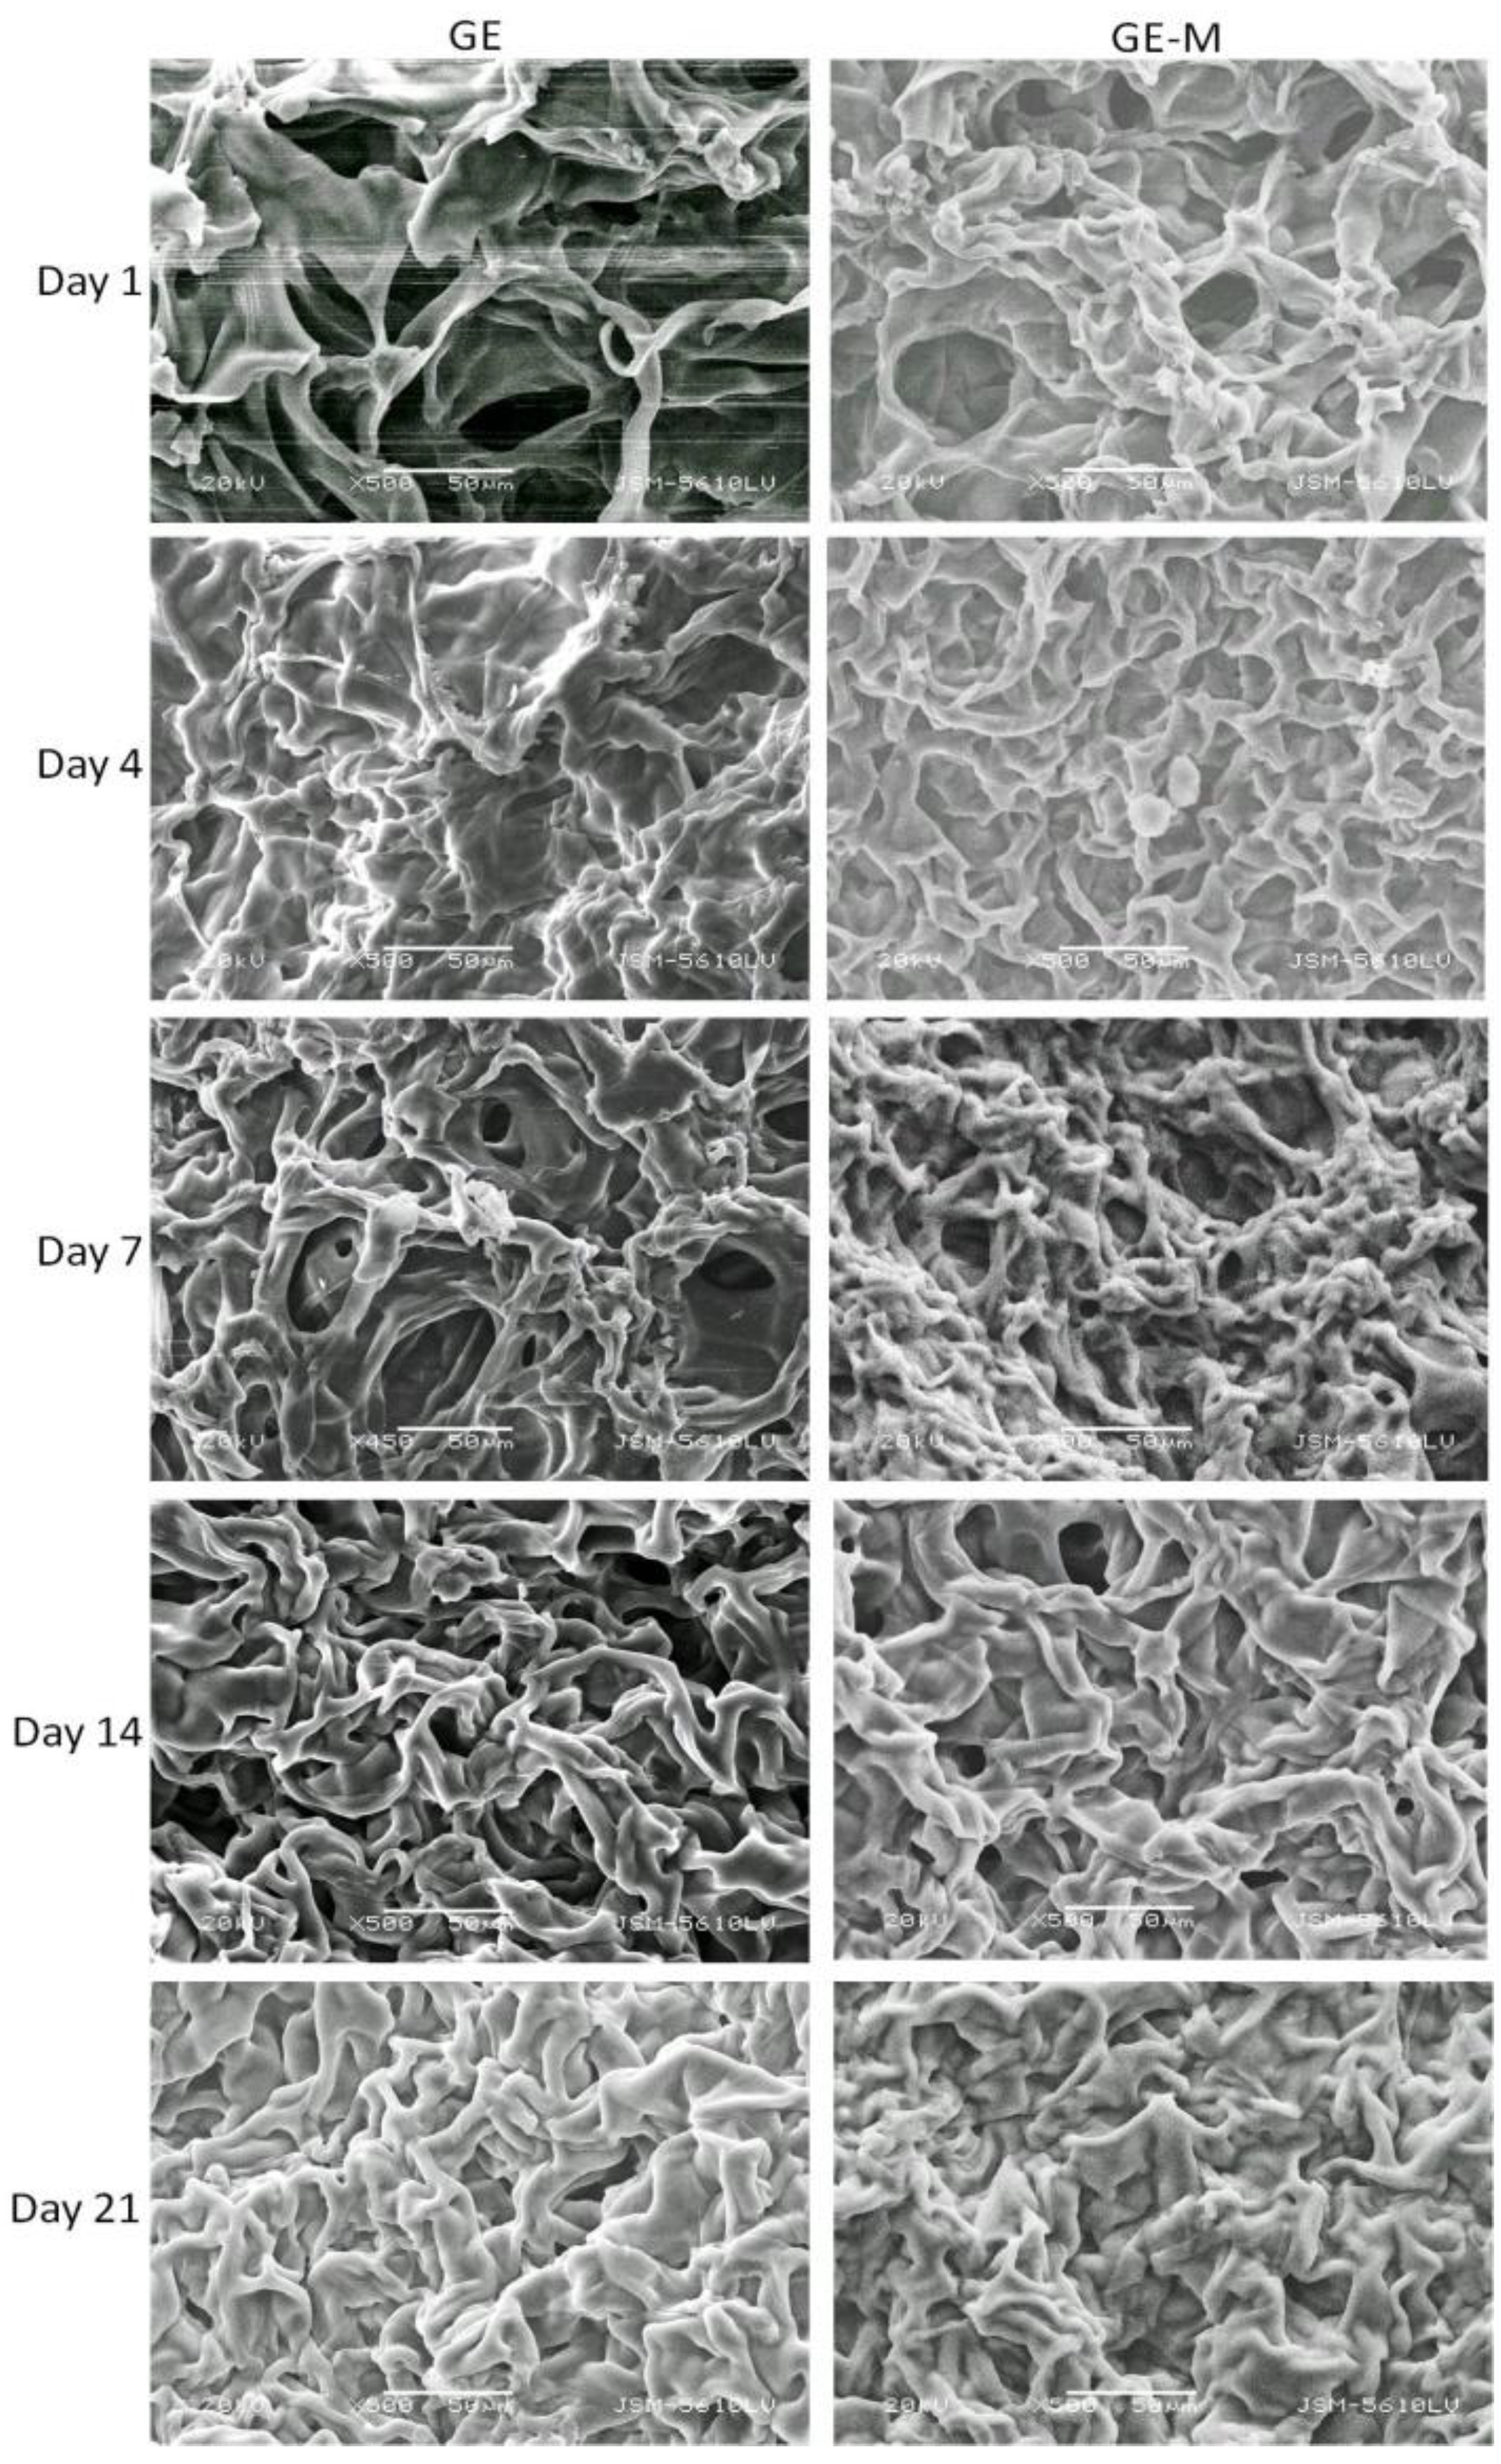
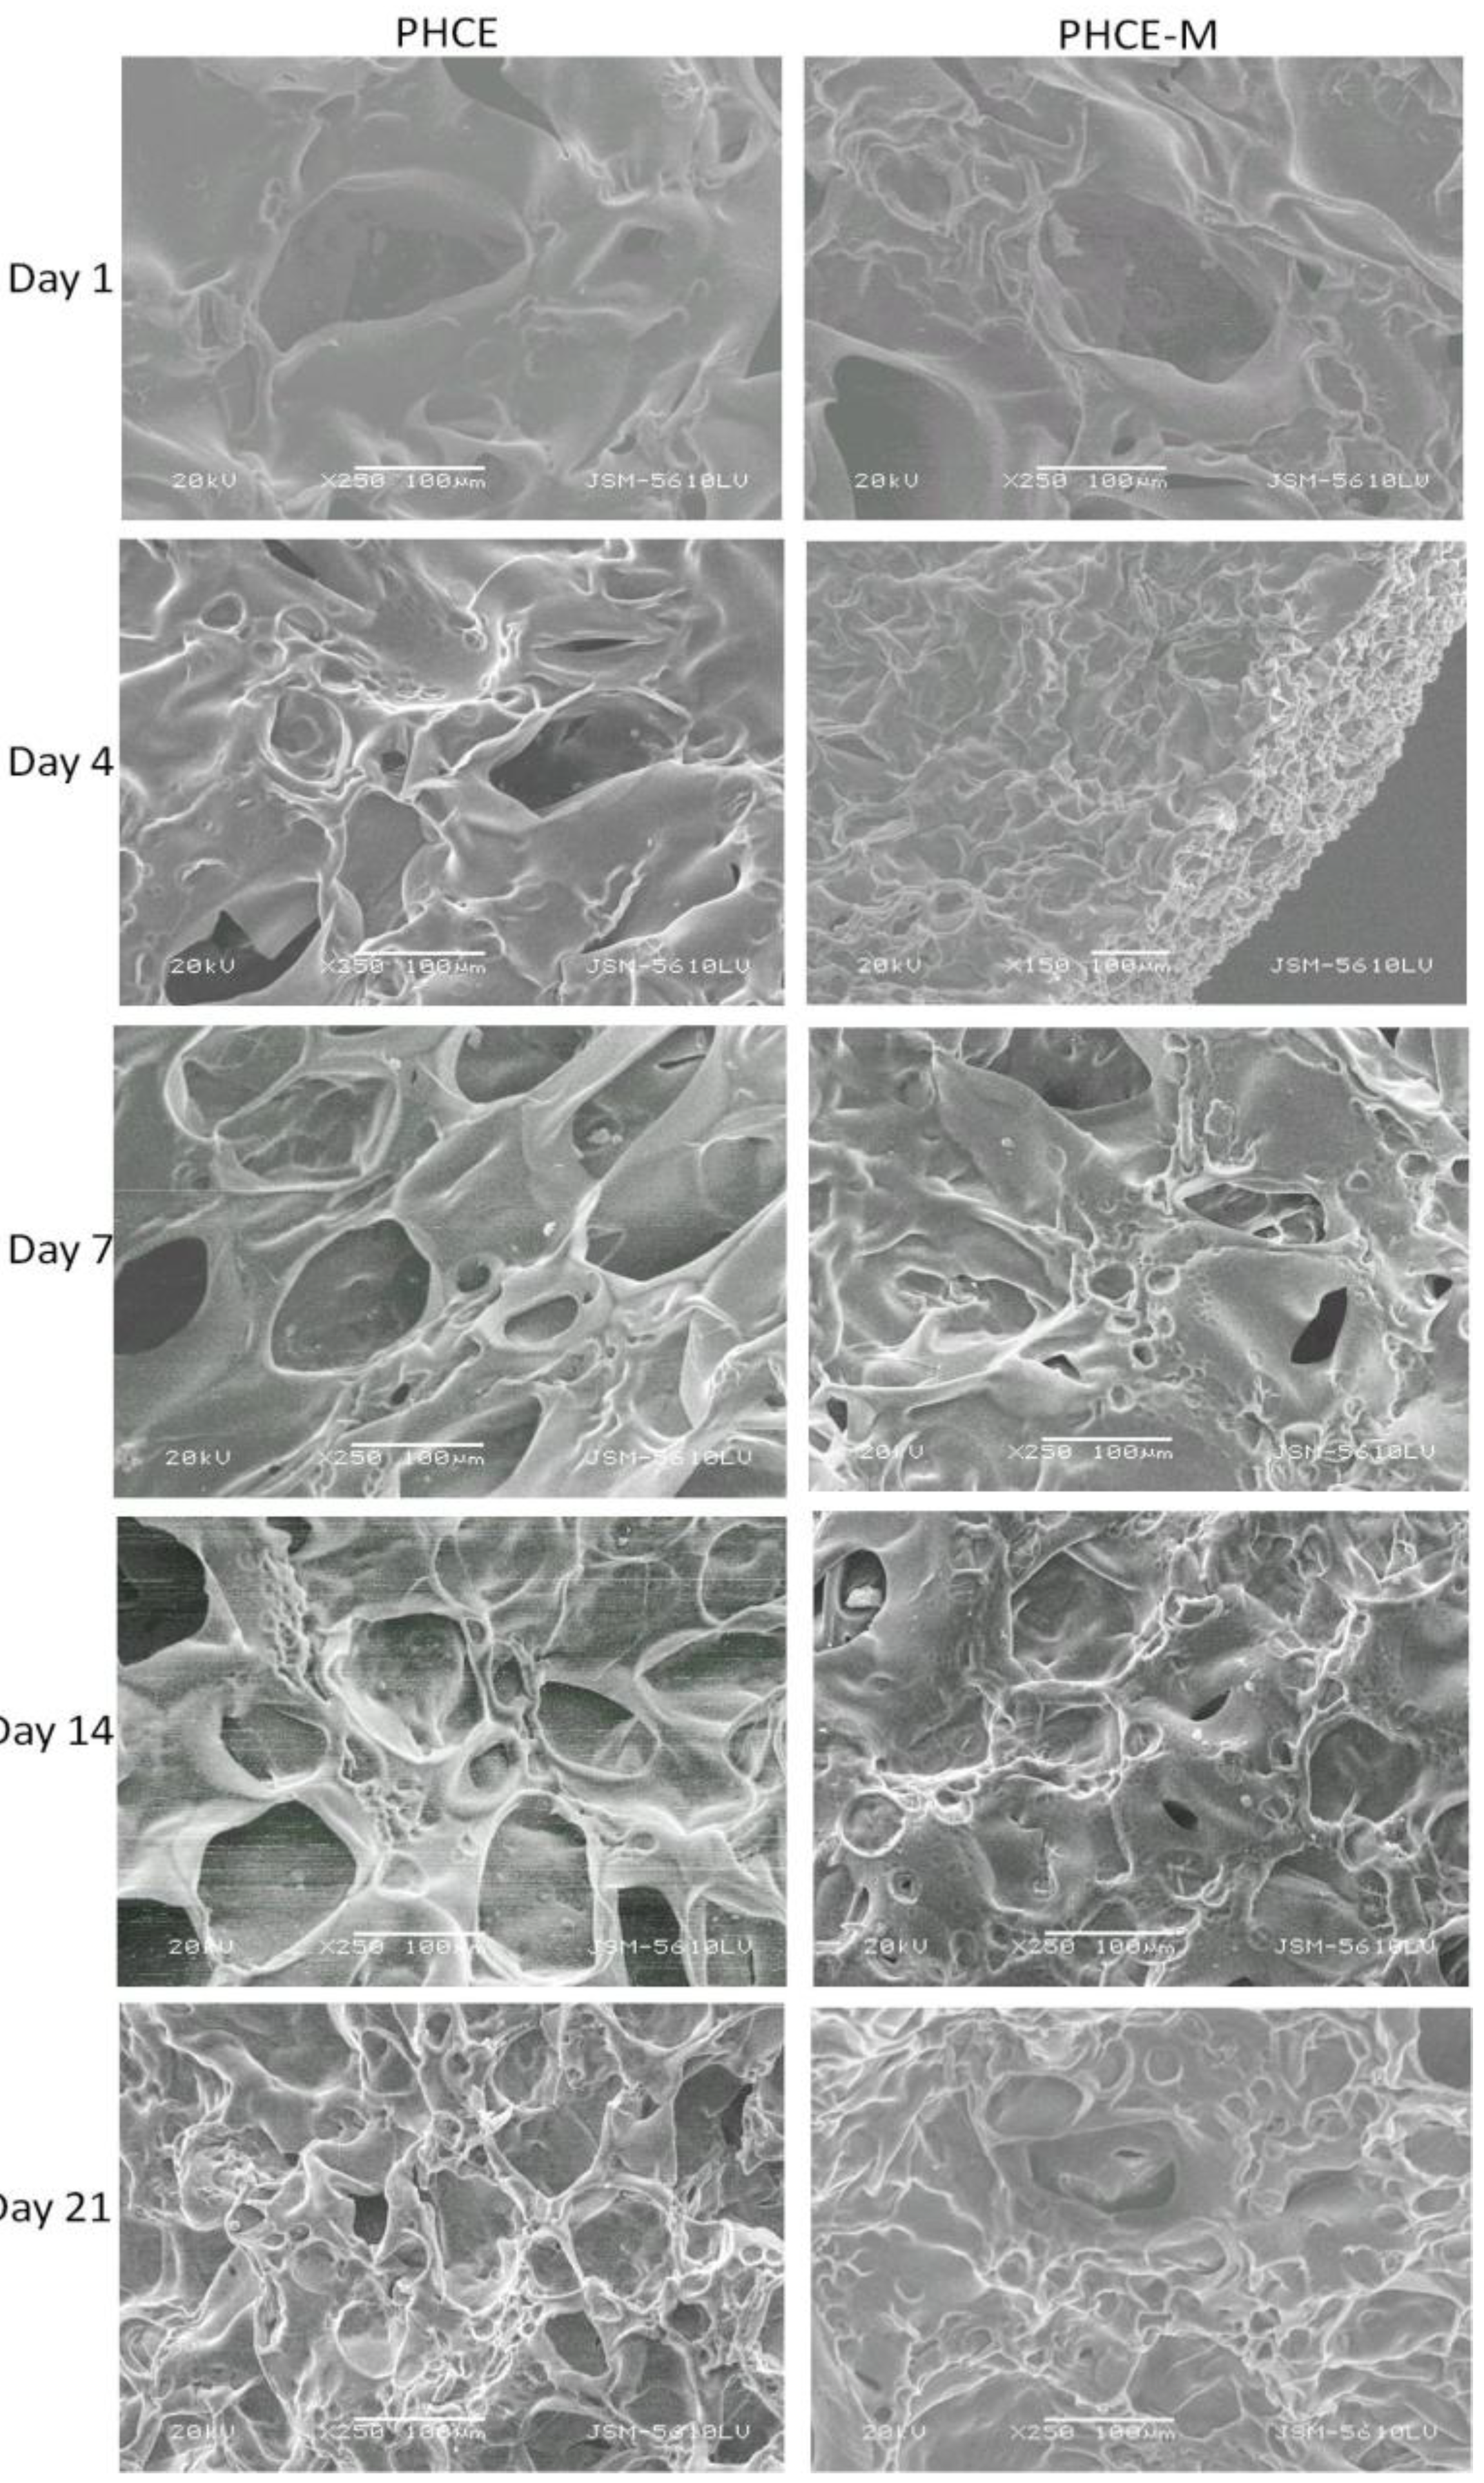
Scanning electron microscopy was performed on GE, GE-M, PHCE, and PHCE-M scaffolds after dynamic cell seeding and subsequent static culture for 1, 4, 7, 14, and 21 days (Figure 10 and Figure 11). Scaffolds were subjected to ethanol dehydration in order to image cellularized scaffolds. Ethanol dehydration is a procedure commonly used to prepare cellular scaffolds for imaging. However, since these sponges are hygroscopic in nature, dehydration caused the scaffolds to shrink upon preparation for imaging. Therefore, the images presented in this section are not representative of a fully hydrated swollen scaffold that cells are in contact with. Although this is the case, basic observations can still be made. One noticeable difference with the images presented is the visual appearance of no cells attached to any scaffolds at any time point. In the previous study, cells attached more as spheres and were easily visualized via SEM [24]. It is plausible that the dynamic cell seeding technique caused the cells to attach to and integrate with the scaffold better than static cell seeding (where spheres of cells were visualized). It is also possible that there are more cells within the scaffold rather than on the surface, in which case will not be captured via SEM. Since mechanical stress is a factor for bone development, it has been shown that osteoblasts respond differently to mechanical stimuli when compared to a static environment [32,33]. Future studies could focus on the degree of cell attachment and infiltration into the scaffold under dynamic and static culture conditions. For GE, GE-M, PHCE, and PHCE-M scaffolds, it was also observed that the scaffold became less porous over 21 days. This could be due to the remodeling of the scaffold by the cells, however, more in depth cell experiments analyzing the surface and entire cellular scaffold will need to be conducted for any conclusive results.
Figure 10. SEM of cellularized GE and GE-M scaffolds. No discernible cells on surface although scaffold becomes less porous over time. Scale bars at 50 µm.
Bioengineering 01 00062 g010
Figure 11. SEM of cellularized PHCE and PHCE-M scaffolds. No discernible cells on surface although scaffold becomes less porous over time. Scale bars at 100 µm.
Bioengineering 01 00062 g011
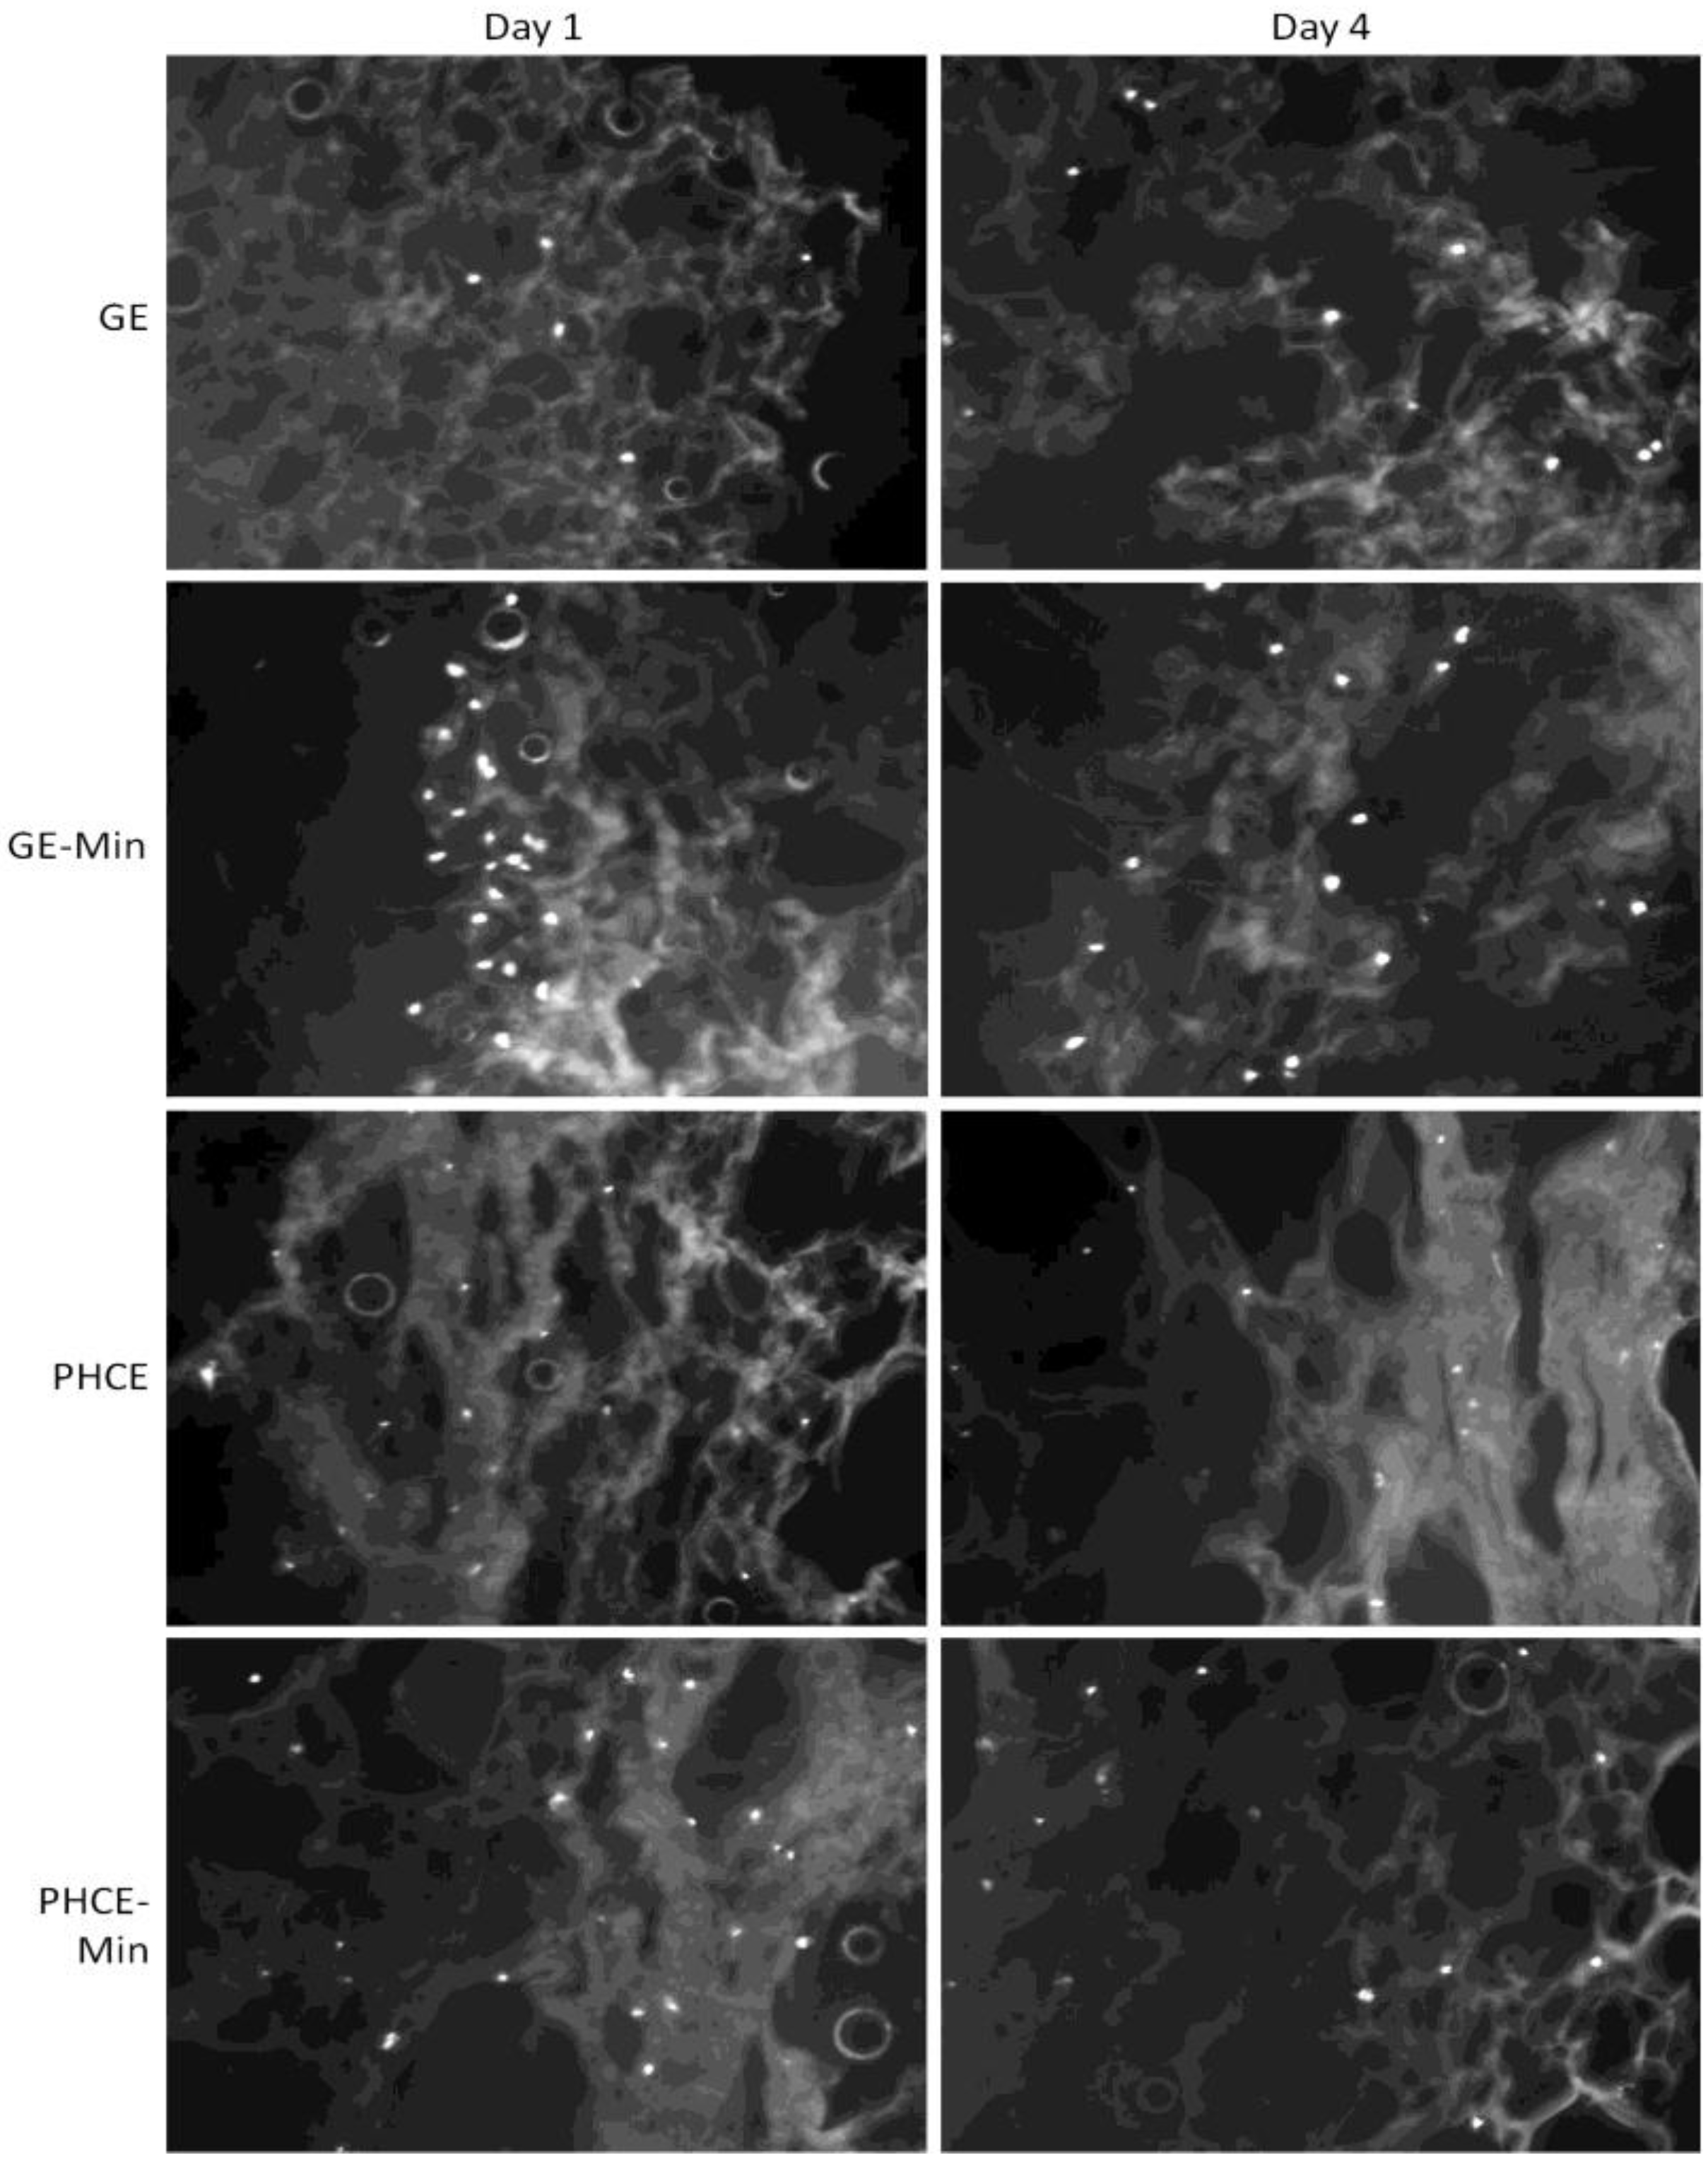
Cell attachment and more importantly, infiltration into all scaffolds, was analyzed via DAPI staining after dynamic seeding followed by static culture for 1 and 4 days (Figure 12). The control GE scaffolds attached fewer cells than all other scaffold types, but did show appropriate cell infiltration after days 1 and 4. Cell infiltration into GE scaffolds is most likely attributed to the dynamic cell seeding method, since in the previous study, cells statically seeded on GE scaffolds primarily remained on the surface [24]. A visual increase in cell attachment at the surface was observed for GE-M scaffolds suggesting that the minerals nucleated on the scaffold surface provide additional cell adhesion sites for osteoblasts. After 4 days in culture, cells were present throughout the entire scaffold indicating successful cell migration. Both PHCE and PHCE-M showed a large number of cells present throughout the scaffold on days 1 and 4. This increased cell attachment and infiltration was also reported for PHCE scaffolds in the previous study using the static cell seeding method [24]. This suggests that PHCE scaffolds increase initial cell attachment and infiltration independent of the cell seeding technique. Although there is no visual difference of cell attachment or infiltration between PHCE and PHCE-M scaffolds, there is a noticeable increase in initial cell attachment and infiltration when compared to GE and GE-M scaffolds on day 1. To confirm the cell attachment and infiltration trends mentioned above, cell density per field of view (10× magnification) for each 60 μm thick section was calculated. On day 1, GE, GE-M, PHCE, and PHCE-M scaffolds attached 5, 23, 21, 26 cells/image, respectively. Although GE-M scaffolds had a comparable cell density to PHCE and PHCE-M, DAPI revealed that cells on GE-M sponges were restricted to the surface while PRGF containing sponges enhanced initial infiltration. After 4 days in culture, cell densities for GE, GE-M, PHCE, and PHCE-M were 10, 15, 17, and 15 cells/image, respectively. Although GE scaffolds had a lower cell density, all scaffolds promoted the infiltration of cells after 4 days in culture. As previously mentioned, imaging cell nuclei via DAPI staining becomes increasingly difficult the longer cells are cultured on sponges. This could attribute to the decrease in cell density noticed on day 4 for scaffolds with high initial densities. Even though cells on scaffolds are not clearly visible on the SEM images (Figure 11), DAPI results confirm the presence and viability of cells throughout the scaffolds (Figure 12).
Figure 12. 4′-6-diamidino-2-phenylindole (DAPI) staining of mineralized and non-mineralized GE and PHCE scaffolds after dynamic cell seeding and subsequent static culture for 1 and 4 days. Increases in cell attachment (GE-M) and attachment/infiltration (PHCE and PHCE-M) are observed. All images taken at 10× magnification.
Bioengineering 01 00062 g012

4. Conclusions

Lyophilized gelatin sponges were enhanced with PRGF, HA, and CW and cross-linked during gelation. Both control GE scaffolds and PHCE scaffolds swelled 50% their original volume upon hydration. After fabrication, scaffolds were subsequently mineralized to create a bone-like surface. GE scaffolds nucleated minerals in more of a sparse aggregate manner while PHCE scaffolds showed more uniform mineralization across the surface. The highest concentrations of growth factors detected in PRGF and PRP were HGF and VEGF-A. VEGF and HGF are known to increase angiogenesis, osteoblast proliferation, and endochondral ossification which are all vital to bone regeneration. The growth factor profile of PPP (1:10) more closely resembled that of PRGF (1 and 0.1 mg/mL), both highly diluted solutions. The BCA protein assay showed that PHCE-M scaffolds degraded faster and released 30% of its original protein content. Although PHCE-M scaffolds degraded the fastest, no PRGF growth factors were detectable after analyzing contents of released protein. However, multiplexer analysis did reveal the successful incorporation of EGF within uncross-linked PHC sponges. The lower compression moduli values of PHCE and PCHE-M scaffolds are comparable to moduli values of tissues found in the early stages of bone healing. DAPI confirmed the presence and viability of cells cultured on scaffolds. DAPI imaging showed a noticeable increase in initial cell attachment and infiltration of PHCE and PHCE-M scaffolds when compared to GE and GE-M scaffolds on day 1. GE-M scaffolds also attached more cells than the GE control providing mineralized GE scaffolds with an advantage. These findings suggest that PHCE and PHCE-M scaffolds have potential for use as early bone healing tissue scaffolds; however, in vitro cellularized studies are required to assess cellular responses to the various composite porous sponges.

Conflicts of Interest

The authors declare no conflict of interest.

References

  1. Glassman, S.D.; Carreon, L.Y.; Campbell, M.J.; Johnson, J.R.; Puno, R.M.; Djurasovic, M.; Dimar, J.R. The perioperative cost of Infuse bone graft in posterolateral lumbar spine fusion. Spine J. 2008, 8, 443–448. [Google Scholar] [CrossRef]
  2. Logeart-Avramoglou, D.; Anagnostou, F.; Bizios, R.; Petite, H. Engineering bone: Challenges and obstacles. J. Cell. Mol. Med. 2005, 9, 72–84. [Google Scholar] [CrossRef]
  3. Finkemeier, C.G. Bone-grafting and bone-graft substitutes. J. Bone Joint Surg. 2002, 84-A, 454–464. [Google Scholar]
  4. Kim, S.S.; Sun Park, M.; Jeon, O.; Yong Choi, C.; Kim, B.S. Poly(lactide-co-glycolide)/hydroxyapatite composite scaffolds for bone tissue engineering. Biomaterials 2006, 27, 1399–1409. [Google Scholar] [CrossRef]
  5. Al-Munajjed, A.A.; Plunkett, N.A.; Gleeson, J.P.; Weber, T.; Jungreuthmayer, C.; Levingstone, T.; Hammer, J.; O’Brien, F.J. Development of a biomimetic collagen-hydroxyapatite scaffold for bone tissue engineering using a SBF immersion technique. J. Biomed. Mater. Res. B 2009, 90, 584–591. [Google Scholar]
  6. Greenwald, A.S.; Boden, S.D.; Barrack, R.L.; Bostrom, M.P.G.; Goldberg, V.M.; Yaszemski, M.J.; Heim, C.S. The Evolving Role of Bone-Graft Substitutes. Available online: http://www.aatb.org/aatb/files/ccLibraryFiles/Filename/000000000322/BoneGraftSubstitutes2010.pdf (accessed on 13 November 2013).
  7. Sell, S.A.; Wolfe, P.S.; Ericksen, J.J.; Simpson, D.G.; Bowlin, G.L. Incorporating platelet-rich plasma into electrospun scaffolds for tissue engineering applications. Tissue Eng. Part A 2011, 17, 2723–2737. [Google Scholar] [CrossRef]
  8. Wolfe, P.S.; Sell, S.A.; Ericksen, J.J.; Simpson, D.G.; Bowlin, G.L. The creation of electrospun nanofibers from platelet rich plasma. J. Tissue Sci. Eng. 2011, 2. [Google Scholar] [CrossRef]
  9. Sell, S.A.; Wolfe, P.S.; Spence, A.J.; Rodriguez, I.A.; McCool, J.M.; Petrella, R.L.; Garg, K.; Ericksen, J.J.; Bowlin, G.L. A preliminary study on the potential of manuka honey and platelet-rich plasma in wound healing. Int. J. Biomater. 2012, 2012, 313781:1–313781:14. [Google Scholar]
  10. Lu, H.H.; Vo, J.M.; Chin, H.S.; Lin, J.; Cozin, M.; Tsay, R.; Eisig, S.; Landesberg, R. Controlled delivery of platelet-rich plasma-derived growth factors for bone formation. J. Biomed. Mater. Res. A 2008, 86, 1128–1136. [Google Scholar]
  11. Anitua, E.; Orive, G.; Andia, I. Use of PRGF to accelerate bone and soft tissue regeneration in postextraction sites. Implant Dialogue 2003, 36, 3–14. [Google Scholar]
  12. Azami, M.; Samadikuchaksaraei, A.; Poursamar, S.A. Synthesis and characterization of a laminated hydroxyapatite/gelatin nanocomposite scaffold with controlled pore structure for bone tissue engineering. Int. J. Artif. Organs 2010, 33, 86–95. [Google Scholar]
  13. Kim, H.W.; Kim, H.E.; Salih, V. Stimulation of osteoblast responses to biomimetic nanocomposites of gelatin-hydroxyapatite for tissue engineering scaffolds. Biomaterials 2005, 26, 5221–5230. [Google Scholar] [CrossRef]
  14. Zeng, J.B.; He, Y.S.; Li, S.L.; Wang, Y.Z. Chitin whiskers: An overview. Biomacromolecules 2012, 13, 1–11. [Google Scholar] [CrossRef]
  15. Ji, Y.-L.; Wolfe, P.S.; Rodriguez, I.A.; Bowlin, G.L. Preparation of chitin nanofibril/polycaprolactone nanocomposite from a nonaqueous medium suspension. Carbohydr. Polym. 2012, 87, 2313–2319. [Google Scholar] [CrossRef]
  16. Hariraksapitak, P.; Supaphol, P. Preparation and properties of a-chitin-whisker-reinforced hyaluronan-gelatin nanocomposite scaffolds. J. Appl. Polym. Sci. 2010, 117, 3406–3418. [Google Scholar]
  17. Prabhakaran, M.P.; Venugopal, J.; Ramakrishna, S. Electrospun nanostructured scaffolds for bone tissue engineering. Acta Biomater. 2009, 5, 2884–2893. [Google Scholar] [CrossRef]
  18. Di Martino, A.; Liverani, L.; Rainer, A.; Salvatore, G.; Trombetta, M.; Denaro, V. Electrospun scaffolds for bone tissue engineering. Musculoskelet Surg. 2011, 95, 69–80. [Google Scholar] [CrossRef]
  19. Murphy, W.L.; Kohn, D.H.; Mooney, D.J. Growth of continuous bonelike mineral within porous poly(lactide-co-glycolide) scaffolds in vitro. J. Biomed. Mater. Res. 2000, 50, 50–58. [Google Scholar] [CrossRef]
  20. Bigi, A.; Boanini, E.; Panzavolta, S.; Roveri, N.; Rubini, K. Bonelike apatite growth on hydroxyapatite-gelatin sponges from simulated body fluid. J. Biomed. Mater. Res. 2002, 59, 709–715. [Google Scholar] [CrossRef]
  21. Ohgushi, H.; Caplan, A.I. Stem cell technology and bioceramics: From cell to gene engineering. J. Biomed. Mater. Res. 1999, 48, 913–927. [Google Scholar] [CrossRef]
  22. Stupp, S.I.; Ciegler, G.W. Organoapatites: Materials for artificial bone. I. Synthesis and microstructure. J. Biomed. Mater. Res. 1992, 26, 169–183. [Google Scholar] [CrossRef]
  23. Zhang, R.; Ma, P.X. Biomimetic polymer/apatite composite scaffolds for mineralized tissue engineering. Macromol. Biosci. 2004, 4, 100–111. [Google Scholar] [CrossRef]
  24. Rodriguez, I.A.; Sell, S.A.; McCool, J.M.; Saxena, G.; Spence, A.J.; Bowlin, G.L. A preliminary evaluation of lyophilized gelatin sponges enhanced with platelet-rich plasma, hydroxyapatite, and chitin whiskers for bone regeneration. Cells 2013, 2, 244–265. [Google Scholar] [CrossRef]
  25. Wolfe, P.S.; Sell, S.A.; Ericksen, J.J.; Simpson, D.G.; Bowlin, G.L. The creation of electrospun nanofibers from platelet-rich plasma. J. Tissue Sci. Eng. 2011, 2. [Google Scholar] [CrossRef]
  26. Oyane, A.; Kim, H.M.; Furuya, T.; Kokubo, T.; Miyazaki, T.; Nakamura, T. Preparation and assessment of revised simulated body fluids. J. Biomed. Mater. Res. A 2003, 65, 188–195. [Google Scholar]
  27. Rodriguez, I.A.; Madurantakam, P.A.; McCool, J.M.; Sell, S.A.; Yang, H.; Moon, P.C.; Bowlin, G.L. Mineralization potential of electrospun PDO-hydroxyapatite-fibrinogen blended scaffolds. Int. J. Biomater. 2012, 2012, 159484:1–159484:15. [Google Scholar]
  28. Zhang, F.; He, C.; Cao, L.; Feng, W.; Wang, H.; Mo, X.; Wang, J. Fabrication of gelatin-hyaluronic acid hybrid scaffolds with tunable porous structures for soft tissue engineering. Int. J. Biol. Macromol. 2011, 48, 474–481. [Google Scholar] [CrossRef]
  29. Nie, L.; Chen, D.; Suo, J.; Zou, P.; Feng, S.; Yang, Q.; Yang, S.; Ye, S. Physicochemical characterization and biocompatibility in vitro of biphasic calcium phosphate/polyvinyl alcohol scaffolds prepared by freeze-drying method for bone tissue engineering applications. Colloids Surf. B Biointerfaces 2012, 100, 169–176. [Google Scholar] [CrossRef]
  30. Woo, K.M.; Seo, J.; Zhang, R.; Ma, P.X. Suppression of apoptosis by enhanced protein adsorption on polymer/hydroxyapatite composite scaffolds. Biomaterials 2007, 28, 2622–2630. [Google Scholar] [CrossRef]
  31. Mansour, J.M. Biomechanics of Cartilage. Available online: http://www.cartilagehealth.com/images/artcartbiomech.pdf (accessed on 13 November 2013).
  32. Myers, K.A.; Rattner, J.B.; Shrive, N.G.; Hart, D.A. Osteoblast-like cells and fluid flow: Cytoskeleton-dependent shear sensitivity. Biochem. Biophys. Res. Commun. 2007, 364, 214–219. [Google Scholar] [CrossRef]
  33. Li, F.F.; Chen, F.L.; Wang, H.; Yu, S.B.; Cui, J.H.; Ding, Y.; Feng, X. Proteomics based detection of differentially expressed proteins in human osteoblasts subjected to mechanical stress. Biochem. Cell. Biol. 2013, 91, 109–115. [Google Scholar] [CrossRef]

