
Insights on Osmotic Tolerance Mechanisms in Escherichia coli Gained from an rpoC Mutation

1
Department of Chemical Engineering, Texas A&M University, College Station, TX 77843, USA
2
Department of Chemical and Biological Engineering, University of Colorado-Boulder, Boulder, CO 80303, USA
*
Author to whom correspondence should be addressed.
†
Current address: Shell Biodomain, Houston, TX 77082, USA.
Bioengineering 2017, 4(3), 61; https://doi.org/10.3390/bioengineering4030061
Submission received: 24 May 2017
/
Revised: 22 June 2017
/
Accepted: 24 June 2017
/
Published: 28 June 2017
Abstract
:An 84 bp in-frame duplication (K370_A396dup) within the rpoC subunit of RNA polymerase was found in two independent mutants selected during an adaptive laboratory evolution experiment under osmotic stress in Escherichia coli, suggesting that this mutation confers improved osmotic tolerance. To determine the role this mutation in rpoC plays in osmotic tolerance, we reconstructed the mutation in BW25113, and found it to confer improved tolerance to hyperosmotic stress. Metabolite analysis, exogenous supplementation assays, and cell membrane damage analysis suggest that the mechanism of improved osmotic tolerance by this rpoC mutation may be related to the higher production of acetic acid and amino acids such as proline, and increased membrane integrity in the presence of NaCl stress in exponential phase cells. Transcriptional analysis led to the findings that the overexpression of methionine related genes metK and mmuP improves osmotic tolerance in BW25113. Furthermore, deletion of a stress related gene bolA was found to confer enhanced osmotic tolerance in BW25113 and MG1655. These findings expand our current understanding of osmotic tolerance in E. coli, and have the potential to expand the utilization of high saline feedstocks and water sources in microbial fermentation.
Keywords:
E. coli; osmotic tolerance; rpoC; amino acid; acetic acid; membrane integrity; complex phenotype1. Introduction
One of the challenges in the microbial production of chemicals is the low tolerance of the microbial host to inhibitors present in the feedstock. There is increasing interest in using more sustainable feedstocks such as lignocellulosic hydrolysates [1,2,3] and waste glycerol [4,5]. However, some of these feedstocks contain inhibitory components, such as high salts, that can negatively impact the performance of the microbial hosts, leading to reduced productivity [6,7]. In addition, the use of seawater or wastewater as a replacement for freshwater in fermentation can help to alleviate freshwater demand in industrial biotechnology. However, partly due to the high salinity of these water sources and low osmotic tolerance of microbial hosts [8,9], their adoption has not been widespread. Thus, improved osmotic tolerance in microbial systems can potentially increase their productivity when using high saline feedstocks, and expand the utilization of these alternate feedstocks and water sources.
As with other complex phenotypes, osmotic tolerance involves multiple genes and mechanisms. Existing studies have identified several cellular responses to osmotic stress in Escherichia coli. In response to increased osmotic pressure, the synthesis of aquaporin increases to accelerate the export of water to balance intracellular and environmental osmolality [10], the intracellular potassium concentration increases via the regulation of potassium transporters [11,12], and the accumulation of osmoprotectants (e.g., trehalose, glycine betaine, proline, etc.) also increases [13,14,15,16]. In addition to the regulation of intracellular osmolality, E. coli has been found to counter osmotic stress by accumulating ubiquinone-8 to enhance its cytoplasmic membrane stability [17]. Based on existing knowledge, there have been prior attempts to rationally improve osmotolerance in E. coli [18,19]. However, the levels of improvement [20,21,22,23] achieved have been modest, potentially due to limited knowledge of the genetic determinants and mechanisms involved.
We had previously identified an 84 bp in-frame duplication (K370_A396dup) in the RNA polymerization domain of RpoC of the RNA polymerase in two independently evolved osmotolerant mutants [24], which suggests that this rpoC mutation confers osmotic tolerance and warrants further study. We reconstructed this rpoC mutation in a wild-type BW25113 background and confirmed the beneficial effect of this mutation on osmotic tolerance. The reconstructed rpoC mutant exhibited improved growth in minimal media under osmotic stress compared with the wild-type strain. Since the rpoC mutation was selected during evolution in media supplemented with tryptophan [24], the impact of tryptophan supplementation was also investigated and found to confer increased osmotic tolerance, which has not been reported previously. Subsequent metabolite analysis, membrane damage analysis and transcriptional analysis of the mutant revealed potential mechanisms of how this specific rpoC mutation confers tolerance to osmotic stress.
2. Materials and Methods
2.1. Media and Growth Conditions
M9 minimal media (per liter: 12.8 g Na2HPO4·7H2O, 3 g KH2PO4, 0.5 g NaCl, 1 g NH4Cl, 10 mg FeCl3·6H2O, 1.8 mg ZnSO4·7H2O, 1.2 mg CuCl2·2H2O, 1.2 mg MnSO4·H2O, 1.8 mg CoCl2·6H2O) supplemented with 0.5% (w/v) glucose and Luria–Bertani (LB) broth were used for routine cultivation and growth assays. LB agar plates were used for strain isolation. Tryptophan (50 µg mL−1), kanamycin (10 µg mL−1), ampicillin (30 µg mL−1) and chloramphenicol (25 µg mL−1) were supplemented whenever necessary. All liquid cultures were cultivated with agitation at 37 °C. Sodium chloride (NaCl) was utilized to adjust the osmotic strength of the media for growth assays. The starting pH of all the media used in this work was ~7.
2.2. Marker-Less Reconstruction of rpoC Mutation in BW25113
In order to construct a marker-less rpoC K370_A396dup mutation in the wild-type BW25113 strain (F-, Δ(araD-araB)567, lacZ4787(del)::rrnB-3, λ-, rph-1, Δ(rhaD-rhaB)568, hsdR514), an ∆argE744::kan cassette, which resides 30,503 bp away from the rpoC gene in the chromosome, from JW3929 of the Keio collection [25] was transduced via P1 transduction [26] into the evolved osmotolerant mutant G3 [24] containing the rpoC K370_A396dup mutation. The transductants with ∆argE744::kan cassette were selected on LB agar plate with 10 µg mL−1 kanamycin. The kanamycin-resistant transductant containing the mutated rpoC allele was verified by colony PCR. The primers used for the colony PCR verification are: GAA ACC AAC TCC GAA ACC AA (forward) and AGT ACC GGT TCA AAT GCC TG (reverse). The transductant containing both the ΔargE744::kan cassette and the mutated rpoC allele was named EJW1. The ΔargE744::kan-rpoC K370_A396dup construct from EJW1 was then transduced into BW25113 selected for kanamycin resistance, and the same colony PCR screening procedure was used to isolate transductant EJW2, which contains both ΔargE744::kan and rpoC K370_A396dup. Then EJW2 was made arginine prototrophic (arg+) via P1 transduction with the wild-type argE allele from BW25113 and selected on M9 minimal agar plate for arginine prototroph. The arg+ colonies that contain the rpoC K370_A396dup mutation was verified using the same colony PCR screening procedure. The resulting reconstructed mutant EJW3 therefore contains only the rpoC mutation from mutant G3 without any added markers. Since the original G3 mutant contained ∆trpB769::kan deletion, EJW3 was transduced with ∆trpB769::kan cassette from JW1253 of the Keio collection and selected on an LB agar plate with 10 µg mL−1 kanamycin to create a tryptophan auxotroph, EJW4, similar to the one in the original G3 mutant. The same method was used to introduce this rpoC mutation in strain MG1655 (F-, λ-, rph-1), and the resulting MG1655 rpoC mutant was named EYG1. All strains used in this study are listed in Table 1.
2.3. Growth Kinetic Analysis
Frozen stocks of strains were streaked on LB agar plates for single colonies and incubated overnight at 37 °C. Single colonies were used to inoculate 5 mL of fresh M9 media and incubated overnight at 37 °C with shaking (225 rpm). The overnight cultures were washed once with fresh M9 media and re-suspended in M9 to an OD600 of ~10.0, then 50 µL samples were inoculated in 5 mL M9 media supplemented with 0.6 M NaCl in 20 × 150 mm screw-capped test tubes, at an initial OD600 of approximately 0.1. The media was supplemented with 50 µg mL−1 tryptophan when necessary. Samples were incubated at 37 °C with shaking (225 rpm), and growth was tracked by measuring the OD600 periodically using a spectrophotometer (BioMate 3, Thermo Fisher Scientific, Madison, WI, USA).
For viability assays, samples were plated from cultures sampled at different growth phases on LB plates. After overnight incubation at 37 °C, colony forming units (CFU) were counted to estimate the concentration of viable cells. The size and shape of cells at different growth phases in M9 and M9 supplemented with 0.6 M NaCl were observed under a light microscope (Carl Zeiss, Göttingen, Germany).
The ability of each strain to grow under higher osmotic stress was analyzed, as described previously, with an initial OD600 of ~0.05 and agitated at 275 rpm (a higher agitation was used to prevent cell clumping in the presence of higher osmotic stress). Screw-capped test tubes (20 × 150 mm) were used to analyze cell growth under micro-aerobic condition in M9 with addition of 0.8 M, 0.9 M, or 1 M NaCl. Normal test tubes (20 × 150 mm) were used to analyze cell growth under aerobic condition in M9 with addition of 0.75 M, 0.8 M, or 0.9 M NaCl. Three biological replicates were used in each condition.
2.4. Effects of Amino Acid Supplementation
The effects of individual amino acid supplementation on osmotic tolerance were measured in M9 in the presence of 0.65 M NaCl. The same procedure for growth kinetic analysis as described above was carried out using 5 mL cultures. Three biological replicates were used in each condition.
2.5. Metabolite Analysis
Cells for metabolite analysis were cultivated in two 50 mL cultures with M9 media or M9 media supplemented with 0.6 M NaCl in 250 mL screw-capped flasks, incubated at 37 °C with shaking (275 rpm). Samples for metabolite analysis were collected during late exponential phase (OD600 about 0.7–1.0), and analyzed using high-performance liquid chromatography (HPLC; Agilent Technologies, 1260 Infinity, Santa Clara, CA, USA). Extracellular metabolites were collected from supernatants, and intracellular metabolites were extracted with acetonitrile:methanol:water (40:40:20) [27] from cell pellets collected from combining two 50 mL cultures inoculated with the same overnight culture originated from a single colony. Trehalose, glucose, and acetic acid were analyzed using Aminex HPX-87H ion exclusion column (Bio-Rad, Hercules, CA, USA) operated at 50 °C with 5 mM sulfuric acid as the mobile phase at a flow rate of 0.6 mL min−1, and detected by Refractive Index (RI) detector. Free amino acids were analyzed using a modified Agilent amino acid analysis method [28]; the detailed procedure of which can be found in the Supplementary Materials (Tables S1, S2 and S3). Six biological replicates were used in each condition.
2.6. Effects of Acetic Acid Supplementation
For experiments with acetic acid supplementation, 10 mM of acetic acid was used. The starting pH of the media with 10 mM acetic acid addition was ~6.5. Cells were cultivated as described in the metabolite analysis section above with 5 mL media in screw-capped tubes. Three biological replicates were used in each condition.
2.7. Cell Membrane Damage Analysis
Cell membrane perturbation was analyzed by measuring the uptake of the fluorescent dye propidium iodide (PI). The OD600 of cells grown in M9 was adjusted to ~0.6, treated with M9 only, M9 supplemented with 0.7 M NaCl, M9 supplemented with 10 mM acetic acid, or M9 supplemented with 0.7 M NaCl and 10 mM acetic acid for 30 min at 37 °C. The treated cells were centrifuged at 21,130× g for 2 min, and pellets were re-suspended in PBS. PI staining was performed as previously described [29,30]. Briefly, PI was added to cells at a final concentration of 2.9 µM and incubated in the dark for 10 min at room temperature, then the cells were washed twice with PBS. To quantify uptake of PI, 200 µL of each sample was placed in black-walled 96-well plates (Greiner Bio-One, Monroe, NC, USA) and the fluorescence of PI staining was measured using a fluorescent plate reader (Molecular Devices SpectraMax® Gemini EM, Sunnyvale, CA, USA) using an excitation wavelength of 495 nm and an emission wavelength of 615 nm. The background fluorescence was corrected by subtracting the fluorescence of cells without PI straining. All fluorescence data were normalized by OD600. Three biological replicates were used in each condition.
2.8. Transcriptional Analysis
Perturbations to transcriptional regulation in the presence of 0.6 M NaCl were determined using microarray analysis using strains BW25113, EJW3, MG1655, and EYG1 with two biological replicates each. Samples were cultivated using the same condition as in metabolite analysis with 25 mL cultures and an initial OD600 of ~0.05. When OD600 reached ~0.5, cells were quickly chilled to ≤4 °C on dry ice/isopropanol bath, then harvested by centrifugation (4470× g) at 4 °C followed by immediate re-suspension in 5 mL of RNAlater (Sigma-Aldrich, St. Louis, MO, USA). Total RNA was extracted by using the ZR Fungal/Bacterial RNA MicroPrep™ (Zymo Research, Irvine, CA, USA) kit. A total of 10 μg of the isolated total RNA was mixed with 1.5 μg random primers (Promega, Madison, WI, USA), incubated at 70 °C for 10 min and then cooled on ice (4 °C). The cDNA was synthesized by combining the total RNA mixture with 10 U SuperScript® III reverse transcriptase, 1× first strand buffer, 0.01 M DTT (Invitrogen, Carlsbad, CA, USA), and nucleotides (0.5 mM dATP, 0.5 mM dGTP, 0.5 mM dCTP, 0.2 mM dTTP (Promega, Madison, WI, USA) and 0.3 mM amino-allyl dUTP (Thermo Fisher Scientific, Waltham, MA, USA)), and incubated at 42 °C for 3 h. The cDNA was recovered with ice-cold ethanol precipitation, labeled with either Cy3- or Cy5- mono-reactive dye (GE Healthcare, Little Chalfont, Buckinghamshire, UK), and then hybridized to the E. coli Gene Expression Microarray (Agilent Technologies). The arrays were scanned using the GenePix 4100A Microarray Scanner and the images were analyzed using GenePix Pro 6.0 software (Molecular Devices, Sunnyvale, CA, USA). The MIDAS software package (TM4) [31] was used to normalize the data using LOWESS based normalization algorithm [32]. The rank product method with a critical p-value < 0.01 was used to identify the differentially expressed genes using MeV (TM4) microarray analysis software [31]. Gene ontology analysis was performed using the Database for Annotation, Visualization and Integrated Discovery (DAVID) [33,34].
2.9. Overexpression and Deletion Assay
Genes uniquely upregulated or downregulated in the rpoC mutant in the BW25113 background were further investigated via overexpression or deletion studies. Plasmids from the ASKA collection [35] were transformed into BW25113 for overexpression assays. The growth kinetics of the overexpression strains were compared against the wild-type strain expressing the empty vector pCA24N in M9 with or without 0.55 M NaCl supplementation. Knockout strains were obtained from the Keio collection [25]. The kanamycin resistance marker in the Keio strains was removed by transforming with the plasmid pCP20 as previously described [36], and the marker-less knockout strains were used for deletion assay using BW25113 as the negative control in M9 with or without 0.6 M NaCl supplementation. Three biological replicates were used in each condition.
2.10. Microarray Data Accession Number
Microarray data have been deposited in the Gene Expression Omnibus (GEO) database with accession number GSE94342.
3. Results and Discussion
3.1. The rpoC K370_A396dup Mutation Confers Osmotic Tolerance in BW25113
Our prior work investigating osmotic tolerance in E. coli using adaptive laboratory evolution yielded several mutants with significantly increased tolerance to NaCl stress [24]. Two isolated osmotolerant mutants (G3 and G4) share an identical rpoC K370_A396dup mutation. These mutants were isolated from independent populations, which led us to hypothesize that this specific mutation is a causative mutation for the improved osmotic tolerance observed. Since both G3 and G4 also contain additional mutations, in order to study the specific function of the rpoC K370_A396dup mutation, we reconstructed this mutation in the BW25113 wild-type background to generate strain EJW3. In addition, since the parental strain from which G3 and G4 mutants were derived contains a trpB deletion, we also generated strain EJW4 by deleting the trpB gene from EJW3.
The growth kinetics of strain BW25113, EJW3 (BW25113 rpoC K370_A396dup), JW1253 (BW25113 ΔtrpB769::kan), EJW4 (BW25113 rpoC K370_A396dup, ΔtrpB769::kan), G3 (evolved osmotolerant mutant containing rpoC K370_A396dup mutation, BW25113 background), and Hfr-2×SFX- (ancestor of G3, BW25113 background) [24] were compared in M9 supplemented with 0.6 M NaCl and 50 µg mL−1 tryptophan (Figure 1). Since BW25113 and EJW3 are prototrophic for tryptophan, we also compared the growth of these two strains in the absence of tryptophan to assess the impact of the rpoC K370_A396dup mutation on osmotic tolerance in the absence of amino acid supplementation. The results showed that in the absence of tryptophan supplementation, the growth of BW25113 was drastically inhibited by 0.6 M NaCl 4 h after incubation with no significant growth observed within the next 20 h, while strain EJW3 continued to grow and reached significantly higher biomass than BW25113 after 24 h. The data showed that the addition of tryptophan significantly increased the growth of both BW25113 and the reconstructed rpoC mutant EJW3 in the presence of 0.6 M NaCl (Figure 1A). Though the addition of tryptophan improved the performance of all strains tested in the presence of 0.6 M NaCl, strains with the rpoC K370_A396dup mutation (EJW3, EJW4, and G3) still outperformed their rpoC wild-type counterparts (Figure 1A,B), strongly suggesting that the rpoC K370_A396dup mutation is a causative mutation for enhanced osmotic tolerance. Interestingly, the level of osmotic tolerance conferred by the rpoC mutation alone was on the same level as that conferred by the addition of 50 µg mL−1 tryptophan. Results in Figure 1 showed no significant difference in specific growth rates during the first few hours of growth between BW25113 and EJW3; therefore, biomass concentrations after 24 and 48 h were used to assess osmotic tolerance for the majority of this work.
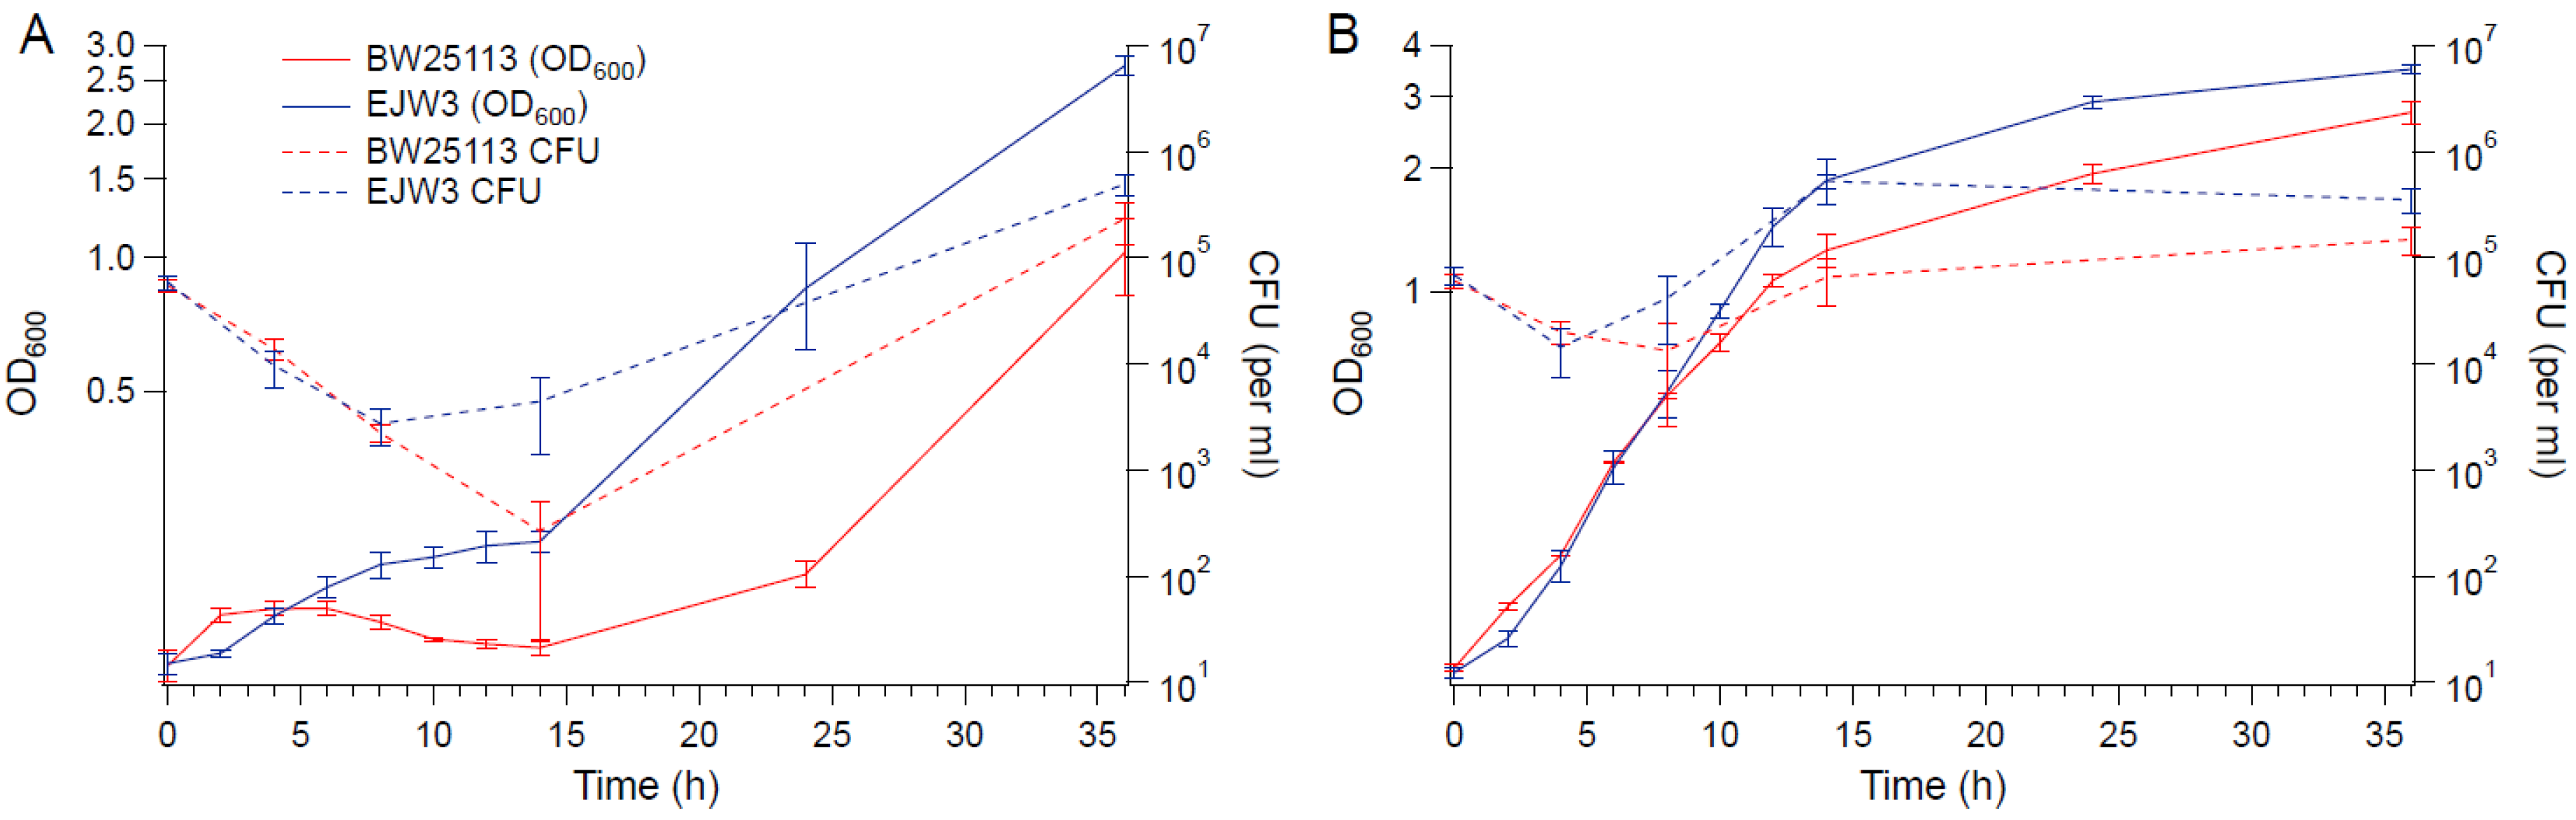
To determine the impact of the rpoC mutation on cell viability in hyperosmotic stress, BW25113 and EJW3 were grown in M9 supplemented with 0.6 M NaCl and the concentration of viable cells were quantified over time (Figure 2). The concentration of viable cells of both strains decreased within the first few hours, indicating the occurrence of cell death upon initial exposure to hyperosmotic stress. However, increases in the concentration of viable cells were observed in EJW3 sooner and at a faster rate than BW25113. The same trend was also observed using OD600, indicating that OD600 and the concentration of viable cells are correlated. The increase in growth (based on OD600 measurements) observed in hyperosmotic conditions when tryptophan was supplemented also correlated with increased cell viability. Furthermore, there was no observable differences in cell size or shape between BW25113 and EJW3 in the presence or absence of 0.6 M NaCl at different growth phases (Figure S1). Thus, OD600 was used as the measure of cell growth for the remainder of this study.
The impact of the rpoC mutation on tolerance to higher osmotic stress was tested in both aerobic and micro-aerobic conditions. Preliminary tests showed higher osmotic tolerance of the strains in micro-aerobic vs. aerobic conditions, therefore 0.8 M, 0.9 M, and 1 M NaCl were used in micro-aerobic conditions, while 0.75 M, 0.8 M, and 0.9 M NaCl were used under aerobic conditions. The higher osmotic tolerance observed under micro-aerobic conditions is likely due to higher induction of the osmotic tolerance related genes ompC and proU under anaerobic conditions [37]. Relative growth results in 0.8 M (micro-aerobic) and 0.75 M (aerobic) NaCl are shown in Table 2 and Table 3. In micro-aerobic and aerobic conditions, all strains with the rpoC mutation showed significant growth in the presence of 0.8 M and 0.75 M NaCl respectively, while only slight growth was observed in their wild-type counterparts. In the presence of 0.9 M NaCl in micro-aerobic condition and 0.8 M NaCl in aerobic condition, only slight turbidity was observed in all strains (Tables S4 and S5), and no growth was observed in any strain cultured micro-aerobically in the presence of 1 M NaCl or aerobically with 0.9 M NaCl.
3.2. Effects of Amino Acid Supplementation
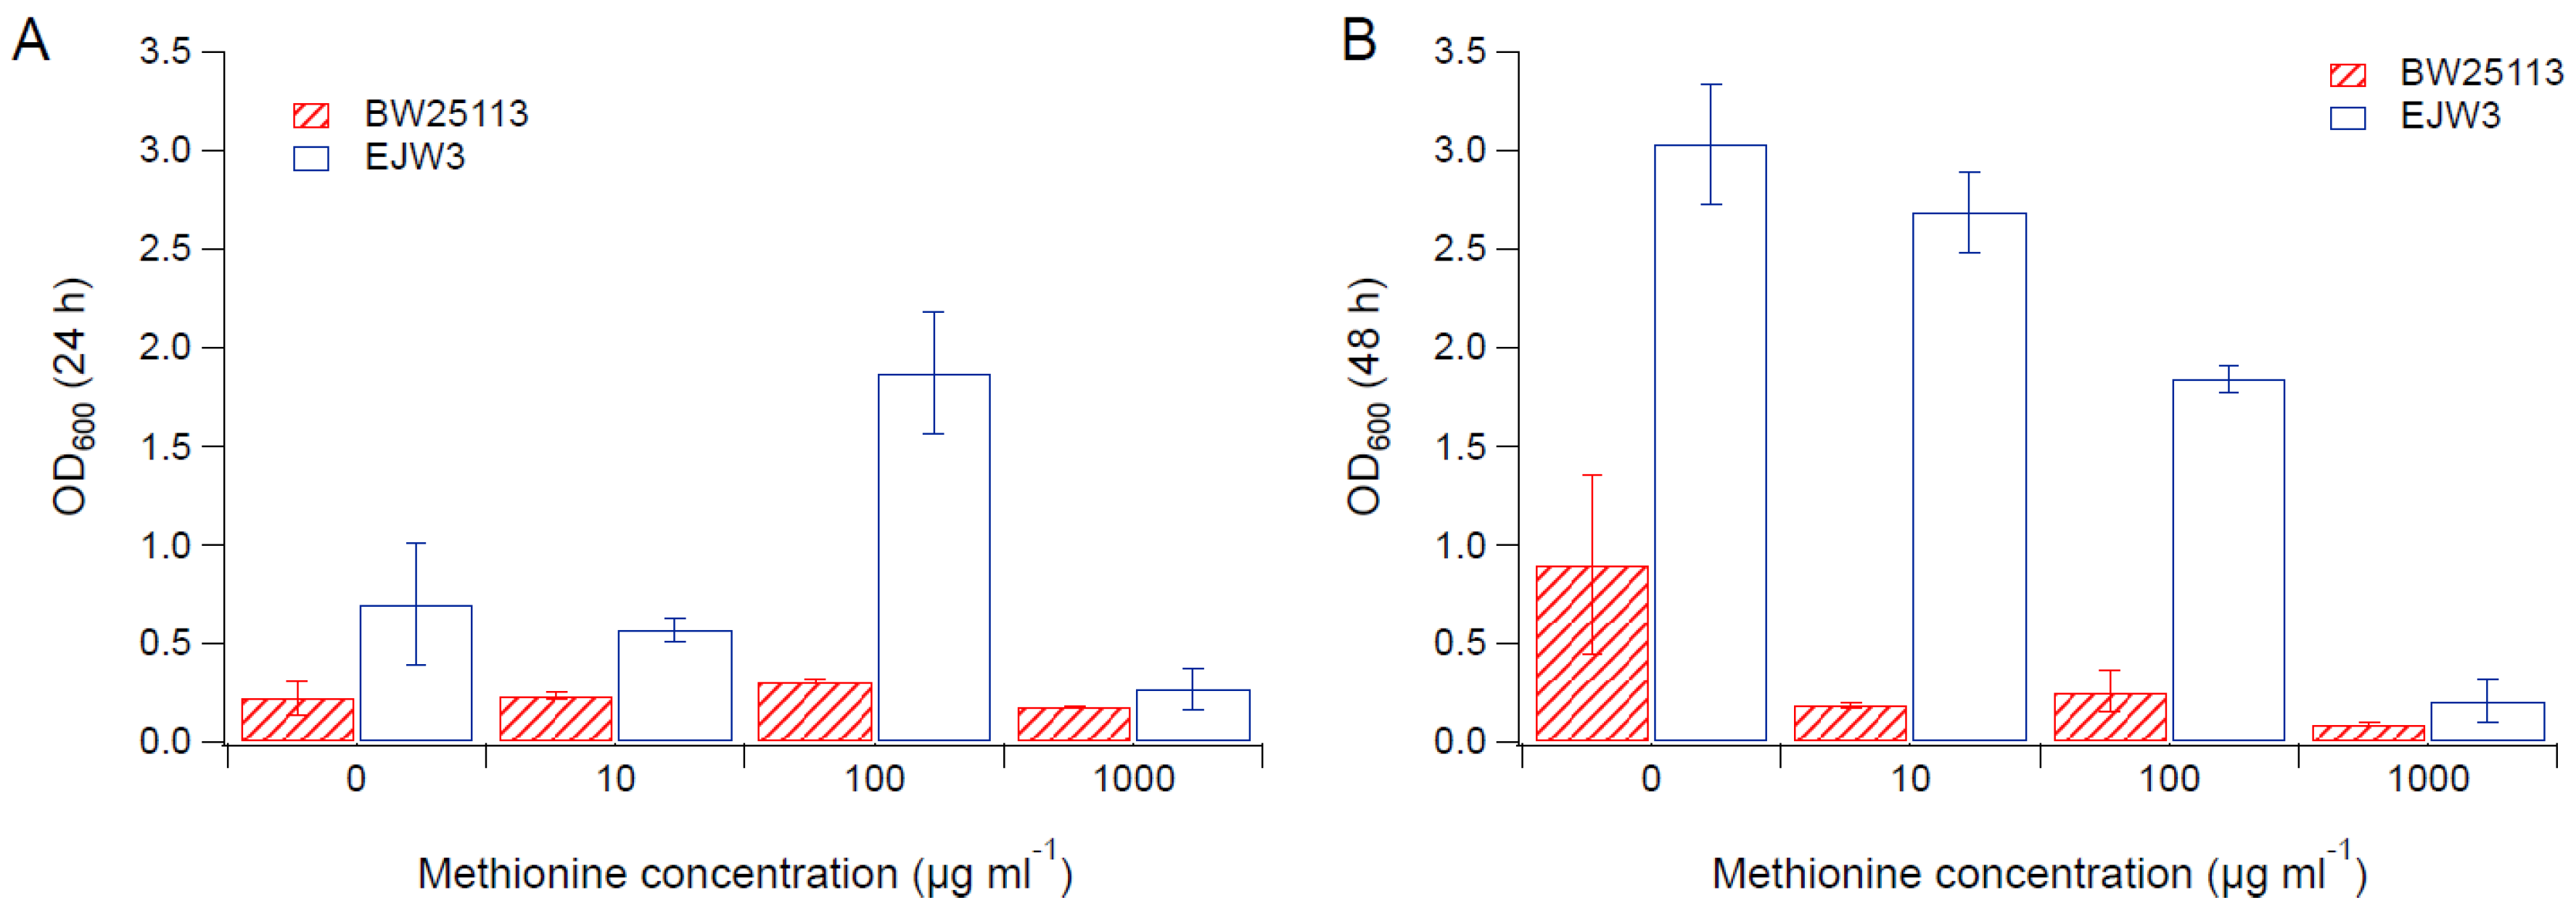
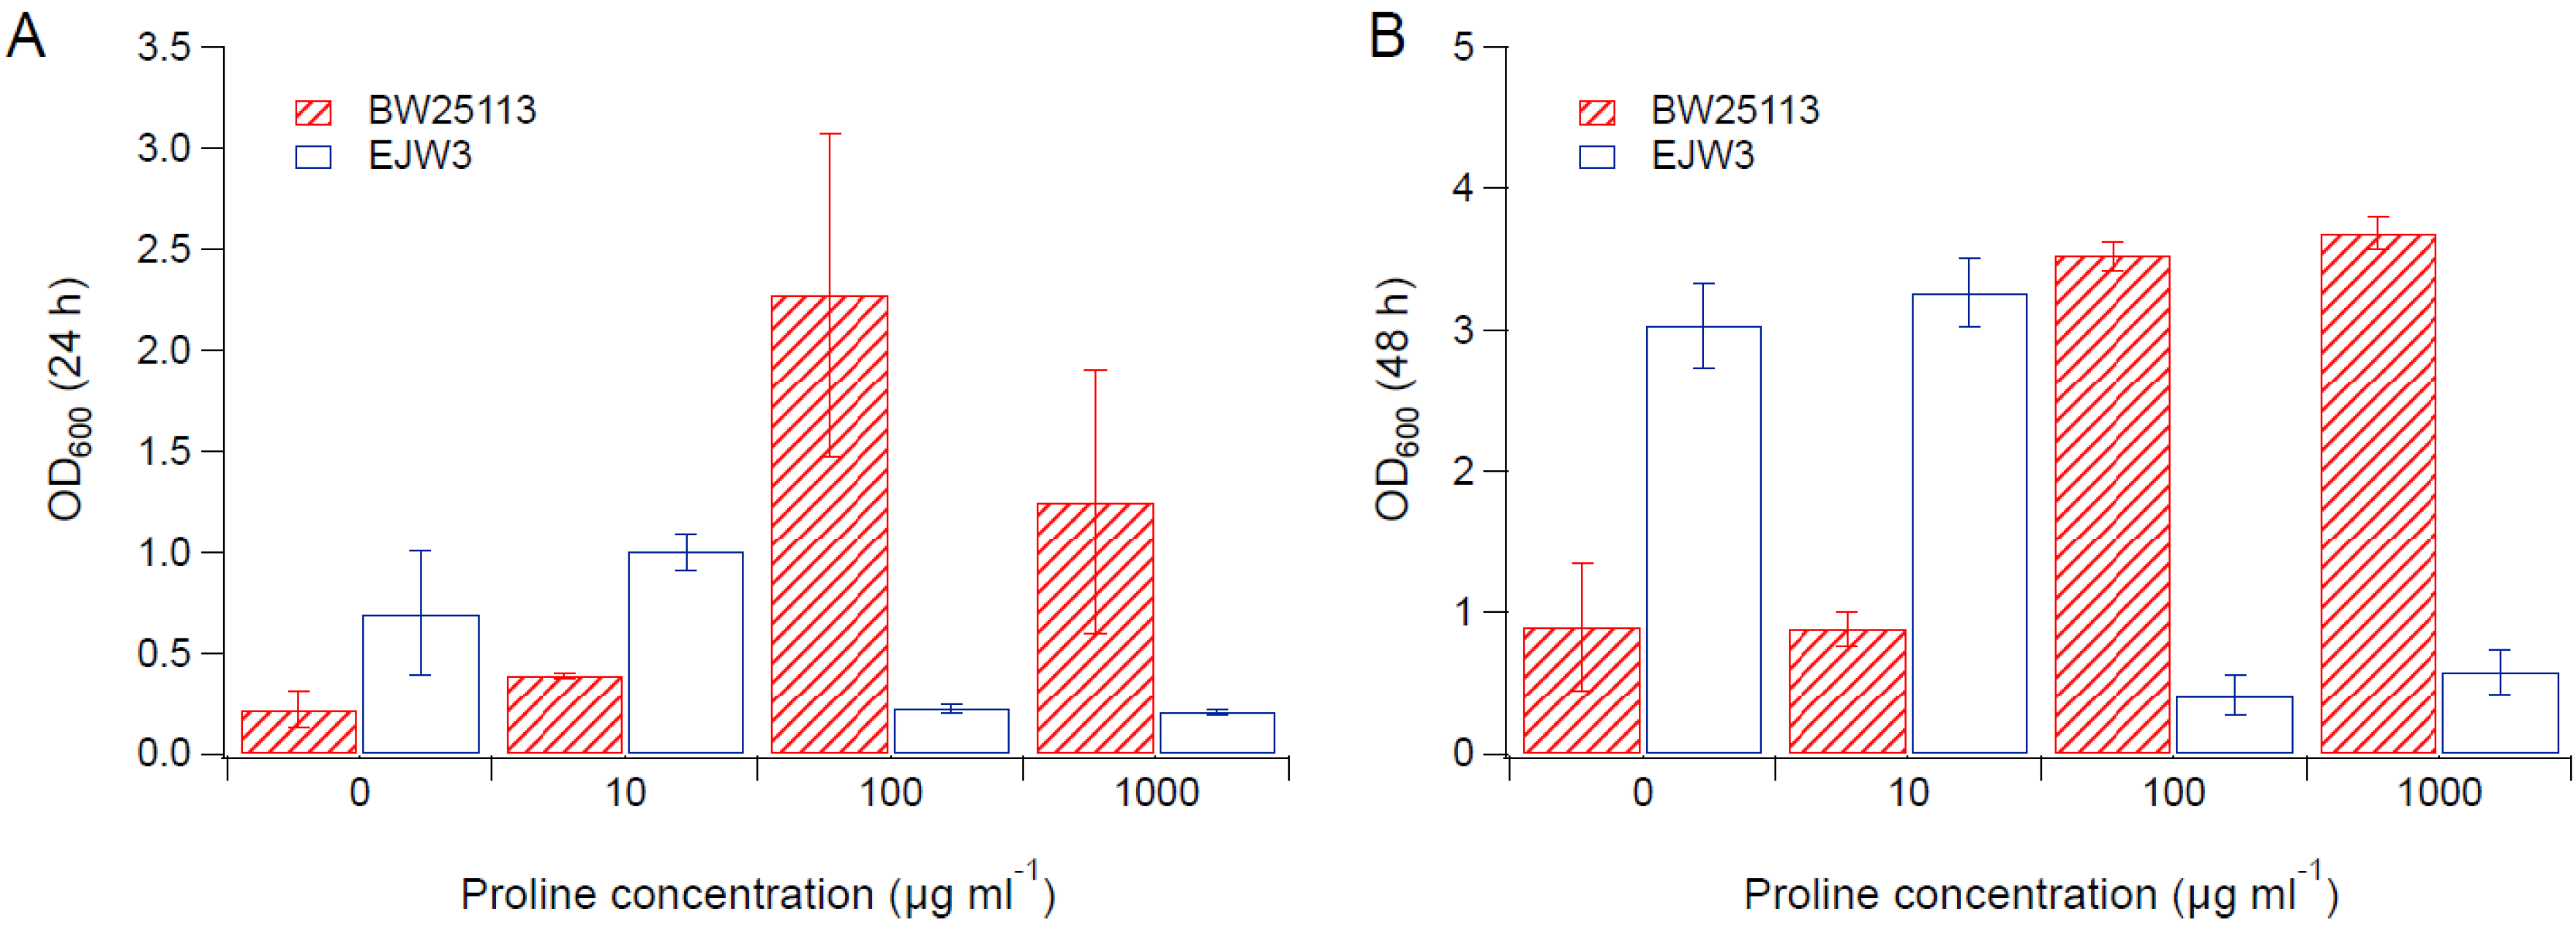
Since we observed an improvement in growth performance under osmotic stress with tryptophan supplementation, and prior work have reported the impact of some amino acids (e.g., glutamic acid, proline) on osmotic stress response [15,38], we hypothesized that there are additional amino acids that also play a role in osmotic tolerance in E. coli. Thus, we assessed the impact of individual amino acid supplementation on osmotic tolerance of BW25113 and EJW3. Preliminary data with tryptophan supplementation showed a more observable benefit in the presence of higher NaCl concentration, therefore a higher osmotic stress with 0.65 M NaCl was used. The summary of amino acid supplementation on optical cell density (OD600) is listed in Table S6. With a few exceptions (valine, methionine, proline, alanine), the addition of 10 µg mL−1 or 100 µg mL−1 of most amino acids tested significantly improved the growth of both BW25113 and EJW3 under osmotic stress. This may be partially due to the decreased ATP requirements for amino acid biosynthesis when these amino acids are supplemented [39], which also is the likely reason that higher osmotic tolerance is observed when E. coli is grown in rich media rather than in minimal media without amino acids. However, higher concentrations of some amino acids (e.g., serine, cysteine, threonine, isoleucine, and leucine) reduced growth, likely due to feedback inhibition. Interestingly, the addition of 100 µg mL−1 methionine appears to result in a faster accumulation of biomass (based on the higher biomass concentration at 24 h), but a 39% lower final biomass (p-value < 0.001) after 48 h in strain EJW3. However, the addition of 100 µg mL−1 methionine led to a 72% lower final biomass (p-value < 0.001) in BW25113 after 48 h, which suggests a higher feedback inhibition of methionine in strain BW25113 compared with EJW3 (Figure 3). The supplementation of methionine has been reported to improve the tolerance to NaCl in Saccharomyces cerevisiae [40], but has not been reported in E. coli. Our results suggest potential synergy between the rpoC mutation and methionine supplementation on osmotic tolerance in E. coli. The supplementation with 100 µg mL−1 and 1000 µg mL−1 of proline (Figure 4) or with 1000 µg mL−1 of alanine (Figure 5) resulted in significant growth inhibition in EJW3, but were beneficial to BW25113, in the presence of osmotic stress. This led us to hypothesize that EJW3 may produce more proline and alanine, making it more sensitive to additional supplementation of these two amino acids, compared with BW25113. Proline has been reported as an osmoprotectant in E. coli [38,41] and other microorganisms [42]. Thus, the overproduction of proline may be one of the causes that contribute to the higher osmotic tolerance in EJW3.
3.3. Metabolite Analysis
In order to test our hypothesis that rpoC K370_A396dup mutation led to an overproduction of some amino acids such as proline and alanine, and to identify other potential effects of the mutation on the production of other metabolites, extracellular and intracellular metabolites of BW25113 and EJW3 during late exponential phase (OD600 about 0.7–1.0) in the presence and absence of osmotic stress were analyzed. The results are shown in Table 4, Table 5, Tables S7 and S8. The results showed that strain EJW3 produced ~22% more intracellular (p-value < 0.001) and ~50% more extracellular (p-value < 0.001) proline than BW25113 in the absence of hyperosmotic stress, while the exposure to 0.6 M NaCl led to increased intracellular amount of proline in both strains and extracellular amount of proline produced by BW25113. Prior study has shown the overproduction of proline to confer enhanced osmotic stress tolerance [43]. Since the inoculum used in our study were prepared without the addition of excess NaCl, the EJW3 culture likely contained higher initial intracellular proline than BW25113, which may result in early protection to EJW3 from the inhibition of 0.6 M NaCl. Glutamic acid has been found to accumulate in osmotically stressed cells and serves as an osmoprotectant [15]. Consistent with prior work, results from our experiment also showed an increase in glutamic acid production under osmotic stress in both BW25113 and EJW3 strains. However, EJW3 appears to accumulate more glutamic acid intracellularly, as the intracellular level of glutamic acid was ~24% higher (p-value = 0.006), while the extracellular concentration was ~62% lower (p-value < 0.001) in EJW3 compared with BW25113. This suggests that EJW3 may be better at accumulating glutamic acid intracellularly under osmotic stress due to reduced export of the amino acid into the bulk medium. A similar trend was observed with arginine levels, with both strains producing more arginine in the presence of osmotic stress, and EJW3 maintaining ~56% higher intracellular arginine concentration (p-value < 0.001) compared with the wild-type (Table 5). It has also been reported that cold osmotic shock reduced the ability of E. coli to accumulate arginine [44]. The ability of EJW3 to produce and accumulate more arginine than BW25113 may also contribute to its higher osmotic tolerance. Alanine is known to be an important osmolyte in many organisms [45], but thus far has not been reported to serve as an osmolyte in E. coli. Our results showed that the production of alanine decreased under osmotic stress in both strains, but the intracellular concentration was ~86% higher in EJW3 than in BW25113 (p-value = 0.001). Though the production of alanine did not increase in response to osmotic stress, the data suggests that biosynthesis of this amino acid was not significantly inhibited in EJW3 in the presence of osmotic stress compared with BW25113. In addition to known amino acids that are perturbed by osmotic stress in bacteria, our results showed that the production of methionine, tyrosine, tryptophan, phenylalanine and isoleucine were also perturbed by osmotic stress and the rpoC mutation (Tables S7 and S8).
Trehalose is one of the most well-known osmoprotectants. Prior reports showed increased production of trehalose in response to osmotic stress to prevent water loss and to maintain the intracellular pressure of the cells [15,18]. We found that the intracellular concentration of trehalose under osmotic stress to be ~37% higher in EJW3 than BW25113 (p-value = 0.005), which may be another reason for the higher osmotic tolerance conferred by the rpoC mutation.
In addition to known osmoprotectants and amino acids, we also compared the intracellular and extracellular levels of organic acids between the two strains. The results showed a 30%–40% higher extracellular acetic acid concentration in EJW3 cultures (p-value < 0.001) with or without osmotic stress challenge. However, EJW3 showed a ~40% lower intracellular acetic acid concentration in the absence of (p-value < 0.001), and a similar level of intracellular acetic acid concentration in the presence of (p-value = 0.137) hyperosmotic stress. Taking into account the relative total volume of extracellular versus intracellular metabolites collected (a ratio of 100:1.5), the total amount of acetic acid produced by EJW3 (370 ± 20 µg mL−1 OD600−1) was about 30% higher (p-value < 0.001) than that of BW25113 (290 ± 20 µg mL−1 OD600−1). During growth on glucose as carbon source, the acetate secretion of E. coli has been shown to depend on growth rate [46,47], thus the higher level of extracellular acetic acid in strain EJW3 may not be a direct consequence of the rpoC mutation but a side effect of the higher growth rate of the rpoC mutant under osmotic stress. However, it is possible that the higher acetic acid production may also contribute to the higher osmotic tolerance of EJW3.
3.4. Effect of Acetic Acid on Osmotic Stress Tolerance
To determine the role acetic acid plays on osmotic tolerance, we compared the growth kinetics of BW25113 and EJW3 in the presence of 10 mM acetic acid in M9 with or without the supplementation of 0.6 M NaCl. In the absence of osmotic stress, the addition of 10 mM acetic acid showed no significant impact on the growth of either strain (Figure 6A). However, the addition of acetic acid significantly improved the growth of BW25113 but only had a moderate impact on the growth of EJW3 in the presence of NaCl challenge (Figure 6B). Under higher osmotic stress with 0.7 M NaCl, acetic acid addition still had a benefit on the growth of BW25113, and showed a moderate benefit on the growth of EJW3 (Figure 6C). Prior work has shown that moderate concentration of NaCl can protect E. coli from acetic acid toxicity [48]; here we show that the cross tolerance is reciprocal, that moderate concentrations of acetic acid can also protect E. coli from NaCl stress. Interestingly, a statistically significant overlap (p < 10−20, Fisher’s exact test) between metabolites level changes in organic acid and osmotolerant E. coli mutants has been detected using an updated version of the Resistome combined with a recent genome-wide survey of genotype–metabolite relationships [49,50], providing additional evidence that the improved osmotic tolerance of EJW3 may also result from the higher production of acetic acid.
3.5. Cell Membrane Damage Analysis
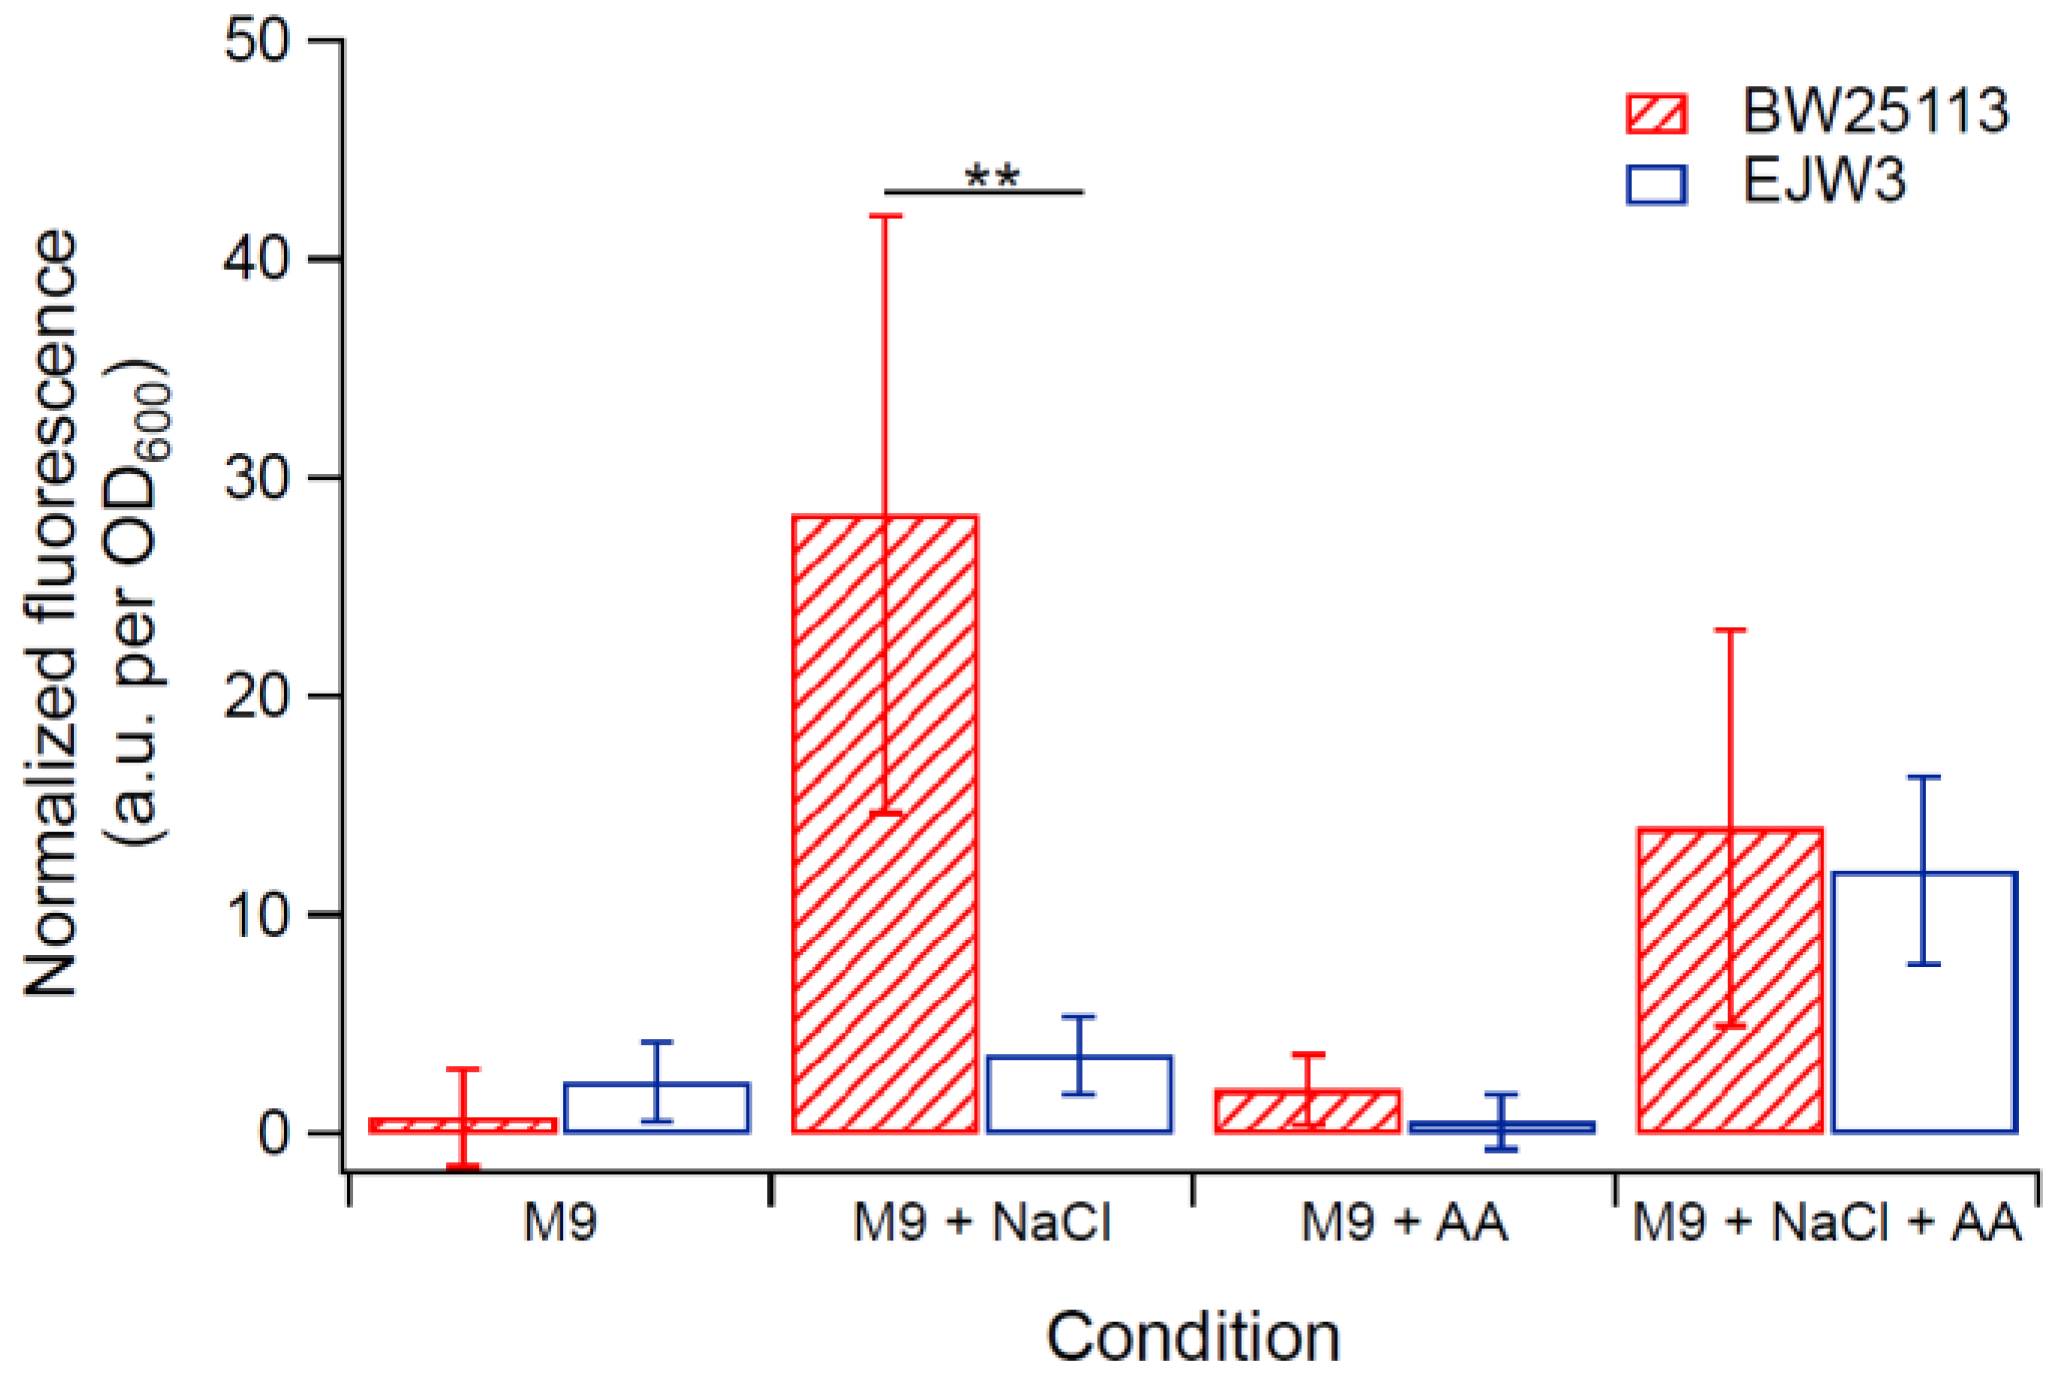
As osmotic stress perturbs the membrane, propidium iodide (PI) assay was used to assess any differences in membrane perturbation between BW25113 and EJW3 in the presence of hyperosmotic stress in different growth phases. Propidium iodide is a fluorescent molecule that normally cannot penetrate into cells with intact membrane [51,52]; however, if the membrane integrity is compromised, the uptake of PI increases, and can be used to assess relative levels of membrane perturbation. In order to detect differences within a short-term challenge, a higher hyperosmotic stress with 0.7 M NaCl was used in this test. The membrane integrity of both strains was assessed after a 30-min exposure to (1) M9 only, (2) M9 supplemented with 0.7 M NaCl, (3) M9 supplemented with 10 mM acetic acid, and (4) M9 supplemented with 0.7 M NaCl and 10 mM acetic acid. Cells in either lag phase (OD600 ~ 0.1), exponential phase (OD600 ~ 0.8) or stationary phase (OD600 ~ 3.0) were tested. Low levels of PI staining were observed in both strains in lag phase and stationary phase cells with or without NaCl challenge (Figure S2), suggesting no major membrane perturbation by NaCl challenge during these non-growth phases. However, in exponential growing cells, BW25113 showed significantly higher PI staining than EJW3 (Figure 7) under 0.7 M NaCl challenge, suggesting a lower level of membrane perturbation in the rpoC mutant under hyperosmotic stress. While our data showed that addition of 10 mM acetic acid improved growth of BW25113 in hyperosmotic stress (Figure 6), PI staining data revealed that the addition of acetic acid conferred no benefit to the hyperosmotic stress induced membrane perturbation in either strain, which suggests that the benefit of acetic acid to osmotic tolerance is not related to membrane integrity.
3.6. Transcriptional Profile Analysis
RpoC is the β’ subunit of the RNA polymerase complex, and plays roles in promoter recognition, sigma factor binding and ion chelation [53,54,55]. The rpoC K370_A396dup mutation is located in domain 2 (amino acid residues 344–486) of the RpoC subunit [56], close to the clamp (amino acid residues 14–342) and the NADFDGD (amino acid residues 458–464) motif which is involved in Mg2+ binding [55,57]; thus, this mutation in rpoC may impact transcriptional initiation and elongation [58,59]. Furthermore, the 3-D structure of the RNA polymerase places the K370_A396dup mutation in close proximity to the proposed binding site of guanosine tetraphosphate (ppGpp) (amino acid residues 362, 417) [60,61,62], which is a global regulator involved in stringent response [63]. Thus, the rpoC K370_A396dup mutation is expected to have global impact on the transcriptional regulation of the cell; therefore, the transcriptional differences in BW25113 and EJW3 can potentially be used to identify new molecular mechanisms of osmotolerance in E. coli. Thus, we compared the transcriptional profiles between EJW3 and BW25113 in M9 with or without 0.6 M NaCl challenge to identify any transcriptional regulatory differences that may lead to new findings on molecular mechanisms for osmotic tolerance. The transcriptional data showed that most genes upregulated in strain EJW3 under osmotic stress are related with amino acids metabolism, which corroborated with our data from amino acid supplementation and metabolite analysis; and the genes downregulated are related with membrane composition and transporters.
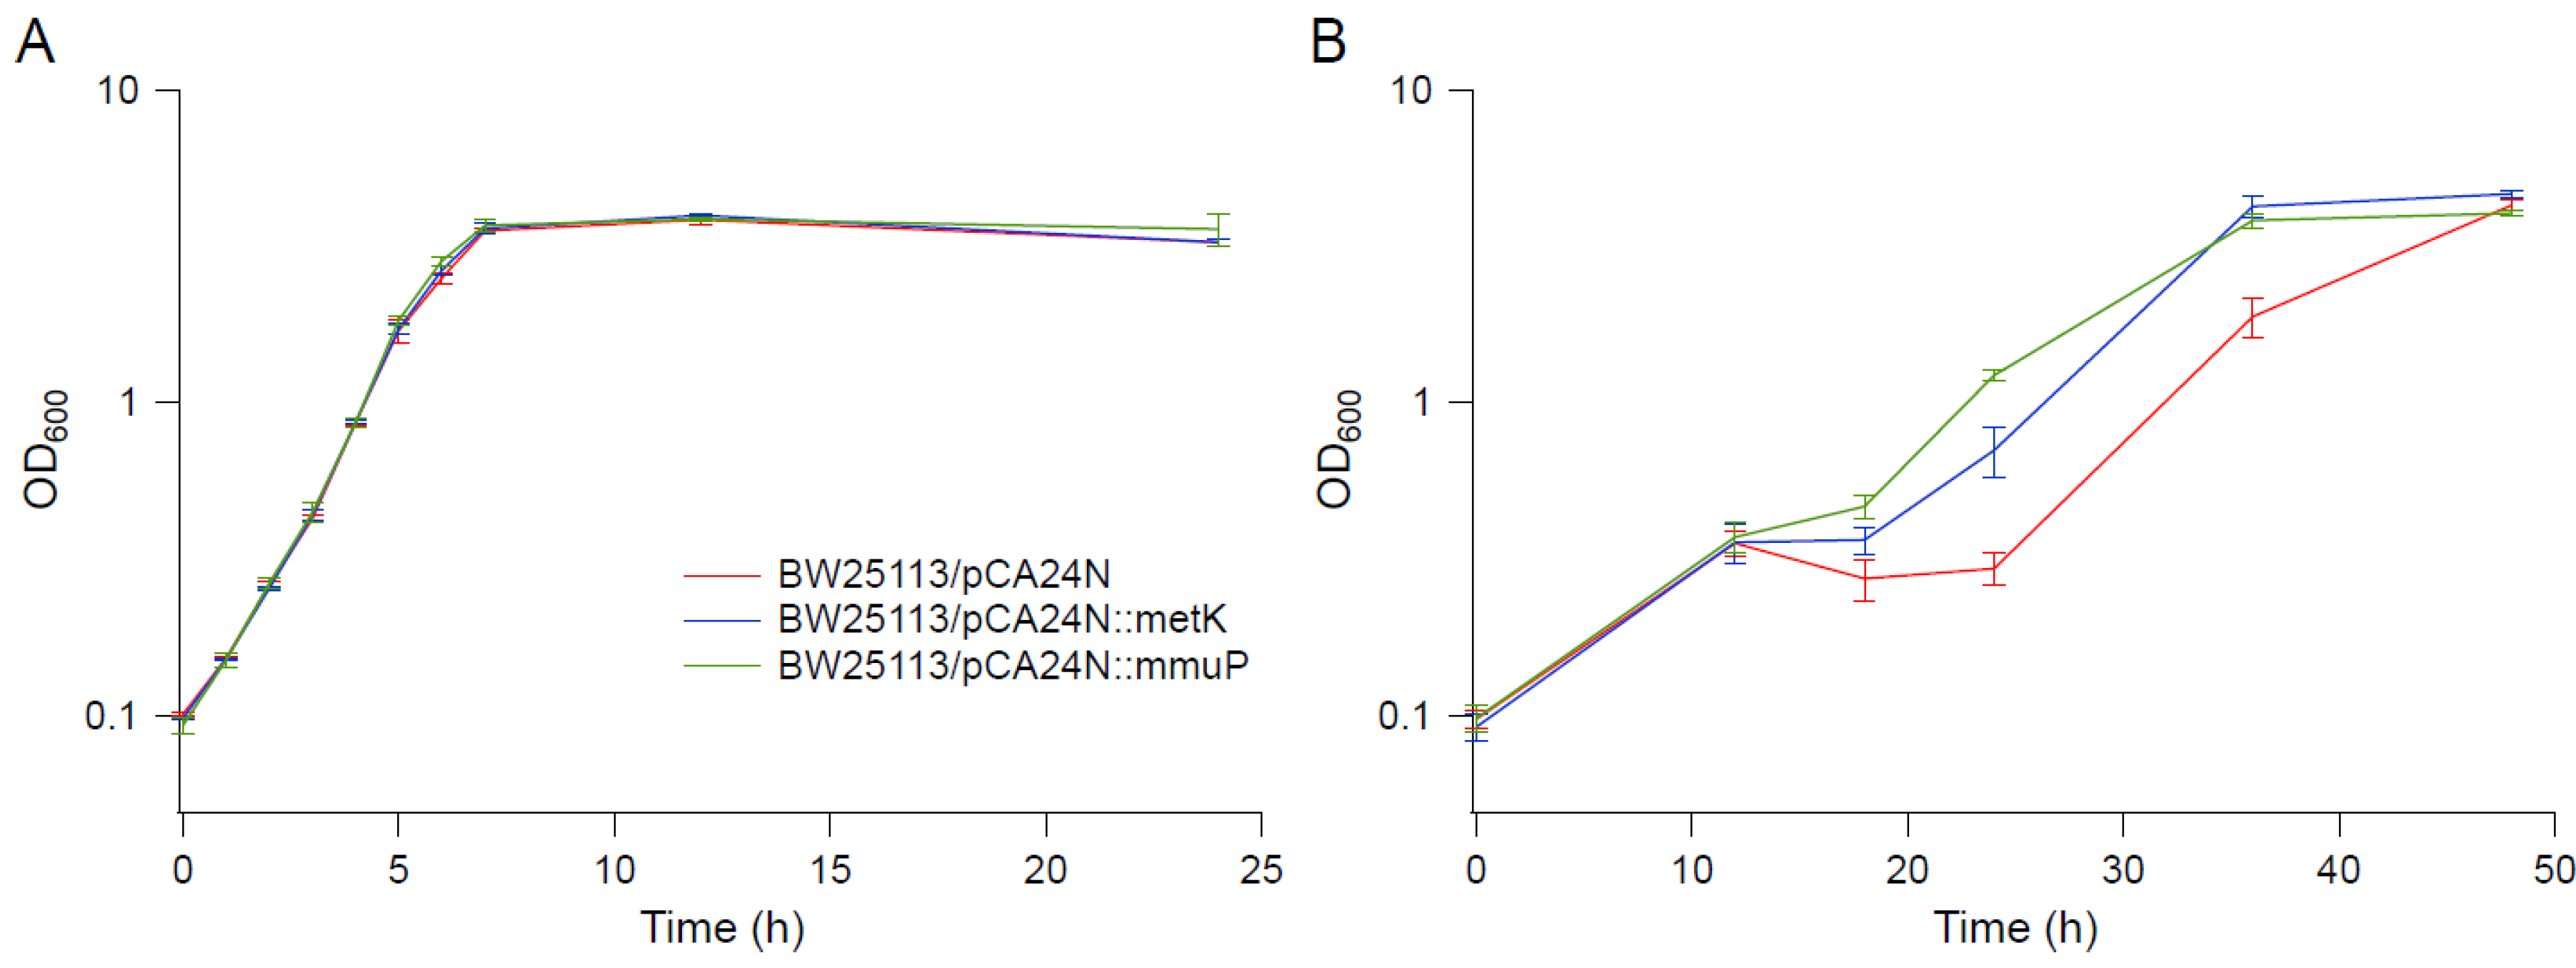
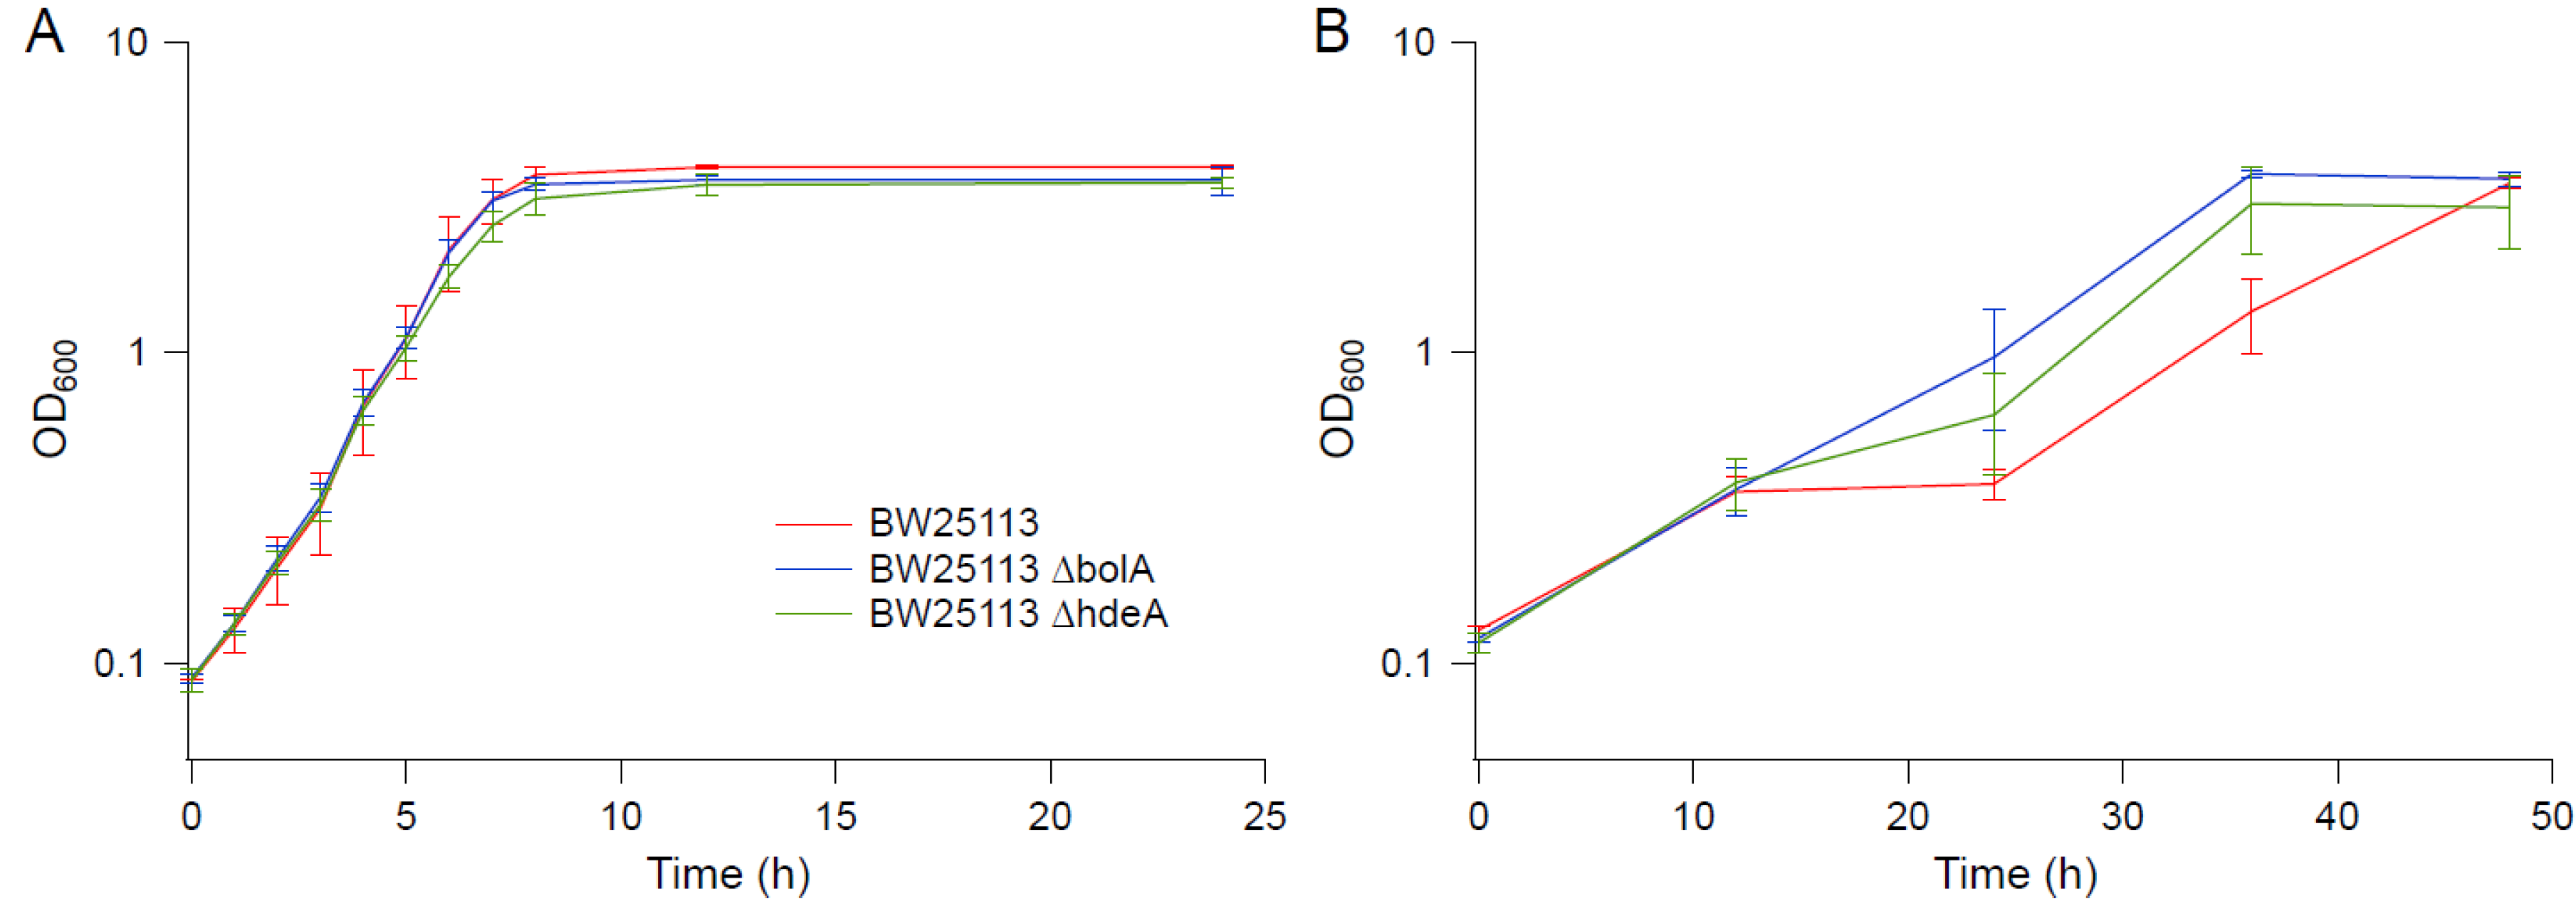
Several genes upregulated in strain EJW3 under osmotic stress were chosen for further validation for their role in osmotic tolerance in the rpoC K370_A396dup background. The selected genes (Table S9) are involved in amino acids metabolism and were chosen based on results from the amino acid supplementation and metabolite analysis. These genes were overexpressed in BW25113 by using clones from the ASKA collection [35], and the growth kinetics of the overexpression strains were compared against the control expressing the empty plasmid in M9 with or without NaCl supplementation. To avoid potential toxicity associated with high level gene expression, basal level expression (without Isopropyl β-D-1-thiogalactopyranoside (IPTG) induction) and a lower osmotic stress (0.55 M NaCl) were used. Among the genes tested, only the overexpression of metK and mmuP significantly improved the performance of BW25113 under osmotic stress. The overexpression of metK and mmuP did not impact the growth of BW25113 in the absence of hyperosmotic stress, but rather conferred a benefit in the presence of 0.55 M NaCl (Figure 8). This suggests that the osmotic tolerance conferred by the rpoC mutation in BW25113 is partially due to the upregulation of metK and mmuP. MetK encodes the methionine adenosyltransferase that catalyzes the formation of the S-adenosylmethionine (AdoMet) [64], which is involved in many biological reactions. It plays important roles as donors of methyl, sulfur, and aminopropyl groups, thus is frequently involved in the regulation of gene expression, including genes involved in methionine metabolism [65,66,67,68], but was not known to be related to osmotolerance. MmuP is a transporter of S-methylmethionine, which can be used by E. coli as a source of methionine when externally provided [69]. S-methylmethionine is widely produced by plants and can be used as an osmoprotectants in plants [70], but it has not been reported as an osmoprotecant in E. coli. As E. coli is not known to produce S-methylmethionine, nor did we supplement S-methylmethionine into the media, in this case, the impact of mmuP on osmotic tolerance is not obvious. Stress response genes bolA and hdeA are downregulated in the BW25113 rpoC mutant, and the deletion of bolA and hdeA improved the growth of BW25113 in the presence of 0.6 M NaCl (Figure 9). BolA is a transcriptional regulator involved in regulating cell morphology related genes, and is known to be involved in general stress response and has been reported to be overexpressed under osmotic stress [71]; however, the mechanism of how it is involved in osmotic tolerance remains unclear. HdeA is a periplasmic acid stress chaperone which plays a role in resistance to low pH [72,73], and it is not known to be related to osmotic tolerance.
As stated previously, the K370_A396dup mutation is close to the proposed ppGpp binding site on RpoC [60,61,62]. PpGpp is known to be involved in stringent response upon nutrition starvation or other stress conditions, and has global impact on gene expression [63,74]. It regulates transcriptional initiation directly by binding to an interface between the β′ and ω subunit of the RNA polymerase, or indirectly by altering sigma factor availability, and it also indirectly affects translation and DNA replication [74,75]. It has recently been reported that the supplementation of serine hydroxamate (SHX), which induces production of ppGpp, increased osmotic tolerance of ppGpp-proficient E. coli, which was not observed in ppGpp-deficient cells, demonstrating that ppGpp is involved in osmotic tolerance [76]. Furthermore, an RpoC Δ312–315 mutation was previously found to suppress the ppGpp deficiency phenotypes [77]. Since the rpoC K370_A396dup mutation falls outside the amino acid residues known to impact RpoC interaction with ppGpp, any relationship between the rpoC K370_A396dup mutation and ppGpp remains to be investigated.
3.7. Impact of the rpoC Mutation in MG1655
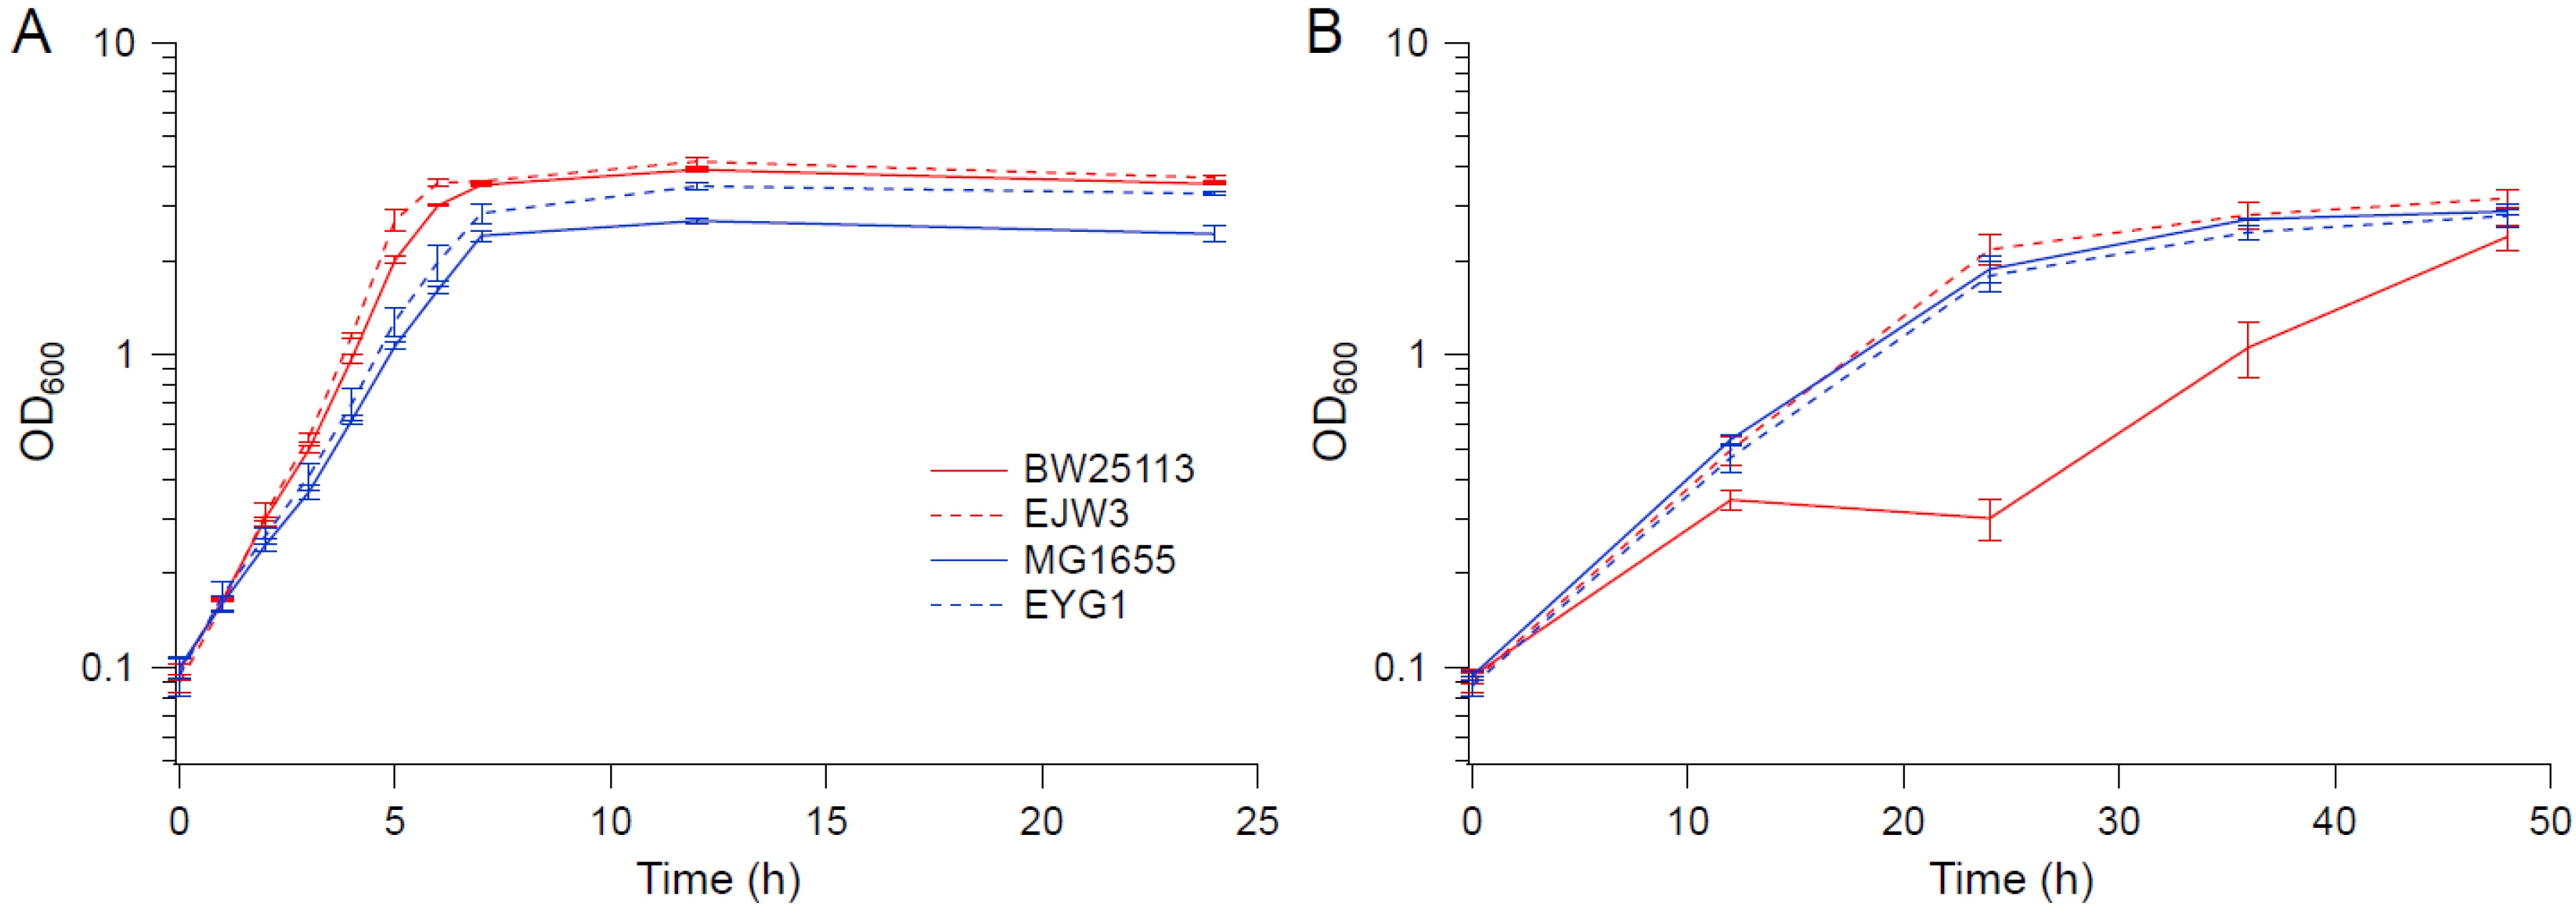
To determine whether the rpoC mutation exhibits a similar benefit to osmotic stress tolerance in other E. coli K-12 strains, the rpoC mutation was reconstructed in MG1655 to generate strain EYG1. The osmotic tolerance of MG1655 and EYG1 were assessed in M9 with or without challenge with 0.6 M NaCl (shown in Figure 10A,B, respectively). In contrast to BW25113, the rpoC K370_A396dup mutation did not confer a benefit to MG1655 under osmotic stress. Though the growth of both MG1655 and EYG1 were slower than BW25113 in M9 in the absence of hyperosmotic stress (Figure 10A), their growths were nearly identical to EJW3 under osmotic stress (Figure 10B), suggesting that the inherent tolerance of MG1655 to NaCl was higher than BW25113, and led us to use a higher NaCl concentration with subsequent assays with MG1655.
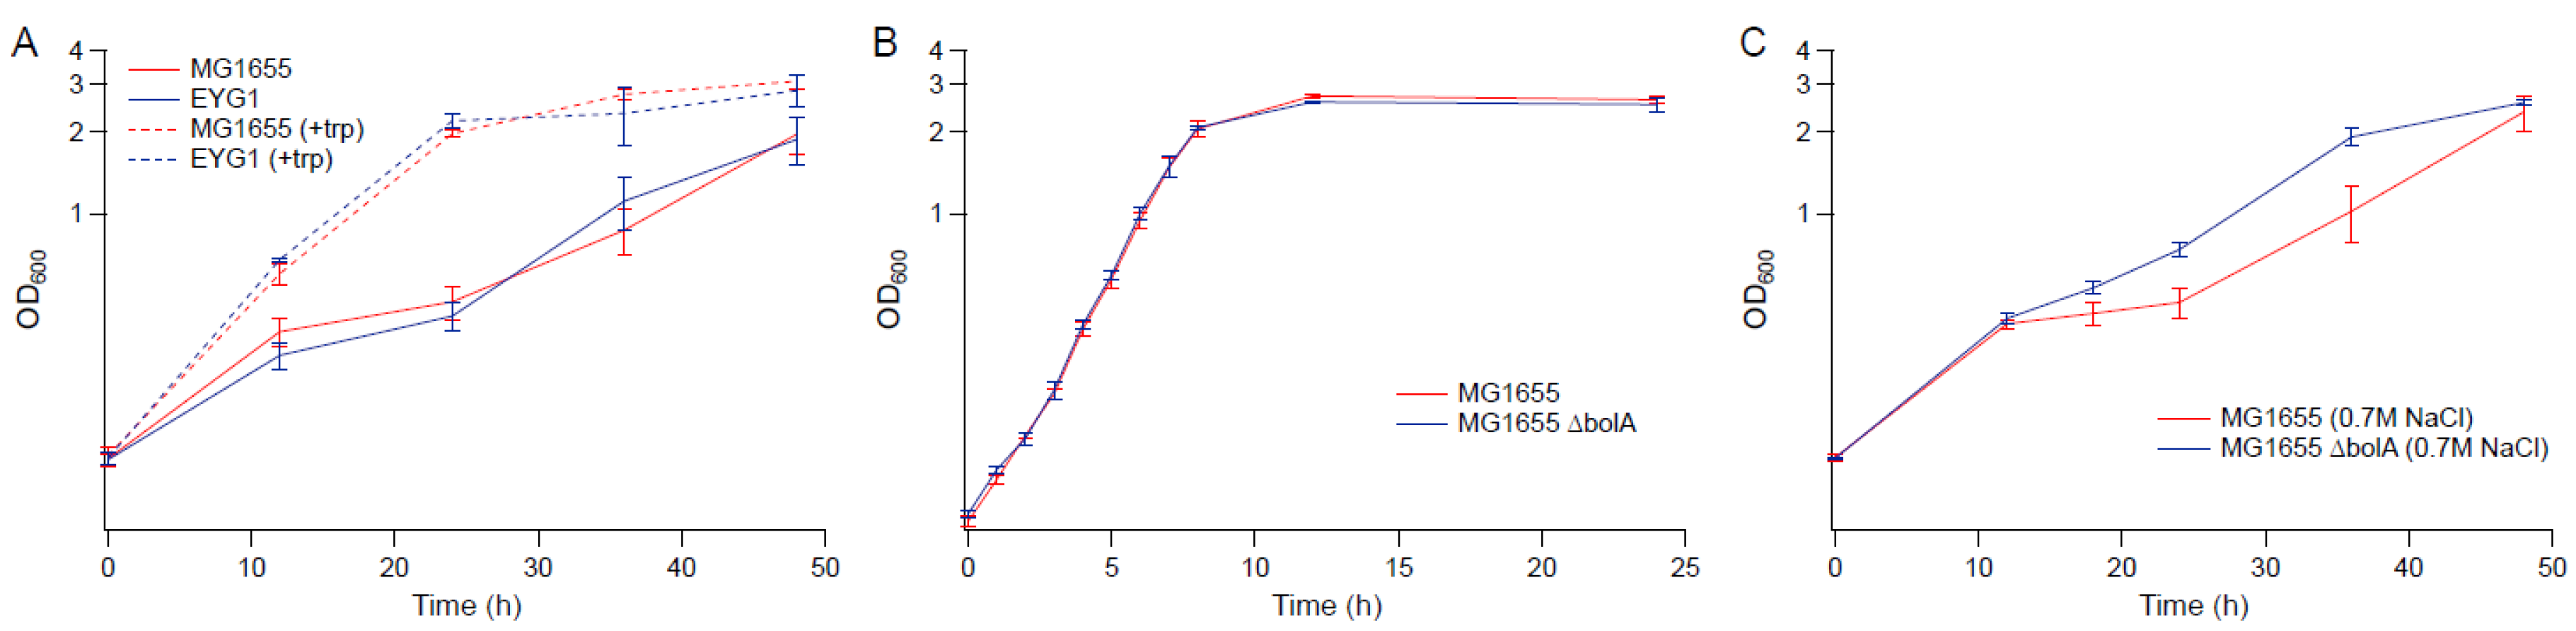
As we found tryptophan supplementations to benefit BW25113 in the presence of hyperosmotic challenge, we also assessed its potential benefit in MG1655. In the presence of 0.7 M NaCl, addition of tryptophan to the medium increased the osmotic tolerance of MG1655 and EYG1 (Figure 11A). The deletion of bolA also improved the growth of MG1655 under osmotic stress with 0.7 M NaCl (Figure 11B,C), which suggests that although the impact of the rpoC mutation on osmotic tolerance appears to be strain specific, some of the findings based on BW25113 also applies to MG1655.
We also compared the transcriptional profiles between MG1655 and EYG1 (MG1655 background) in M9 with or without 0.6 M NaCl challenge to identify any transcriptional regulatory differences caused by the rpoC mutation between MG1655 and BW25113 background. The microarray data showed that the rpoC mutation caused significantly different transcriptional perturbation between these two strain backgrounds, with few similarities shared between strains and conditions. As mentioned previously, most genes upregulated in strain EJW3 under osmotic stress are related with amino acids metabolism; however, in EYG1 (MG1655 background), most amino acids metabolism and transport related genes perturbed by the rpoC mutation were downregulated (Table S10). This difference between strains EJW3 and EYG1 likely explains the different physiological impacts of the rpoC mutation on osmotic tolerance between BW25113 and MG1655.
4. Conclusions
In this work, we confirmed that the in-frame, 84 bp duplication in rpoC (K370_A396dup) does indeed contribute to osmotic tolerance of E. coli. The rpoC K370_A396dup mutation was reconstructed in the BW25113 background (EJW3), and the rpoC mutant performed much better than the wild-type strain under osmotic stress. From individual amino acid supplementation studies, we found several additional amino acids (e.g., tryptophan, phenylalanine, etc.) to play a role in improving osmotic tolerance in E. coli. Results from metabolite analysis revealed differences in intracellular and extracellular metabolites between the wild-type and rpoC mutant, suggesting alterations in metabolism may be partially responsible for the enhanced hyperosmotic tolerance in the mutant. Compared with the wild-type strain, EJW3 produced and accumulated more known osmoprotectants (trehalose, proline, and glutamic acid) in response to hyperosmotic stress. In addition to known osmolytes, EJW3 also produce approximately 30% more acetic acid than BW25113. Subsequent supplementation studies confirmed that the addition of moderate concentration of acetic acid helps to improve the performance of BW25113 under hyperosmotic stress; which supported the theory that the higher production of acetic acid is likely related with the osmotic tolerance conferred by the rpoC (K370_A396dup) mutation. Membrane damage analysis using PI staining showed a lower effect on membrane integrity in the presence of hyperosmotic stress in rpoC mutants that are actively growing (in exponential growth phase). Transcriptional analysis demonstrated that the rpoC mutation indeed impacted relative transcript abundance of genes related with amino acids metabolism, including metK and mmuP. When overexpressed in BW25113, metK and mmuP conferred enhanced osmotic tolerance, providing further validation that methionine metabolism is involved in enhanced hyperosmotic tolerance in the rpoC mutant. Deletion of stress response genes bolA and hdeA also improved growth of BW25113 under osmotic stress, and the benefit of bolA deletion on osmotic tolerance also applies to MG1655. Other genes perturbed by the rpoC mutation in BW25113 and the synergistic effects of those genes remain to be investigated. In conclusion, the work demonstrated that the impacts of this particular rpoC mutation on E. coli metabolism and membrane integrity related with osmotic tolerance, and although the impacts of rpoC mutation appeared to be strain dependent, some of the findings in BW25113 also apply to another K-12 strain. Results from this work can help to identify targets for metabolic engineering of E. coli for enhanced tolerance to alternative feedstocks and water sources.
Supplementary Materials
The supplementary materials are available online at https://www.mdpi.com/2306-5354/4/3/61/s1, Table S1: Reagents used in analysis of amino acids, Table S2: Injection program, Table S3: Mobile phase gradients, Table S4: Growth in micro-aerobic condition in M9 supplemented with 0.9 M NaCl, Table S5: Growth in aerobic condition in M9 supplemented with 0.8 M NaCl , Table S6: Cell density (OD600) in M9 supplemented with 0.65 M NaCl and amino acids, Table S7: Quantification of intracellular and extracellular metabolites in M9, Table S8: Quantification of intracellular and extracellular metabolites in M9 supplemented with 0.6 M NaCl, Table S9: Upregulated genes selected for validation for their roles in osmotic tolerance, Table S10: Gene ontology analysis in M9 supplemented with 0.6 M NaCl, Figure. S1: Light microscopy of cells in the presence or absence of hyperosmotic stress, Figure. S2: Membrane integrity assay using PI staining. (A) lag phase cells. (B) Early stationary phase cells. (C) Late stationary phase cells. NaCl: 0.7 M NaCl. AA: 10 mM acetic acid. Error bars are standard deviations.
Acknowledgments
We thank Jessica Lima for her assistance in data collection and the Norman Hackerman Foundation (Project No. 000512-0004-2011) and National Science Foundation (MCB-1054276) for partial financial support.
Author Contributions
Y.G. performed the experiments, analyzed the data and drafted the manuscript. J.W. performed some of the experimental work. K.C.K. and J.W. revised the manuscript. All authors have read and approved the final manuscript.
Conflicts of Interest
The authors declare no conflict of interest.
References
- Pleissner, D.; Neu, A.K.; Mehlmann, K.; Schneider, R.; Puerta-Quintero, G.I.; Venus, J. Fermentative lactic acid production from coffee pulp hydrolysate using Bacillus coagulans at laboratory and pilot scales. Bioresour. Technol. 2016, 218, 167–173. [Google Scholar] [CrossRef] [PubMed]
- Saini, J.K.; Saini, R.; Tewari, L. Lignocellulosic agriculture wastes as biomass feedstocks for second-generation bioethanol production: Concepts and recent developments. 3 Biotech 2015, 5, 337–353. [Google Scholar] [CrossRef] [PubMed]
- Salvachua, D.; Smith, H.; St John, P.C.; Mohagheghi, A.; Peterson, D.J.; Black, B.A.; Dowe, N.; Beckham, G.T. Succinic acid production from lignocellulosic hydrolysate by Basfia succiniciproducens. Bioresour. Technol. 2016, 214, 558–566. [Google Scholar] [CrossRef] [PubMed]
- Li, C.; Lesnik, K.L.; Liu, H. Microbial conversion of waste glycerol from biodiesel production into value-added products. Energies 2013, 6, 4739–4768. [Google Scholar] [CrossRef]
- Przystalowska, H.; Zeyland, J.; Szymanowska-Powalowska, D.; Szalata, M.; Slomski, R.; Lipinski, D. 1,3-propanediol production by new recombinant Escherichia coli containing genes from pathogenic bacteria. Microbiol. Res. 2015, 171, 1–7. [Google Scholar] [CrossRef] [PubMed]
- Piotrowski, J.S.; Zhang, Y.; Bates, D.M.; Keating, D.H.; Sato, T.K.; Ong, I.M.; Landick, R. Death by a thousand cuts: The challenges and diverse landscape of lignocellulosic hydrolysate inhibitors. Front. Microbiol 2014, 5, 90. [Google Scholar] [CrossRef] [PubMed]
- Rumbold, K.; van Buijsen, H.J.; Overkamp, K.M.; van Groenestijn, J.W.; Punt, P.J.; van der Werf, M.J. Microbial production host selection for converting second-generation feedstocks into bioproducts. Microb. Cell Fact. 2009, 8, 64. [Google Scholar] [CrossRef] [PubMed]
- Carlucci, A.F.; Pramer, D. An evaluation of factors affecting the survival of Escherichia coli in sea water. Ii. Salinity, ph, and nutrients. Appl. Microbiol. 1960, 8, 247–250. [Google Scholar] [PubMed]
- Pernetti, M.; Di Palma, L. Experimental evaluation of inhibition effects of saline wastewater on activated sludge. Environ. Technol. 2005, 26, 695–703. [Google Scholar] [CrossRef] [PubMed]
- Delamarche, C.; Thomas, D.; Rolland, J.P.; Froger, A.; Gouranton, J.; Svelto, M.; Agre, P.; Calamita, G. Visualization of AqpZ-mediated water permeability in Escherichia coli by cryoelectron microscopy. J. Bacteriol. 1999, 181, 4193–4197. [Google Scholar] [PubMed]
- Laimins, L.A.; Rhoads, D.B.; Epstein, W. Osmotic control of kdp operon expression in Escherichia coli. Proc. Natl. Acad. Sci. USA 1981, 78, 464–468. [Google Scholar] [CrossRef] [PubMed]
- Epstein, W. Osmoregulation by potassium transport in Escherichia coli. FEMS Microbiol. Lett. 1986, 39, 73–78. [Google Scholar] [CrossRef]
- Landfald, B.; Strom, A.R. Choline-glycine betaine pathway confers a high level of osmotic tolerance in Escherichia coli. J. Bacteriol. 1986, 165, 849–855. [Google Scholar] [CrossRef] [PubMed]
- Strøm, A.R.; Falkenberg, P.; Landfald, B. Genetics of osmoregulation in Escherichia coli: Uptake and biosynthesis of organic osmolytes. FEMS Microbiol. Lett. 1986, 39, 79–86. [Google Scholar] [CrossRef]
- Larsen, P.I.; Sydnes, L.K.; Landfald, B.; Strom, A.R. Osmoregulation in Escherichia coli by accumulation of organic osmolytes: Betaines, glutamic acid, and trehalose. Arch. Microbiol. 1987, 147, 1–7. [Google Scholar] [CrossRef] [PubMed]
- Perroud, B.; Le Rudulier, D. Glycine betaine transport in Escherichia coli: Osmotic modulation. J. Bacteriol. 1985, 161, 393–401. [Google Scholar] [PubMed]
- Sevin, D.C.; Sauer, U. Ubiquinone accumulation improves osmotic-stress tolerance in Escherichia coli. Nat. Chem. Biol. 2014, 10, 266–272. [Google Scholar] [CrossRef] [PubMed]
- Purvis, J.E.; Yomano, L.P.; Ingram, L.O. Enhanced trehalose production improves growth of Escherichia coli under osmotic stress. Appl. Environ. Microbiol. 2005, 71, 3761–3769. [Google Scholar] [CrossRef] [PubMed]
- Rozwadowski, K.L.; Khachatourians, G.G.; Selvaraj, G. Choline oxidase, a catabolic enzyme in Arthrobacter pascens, facilitates adaptation to osmotic stress in Escherichia coli. J. Bacteriol. 1991, 173, 472–478. [Google Scholar] [CrossRef] [PubMed]
- Yu, H.Q.; Wang, Y.G.; Yong, T.M.; She, Y.H.; Fu, F.L.; Li, W.C. Heterologous expression of betaine aldehyde dehydrogenase gene from Ammopiptanthus nanus confers high salt and heat tolerance to Escherichia coli. Gene 2014, 549, 77–84. [Google Scholar] [CrossRef] [PubMed]
- Zhai, L.; Xue, Y.; Song, Y.; Xian, M.; Yin, L.; Zhong, N.; Xia, G.; Ma, Y. Overexpression of AaPal, a peptidoglycan-associated lipoprotein from Alkalomonas amylolytica, improves salt and alkaline tolerance of Escherichia coli and Arabidopsis thaliana. Biotechnol. Lett. 2014, 36, 601–607. [Google Scholar] [CrossRef] [PubMed]
- Pan, J.; Wang, J.; Zhou, Z.; Yan, Y.; Zhang, W.; Lu, W.; Ping, S.; Dai, Q.; Yuan, M.; Feng, B.; et al. IrrE, a global regulator of extreme radiation resistance in deinococcus radiodurans, enhances salt tolerance in Escherichia coli and Brassica napus. PLoS ONE 2009, 4, e4422. [Google Scholar] [CrossRef] [PubMed]
- Jensen, S.I.; Lennen, R.M.; Herrgard, M.J.; Nielsen, A.T. Seven gene deletions in seven days: Fast generation of Escherichia coli strains tolerant to acetate and osmotic stress. Sci. Rep. 2015, 5, 17874. [Google Scholar] [CrossRef] [PubMed]
- Winkler, J.D.; Garcia, C.; Olson, M.; Callaway, E.; Kao, K.C. Evolved osmotolerant Escherichia coli mutants frequently exhibit defective N-acetylglucosamine catabolism and point mutations in cell shape-regulating protein MreB. Appl. Environ. Microbiol. 2014, 80, 3729–3740. [Google Scholar] [CrossRef] [PubMed]
- Baba, T.; Ara, T.; Hasegawa, M.; Takai, Y.; Okumura, Y.; Baba, M.; Datsenko, K.A.; Tomita, M.; Wanner, B.L.; Mori, H. Construction of Escherichia coli K-12 in-frame, single-gene knockout mutants: The Keio collection. Mol. Syst. Biol. 2006, 2, 2006.0008. [Google Scholar] [CrossRef] [PubMed]
- Lennox, E.S. Transduction of linked genetic characters of the host by bacteriophage P1. Virology 1955, 1, 190–206. [Google Scholar] [CrossRef]
- Rabinowitz, J.D.; Kimball, E. Acidic acetonitrile for cellular metabolome extraction from Escherichia coli. Anal. Chem. 2007, 79, 6167–6173. [Google Scholar] [CrossRef] [PubMed]
- Henderson, J.W.; Brooks, A. Improved Amino Acid Methods Using Agilent ZORBAX Eclipse Plus C18 Columns for a Variety of Agilent LC Instrumentation and Separation Goals; Agilent Technologies: Santa Clara, CA, USA, 2010. [Google Scholar]
- Klotz, B.; Manas, P.; Mackey, B.M. The relationship between membrane damage, release of protein and loss of viability in Escherichia coli exposed to high hydrostatic pressure. Int. J. Food Microbiol. 2010, 137, 214–220. [Google Scholar] [CrossRef] [PubMed]
- Pagan, R.; Mackey, B. Relationship between membrane damage and cell death in pressure-treated Escherichia coli cells: Differences between exponential- and stationary-phase cells and variation among strains. Appl. Environ. Microbiol. 2000, 66, 2829–2834. [Google Scholar] [CrossRef] [PubMed]
- Saeed, A.I.; Bhagabati, N.K.; Braisted, J.C.; Liang, W.; Sharov, V.; Howe, E.A.; Li, J.; Thiagarajan, M.; White, J.A.; Quackenbush, J. TM4 microarray software suite. Methods Enzymol. 2006, 411, 134–193. [Google Scholar] [PubMed]
- Quackenbush, J. Microarray data normalization and transformation. Nat. Genet. 2002, 32, S496–S501. [Google Scholar] [CrossRef] [PubMed]
- Huang da, W.; Sherman, B.T.; Lempicki, R.A. Bioinformatics enrichment tools: Paths toward the comprehensive functional analysis of large gene lists. Nucleic Acids Res. 2009, 37, 1–13. [Google Scholar] [CrossRef] [PubMed]
- Huang da, W.; Sherman, B.T.; Lempicki, R.A. Systematic and integrative analysis of large gene lists using DAVID bioinformatics resources. Nat. Protoc. 2009, 4, 44–57. [Google Scholar] [CrossRef] [PubMed]
- Kitagawa, M.; Ara, T.; Arifuzzaman, M.; Ioka-Nakamichi, T.; Inamoto, E.; Toyonaga, H.; Mori, H. Complete set of ORF clones of Escherichia coli ASKA library (a complete set of E. coli K-12 ORF archive): Unique resources for biological research. DNA Res. 2005, 12, 291–299. [Google Scholar] [CrossRef] [PubMed]
- Datsenko, K.A.; Wanner, B.L. One-step inactivation of chromosomal genes in Escherichia coli K-12 using PCR products. Proc. Natl. Acad. Sci. USA 2000, 97, 6640–6645. [Google Scholar] [CrossRef] [PubMed]
- Ni Bhriain, N.; Dorman, C.J.; Higgins, C.F. An overlap between osmotic and anaerobic stress responses: A potential role for DNA supercoiling in the coordinate regulation of gene expression. Mol. Microbiol. 1989, 3, 933–942. [Google Scholar] [CrossRef] [PubMed]
- Grothe, S.; Krogsrud, R.L.; McClellan, D.J.; Milner, J.L.; Wood, J.M. Proline transport and osmotic stress response in Escherichia coli K-12. J. Bacteriol. 1986, 166, 253–259. [Google Scholar] [CrossRef] [PubMed]
- Akashi, H.; Gojobori, T. Metabolic efficiency and amino acid composition in the proteomes of Escherichia coli and Bacillus subtilis. Proc. Natl. Acad. Sci. USA 2002, 99, 3695–3700. [Google Scholar] [CrossRef] [PubMed]
- Glaser, H.U.; Thomas, D.; Gaxiola, R.; Montrichard, F.; Surdin-Kerjan, Y.; Serrano, R. Salt tolerance and methionine biosynthesis in Saccharomyces cerevisiae involve a putative phosphatase gene. EMBO J. 1993, 12, 3105–3110. [Google Scholar] [PubMed]
- Shahjee, H.M.; Banerjee, K.; Ahmad, F. Comparative analysis of naturally occurring l-amino acid osmolytes and their d-isomers on protection of Escherichia coli against environmental stresses. J. Biosci. 2002, 27, 515–520. [Google Scholar] [CrossRef] [PubMed]
- Le Rudulier, D.; Bouillard, L. Glycine betaine, an osmotic effector in Klebsiella pneumoniae and other members of the Enterobacteriaceae. Appl. Environ. Microbiol. 1983, 46, 152–159. [Google Scholar] [PubMed]
- Csonka, L.N.; Gelvin, S.B.; Goodner, B.W.; Orser, C.S.; Siemieniak, D.; Slightom, J.L. Nucleotide sequence of a mutation in the proB gene of Escherichia coli that confers proline overproduction and enhanced tolerance to osmotic stress. Gene 1988, 64, 199–205. [Google Scholar] [CrossRef]
- Wilson, O.H.; Holden, J.T. Stimulation of arginine transport in osmotically shocked Escherichia coli W cells by purified arginine-binding protein fractions. J. Biol. Chem. 1969, 244, 2743–2749. [Google Scholar] [PubMed]
- Blum, J.J. Effects of osmotic stress on metabolism, shape, and amino acid content of Leishmania. Biol. Cell 1996, 87, 9–16. [Google Scholar] [CrossRef] [PubMed]
- Han, K.; Lim, H.C.; Hong, J. Acetic acid formation in Escherichia coli fermentation. Biotechnol. Bioeng. 1992, 39, 663–671. [Google Scholar] [CrossRef] [PubMed]
- Castano-Cerezo, S.; Bernal, V.; Blanco-Catala, J.; Iborra, J.L.; Canovas, M. cAMP-CRP co-ordinates the expression of the protein acetylation pathway with central metabolism in Escherichia coli. Mol. Microbiol. 2011, 82, 1110–1128. [Google Scholar] [CrossRef] [PubMed]
- Chapman, B.; Ross, T. Escherichia coli and Salmonella enterica are protected against acetic acid, but not hydrochloric acid, by hypertonicity. Appl. Environ. Microbiol. 2009, 75, 3605–3610. [Google Scholar] [CrossRef] [PubMed]
- Winkler, J.D.; Halweg-Edwards, A.L.; Erickson, K.E.; Choudhury, A.; Pines, G.; Gill, R.T. The resistome: A comprehensive database of Escherichia coli resistance phenotypes. ACS Synth. Biol. 2016, 5, 1566–1577. [Google Scholar] [CrossRef] [PubMed]
- Fuhrer, T.; Zampieri, M.; Sevin, D.C.; Sauer, U.; Zamboni, N. Genomewide landscape of gene-metabolome associations in Escherichia coli. Mol. Syst. Biol. 2017, 13, 907. [Google Scholar] [CrossRef] [PubMed]
- Smelt, J.P.P.M.; Rijke, A.G.F.; Hayhurst, A. Possible mechanism of high pressure inactivation of microorganisms. High Press. Res. 1994, 12, 199–203. [Google Scholar] [CrossRef]
- Benito, A.; Ventoura, G.; Casadei, M.; Robinson, T.; Mackey, B. Variation in resistance of natural isolates of Escherichia coli O157 to high hydrostatic pressure, mild heat, and other stresses. Appl. Environ. Microbiol. 1999, 65, 1564–1569. [Google Scholar] [PubMed]
- Arthur, T.M.; Burgess, R.R. Localization of a sigma70 binding site on the N terminus of the Escherichia coli RNA polymerase beta’ subunit. J. Biol. Chem. 1998, 273, 31381–31387. [Google Scholar] [CrossRef] [PubMed]
- Brodolin, K.; Mustaev, A.; Severinov, K.; Nikiforov, V. Identification of RNA polymerase beta’ subunit segment contacting the melted region of the lacUV5 promoter. J. Biol. Chem. 2000, 275, 3661–3666. [Google Scholar] [CrossRef] [PubMed]
- Zaychikov, E.; Martin, E.; Denissova, L.; Kozlov, M.; Markovtsov, V.; Kashlev, M.; Heumann, H.; Nikiforov, V.; Goldfarb, A.; Mustaev, A. Mapping of catalytic residues in the RNA polymerase active center. Science 1996, 273, 107–109. [Google Scholar] [CrossRef] [PubMed]
- Finn, R.D.; Bateman, A.; Clements, J.; Coggill, P.; Eberhardt, R.Y.; Eddy, S.R.; Heger, A.; Hetherington, K.; Holm, L.; Mistry, J.; et al. Pfam: The protein families database. Nucleic Acids Res. 2014, 42, D222–D230. [Google Scholar] [CrossRef] [PubMed]
- Murakami, K.S. X-ray crystal structure of Escherichia coli RNA polymerase sigma70 holoenzyme. J. Biol. Chem. 2013, 288, 9126–9134. [Google Scholar] [CrossRef] [PubMed]
- Chakraborty, A.; Wang, D.; Ebright, Y.W.; Korlann, Y.; Kortkhonjia, E.; Kim, T.; Chowdhury, S.; Wigneshweraraj, S.; Irschik, H.; Jansen, R.; et al. Opening and closing of the bacterial RNA polymerase clamp. Science 2012, 337, 591–595. [Google Scholar] [CrossRef] [PubMed]
- Zaychikov, E.; Denissova, L.; Meier, T.; Gotte, M.; Heumann, H. Influence of Mg2+ and temperature on formation of the transcription bubble. J. Biol. Chem. 1997, 272, 2259–2267. [Google Scholar] [CrossRef] [PubMed]
- Vrentas, C.E.; Gaal, T.; Ross, W.; Ebright, R.H.; Gourse, R.L. Response of RNA polymerase to ppGpp: Requirement for the omega subunit and relief of this requirement by DksA. Genes Dev. 2005, 19, 2378–2387. [Google Scholar] [CrossRef] [PubMed]
- Zuo, Y.; Wang, Y.; Steitz, T.A. The mechanism of E. coli RNA polymerase regulation by ppGpp is suggested by the structure of their complex. Mol. Cell 2013, 50, 430–436. [Google Scholar] [CrossRef] [PubMed]
- Ross, W.; Vrentas, C.E.; Sanchez-Vazquez, P.; Gaal, T.; Gourse, R.L. The magic spot: A ppGpp binding site on E. coli RNA polymerase responsible for regulation of transcription initiation. Mol. Cell 2013, 50, 420–429. [Google Scholar] [CrossRef] [PubMed]
- Magnusson, L.U.; Farewell, A.; Nystrom, T. Ppgpp: A global regulator in Escherichia coli. Trends Microbiol. 2005, 13, 236–242. [Google Scholar] [CrossRef] [PubMed]
- Markham, G.D.; Hafner, E.W.; Tabor, C.W.; Tabor, H. S-adenosylmethionine synthetase from Escherichia coli. J. Biol. Chem. 1980, 255, 9082–9092. [Google Scholar] [PubMed]
- Thomas, D.; Cherest, H.; Surdin-Kerjan, Y. Identification of the structural gene for glucose-6-phosphate dehydrogenase in yeast. Inactivation leads to a nutritional requirement for organic sulfur. EMBO J. 1991, 10, 547–553. [Google Scholar] [PubMed]
- Sekowska, A.; Kung, H.F.; Danchin, A. Sulfur metabolism in Escherichia coli and related bacteria: Facts and fiction. J. Mol. Microbiol. Biotechnol. 2000, 2, 145–177. [Google Scholar] [PubMed]
- Chen, D.; Ma, H.; Hong, H.; Koh, S.S.; Huang, S.M.; Schurter, B.T.; Aswad, D.W.; Stallcup, M.R. Regulation of transcription by a protein methyltransferase. Science 1999, 284, 2174–2177. [Google Scholar] [CrossRef] [PubMed]
- Augustus, A.M.; Spicer, L.D. The MetJ regulon in gammaproteobacteria determined by comparative genomics methods. BMC Genom. 2011, 12, 558. [Google Scholar] [CrossRef] [PubMed]
- Thanbichler, M.; Neuhierl, B.; Bock, A. S-methylmethionine metabolism in Escherichia coli. J. Bacteriol. 1999, 181, 662–665. [Google Scholar] [PubMed]
- Szego, D.; Kósa, E.; Horváth, E. Role of S-methylmethionine in the plant metabolism. Acta Agron. Hung. 2007, 55. [Google Scholar] [CrossRef]
- Santos, J.M.; Freire, P.; Vicente, M.; Arraiano, C.M. The stationary-phase morphogene bolA from Escherichia coli is induced by stress during early stages of growth. Mol. Microbiol. 1999, 32, 789–798. [Google Scholar] [CrossRef] [PubMed]
- Gajiwala, K.S.; Burley, S.K. HdeA, a periplasmic protein that supports acid resistance in pathogenic enteric bacteria1. J. Mol. Biol. 2000, 295, 605–612. [Google Scholar] [CrossRef] [PubMed]
- Masuda, N.; Church, G.M. Regulatory network of acid resistance genes in Escherichia coli. Mol. Microbiol. 2003, 48, 699–712. [Google Scholar] [CrossRef] [PubMed]
- Liu, K.; Bittner, A.N.; Wang, J.D. Diversity in (p)ppGpp metabolism and effectors. Curr. Opin. Microbiol. 2015, 24, 72–79. [Google Scholar] [CrossRef] [PubMed]
- Srivatsan, A.; Wang, J.D. Control of bacterial transcription, translation and replication by (p)ppGpp. Curr. Opin. Microbiol. 2008, 11, 100–105. [Google Scholar] [CrossRef] [PubMed]
- Tarusawa, T.; Ito, S.; Goto, S.; Ushida, C.; Muto, A.; Himeno, H. (p)ppGpp-dependent and -independent pathways for salt tolerance in Escherichia coli. J. Biochem. 2016, 160, 19–26. [Google Scholar] [CrossRef] [PubMed]
- Maitra, A.; Shulgina, I.; Hernandez, V.J. Conversion of active promoter-RNA polymerase complexes into inactive promoter bound complexes in E. coli by the transcription effector, ppGpp. Mol. Cell 2005, 17, 817–829. [Google Scholar] [CrossRef] [PubMed]
Figure 1.
Growth kinetics in M9 supplemented with 0.6 M NaCl. (A) BW25113 and EJW3 in M9 supplemented with 0.6 M NaCl (solid lines: without tryptophan, and dashed lines: with 50 µg mL−1 tryptophan supplementation). (B) Tryptophan auxotrophic strains JW1253, EJW4, HFr-2×SFX- and G3 in M9 supplemented with 0.6 M NaCl and 50 µg mL−1 tryptophan. Red lines: strains without rpoC mutation. Blue lines: strains with rpoC mutation. Error bars are standard deviations.
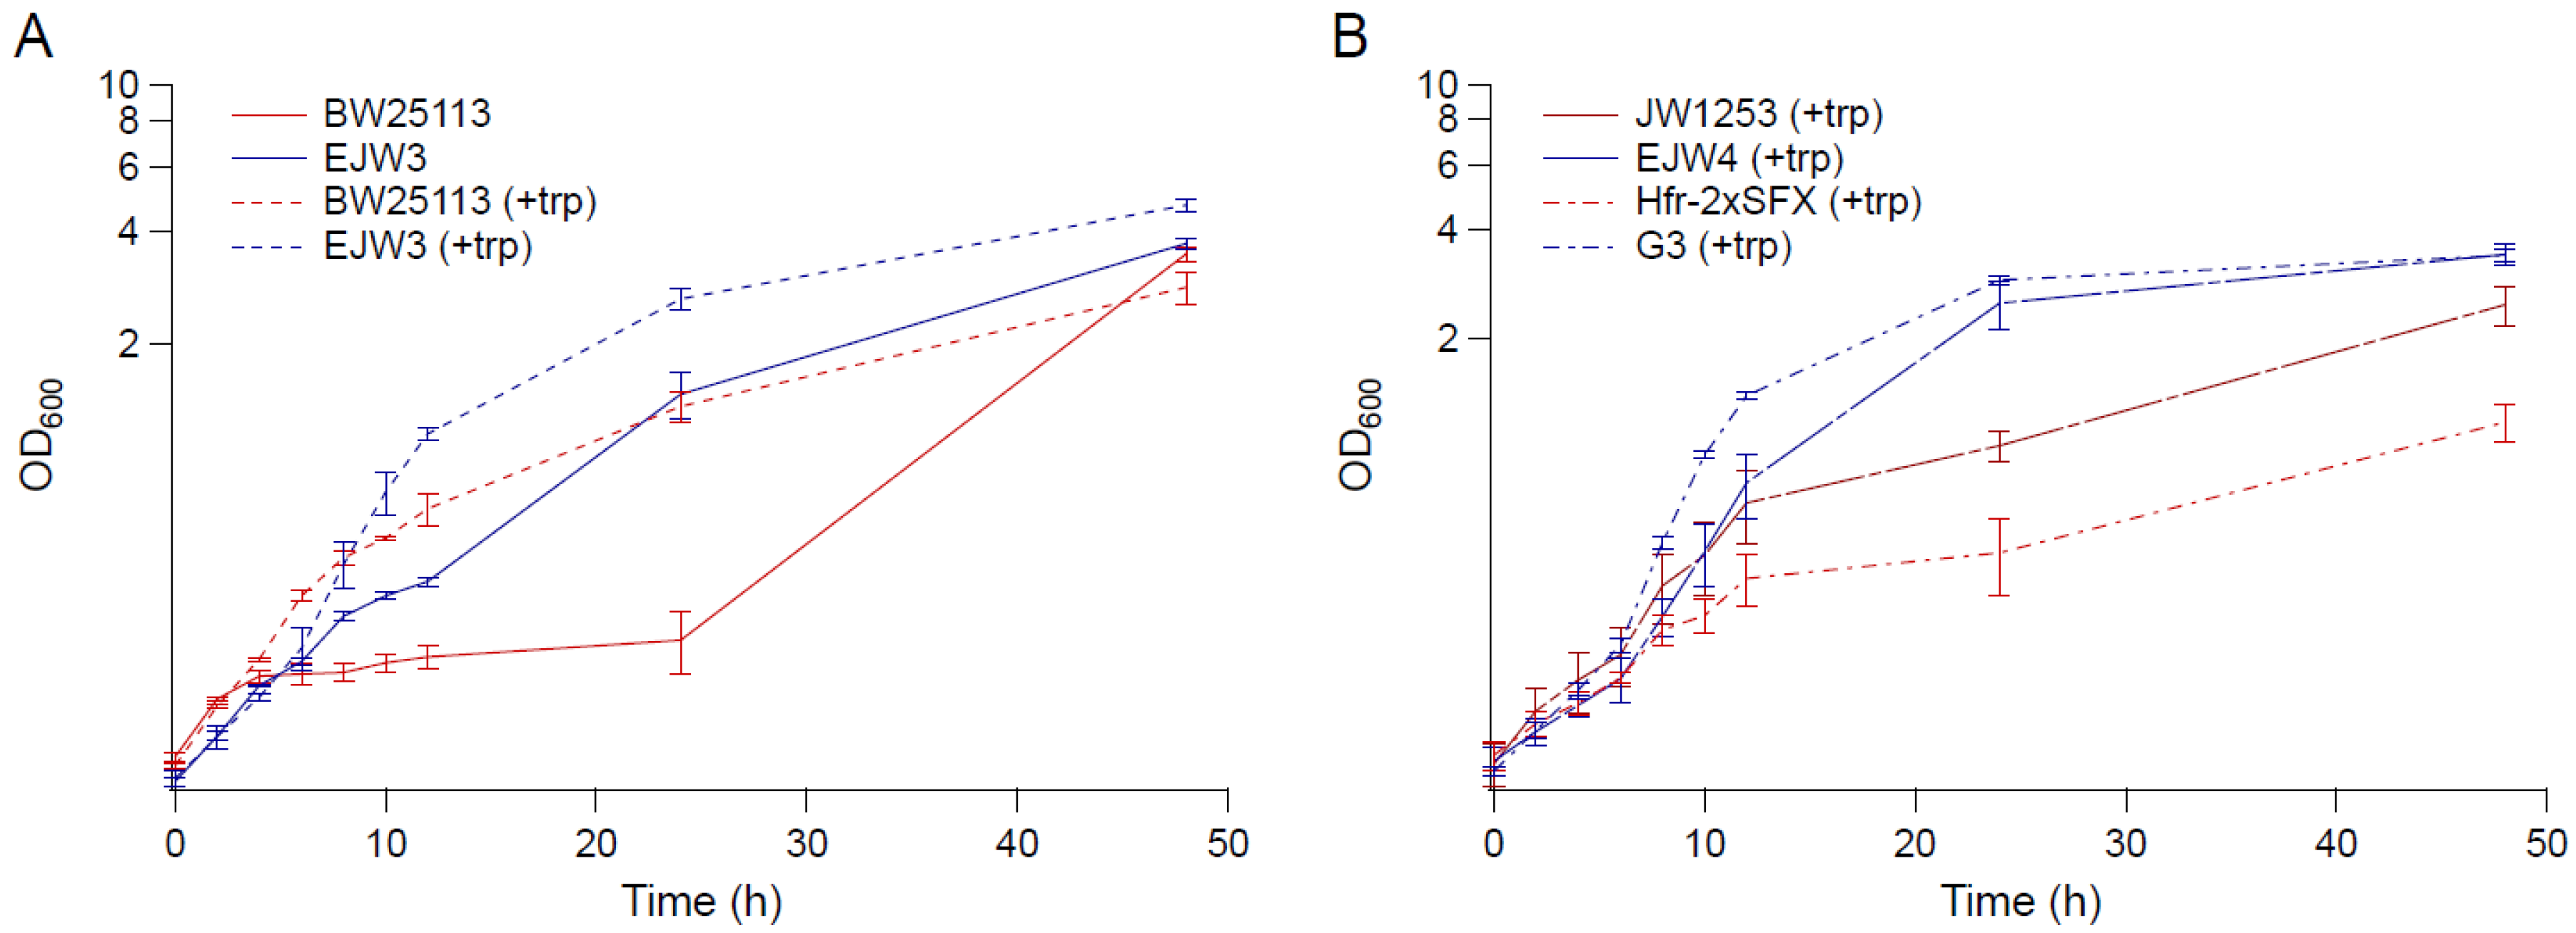
Figure 2.
Growth and viability curves. (A) M9 with 0.6 M NaCl. (B) M9 with 0.6 M NaCl and tryptophan (50 µg mL−1). Error bars are standard deviations.
Figure 2.
Growth and viability curves. (A) M9 with 0.6 M NaCl. (B) M9 with 0.6 M NaCl and tryptophan (50 µg mL−1). Error bars are standard deviations.

Figure 3.
Cell density in M9 supplemented with 0.65 M NaCl and methionine. (A) Cell density after 24 h. (B) Cell density after 48 h. Error bars are standard deviations.
Figure 3.
Cell density in M9 supplemented with 0.65 M NaCl and methionine. (A) Cell density after 24 h. (B) Cell density after 48 h. Error bars are standard deviations.

Figure 4.
Cell density in M9 supplemented with 0.65 M NaCl and proline. (A) Cell density after 24 h. (B) Cell density after 48 h. Error bars are standard deviations.
Figure 4.
Cell density in M9 supplemented with 0.65 M NaCl and proline. (A) Cell density after 24 h. (B) Cell density after 48 h. Error bars are standard deviations.

Figure 5.
Cell density in M9 supplemented with 0.65 M NaCl and alanine. (A) Cell density after 24 h. (B) Cell density after 48 h. Error bars are standard deviations.
Figure 5.
Cell density in M9 supplemented with 0.65 M NaCl and alanine. (A) Cell density after 24 h. (B) Cell density after 48 h. Error bars are standard deviations.
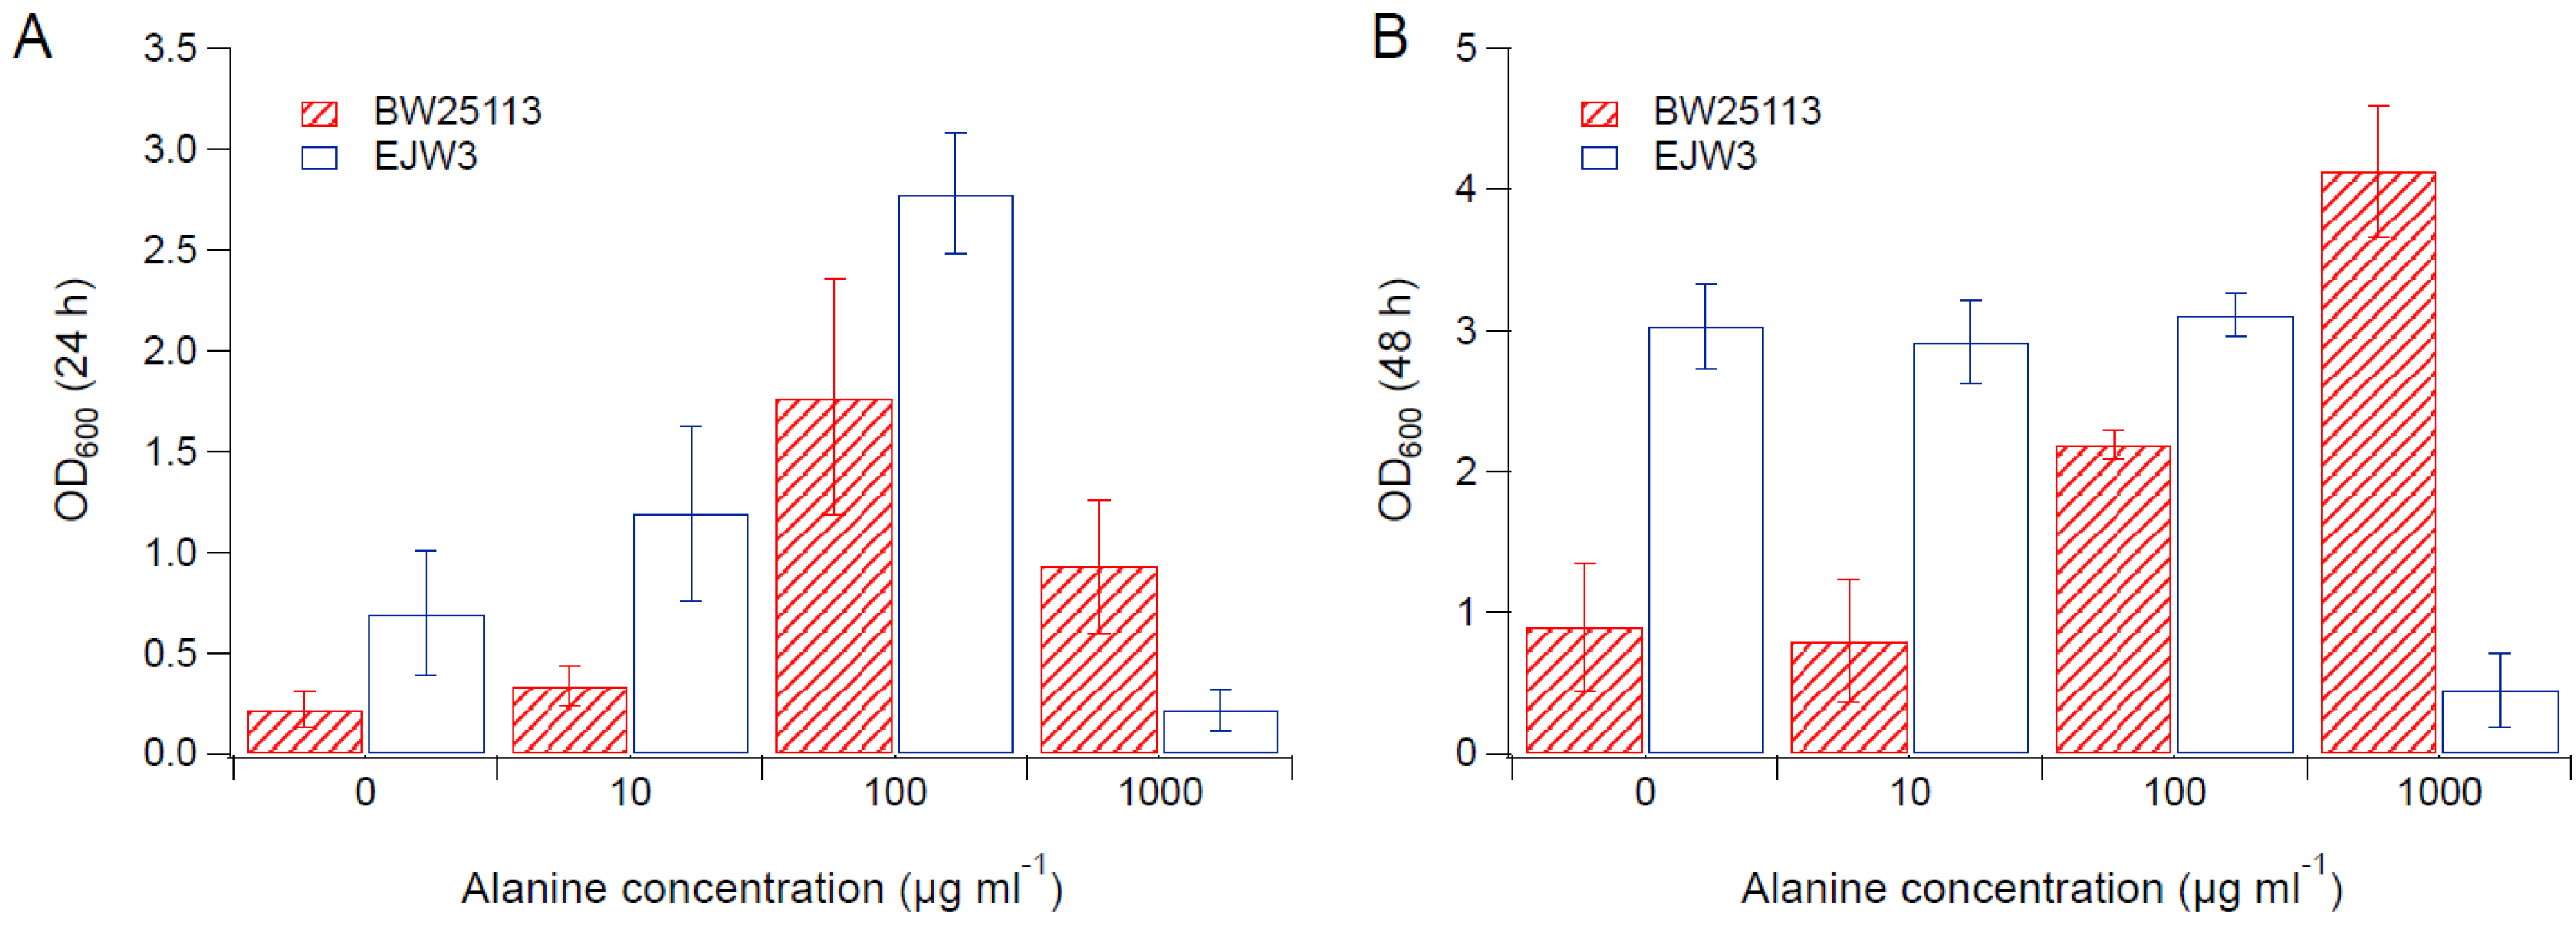
Figure 6.
Effect of acetic acid on osmotic tolerance. (A) M9 only. (B) M9 supplemented with 0.6 M NaCl. (C) M9 supplemented with 0.7 M NaCl. Error bars are standard deviations.
Figure 6.
Effect of acetic acid on osmotic tolerance. (A) M9 only. (B) M9 supplemented with 0.6 M NaCl. (C) M9 supplemented with 0.7 M NaCl. Error bars are standard deviations.
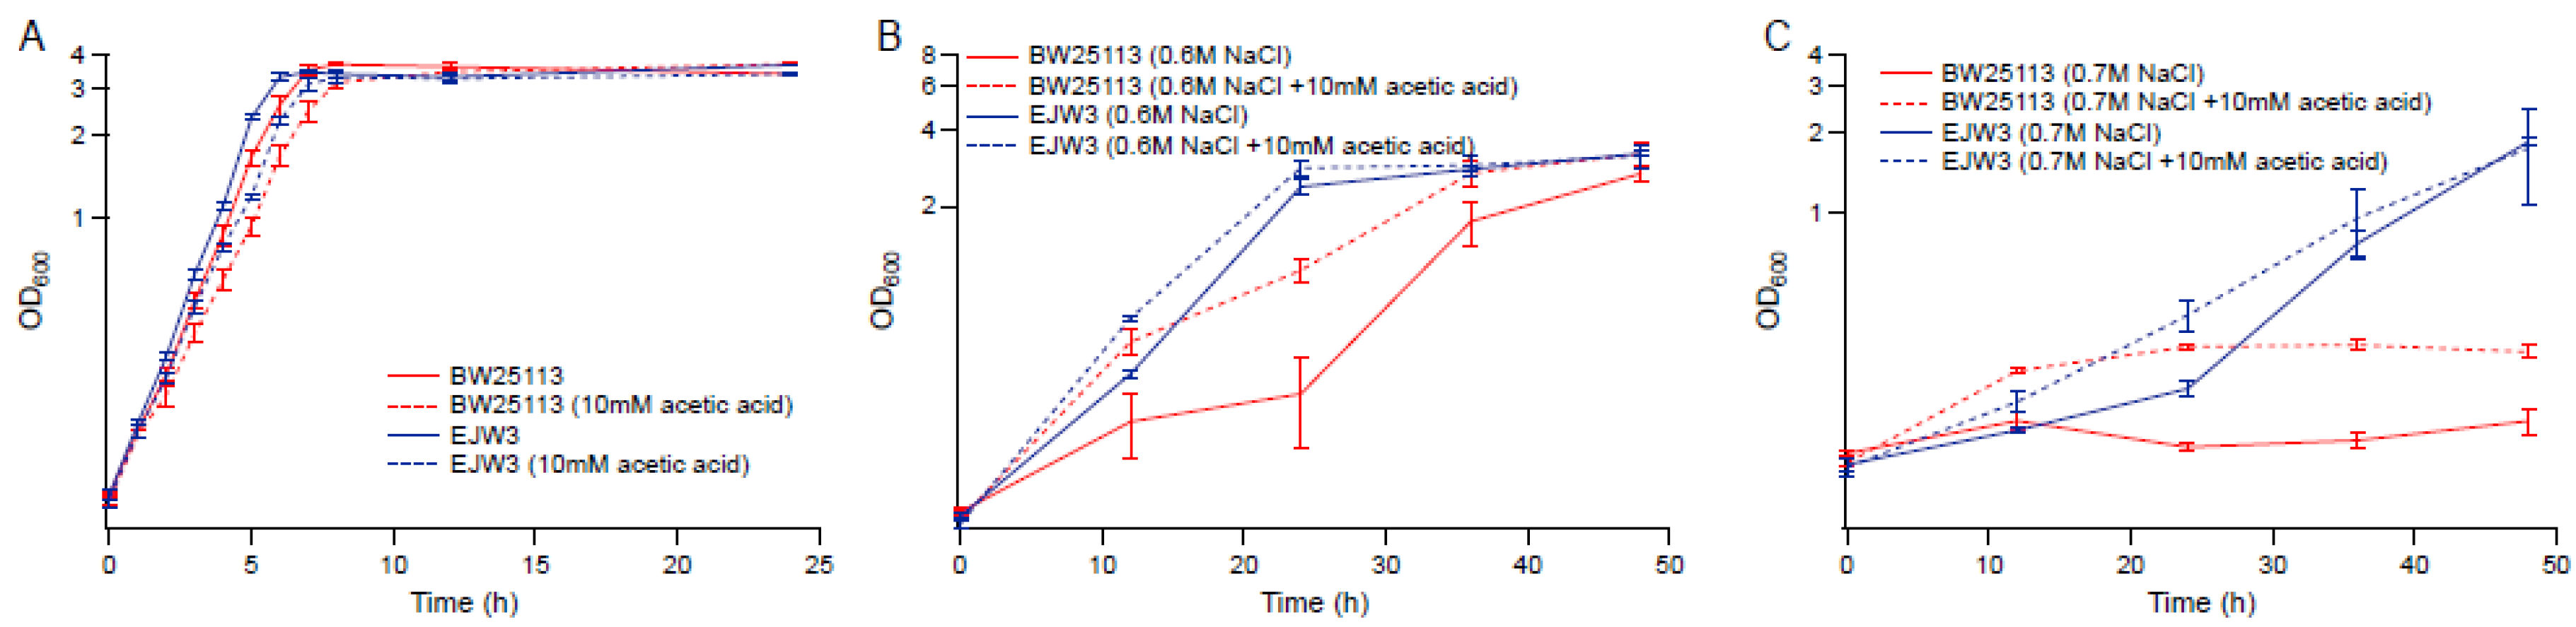
Figure 7.
Membrane integrity assay using PI staining of exponential growing cells. NaCl: 0.7 M NaCl. AA: 10 mM acetic acid. ** Statistically significantly different using two-tailed student’s t-test (p-value < 0.005). Error bars are standard deviations.
Figure 7.
Membrane integrity assay using PI staining of exponential growing cells. NaCl: 0.7 M NaCl. AA: 10 mM acetic acid. ** Statistically significantly different using two-tailed student’s t-test (p-value < 0.005). Error bars are standard deviations.

Figure 8.
Growth kinetics of overexpression strains in BW25113 background. (A) M9. (B) M9 supplemented with 0.55 M NaCl. Error bars are standard deviations.
Figure 8.
Growth kinetics of overexpression strains in BW25113 background. (A) M9. (B) M9 supplemented with 0.55 M NaCl. Error bars are standard deviations.

Figure 9.
Growth kinetics of knockout strains in BW25113 background. (A) M9. (B) M9 supplemented with 0.6 M NaCl. Error bars are standard deviations.
Figure 9.
Growth kinetics of knockout strains in BW25113 background. (A) M9. (B) M9 supplemented with 0.6 M NaCl. Error bars are standard deviations.

Figure 10.
Growth kinetics of MG1655, EYG1, BW25113 and EJW3. (A) M9 (B) M9 supplemented with 0.6 M NaCl. Error bars are standard deviations.
Figure 10.
Growth kinetics of MG1655, EYG1, BW25113 and EJW3. (A) M9 (B) M9 supplemented with 0.6 M NaCl. Error bars are standard deviations.

Figure 11.
Growth kinetics of MG1655, EYG1 and the knockout strains in MG1655 background. (A) M9 supplemented with 0.7 M NaCl with and without 50 µg mL−1 tryptophan (B) M9 (C) M9 supplemented with 0.7 M NaCl. Error bars are standard deviations.
Figure 11.
Growth kinetics of MG1655, EYG1 and the knockout strains in MG1655 background. (A) M9 supplemented with 0.7 M NaCl with and without 50 µg mL−1 tryptophan (B) M9 (C) M9 supplemented with 0.7 M NaCl. Error bars are standard deviations.


Table 1.
List of strains.
| Strains | Description/Genotype | Source |
|---|---|---|
| BW25113 | F-, Δ(araD-araB)567, lacZ4787(del)::rrnB-3, λ-, rph-1, Δ(rhaD-rhaB)568, hsdR514 | CGSC |
| MG655 | F-, λ-, rph-1 | CGSC |
| Hfr-2×SFX- | BW25113 ΔmbhA::oriT, ΔhyfC::oriT, trp::F[ΔtraST], (genR), parental strain of G3 | [24] |
| G3 | Evolved mutant of Hfr-2×SFX- containing rpoC K370_A396dup mutation | [24] |
| JW3929 | BW25113 ΔargE744::kan | [25] |
| JW1253 | BW25113 ΔtrpB769::kan | [25] |
| EJW1 | G3 ΔargE744::kan | This study |
| EJW2 | BW25113 ΔargE744::kan, rpoC K370_A396dup | This study |
| EJW3 | BW25113 rpoC K370_A396dup | This study |
| EJW4 | BW25113 rpoC K370_A396dup, ΔtrpB769::kan | This study |
| EYG1 | MG1655 rpoC K370_A396dup | This study |
Table 2.
Growth in micro-aerobic condition in M9 supplemented with 0.8 M NaCl.
| Strains | 0 h | 24 h | 48 h | 72 h |
|---|---|---|---|---|
| BW25113 | − | + | + | + |
| EJW3 | − | + | +++ | ++++ |
| JW1253 * | − | + | ++ | + |
| EJW4 * | − | ++ | ++++ | ++++ |
| Hfr-2×SFX- * | − | + | + | + |
| G3 * | − | +++ | ++++ | +++ |
* Tryptophan (50 µg mL−1) was supplemented; − OD600 < 0.1, + 0.1 < OD600 < 0.5, ++ 0.5 < OD600 < 1.0, +++ 1.0 < OD600 < 2.0, ++++ OD600 > 2.0.
Table 3.
Growth in aerobic condition in M9 supplemented with 0.75 M NaCl.
| Strains | 0 h | 24 h | 48 h | 72 h |
|---|---|---|---|---|
| BW25113 | − | + | + | + |
| EJW3 | − | + | +++ | ++++ |
| JW1253 * | − | + | ++ | + |
| EJW4 * | − | ++ | ++++ | ++++ |
| Hfr-2×SFX- * | − | + | + | + |
| G3 * | − | +++ | ++++ | +++ |
* Tryptophan (50 µg mL−1) was supplemented; − OD600 < 0.1, + 0.1 < OD600 < 0.5, ++ 0.5 < OD600 < 1.0, +++ 1.0 < OD600 < 2.0, ++++ OD600 > 2.0.
Table 4.
Quantification of intracellular and extracellular metabolites in M9.
| Metabolite | BW25113 | EJW3 | p-Value | |
|---|---|---|---|---|
| Intracellular | Trehalose (µg mL−1 OD600−1) | - | - | - |
| Acetic acid (µg mL−1 OD600−1) | 650 ± 90 | 390 ± 80 | 0.000 * | |
| Glu (µg mL−1 OD600−1) | 187.72 ± 35.94 | 212.37 ± 27.2 | 0.210 | |
| Ala (µg mL−1 OD600−1) | 81.18 ± 16.55 | 83.71 ± 3.15 | 0.721 | |
| Arg (µg mL−1 OD600−1) | - | 4.78 ± 7.41 | 0.145 | |
| Pro (µg mL−1 OD600−1) | 61.64 ± 6.12 | 75.06 ± 1.95 | 0.000 * | |
| Extracellular | Trehalose (µg mL−1 OD600−1) | - | - | - |
| Acetic acid (µg mL−1 OD600−1) | 280 ± 20 | 370 ± 10 | 0.000 * | |
| Glu (µg mL−1 OD600−1) | - | 6.42 ± 12.41 | 0.234 | |
| Ala (µg mL−1 OD600−1) | 10.86 ± 6.33 | 1.93 ± 4.72 | 0.020 * | |
| Arg (µg mL−1 OD600−1) | 2.95 ± 7.21 | - | 0.341 | |
| Pro (µg mL−1 OD600−1) | 516.13 ± 35.09 | 776.02 ± 117.02 | 0.000 * |
- Not detectible. * Statistically significantly different between BW25113 and EJW3 (p-values < 0.05). Values bolded are significantly higher in EJW3. Values bolded and italicized are significantly lower in EJW3. p-values are calculated by using a two-tailed student’s t-test with six biological replicates.
Table 5.
Quantification of intracellular and extracellular metabolites in M9 supplemented with 0.6 M NaCl.
Table 5.
Quantification of intracellular and extracellular metabolites in M9 supplemented with 0.6 M NaCl.
| Metabolite | BW25113 | EJW3 | p-Value | |
|---|---|---|---|---|
| Intracellular | Trehalose (µg mL−1 OD600−1) | 1190 ± 190 | 1630 ± 220 | 0.005 * |
| Acetic acid (µg mL−1 OD600−1) | 270 ± 140 | 370 ± 50 | 0.137 | |
| Glu (µg mL−1 OD600−1) | 565.50 ± 44.39 | 698.75 ± 82.47 | 0.006 * | |
| Ala (µg mL−1 OD600−1) | 38.49 ± 9.03 | 71.58 ± 13.51 | 0.001 * | |
| Arg (µg mL−1 OD600−1) | 28.79 ± 2.73 | 44.87 ± 6.42 | 0.000 * | |
| Pro (µg mL−1 OD600−1) | 94.31 ± 6.14 | 107.31 ± 18.37 | 0.131 | |
| Extracellular | Trehalose (µg mL−1 OD600−1) | - | - | - |
| Acetic acid (µg mL−1 OD600−1) | 260 ± 20 | 360 ± 20 | 0.000 * | |
| Glu (µg mL−1 OD600−1) | 234.82 ± 15.44 | 88.05 ± 19.38 | 0.000 * | |
| Ala (µg mL−1 OD600−1) | - | - | - | |
| Arg (µg mL−1 OD600−1) | - | 7.90 ± 12.34 | 0.148 | |
| Pro (µg mL−1 OD600−1) | 747.75 ± 120.88 | 728.90 ± 156.43 | 0.820 |
- Not detectible. * Statistically significantly different between BW25113 and EJW3 (p-values < 0.05). Values bolded are significantly higher in EJW3. Values bolded and italicized are significantly lower in EJW3. p-values are calculated by using a two-tailed student’s t-test with six biological replicates.
© 2017 by the authors. Licensee MDPI, Basel, Switzerland. This article is an open access article distributed under the terms and conditions of the Creative Commons Attribution (CC BY) license (http://creativecommons.org/licenses/by/4.0/).
Share and Cite
MDPI and ACS Style
Guo, Y.; Winkler, J.; Kao, K.C. Insights on Osmotic Tolerance Mechanisms in Escherichia coli Gained from an rpoC Mutation. Bioengineering 2017, 4, 61. https://doi.org/10.3390/bioengineering4030061
AMA Style
Guo Y, Winkler J, Kao KC. Insights on Osmotic Tolerance Mechanisms in Escherichia coli Gained from an rpoC Mutation. Bioengineering. 2017; 4(3):61. https://doi.org/10.3390/bioengineering4030061
Chicago/Turabian StyleGuo, Yuqi, James Winkler, and Katy C. Kao. 2017. "Insights on Osmotic Tolerance Mechanisms in Escherichia coli Gained from an rpoC Mutation" Bioengineering 4, no. 3: 61. https://doi.org/10.3390/bioengineering4030061
Note that from the first issue of 2016, this journal uses article numbers instead of page numbers. See further details here.