1. Introduction
Hibiscus sabdariffa L. is an herbaceous plant, cultivated largely in tropical and subtropical areas of the world and it is known by different names such as Roselle or Bissap among others (Mounigan and Badrie, 2006 [
1]; Sáyago-Ayerdi
et al., 2007 [
2]; Hainida
et al., 2008 [
3]; Cisse, 2009 [
4]). It is cultivated mainly for its calyces for the production of concentrates, jams and particularly for beverages. There are various recipes for beverage preparation, which can be consumed cold or hot (Sáyago-Ayerdi
et al., 2007 [
2]; Ramirez-Rodrigues
et al., 2011 [
5]). The consumption of
Hibiscus sabdariffa L. (hereafter referred to as Bissap) in beverage form is widespread in Africa and Asia but not yet in Europe.
Bissap is an important source of vitamins, minerals, and bioactive compounds, such as organic acids, phytosterols, and polyphenols, some of them with antioxidant properties (Sáyago-Ayerdi
et al., 2007 [
2]). It is well known that these components are highly valued by the food industry because of their potential health benefits. Some pharmacological studies have been carried out with
Hibiscus flowers, petals, and seeds, and several health benefits were identified such as cardio protective action, antihypertensive action, effectiveness against low-density lipoprotein oxidation, and hyperlipidaemia (Sáyago-Ayerdi
et al., 2007 [
2]; Hainida
et al., 2008 [
3]). Accordingly, the Bissap beverage might be classified as a functional beverage in the nutraceutical classification, as an herbal beverage or nutrition enhanced tea (Functional Food and Drinks, 2007 [
6]). Sensorily, it is characterized by being astringent and strongly fruity (Bechoff
et al., 2014 [
7]).
How consumers evaluate their choices is affected by a complex set of factors that influence and shape decision process behavior (Blackwell
et al., 2006 [
8]). It has already been demonstrated that the chemical composition of Bissap beverages was related to sensory evaluation and acceptance of African and European consumers; in particular the anthocyanin content and
Hibiscus taste. Three types of consumer behavior were identified being those who preferred syrup, those who preferred infusions, and those who preferred both. Each of these different groups of consumers the chemicals associated with acceptance differed; for example, acceptance of
syrup likers was positively correlated to sweet taste, reducing sugar content and inversely correlated to acidic taste and titratable acidity while for
infusion likers it was positively correlated to the taste of
Hibiscus beverage and anthocyanin content (Bechoff
et al., 2014 [
7]).
Research on functional foods showed that health benefits and price are important drivers for purchase (Sparke and Menrad, 2009 [
9]). Nevertheless, specifically for functional beverages, it has been shown that taste is the main motivating factor for consumption and not the health benefits (Sabbe
et al., 2009 [
10], Vidigal
et al., 2011 [
11]), although the perceived importance of food for health has increased significantly (Verbeke, 2006 [
12]). According to a report on Functional Food and Drinks (FFD, 2007 [
6]) the functional food market is characterized by three segments of consumers: (i) consumers for whom taste and convenience are fundamental, and health and nutritional benefits of secondary concern; (ii) health generalist consumers, who are regular purchasers of functional foods; (iii) medically driven purchasers, mostly comprising a population aged between 45 and 65 years. More recently, Grunert (2011) [
13] reported four major dimensions of food quality for consumer acceptance of functional foods: taste and other sensory characteristics, healthiness, convenience and naturalness.
Along the same lines, it seems important to determine the drivers of acceptability of the Bissap beverage, a functional beverage according to its composition, in a European context, specifically in Portugal. Bissap is still an unfamiliar flavor in the European context, so, every effort needs to be made to support Bissap product development. Results on the identification of the major acceptance drivers of a Bissap beverage in Europe might be particularly interesting to the food industry, the nutraceutical industry and consumers in general. The development of a Bissap industry based on smallholder production in countries such as Senegal could be an important source of future income generation.
This study was performed with Portuguese consumers based on two stage methodology. Firstly, a qualitative study using focus groups aimed to: gain knowledge on the sensory general characterization of different types of Bissap beverage, and to determine the relevant choice attributes, possible occasions of consumption and usage for this kind of beverage. Secondly, a quantitative study using a conjoint analysis aimed to measure the importance of the salient consumer choice attributes of a Bissap beverage, and to reveal consumer segments with common preference profiles. Conjoint analysis is a powerful tool in modelling human decision making, as it enables the quantification of the weight consumers attach to various attributes when making their choice, predicting which products they will prefer, and enabling identification of distinct groups of consumers (Austin, 2000 [
14]).
2. Materials and Methods
2.1. Research Ethics
The study was conducted in accordance with the Declaration of Helsinki, and the protocol was approved by project AFTER’s Ethics Committee (project code 245025). Prior to the study, participants were informed about the aim of the study and procedures for handling personal data. In addition, they signed an informed consent, in which their voluntary participation was explicitly stated and also that they could withdraw from the study at any time. All tested samples were produced and prepared according to good hygiene and manufacturing practices.
2.2. Qualitative Study–Focus Groups
This first step aimed to collect evidence on consumer perceptions and attitudes towards a Bissap beverage. Data were collected through three focus group discussions, conducted according to standard procedures, using a script consistent with the above purpose for this research stage, and was video and tape recorded (Morgan, 1997 [
15]). The themes surveyed throughout the focus groups are presented in
Table 1.
A pilot focus group was performed first to test the script which resulted in few adjustments to the script original version. Three focus groups (90–100 min) were then performed with 22 volunteers recruited in Catholic University. The recruitment criteria included two mandatory conditions: being fruit juice consumers and the persons responsible for the household groceries shopping. The participant profiles are presented in
Table 2.
The first task of the focus group participants was to taste and generally evaluate sensory attributes of four blind samples of Bissap beverage. A description of the Bissap beverage samples is presented in
Table 3. Samples were presented to participants in coded transparent glasses. Water and crackers were also made available as a complement to the tasting. During the discussion participants were allowed to drink and taste the beverages as much as they wanted.
2.3. Quantitative Study–Conjoint Analysis
Global acceptability of food and beverages depends on the multi-attribute composition of the importance consumers’ attach to each product attribute. For that reason, conjoint analysis was chosen as the theoretical and methodological framework for this study. This methodology has been widely used in food research, and its efficacy and usefulness has been clearly proven to the study of consumers’ preferences and choice factors (e.g., pineapple juice, Finco
et al., 2010 [
17]; functional foods, Bech-Larsen and Grunert, 2003 [
18]; wines, Gil and Sanchez, 1997 [
19]; Quester and Smart, 1998 [
20]; olives, Moskowitz
et al., 2005 [
21]; impact of reduced salt content, Hersleth
et al., 2011 [
22]; processed foods, Cardello
et al., 2007 [
23]; food bars, Mahanna
et al., 2009 [
24]).
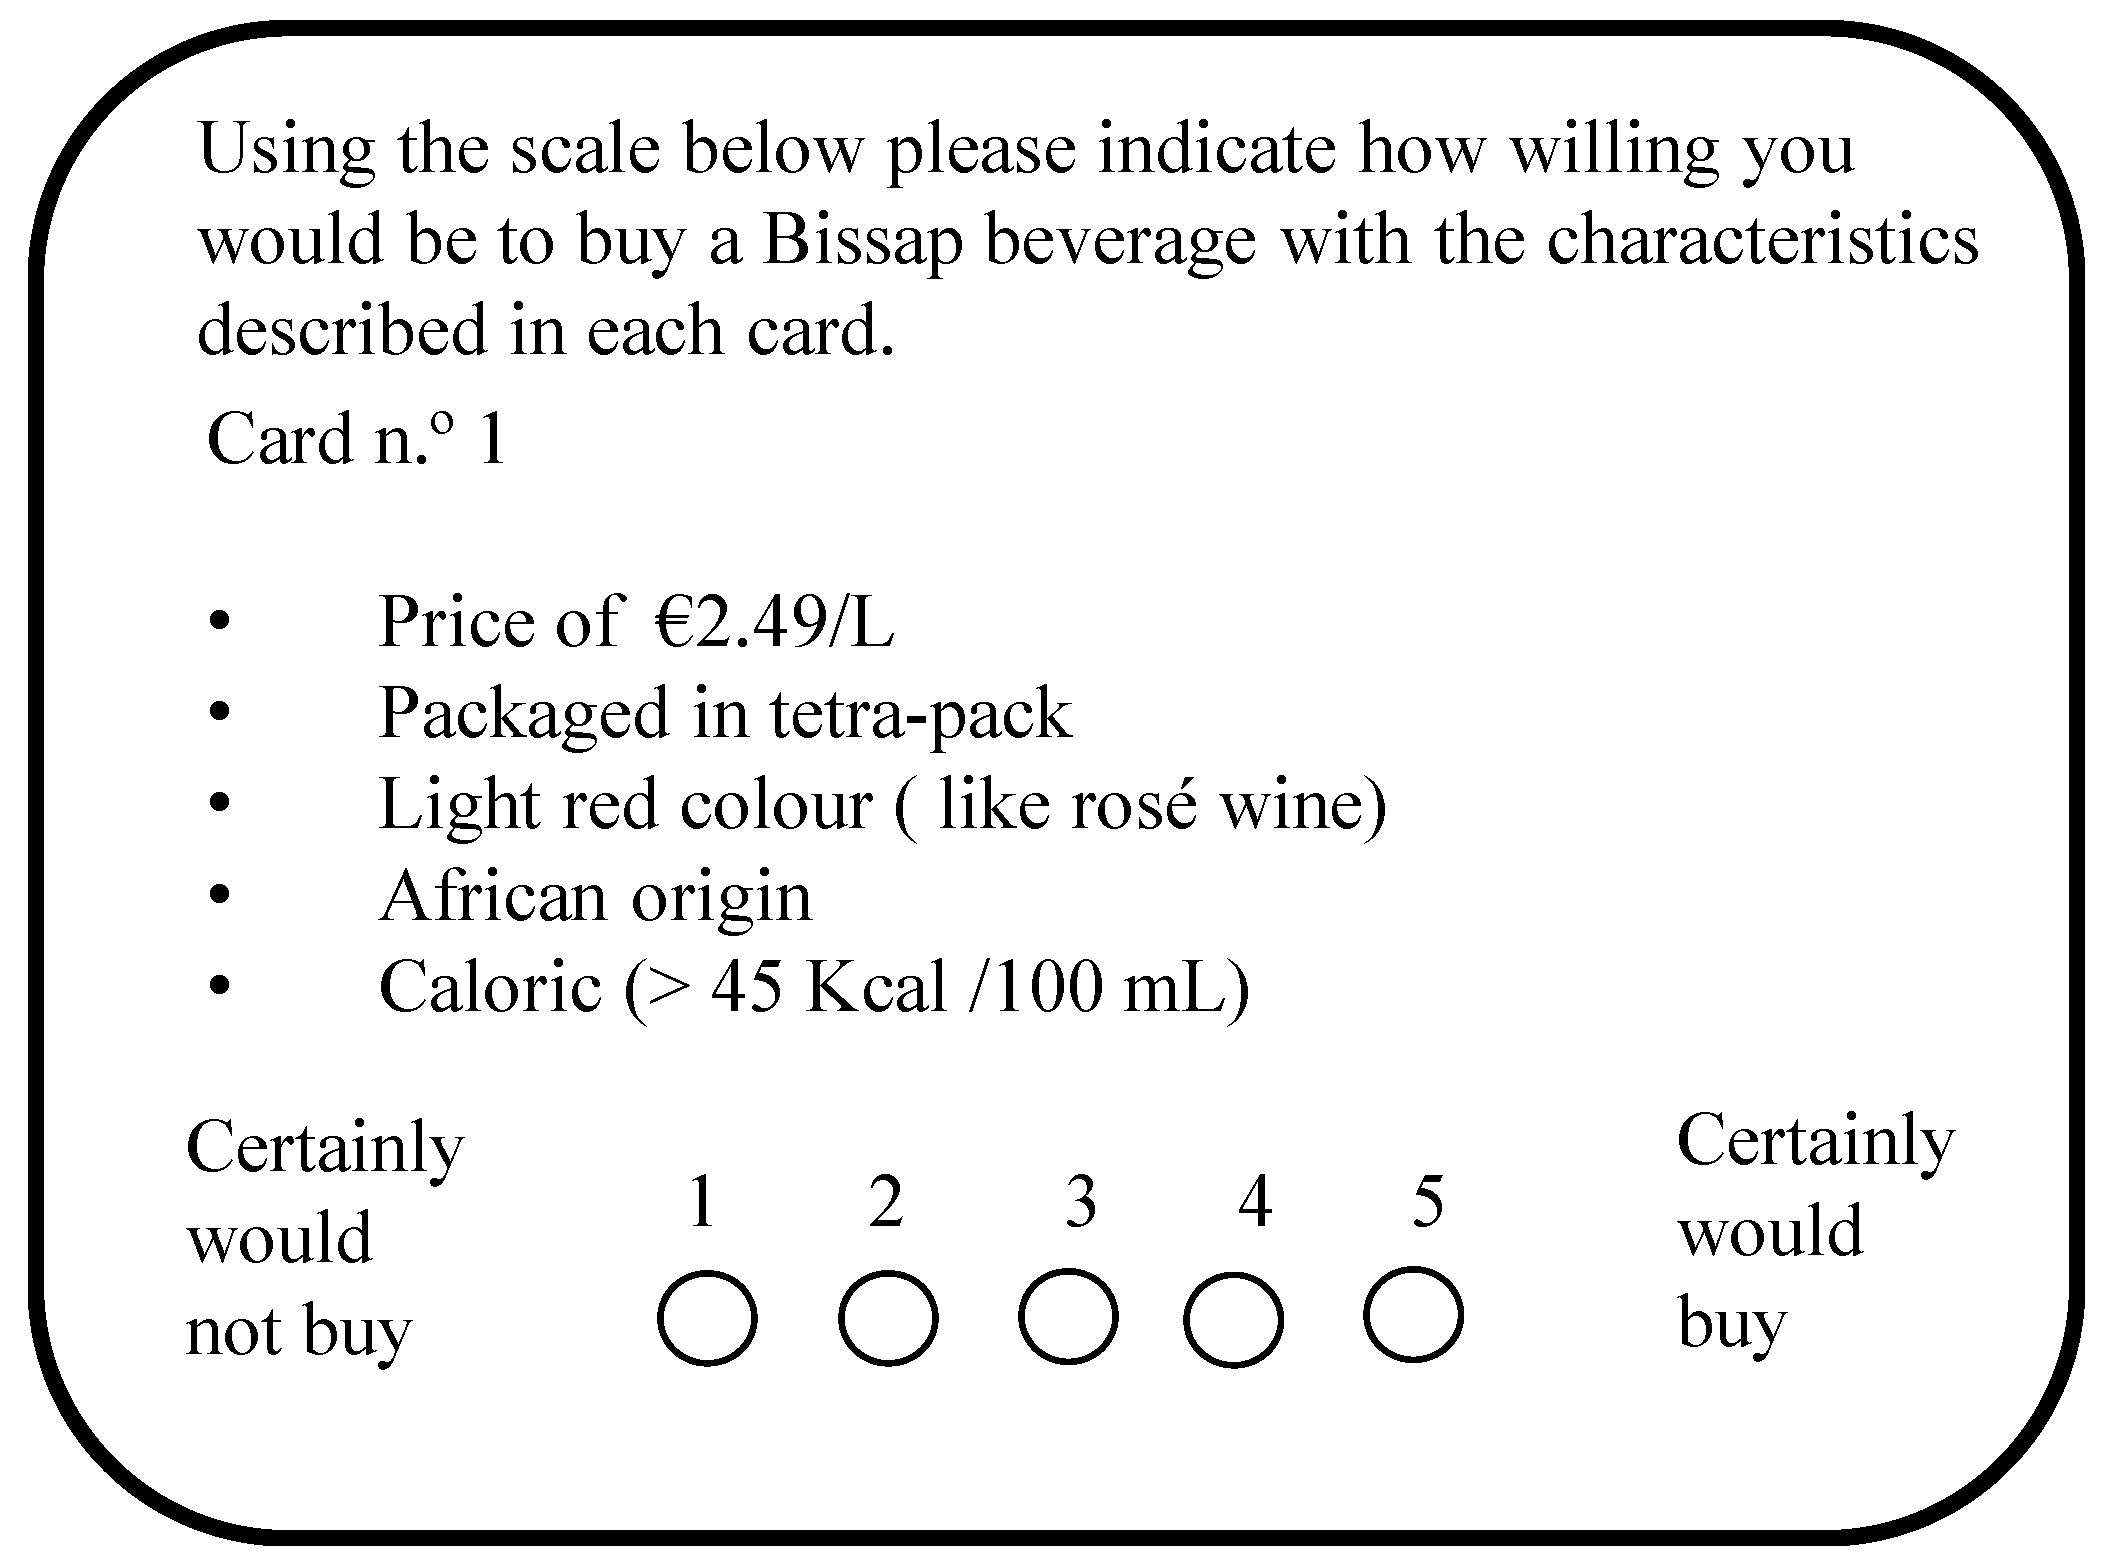
In this study, the attributes and levels for the conjoint study model were defined according to the findings arising from the focus groups discussions. By using a fractional orthogonal plan created by the conjoint algorithm available in the software SPSS (version 19, IBM, New York, NY, USA), 37 full-profile Bissap beverages were produced. A questionnaire was written in which respondents have to evaluate their likelihood of purchasing a given hypothetical profile, by using five-point Likert scale. An example of a profile given to participants to perform the evaluation is presented in
Figure 1. The questionnaire started with a brief introduction about the study aim and finished by asking for participants’ socio-demographic information: age, gender, education, social grade, occupation, and frequency of juice consumption. The later information was used as a basis for segmentation. The questionnaire was conducted via the internet, and a sample of 107 responses was given, from which, however, only 99 were considered valid and useable in the analysis.
3. Results and Discussion
3.1. Qualitative Study–Focus Groups
3.1.1. Global Sensory Characterization of Bissap Beverages
The focus groups’ discussions started with a blind tasting session with four different samples of Bissap. Out of all the samples the favourite was sample C (instant), followed by sample B (hot extract), sample D (syrup), and the least favourite was sample A (cold extract). Briefly, a characterization of each sample is presented below based on participants’ statements. Sample A (cold extract) was perceived as a winter season beverage and classified as very sweet, with a strong flavor, an unpleasant aroma, dark and artificially colored, with a very acidic aftertaste. Sample B (hot extract) was considered similar in flavor to sample A, that is, also very sweet with an acidic aftertaste, with an unpleasant aroma, but with a suitable color. Interestingly, two participants (out of 22) identified this sample as
Hibiscus. Sample C (instant) was perceived as a summer beverage and classified as having a balanced and good pleasant flavor, which was associated with pomegranate. On the other hand the later sample was also classified as watery and negatively rated for its general appearance, particularly its color. Sample D (syrup) was classified as very sweet, with a flavor similar to sample C and with a reasonably acceptable color. It might be concluded at this point that participants were able to distinguish between the four samples. Overall, all the samples seemed to have a sugar content higher than participant preference. Participants expected a healthy beverage, and considered too high sugar content inconsistent with this goal, as this would negatively affect health. This characteristic is then considered a disadvantage for this beverage, and this should be noted in further product development. There is a general perception that people could readily become familiarized with the Bissap flavor and learn to enjoy it. A general sensory appreciation of Bissap beverage is summarized in
Table 4, where all the positive and negative evaluations of the attributes are listed.
3.1.2. Attitude to Purchase
Assuming that this beverage would be available on the market, participants were asked on their willingness to buy the product, and how frequently. The results showed that almost half the participants (46%) stated they would be willing to buy the Bissap beverage two to three times a week; 36% between one and two times a month; 9% would buy it sporadically; 5% once a week; and 5% would never buy it.
3.1.3. Occasions and Places for Consumption
Table 5 summarizes the main occasions and places for consumption if the Bissap beverage were available on the market. The results are presented in percentages representing a ratio of the number of participants who stated that particular occasion/place and the total number of participants.
3.1.4. Motivations for Consumption
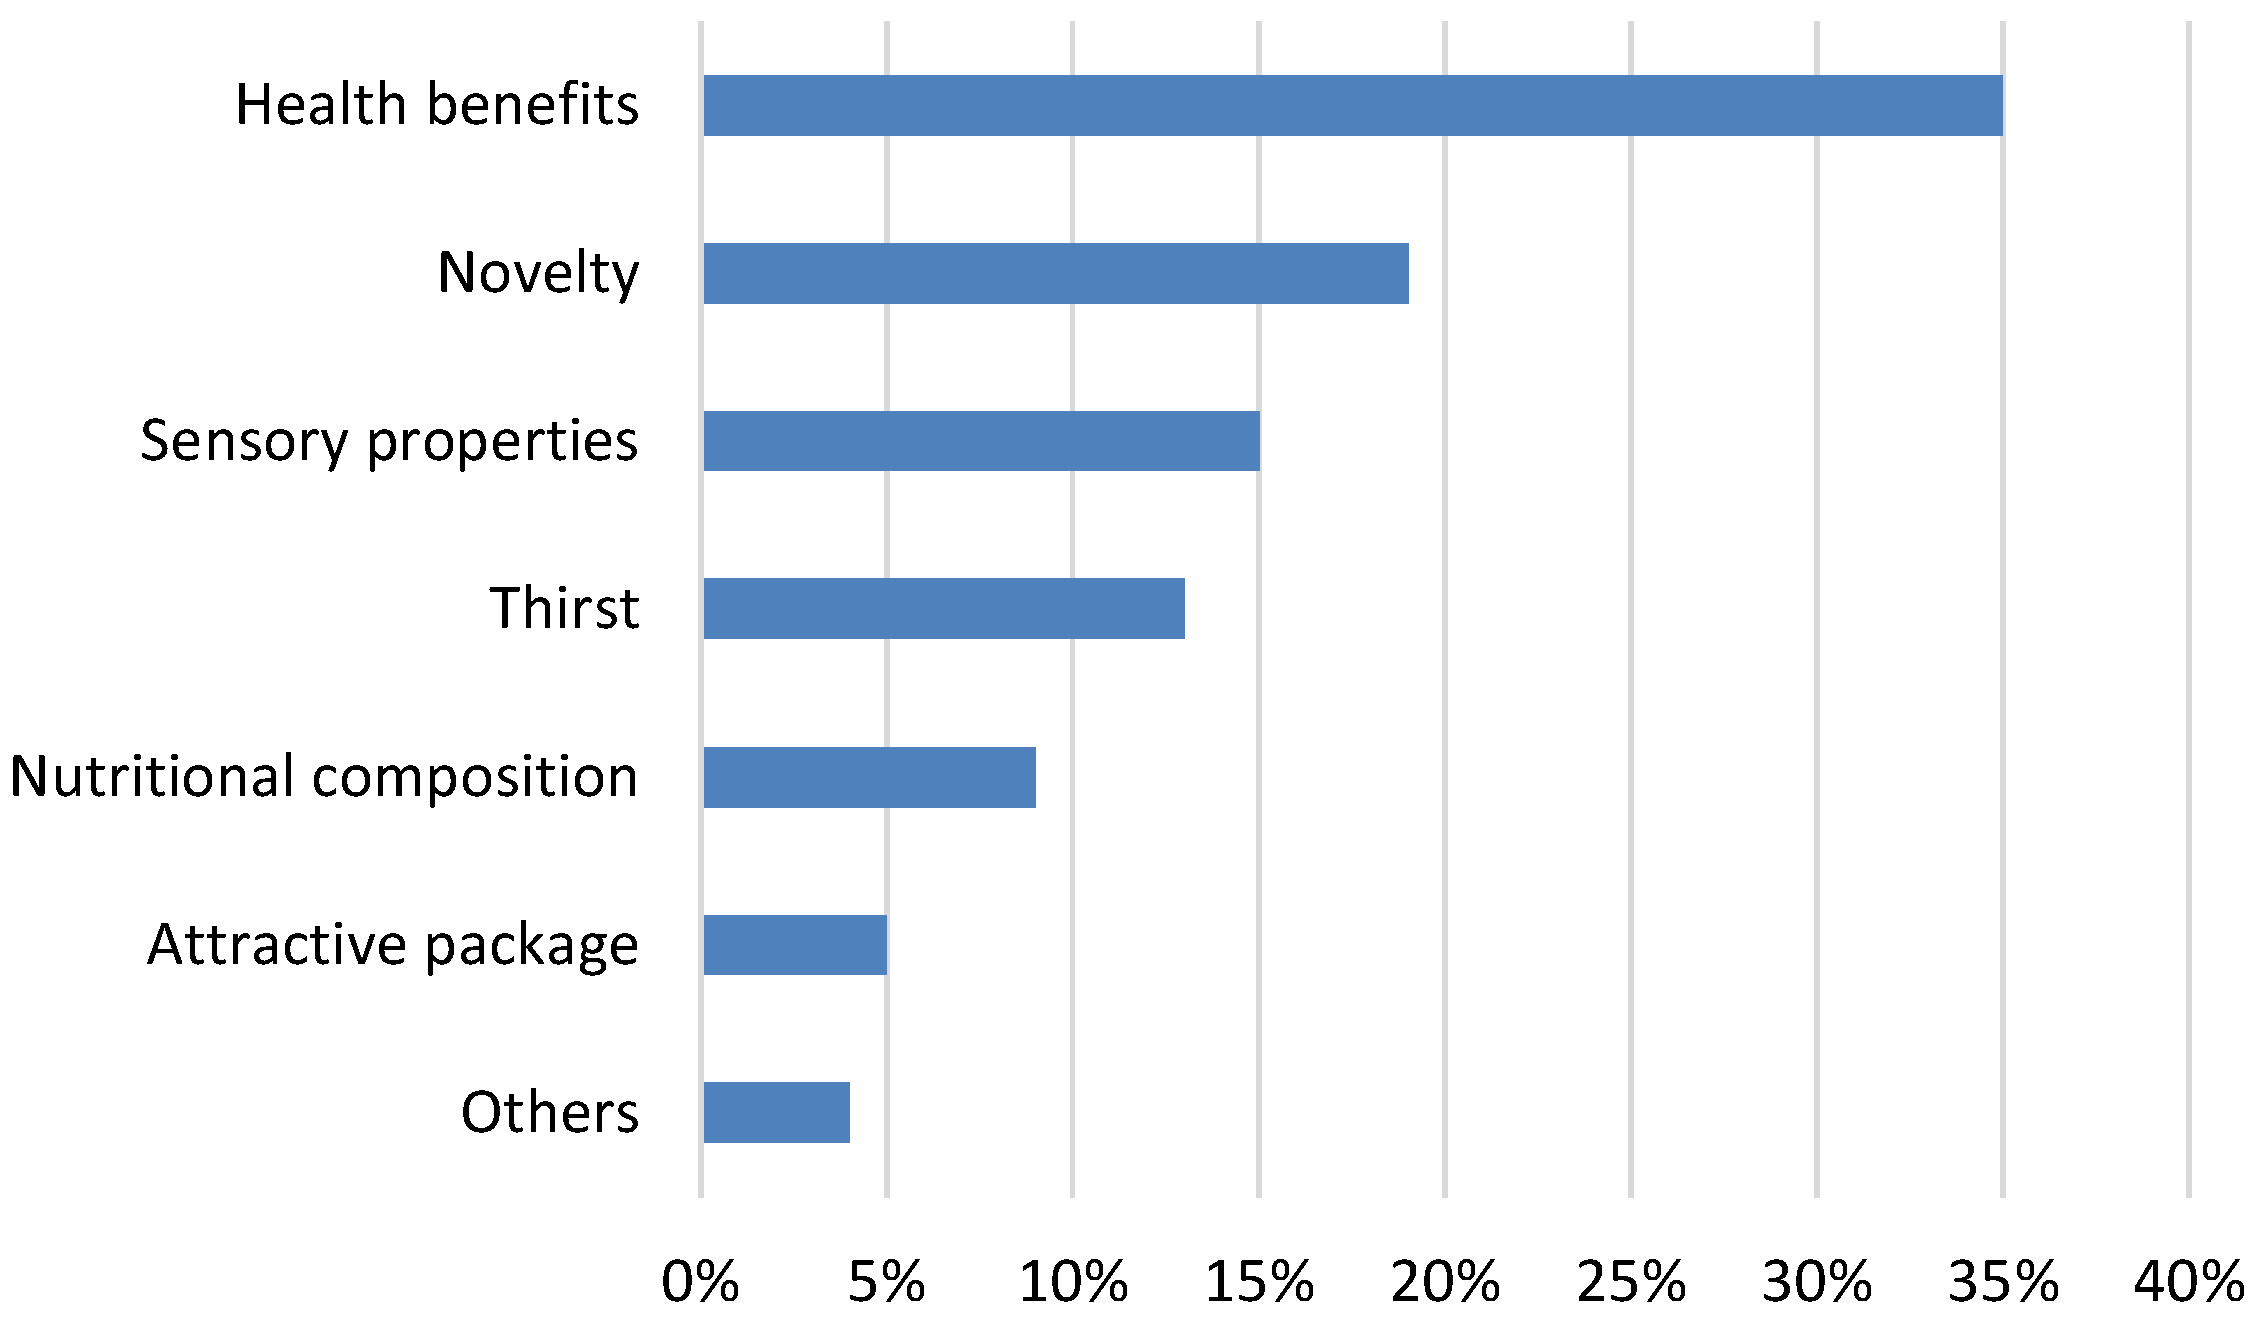
The main motivations to drink Bissap by a sample of Portuguese consumers are presented in
Figure 2. Potential health benefits were the main reason mentioned by Portuguese consumers for drinking the Bissap beverage. This motivation is mostly given by women (75%), opposed to sensory properties which men valued more (90%). Novelty is also an important factor for both genders (50% each). Participants were told beforehand that this beverage is rich in antioxidant components, and as these components might be important for health, it seems they would be willing to drink it even if the flavor is not as pleasant as they expected. This finding is in line with the results of Sparke and Menrad (2009) [
9], where health is also identified as one relevant motivation for the consumption of functional beverages. Flavor and perceived health benefits are two important considerations for food acceptance and it has been discussed in the functional foods context by some authors. According to Verbeke (2006) [
12], as a general rule, consumers are hardly willing to compromise functional food taste for health. Sabbe
et al., (2009) [
10] concluded that Belgian consumer acceptance and intention to purchase açaí fruit juices is mostly driven by sensory pleasure rather than recognized health benefits.
3.1.5. Willingness to Pay
Regarding the willingness to pay for the Bissap beverage, about 60% of the participants would buy 1 L packages in the supermarkets and the range of prices should be between €0.70 and €2/L, although for the majority the range was smaller and should be between €1.5 and €2/L. The remaining 40% would buy smaller packages instead, say 0.33 cl packages, in specific spots within supermarkets, cafés, and bars. For this group right prices would vary between €0.35 and €0.50, to be paid in supermarkets, and €0.8 and €1.00 in cafés or bars.
Packaging had an impact on product choice too. Participants spontaneously highlighted their preferences for packaging material: 14% would prefer glass bottles for this type of beverage, while the majority of participants would prefer tetra-pack packaging. Cans were referred to as unsuitable for this type of beverage. Some participants also mentioned that they would be willing to pay a premium for very attractive packaging, on the condition that the packaging labelling includes relevant information on the product, particularly credible information on this beverage, namely the high antioxidant capacity.
3.1.6. Places for Purchase
This topic covers the places where consumers would like to have the Bissap beverage available for purchase. Almost all participants would like to buy it in supermarkets (82%), cafés (27%), bars (23%), and restaurants (9%). In addition, convenience shops, pharmacies, and petrol station shops were also mentioned by 5% of participants.
3.1.7. Possible Applications/Usages
This topic surveyed consumers’ ideas and perceptions on the possible uses of the Bissap flavor in food processing.
Table 6 summarises the uses proposed by participants and the frequency of proposed use. According to participants’ views, Bissap might not only have great potential to be used in food industry applications, but also for home-made applications. Most suggestions are related to sweet foods (desserts) and to beverages.
3.1.8. Influence of the African Origin Expressed on Label
This topic surveyed participants’ opinion on the effect of the disclosure on labelling the Bissap as a product of African origin. The concern was that the Portuguese market might have a negative perception of foods of African origin. It was observed that consumers are split in two different clusters in this matter. The minority (9%—men aged 18 to 25), think that labels and labelling information, are not at all important, because consumers’ like themselves do not read or look at it at all; so for them it does not really matter whether the product origin is mentioned. For the majority of participants (81%) however, there is a general agreement on the importance of labelling information, especially relating to the product’s geographical origin (Africa). One of the reasons given is because they like to be informed about the product, knowing its origin, or even getting some extra background information. Another reason also referred to was because Africa has a less intensive agriculture, not overusing pesticides, for example, and some consumers can link this to healthier agricultural products, which means that this information might even add consumer value to the product. Additionally, it was also mentioned that since Africa is very much associated with charity campaigns, it could be an advantage to include this information on labelling, as it would increase the consumer choice likelihood. Summarizing, the research showed a positive response to the Africaness of the product.
3.2. Quantitative Study–Conjoint Analysis
3.2.1. Most Important Attributes and Ideal Profile
The findings from the focus groups were used as input for the first step of conjoint analysis. The attributes and levels decided are presented in
Table 7. The levels are the alternative intensities assumed for the attributes. Based on the evaluation by the participants of the hypothetical product profiles, and applying the Conjoint Module of the Statistical software package SPSS 19, the relative importance that participants attach to each attribute and the utility they attach to the levels of these attributes were estimated. The results are presented in
Table 7. For interpretation of the utility it is worth knowing that a higher value means that the attribute, or attribute level, is more important to the respondents (Malhotra, 1996 [
25]). All the attributes were classified as discrete variables, although a negative linearity for price could also have been assumed, as the lower the price, the higher the benefit for the consumers; nevertheless the results did not differ significantly.
The most noticeably important attribute for these sample of Portuguese consumers related to the Bissap beverage was
price, which had the highest relative importance (29%). This is not so surprising because price is an important determinant of food choices and purchases. In others studies conducted with a similar methodology, price has been the attribute most valued by consumers for different products (Finco
et al., 2010 [
17]; Mesías
et al., 2011 [
26]) and also as the major constraining for non-consumers not buying functional beverages (Sparke and Menrad, 2009 [
9]). As would be expected, there is an inverse relation between price and utility, as the higher the price the lower utility. Consumer likelihood of purchase is also significantly affected by the nutritional value (the number of
calories), and the relative importance for this attribute reached 24%. In this case the low nutritional value is perceived as health related since lower calories would lead to weight loss, as it would explain the observed inverse relation between utility and the number of calories. Also with a relative importance of 24% came
packaging,
i.e., packaging material. It is interesting to note that for this group of consumers the packaging information is not as important as
antioxidant information (6%),
Bissap information (6%) or the reference to the
African origin (5%) of the product. This is consistent with the evidence reported by Sparke and Menard (2009) [
9] for a functional orange juice: packaging holds a relative importance higher than the health claims. A possible explanation for this is given by Bech-Larsen and Grunert (2003) [
18], suggesting that the perception of the healthiness of functional foods is more dependent on perception of the product’s nutritional qualities than on any type of health claim. Among the attributes evaluated, the color also does not seem to be a relevant one for purchasing intention since its relative importance is 6%.
The preferred Bissap beverage profile is determined with the high utility of each level for each attribute. In this case, it corresponds to a price of €0.99/L, light caloric (less than 18 kcal/100 mL), tetra-pack package, light red color, with antioxidant information and Bissap information on the labelling. This group of consumers did not value the information about the African origin of the beverage.
The consistency of the participants’ responses,
i.e., that the model fits individual data, can be evaluated by calculating the Pearson correlation coefficient (
R) between the original ratings given by respondents and those determined by the model (Malhotra, 1996 [
25]). The value of
R is = 0.972 (
p < 0.001) indicating that the model predicted the participant preferences well. Also the Kendall’s tau for Holdouts coefficient, which is an indicator of internal validity, has a high value of 0.914 (
p < 0.001), which indicates a good predictive ability.
3.2.2. Consumer Performance Segmentation
The market segmentation is the process of finding groups of similar consumers in terms of some specific criteria of relevance to the product strategic context (Lilien
et al., 2007 [
27]). In this study, a cluster analysis was applied in order to classify participants into homogenous preference clusters.
The calculations were performed with the cluster module of the statistical software package SPSS 19, using first a hierarchical cluster analysis and Ward’s distance method, and then a non-hierarchical clustering procedure, the k-means cluster procedure. The inputs used were the utilities for each participant. A four-cluster solution was selected as being the one optimizing similarity within clusters and dissimilarity between clusters. The results are presented in
Table 8. In bold are the highest utilities for each cluster, and these values were used to discriminate and profile the clusters. An analysis of variance of the utilities showed that cluster preferences did not differ significantly with respect to the attributes:
color,
antioxidant information,
Bissap information, and
information about African origin, but did differ significantly in relation to the attributes:
price,
calories, and
packaging; for this reason they are marked * in
Table 8.
Cluster 1 (
n = 27) shows that price has the highest relative importance. For this cluster the relative importance of all other attributes (except
packaging) are close to each other and far less important than
price. We called this consumer segment the
price sensitive consumers. Cluster 2 amounts to about one-fifth of the participants (
n = 17) and is the group showing the highest relative importance of calories. Besides price, which is in second position for this cluster, all the other attributes are not so relevant and are therefore less choice influential for this type of consumers. We called this group the
body concerned consumers. Cluster 3 is the smallest cluster (
n = 12), and for this group the most important attribute is clearly packaging. All the other attributes have lower (and similar) relative importance. We called this segment the
packaging attracted consumers. Cluster 4 encompasses the greatest fraction of participants (
n = 45). For this segment three different attributes presents similar importance: price, packaging, and calories. For this reason, this segment was called the
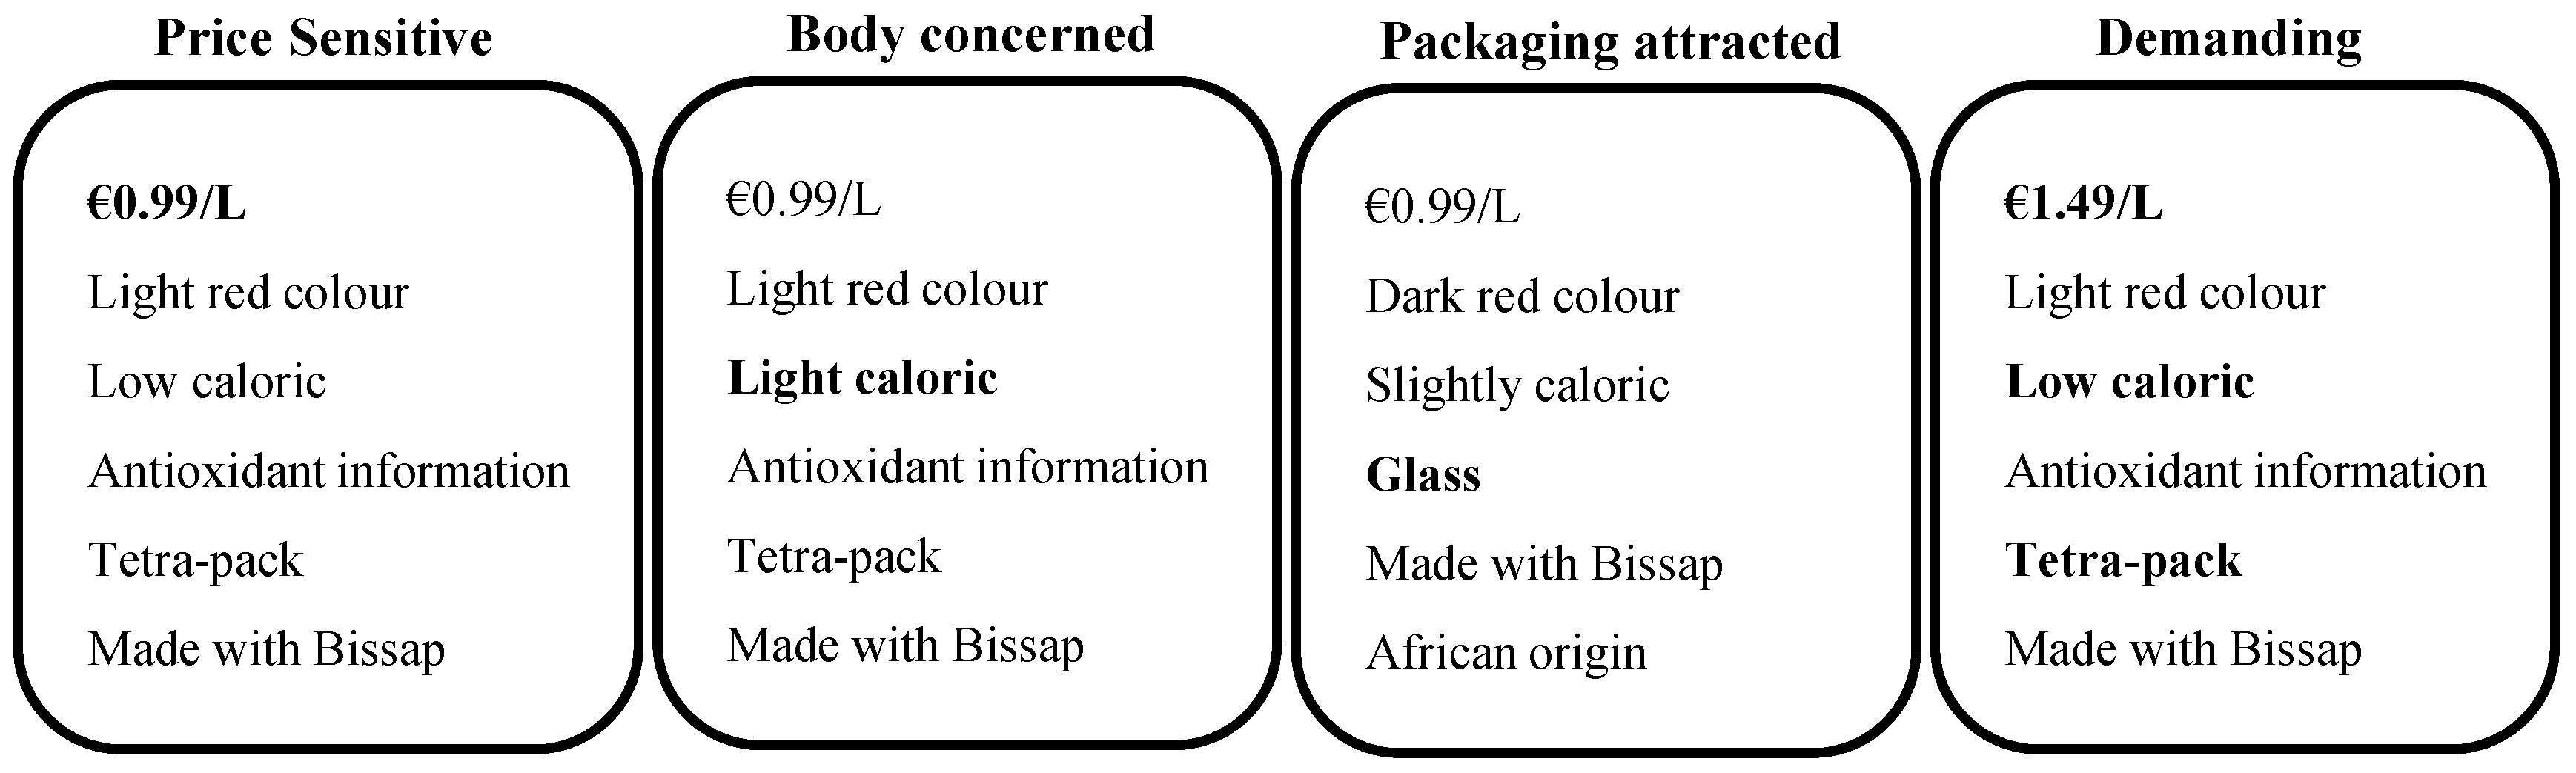
demanding consumers, because they probably look for the best combination of those three attributes during purchase. An ideal profile of a Bissap beverage for each cluster was defined by identifying the optimal combination of the levels of the attributes according to the fitted preferences model, and is given in
Figure 3. The ideal Bissap profile for clusters 1 and 2 only differ in the desirable number of
calories. The difference between clusters 1 and 4 is the desirable
price and the differences between clusters 2 and 4 are the
price and the number of
calories. The most different Bissap profile is achieved by cluster 3 which only has
price in common with clusters 1 and 2. It seems that there is a consensus between all clusters where the information
made with Bissap is indeed influential for product choice.
Bechoff
et al., (2014) [
7] explored cluster analysis based on acceptance only. This revealed different clusters related to liking of syrups, infusions, or liking both and this was related to color and taste characteristics and associated chemical constituents. Analyzing those clusters with the ones achieved on this study, it could be inferred that
body concerned consumers might be
infusion likers, since calories are shown to be most important attribute and they value the antioxidant information, which is congruent with the concept of infusion. This research suggests that adding other factors related to purchase can give different and revealing results.
For market segmentation, it is important to find characteristics enabling discrimination between clusters. The four clusters are therefore described in terms of their socio-demographic characteristics and consumption habits (frequency of juice consumption) in
Table 9, as a complement to the preference profiling for each one.
The main characteristics of each cluster are: Cluster 1—price sensitive—is characterized as being mostly women, aged over 37. Cluster 2—body concerned—this group includes mostly women and consumers with the lowest frequency of juice consumption. Cluster 3—packaging attracted—this cluster includes mostly men, aged less than 37 years, who have consumed juice between one and three times a month. Cluster 4—demanding—this cluster is characterized by consumers that are not the main income earner, belonging to middle class or above, and having the highest frequency of juice consumption.
Despite the identification of four different preference clusters and profiling them, it was not possible to find significant differences (according to the Chi-square tests done) between the clusters on their descriptors. With the characteristics covered by this study, it was possible to establish that heterogeneity between clusters was not found at a significant level, and that is a necessary criterion to be met if one is to find a relevant segmentation (Lilien
et al., 2007 [
27]). Maybe using a larger sample and/or different characteristics or attitudes related to the participants could achieve such significant differences. So, further studies are required to find out if there are significantly different segments.
4. Discussion between the Focus Groups and Conjoint Analysis Results
Based on the results, it was not possible to conclude the relevance of the information on the African origin expressed on the packaging. According to the perception expressed by the majority of consumers in the focus groups this attribute was classified as very important, adding value to the product, and positively affecting purchase. However when this attribute was assessed within a full product profile, in combination with other attributes, and consumers are forced to indicate their likelihood to purchase, the relative importance of this attribute decreased to the point of becoming the lowest priority. Further studies should explore this issue for better clarification.
The price of €0.99/L in the conjoint study was shown to be the most relevant attribute, and one cluster was even called the price sensitive consumers. In the focus group consumers said they were willing to pay between €1.5/L and €2/L, or even more for more attractive packaging and if the possible health benefits of Bissap were credibly displayed. In the focus groups, consumers experienced the beverage, i.e., they saw, talked about, and tasted the beverage and this experience might be the reason why they stated they would be willing to pay more at the time. In addition, the focus groups’ discussions were context related, which is an important factor to attach to an attribute such as the price. Another relevant issue in focus groups can be the fact that participants share opinions within a group and some sensitive social issues may be affected, namely the price.
Another important outcome from both methods is the perception of high sugar levels evaluated during the tasting in the focus groups, which is confirmed by a desirable light or low caloric beverage in the conjoint study. This makes sense when the main motivation for Bissap beverage consumption is the perceived health benefits, and the body concerned cluster is identified by the conjoint study. What is not so clear is the lowest importance attached to the antioxidant information in the conjoint study, but again, a forced choice between product profiles gives priority to what is indeed the most relevant attribute.
Packaging also appears to be a relevant attribute in both methods and this outcome is therefore in agreement. It seems clear that tetra-pack and glass are the most suitable type of packaging for this beverage, while cans are perceived as unsuitable.
5. Limitations and Further Studies
This study was performed in Portugal with a convenient and relatively small sample of participants. So, the results obtained are obviously not generalizable to the whole population. So, in order to achieve cross-cultural validation, further studies in other European countries should be performed, using larger sample sizes. Also, a smaller number of Bissap beverage profiles (combination of attributes) should be tested such as sensory related ones. As significant differences between the four segments, by using the socio-economic variables and the frequency of juice consumption, were not achieved, other variables should be tested to gain more knowledge about the possible segments of Bissap drinkers. Results from the qualitative and quantitative studies were shown to be inconclusive to some extent and for some aspects; this might be due to the fact that the quantitative studies were performed with a hypothetical product. In addition, the effects of food neophobia should be investigated, as Bissap is relatively unfamiliar taste to Europeans. It would be interesting to use the insights from this study to reengineer the Bissap beverage and to include sensory evaluation, food neophobia, and product imaging together in future studies.
6. Conclusions
Bissap beverage is not commonly consumed in Europe and is largely unknown to the general population. Due to its nutritional composition, it may have great potential to be considered as a functional beverage, and this probably increases its consumer value and market acceptability. In the field of consumer food behavior studies, one of the major challenges is to identify the key factors for consumer acceptance and choice, so this study encompasses this goal, focusing on a Bissap beverage for Portuguese consumers. Despite being unfamiliar with the Bissap flavor, the global sensory appreciation of Portuguese consumers of this beverage is mostly positive. Also important insights were given for the reengineering of the Bissap beverage in a European context. This study shows that the original beverage has high sugar content and that consumers value more a light/low caloric beverage. In addition, the actual composition does not seem to be compatible with a heathy beverage concept. The four clusters of consumers identified are well discriminated in terms of their preferences: price sensitive, body concerned, packaging attracted, and demanding. These clusters confirm and highlight the most relevant attributes for the choice of Bissap beverage: price, calories, and packaging.
The findings of this study encourage further studies to gain and disseminate more knowledge on the acceptability of the Bissap beverage on the European market.


