3.1. General Phenolic Composition and Color of Wines
Table 1 and
Table 2 display the results obtained in the spectrophotometric analysis of Mencia (M) and Alicante Bouschet (T) wines, and
Table 3, the mean values with their standard deviation, and the range values of each parameter determined by spectrophotometry for both groups of wines. As can be noted, the grape cultivar used for making wines dramatically affects several parameters related to color and to the general phenolic composition of wines measured by spectrophotometry. Mean values for most parameters were significantly different (
p < 0.05), taking into account the results of the LSD Fisher test, after submitting data to one-way ANOVA (
Table 3).
Thus, total phenols index, as well as color intensity (420 + 520), color intensity (420 + 520 + 620), total anthocyans (which include anthocyanins and polymeric red pigments), total anthocyanins (free anthocyanins) and colored anthocyanins were higher in most Alicante Bouschet wines (samples T21 to T30) than in Mencia wines (samples M1 to M20). The most remarkable exceptions were two deep-colored Mencia wines (M7 and M19), which were as rich as wine T25, made with Alicante Bouschet grapes, for the following parameters: color intensity (420 + 520), color intensity (420 + 520 + 620), total phenols index and total anthocyanins.
Moreover, two samples of Mencia wine (M16 and M17) contained high levels of total anthocyans and total anthocyanins, even higher than several Alicante Bouschet wines, but this fact was not reflected in color intensity, despite all the wines presented similar pH. This can be explained because in those Mencia wines the concentration of total tannins (which include oligomeric flavan-3-ols, as well as polymeric pigments formed by reaction of anthocyanins and flavan-3-ols) was too low (less than 600 mg/L). Thus, copigmentation of free anthocyanins with oligomeric flavan-3-ols could be negatively affected, leading to low values of color intensity, despite the relatively high content of total anthocyans and total anthocyanins [
23].
The content of total tannins was higher in most Alicante Bouschet wines than in Mencia wines; the exceptions were Mencia wines M7 and M19, which were as rich as many Alicante Bouschet wines, and Alicante Bouschet wines T21 and T22, which contained very low levels of total tannins. Mencia wines M7 and M19 presented a high level of total tannins and a high color intensity, and this fact is probably due to copigmentation of free anthocyanins with oligomeric flavan-3-ols [
23], despite their low level of total anthocyans and total anthocyanins. Alicante Bouschet wines T21 and T22, with a remarkable low level of total tannins, presented a high content of total anthocyanins and total anthocyanins, as reflected in color intensity. Thus, it is quite probable that maceration of skins and seeds during making of these wines was too short, as the extraction of flavan-3-ols from skins and seeds is not as quick as the extraction of anthocyanins from skins [
5].
Hue and chemical age are parameters used to evaluate the extent of wine maturation [
17,
18]. Values of hue (between 0.429 and 0.688) are those expected for young red wines, Alicante Bouschet wines presenting more similar values (between 0.490 and 0.595) than Mencia wines. Chemical age index, which refers to the increasing dominance of wine color by oligomeric and polymeric red pigments, was quite variable, but in most cases ranged between 0.070 and 0.120, as can be expected in young red wines [
18]; one-way ANOVA revealed that chemical age was statistically equal (
p < 0.05) for both types of wines (see
Table 3). The variations observed in values of hue and of chemical age index are probably due to differences in the extent of polymerization, which depends on the phenolic composition of wines and in other factors, like the extent of oxygenation of wines once the alcoholic fermentation has taken place.
Results obtained by UV-VIS spectrophotometry (nine variables) were submitted to principal components analysis (PCA), an unsupervised pattern recognition method that seeks trends and groupings without prior knowledge of the identity of the samples, that it is used to determine the variability of a dataset, and to order data by their importance. Thus, it is possible to obtain
m principal components, that are lineal combinations of the
m variables considered, capable of explain the total variance of the data matrix [
24]. Two principal components, with eigenvalues higher than 1, explained 89.64% of total variance; each principal component was affected mainly by several variables. Thus, component 1, which explained 66.34% of variance, was affected mainly by seven variables, the exceptions were hue and chemical age index. On the other hand, component 2, which explained 23.30% of total variance, was affected mainly by five variables, and the weight of three variables (color intensity (420 + 520), color intensity (420 + 520 + 620) and total phenols index) was very small (
Table 4).
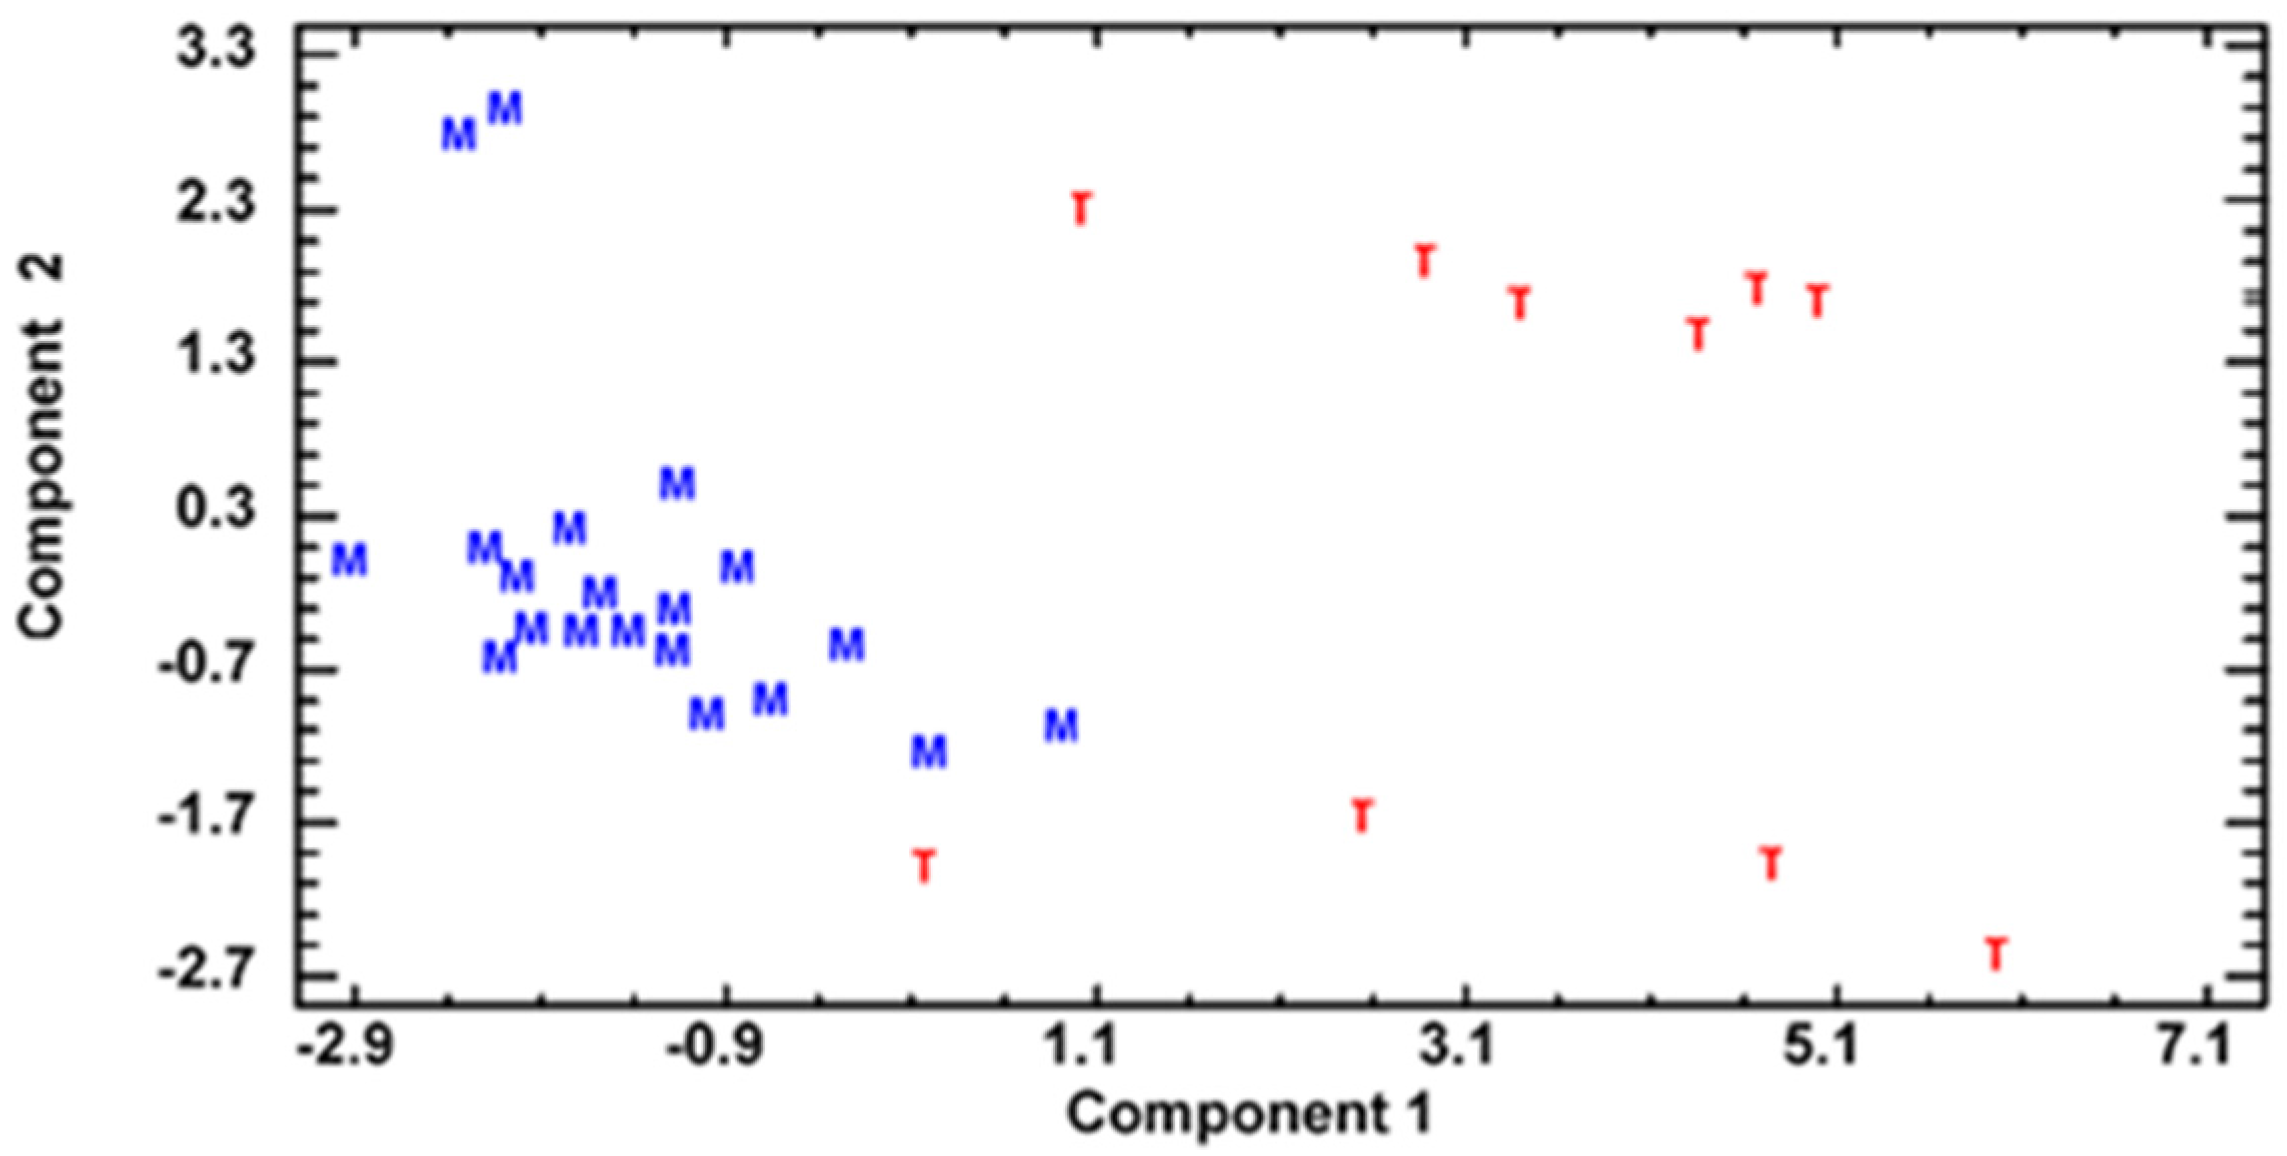
The plot of principal components 1 and 2 obtained by PCA is displayed in
Figure 1. As can be noted, Mencia wines are placed in the left side of the plot, and most Alicante Bouschet wines in the right side of the plot. Most Mencia wines are located forming a quite compact cluster, reflecting than those wines presented similar values for the variables considered, the exception were wines M16 and M17, located in the upper left corner of the plot. These wines contained a higher amount of total anthocyans and total anthocyanins, but a low amount of total tannins. Alicante Bouschet wines are more dispersed: wine T25 presented a phenolic composition quite similar to most Alicante Bouschet wines, and is located among them, the other nine were generally too rich in color and total tannins, and are clearly separated from Mencia wines. Additionally, linear discriminant analysis (LDA) was performed for data of general phenolic composition and color of wines. This analysis showed clearly that all wines were correctly classified in two different classes (Mencia and Alicante Bouschet); the standardized coefficients of the discriminant function had an absolute value higher than one for all the analytical variables considered, except total tannins and hue. The differences observed for color and general phenolic composition among the Alicante Bouschet wines under study may be explained by two different, independent factors: the degree of maturation of grapes and the extent of pomace maceration during winemaking. Several authors consider that the content of tannins in whole grapes decreases during maturation [
25,
26]; thus, the degree of maturation of grapes used for winemaking may affect in some extent the content of tannins in wines. On the other hand, the extraction of tannins during winemaking follows different kinetics than the extraction of anthocyanins: these colored molecules are extracted in the first steps of winemaking, and a maximum is reached in the first week of pomace maceration [
5], meanwhile, the extraction of tannins proceeds more slowly, and can be enhanced by several technological procedures, such as extended maceration [
27]. For these reasons, and taking into account that Alicante Bouschet wines made in AOC Valdeorras are many times used for blending with Mencia wines to increase their color, it is quite probable that an appropriate management of winemaking could lead to Alicante Bouschet wines with various phenolic profiles, depending on the style of wines required by cellars.
3.2. Anthocyanin Fingerprint of Wines
The anthocyanin fingerprint or anthocyanin profile of a wine has been defined as the proportions of different anthocyanins presented in wine after HPLC analysis, and it has been proposed as a tool to assess the varietal origin of single cultivar wines [
28,
29]. To evaluate the anthocyanin fingerprint of wines, the relative content of 14 anthocyanins has been considered (
Table 5 and
Table 6):
3-O-Glucosides of delphinidin (DpGl), cyanidin (CyGl), petunidin (PtGl), peonidin (PnGl) and malvidin (MvGl)
Acetyl derivatives of DpGl, PtGl; PnGl and MvGl (DpGlAc, PtGlAc, PnGlAc and MvGlAc)
p-Coumaryl derivatives of DpGl, PtGl; PnGl and MvGl (DpGlCm, PtGlCm, PnGlCm and MvGlCm)
Caffeoyl derivative of MvGl (MvGlCf).
Additionally,
Table 7 displays the mean values with their standard deviation, and the range values of each parameter determined by HPLC for both groups of wines; mean values were significantly different (
p < 0.05) in most cases, taking into account the results of LSD Fisher test, after submitting data to one-way ANOVA. In both types of wine, MvGl was the major anthocyanin, but its relative amount was always higher in Mencia wines (55%–66%) than in Alicante Bouschet wines (43%–54%), because Alicante Bouschet wines contained an important amount of PnGl (18%–31%), as it has been reported previously [
11,
30]. This fact is a consequence of the abundance of PnGl in Alicante Bouschet grapes, both in the skins and, especially, in the berry flesh, like in some other teinturier grapes [
30]. Moreover, Alicante Bouschet wines contained a higher amount of CyGl than Mencia wines (0.6%–1.6% and 0.1%–0.5%, respectively), as this pigment is the biosynthetic precursor of PnGl [
31]. Finally, most Mencia wines contained a higher proportion of PtGl than Alicante Bouschet grapes, because PtGl is the biosynthetic precursor of MvGl, which is formed after its
O-methylation [
31].
Acylation of anthocyanins follows different trends in both types of wines. Certainly, the acylated derivatives of MvGl were the major acylated anthocyanins in both types of wines, but acylation was more intense in Mencia wines (18%–24%) than in Alicante Bouschet wines (14%–18%). In Mencia wines, acetylated anthocyanins were more abundant than
p-coumarylated anthocyanins (10%–16% and 5%–11%, respectively). On the other hand, the relative amount of
p-coumarylated anthocyanins was higher than the relative amount of acetylated anthocyanins in Alicante Bouschet grapes (9%–11% and 5%–7%, respectively). Similar results have been reported previously for Mencia and Alicante Bouschet wines [
30], and are closely related to the different anthocyanin fingerprint of those grape cultivars.
Results obtained by HPLC-DAD analysis of anthocyanins to obtain the anthocyanin fingerprint of wines (14 variables) were submitted to PCA.
Table 8 displays the weights in the principal components 1, 2, and 3 of the variables determined by HPLC-DAD to obtain the anthocyanin fingerprint of wines. Those three principal components, with eigenvalues higher than 1, explained 84.66% of total variance; each of them was affected mainly by several variables. Thus, component 1 (which explained 55.20% of total variance) was affected mainly by seven variables with weight >0.3 or <−0.3; component 2 (which explained 17.05% of total variance), by five variables with weight >0.3 or <−0.3, and component 3 (which explained 12.41% of total variance) by three variables with weight >0.3.
Some relationships among variables, probably related to the biosynthetic pathway of anthocyanins, can be observed. Thus, CyGl and PnGl, which are the cyanidin-derived monoglucosides [
31], had a positive weight for principal components 1 and 2; on the other hand, the delphinidin-derived monoglucosides (DpGl, PtGl and MvGl) had a negative weight for principal component 1. Moreover, acetylated anthocyanins had a negative weight for principal component 1, whereas
p-cumarylated derivatives (except MvGlCm) and MvGlCf had a positive weight for principal component 1. In addition, acylated derivatives of PnGl and MvGl had a negative weight for component 2.
The plot of principal components 1 and 2 obtained by PCA is displayed in
Figure 2. Taking into account the weights of variables for principal components 1 and 2, Alicante Bouschet wines, which contained higher amounts of CyGl, PnGl and
p-coumarylated anthocyanins than Mencia wines, are located in the right side of the plot. Meanwhile, Mencia wines, richer in delphinidin-derived monoglucosides and in acetylated derivatives, are placed in the left side of the plot. In addition, LDA was performed for data of the anthocyanin fingerprint of wines. This analysis showed clearly that all wines were correctly classified in two different classes (Mencia and Alicante Bouschet); the standardized coefficients of the discriminant function had an absolute value higher than 25 for DpGl, PnGl, MvGl, and MvGlAc. These results are in agreement with those obtained previously for single variety wines of different cultivars grown in Spain, including Mencia and Alicante Bouschet [
30], and suggest that the anthocyanin fingerprint of young red wines made in the area of AOC Valdeorras should be an adequate analytical tool to assess the grape cultivar used in winemaking.


