Article

Elemental Profiles of Whisk(e)y Allow Differentiation by Type and Region

1
Department of Viticulture & Enology, University of California, Davis, CA 95616, USA
2
Food Safety & Measurement Facility, University of California, Davis, CA 95616, USA
3
Agilent Technologies, Inc., Santa Clara, CA 95051, USA
*
Author to whom correspondence should be addressed.
Current address: Department of Food Science, The Pennsylvania State University, University Park, PA 16802, USA.
Beverages 2017, 3(1), 8; https://doi.org/10.3390/beverages3010008
Submission received: 7 September 2016 / Revised: 20 December 2016 / Accepted: 9 January 2017 / Published: 23 January 2017

Abstract

:
Elemental fingerprints could provide an analytical approach to product differentiation and authentication, and have been used in the past for various distilled spirits, including brandy, gin, bourbon and tequila. However, a comparison of elemental differences between different whisk(e)y types, such as Bourbon and Scotch, is still missing. In this study we compare the elemental fingerprints of 68 commercial whiskies for differentiation by type (Bourbon, Tennessee, Scotch, Irish, Japanese) and region. Concentrations from sub-μg/L to mid-mg/L of 53 different elements were determined with inductively-coupled plasma—mass spectrometry (ICP-MS) and microwave plasma—atomic emission spectroscopy (MP-AES), and used in subsequent statistical analyses. Significant differences in several elements were found for type, and allowed a classification according to whisk(e)y type. Elemental differences were also found for different production areas within Scotland, thus, providing further evidence that Scotch whiskies could be differentiated by elemental analysis. Major sources of elemental differences seem to be processing equipment (Cu, Fe, Ni, Cd, Sn, Mo, V) and raw materials, such as water (Ca, Mg, Fe, Mn, Sr).

1. Introduction

Whisk(e)y1 is an old alcoholic beverage, and its history dates back to BC. In Scotland, commonly known as the cradle of potable whisky production, distillation was popular and encouraged to preserve excess grains [1]. Production processes vary more or less, depending on the type of whisk(e)y and its origin, but in general, different grains, such as malted or unmalted barley, corn and wheat or mixtures thereof, are ground and steeped in hot water for a certain time to create the mash. The extract, or wort, is cooled and allowed to ferment. Similar to other alcoholic fermented beverages, yeasts convert the sugars into alcohol and carbon dioxide, and create a brew with less than 10% (v/v) of ethanol. This product is then distilled two or three times, either in a batch style (i.e., pot still) or a continuous process (i.e., column still). After distillation the “white” whisk(e)y is aged in wooden casks or barrels, typically made of oak wood, for several years. The type of barrel (wood type, new or used, size, etc.) as well as how long the whisk(e)y is aged are again regulated and are another source of differentiation among the different whisk(e)y types. For certain types of whisk(e)y additional steps are taken, such as a filtration step in the case of Tennessee whiskeys, which are filtered through sugar maple charcoal prior to barreling in the so called Lincoln County Process [1].
Bourbon and Tennessee whiskeys must contain at least 51% corn, but typically contain between 60% and 80%, with the remaining grains being either rye, wheat, malted barley or mixtures thereof [2]. In both cases the distilled product is stored in newly charred barrels for at least 2 years, and both have the same alcoholic strength requirements after distillation (max. 80% (v/v)) and before ageing (max. 62.5% (v/v)). The difference between those two types lies in where the whiskey is produced—Kentucky vs. Tennessee, and the additional charcoal filtration step for Tennessee whiskeys [2]. For single malt Scotch the mash contains 100% malted barley, and all production has to occur in Scotland, using copper pot stills. In contrast to Bourbon and Tennessee whiskey, Scotch whisky is stored in used barrels (e.g., from Bourbon or Sherry production) for at least three years. The alcoholic strength is limited to 94.8% (v/v) after distillation and 63.5% before ageing [1]. Whiskies from Ireland are produced from malted or unmalted barley or unmalted grains. The site of production has to be either in Ireland or Northern Ireland. Both copper pot stills and continuous column stills can be used, and typically three distillations are performed. The alcoholic strength is limited to 94.8% (v/v) after distillation, and the final product is aged a minimum of three years in wooden casks [3]. The Japanese whisky tradition is heavily influenced by Scotch production, but with less stringent regulations. In Japan, both malted and unmalted grains, typically barley, are used in one of nine Japanese distilleries, with the majority producing blended whiskies. While copper pot stills are mostly used for double distillation, continuous column stills are also used, mainly for the production of blended whiskies. For aging of Japanese whiskies, both newly charred and used barrels are used for a minimum duration of three years [4].
Analysis of whisk(e)y is aiming at different aspects, with process control and quality assurance of raw materials, intermediate steps and the final products being the most important. Additionally, whisk(e)y production is often strongly regulated with regards to the geographical origin: Scotch whiskies can only be produced in Scotland, while Tennessee and Bourbon whiskeys are required to be distilled in the state of Tennessee, Kentucky, etc. Analytical methods aiming at geographical authenticity testing have gained more interest over the past years [5]: Whisk(e)y is a complex product, containing several hundreds of volatile and non-volatile compounds, so called congeners, including alcohols, esters, acids, phenols, carbonyls as well as sulfur and nitrogen compounds [5], that are typically analyzed by gas chromatography (GC) or liquid chromatography (LC) [6]. Variations in higher alcohol congeners discriminated among Bourbons, Tennessee, Scotch and Irish whisk(e)y samples [7], as well as between different single malt and blended Scotch whiskies [8].
Differences in sensory properties, i.e., aromas and flavors, were also used to discriminate among Scotch whiskies [9] and other whisk(e)y types and spirits [10], with distinct sensory profiles for Scotch whiskies of different categories [9], and between Scotch and other whiskies and spirits [10]. However, these analytical techniques showed overlap for non-Scotch whiskeys [11], therefore, analytical strategies that improve the discriminability of different whisk(e)y types are needed.
From an elemental analysis point of view, several factors impact the elemental profile of whisk(e)y, including origin and type of raw materials used, processing steps, as well as packaging and storage. These factors are not well studied, in fact, there are only a handful of scientific reports that study the elemental profiles of whisk(e)y types exclusively [12,13,14]. This is somewhat surprising as whisk(e)y is appreciated all around the world, and among the different types, demand is growing. For example, in the U.S. single malt Scotch whisky sales nearly tripled over a 13-year period [15], while Bourbon and Tennessee whiskey sales experienced a 155% growth in the same period [16].
In one of these whisk(e)y focused studies, copper levels were used to differentiate between blended and grain malt Scotch whiskies [13], and although elemental analyses of seven additional elements (Zn, Pb, Ni, Fe, Ca, Mg, Na) were obtained, no “characteristic metal fingerprints” [13] (p. 459) could be found to distinguish between different Scotch producing regions, using graphite-furnace atomic absorption spectrometry (GF-AAS).
In the recent years, more advanced and sensitive elemental instrumentation, such as inductively-coupled plasma-mass spectrometry (ICP-MS), became widely available. ICP-MS allows the screening of a larger number of elements with lower detection limits, which in turn could lead to elemental fingerprints that prove to be useful in the discrimination of different whisk(e)y types. ICP-MS and related techniques, such as microwave plasma-atomic emission spectroscopy (MP-AES), have been used successfully in the past to profile the elemental composition of other alcoholic beverages such as wine [17,18], and to differentiate wines due to geographical origin as well as processing site [19]. A similar approach was taken in this study: Elemental profiles of five different whisk(e)y types (single malt Scotch, Irish, Kentucky Bourbon, Tennessee, and Japanese whisk(e)y) were collected and results were used in combination with multivariate methods to differentiate due to whisk(e)y type, and, in the case of Scotch whiskies, due to production area.

2. Materials and Methods

2.1. Samples and Reagents

Sixty-eight commercial whisk(e)y products were used in this study, and approximately 50 mL of each sample were collected into clean, metal-free sampling tubes (VWR, Radnor, PA, USA). Samples, grouped by type, are listed in Table 1 together with the information given on the label, including ethanol content and age, if available. For ICP-MS analyses, all samples were diluted 10-fold in 1% (v/v) nitric acid and 0.5% (v/v) hydrochloric acid [20] in triplicate [21,22,23,24]. Higher concentrated Si, Ca, K, Mg, and Na, were analyzed after 20-fold dilution in 1% nitric acid with microwave plasma-atomic emission spectroscopy (MP-AES).
Multi-element calibration standards for ICP-MS analyses were purchased from SPEX CertiPrep (Metuchen, NJ, USA), the internal standard mix (diluted 1:10 in 1% (v/v) nitric acid prior to use; Bi, Ge, In, Sc, Tb, Y, 6Li) was from Agilent Technologies (Santa Clara, CA, USA), and ultrapure concentrated nitric acid and hydrochloric acid were from Fisher Scientific (Pittsburgh, PA, USA). Ultrapure water (18 MΩ cm, EMD, Millipore, Bellerica, CA, USA) and 200 proof ethanol (GoldShield, Hayward, CA, USA) were used. Calibration tuning mix and Pulse/Analog solutions were from Agilent Technologies. Single-element calibration standards for MP-AES analyses (Si, Ca, K, Mg, Na at 10,000 mg/L,) were purchased from VHG Labs (Manchester, NH, USA), and concentrated nitric acid was obtained from J.T. Baker (Instra-Analyzed grade, Center Valley, PA, USA). The ionization buffer solution (100,000 mg/L Cs; Agilent Technologies) was diluted to 2,000 mg/L in 1% (v/v) HNO3 before use.

2.2. Instrumentation

The ICP-MS instrument used was from Agilent Technologies (8800, Santa Clara, CA, USA), equipped with a concentric micromist nebulizer and a quartz double wall spray chamber, cooled to 2 °C (all Agilent Technologies) [20]. IS solution was mixed with the sample stream before entering the nebulizer in a mixing tee (sample tubing 1.02 mm inner diameter, IS tubing 0.25 mm inner diameter), with the peristaltic pump operating at 0.1 rps. The plasma parameters were 1550 W RF power, 1.8 V RF matching voltage, 10 mm sampling depth, and 1.02 mL/min carrier gas flow (Argon 99.999% purity, Airgas, Sacramento, CA, USA). The ICP-MS was calibrated and tuned daily. Diluted samples were measured in helium (flow 4.3 mL/min; 99.999% purity, Praxair, Benicia, CA, USA) and high energy helium (10 mL/min) modes with the octapole reaction system (ORS3), based on previous reports [12,20]. The instrument was tuned and calibrated daily, and performance was deemed satisfactory if: (i) sensitivity of Li, Y, and Tl were at least 10,000, 20,000, and 10,000 counts per second (cps); (ii) precision was less than 5% relative standard deviation (RSD) for Li, Y, and Tl and background counts were less than 10 cps; (iii) oxides (CeO+/Ce+) were less than 2%; and (iv) doubly charged ions (Ce2+/Ce+) were less than 3%.
For the measurement of the higher concentrated elements Ca, K, Mg, Na, and Si, MP-AES (4200, Agilent Technologies) was used, monitoring the wavelengths at 393.366 nm for Ca, 766.491 nm for K, 285.213 nm for Mg, 588.995 nm for Na, and 251.611 nm for Si. Wavelengths were selected based on previous reports [18,25] to ensure interference-free detection. The 2,000 mg/L ionization buffer solution was constantly mixed with the sample stream immediately before entering the double pass cyclonic spray chamber (Agilent Technologies) held at room temperature using a simple mixing tee (Agilent Technologies). A concentric nebulizer (Micromist; Agilent Technologies) was used for sample transport into the plasma. The instrument was calibrated and tuned daily with the wave calibration solution.
Six-point calibration curves were established for the elements listed in Table 2 using ICP-MS between 0 and 200 μg/L in matrix-matched solutions (1% HNO3, 0.5% HCl, 4% ethanol, all (v/v)) to correct for matrix effects due to the presence of ethanol in the samples. Each element was detected with a 3-point peak pattern in triplicate with 100 sweeps per replicate for all ICP-MS runs. For MP-AES, 6-point calibration curves were established between 0 and 1 mg/L for Ca, Mg, Na, and Si, and between 0 and 2.5 mg/L for K in matrix-matched calibration solutions (2% HNO3 and 2% ethanol, all (v/v)) to account for the sample dilution and matrix interferences. Each element was analyzed in triplicate with replicates of 3 s read time per element.
Continuous QC runs with calibration standards (1 μg/L for ICP-MS, and 100 μg/L for MP-AES) were performed every 20th run for verification. Recoveries for both methods were calculated from spiking experiments at 2 μg/L for ICP-MS elements and 5 mg/L for MP-AES elements into three whisk(e)y samples (B4, I3, S2 for ICP-MS; S2, S27, J4 for MP-AES).

2.3. Data Processing and Analysis

Collected data were inspected and processed using MassHunter Workstation Software for 8800 ICP-QQQ (version 4.2, Agilent Technologies), and MP Expert (version 4.1, Agilent Technologies). For ICP-MS, isotopes used for quantitation (Table 2) were selected based on limits of detection (LOD), determined from 10 calibration blank measurements [26], instrument reported detection limits, background equivalent concentration (BEC), and previous literature [19,27]. For statistical analysis, elements that were present below the LOD were assigned a concentration of LOD/10 [28]. Elements were considered to be present when detected in two of three analytical replicates.
Multivariate and univariate analyses of variance (MANOVA and ANOVA) were carried out for the main effect type, using log-transformed data for elements where the ratio of highest to lowest observed values were above 8, and production area for the subset of Scotch whiskies. Type III sums of squares ANOVA was used to compensate for different observation numbers for the different groupings. Differences were considered significant at a type I error rate of 5%, and Fisher’s least significant differences (LSD) were used for pairwise comparisons. All significantly different elements were used in the subsequent multivariate data visualization with Canonical Variate Analysis (CVA), a type of discriminant analysis. Ninety-five percent confidence intervals of group means were calculated according to Chatfield and Collins [29]. Analyses were carried out in R [30], using the RStudio editor (version 0.99.484, Boston, MA, USA), with the additional packages agricolae [31], candisc [32,33], car [33], cluster [34], ggplot2 [35], reshape2 [36] and FactoMineR [37,38].

3. Results and Discussion

Fifty-eight elements were detected in the measured whisk(e)y samples above their respective detection limits (Table 2), and, thus, are used in the subsequent data analyses. All used elements showed highly linear behavior for the calibrated range (R > 0.9947; Table S1). Concentrations of the QC samples, analyzed continuously throughout the sample runs, ranged between 80% and 115% of the target concentration. For the elements measured by ICP-MS and MP-AES, accuracy, expressed as % recovery, and precision, expressed as relative standard deviation (RSD), were calculated from spiking known amounts of elements into three different whisk(e)y samples (Table S1). This was necessary as no certified reference material for alcoholic beverages is available. Mean recoveries ± RSD ranged from 65% ± 17% for Ba to 121% ± 26% for Pt for the elements monitored by ICP-MS, while recoveries for the five elements monitored by MP-AES were between 102% ± 1% (Ca) and 117% ± 4% (K). Similar recoveries were reported previously for copper (98% [13]; 101.6% [12]) and several other elements (Be, V, Cr, Mn, Fe, Co, Ni, Zn, As, Se, Cd, Sn, Sb, Ba, Hg, Pb, U; between 97.3% and 107.5% [12]), using graphite furnace—atomic absorption spectroscopy (GF-AAS) [13] and ICP-MS [12].

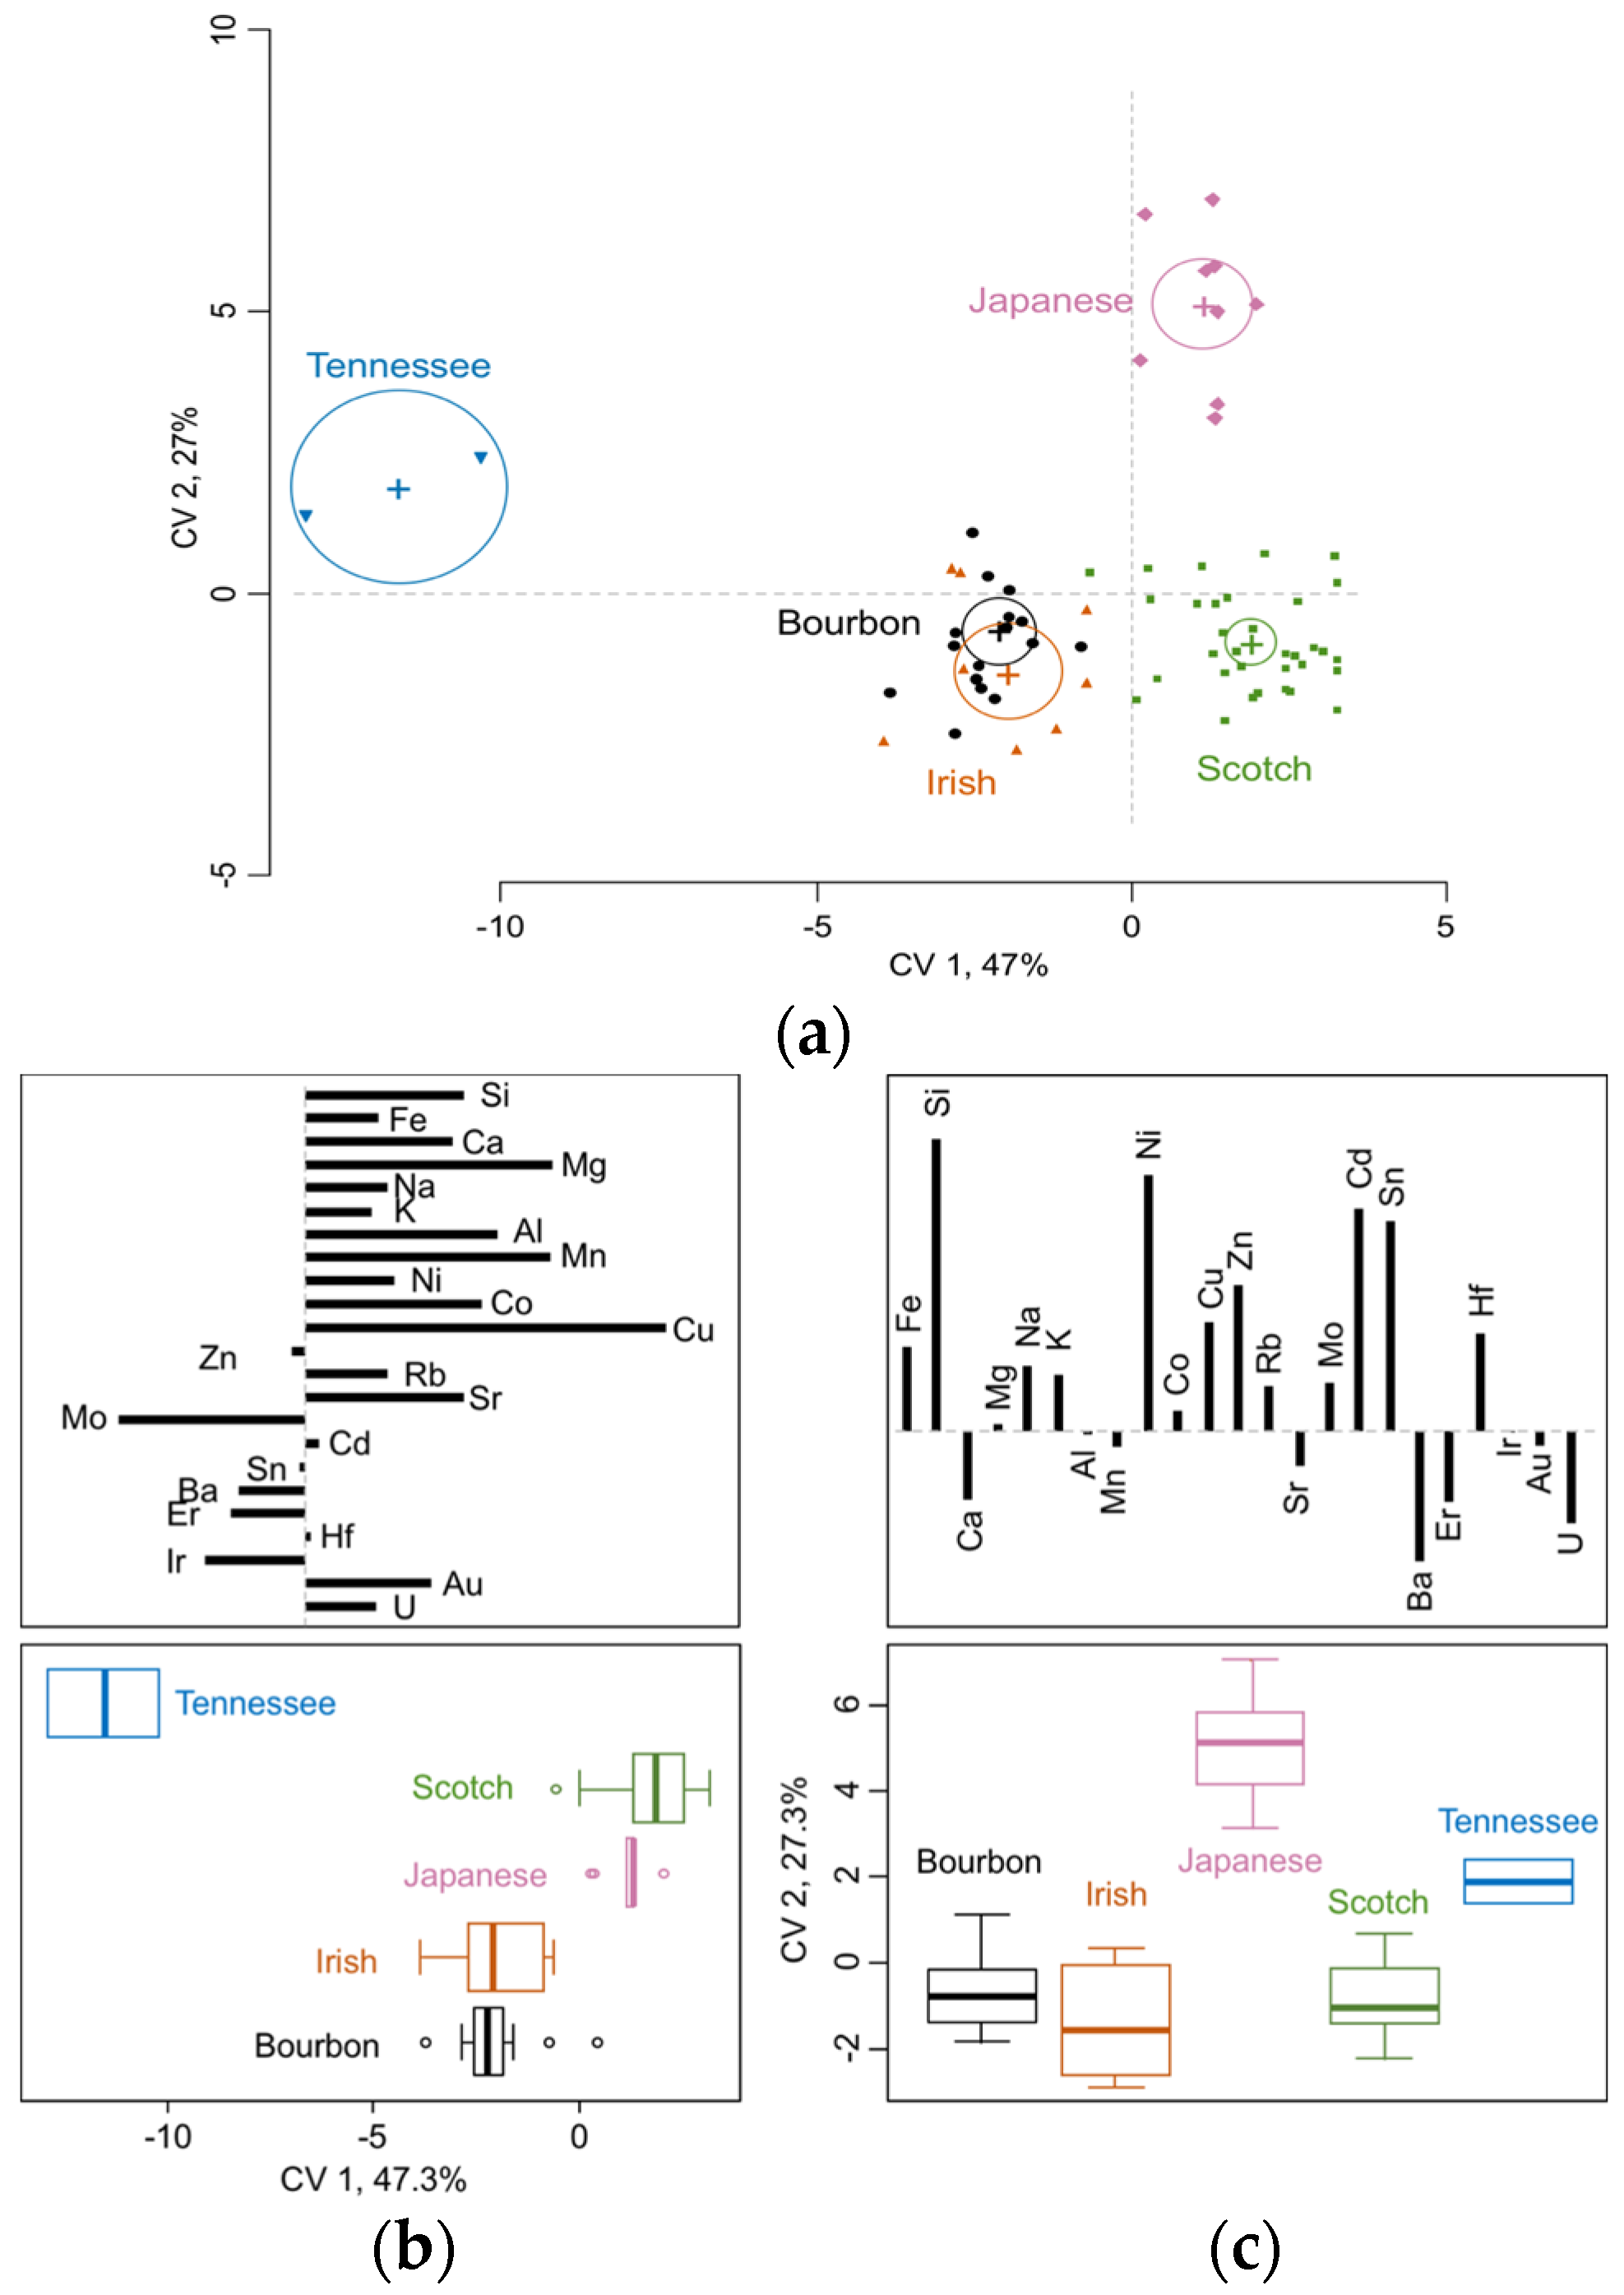
3.1. Whisk(e)y Types Differ Significantly in Elemental Composition

After a significant effect for whisk(e)y type was found with MANOVA, subsequent ANOVAs for type revealed that 23 out of the 58 measured elements differed significantly between the five different types (Table 3). These elements included the major elements Ca, K, Mg, Na, and Si, all with concentration around or above 1 mg/L, the elements at mid-level concentrations Al, Ba, Cu, Fe, Mn, Ni, Rb, Sn, Sr, and Zn (all above 1 μg/L), and the trace elements Au, Cd, Co, Er, Hf, Ir, Mo, and U, at levels below 1 μg/L.
In a subsequent step all significantly different elements (p < 0.05) were used in a Canonical Cariate Analysis (CVA) to test whether different whisk(e)y types could be differentiated by their elemental profiles. CVA is a targeted approach, and is based on a MANOVA model; in this case, a one-way model for whisk(e)y type was used. All four CVA dimensions were significantly different from each other, according to the Bartlett’s test [39], with the first two dimensions explaining over 74% of the total variance ratio. Therefore, only the first two CVA dimensions are shown in Figure 1: The 68 samples cluster according to their type into distinct groups. Although Bourbon and Irish whisk(e)y samples show some overlap, as their 95% confidence interval circles around the group means overlap, these two types are different from each other, and separate from each other in the third dimension, due to higher levels of Na and Al in the Irish whiskies (data not shown). The whiskeys from Tennessee showed the most distinct elemental profile, indicated by their clear separation from all other types, followed by whiskies from Japan, Scotch whiskies, and Bourbons and Irish whiskies. One possible explanation for this could lie in the production method, as Tennessee whiskeys are required to have an additional charcoal filtration step before being transferred to a barrel [40].
Looking into the total structure coefficients (Figure 1b,c), it becomes apparent which elements drive the separation between the different types in the first and second dimension: Along CV 1 (Figure 1b), the most discriminating elements were Mo, which was highest in the whiskeys from Tennessee, and Cu, Mg and Mn, which were lowest in Tennessee whiskeys and highest in Scotch and Japanese whiskies.
Molybdenum as an alloy element is frequently used in stainless steel to increase resistance against corrosion [41], often together with chromium [42]. Due to copper’s ability to reduce sulfur compounds [43] that impart unwanted aromas to the final product, copper is the most commonly used material for whisk(e)y stills. Nevertheless, stainless steel stills are also used in whisk(e)y production, e.g., in combination with subsequent copper columns or copper mesh inside the stainless steel still [44]. Copper levels were shown to vary based on the size of stills, with malted scotch whiskies made in small scale pot stills having higher amounts of copper than blended and grain whiskies from Scotland [13]. In general, most of the copper in whisk(e)y is thought to come from processing equipment compared to raw materials [45].
Along the second dimension, CV 2, Japanese whiskies were separated from Scotch, Bourbon and Irish whiskies, with the Tennessee whiskey samples in between the two (Figure 1c). The separation is mainly driven by higher amounts of Si, Ni, Cd, and Sn and lower levels of Ca, Ba, Er, and U in the Japanese samples. Nickel and zinc are common alloy elements for copper [46], a fact that is substantiated by significant positive correlations to copper for the studied samples (Ni: r(66) = 0.43, p < 0.001; Zn: r(66) = 0.42, p < 0.001). Calcium levels were shown to vary in Scotch whiskies [13], possibly either leaching from barrels over time or originating from water used in the dilution process. Positive correlations between Ca and Mg (r(66) = 0.63, p < 0.001), and Ca and Na (r(66) = 0.43, p < 0.001) in our data indicate that the most likely origin of these elements is the water used in diluting the whisk(e)y to the desired strength, either right after distillation or before bottling [47]. One aspect to consider is that most distilleries use ion exchange clean-up for the water used in the final dilution step, which reduces the levels of Ca, Mg, Fe, and Mn ions in the water, while increasing the levels of Na or K ions.

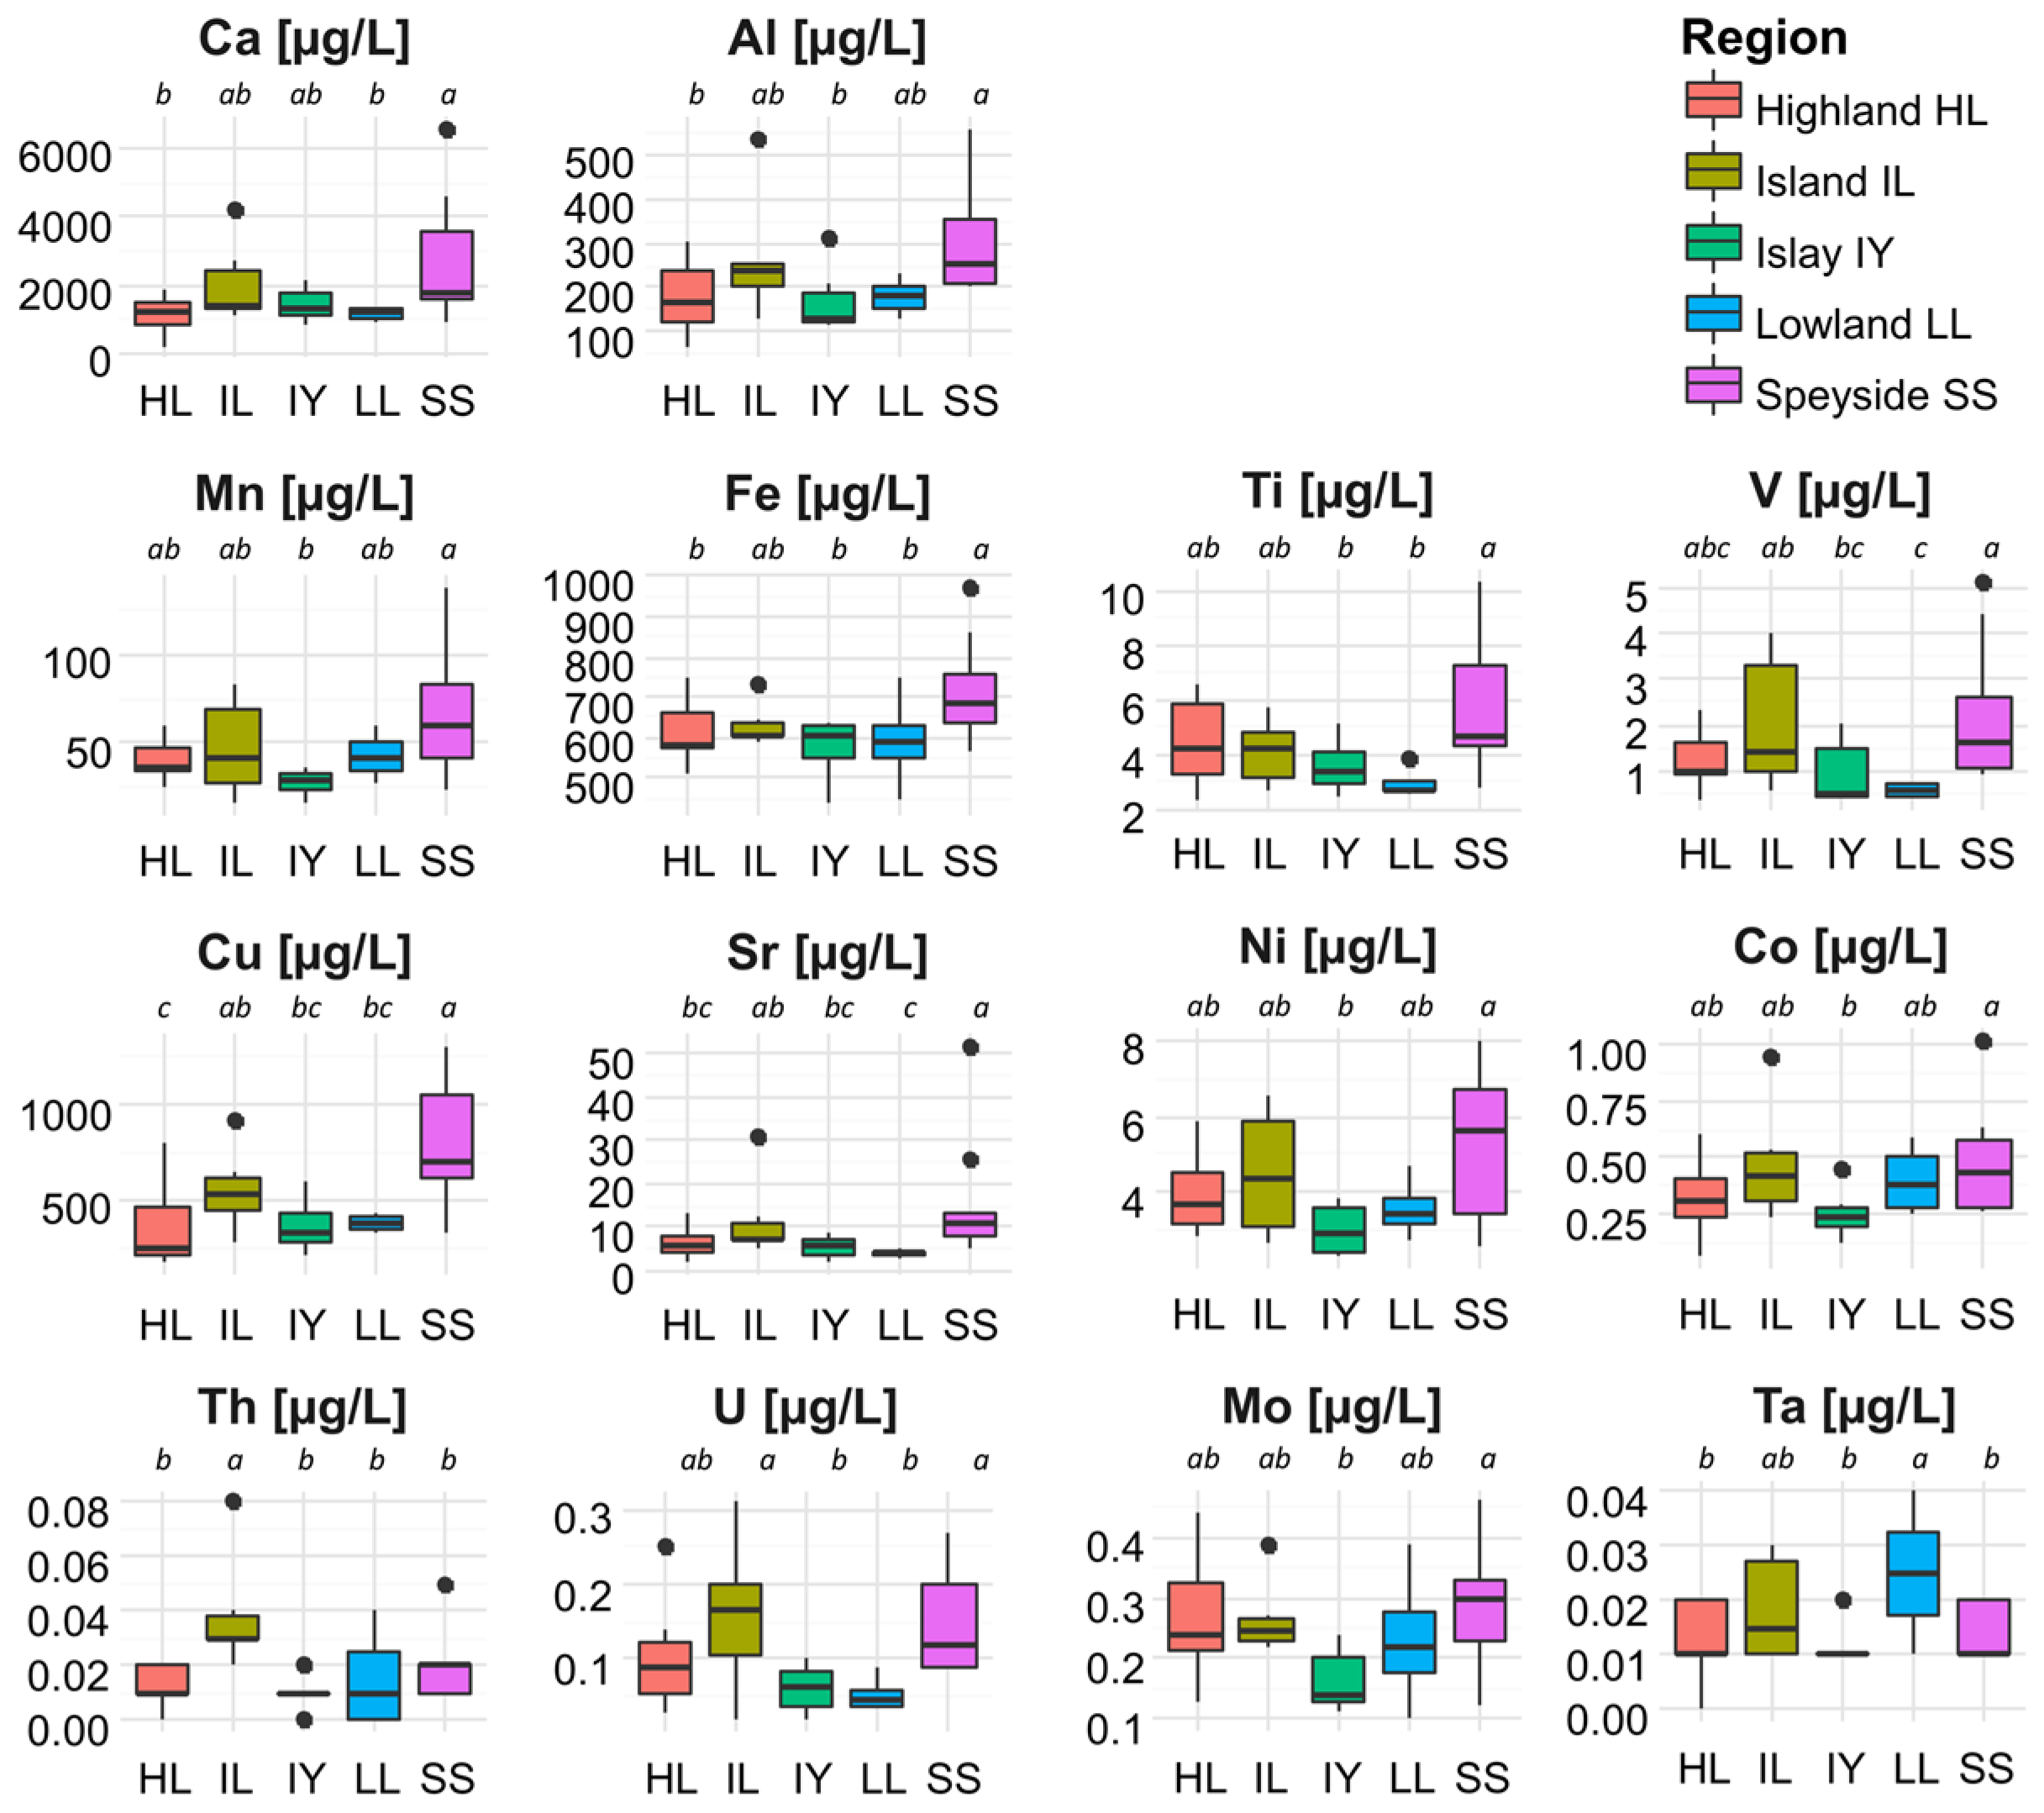
3.2. Single Malt Scotch Whiskies Differ in Their Elemental Composition across Production Areas

The subset of 33 single malt Scotch whiskies was used to investigate if elemental differences could be found on a smaller regional scale (i.e., production area). As only one sample from the region of Campbeltown was available, this production area was excluded from the analyses, thus, 32 single malt Scotch whiskies from five production areas were used in an ANOVA for production area. Sixteen of the 58 detected elements showed a significant production area effect (p < 0.05), and results are summarized in Figure 2 for the significantly differing elements Ca, Al, Mn, Fe, Ti, V, Cu, Sr, Ni, Co, Th, U, Mo and Ta.
Three elements, Cu, Sr, and V, showed large significant differences between the five production areas: Similar to Adam et al. [13], copper levels differed significantly among the five production areas, with highest Cu levels in samples from Speyside (n = 9; 5 distilleries) and Island (n = 6; 4 distilleries), and significantly lower levels in samples from Highland (n = 7; 5 distilleries). Intermediate levels of Copper were measured in samples from Islay (n = 6; 5 distilleries) and Lowland (n = 4; 2 distilleries).
Strontium levels were highest in Speyside samples, and were significantly higher than Sr levels in samples from Highland, Islay and Lowland (p < 0.05). Strontium, a member of the alkaline earth metals which include Mg, Ca and Ba, is a naturally occurring metal that is present in small amounts in air, soil, food, and drinking water [48]. The US Environmental Protection Agency (EPA) found detectable levels of Sr in 99% of all public water systems [49]. They published a regulatory determination for stable 88Sr in drinking water and calculated a non-cancer Health Reference Level (HRL) of 1,500 μg/L [50]. Based on information available from the British Geological Survey, Sr levels varied between 60 and 380,000 μg/L in stream sediments in Southern Scotland [51], thus, we assume that Sr would be equally variable in drinking water, used in the production process in the different production areas. It can be assumed that additional water treatment steps, such as an ion-exchange processes, which would remove Ca and Mg ions, would be equally effective at reducing Sr. This would account for the low Sr levels (Figure 2) in most whiskeys but requires further study.
Vanadium levels varied considerably between the different production areas, with highest levels in the samples from Speyside and lowest in Lowland whiskies. Samples from Highland showed large variability and were not significantly different from any of the other regions. In wine, Vanadium is believed to leach from metal containers [52], and might increase during storage [53]. A similar source for V found in the whisky samples seems therefore plausible.
All other 13 elements that differed significantly (p < 0.05) showed smaller differences among the five production areas. With the exception of Th and Ta, samples from Speyside showed the highest concentrations in all other elements, while samples from Islay showed significantly lower levels in all elements but Ca (p < 0.05). The presented data provides valuable insight into elemental differences due to production, as all whiskeys used in this study were well distributed across the five production areas. These differences appear to reflect differences among the production areas despite potential differences (and similarities) in raw materials and production, as each production area was represented by 4–9 different whiskeys that came from between two and five different distillers within each region.

4. Conclusions

Significant differences in the elemental composition of 58 elements allowed the discrimination of different whisk(e)y types, namely, Bourbon and Tennessee whiskey and Scotch, Irish and Japanese whiskies. Elements driving the separation of the types seem to relate mainly to production equipment and water used for adjusting alcoholic strength. In agreement with a previous study on single malt and blended Scotch whiskies, Cu showed high discrimination power, but additional alloy elements of Cu and Fe, such as Ni, Cd, Sn, and Mo also discriminated whisk(e)y types. The second origin of discriminating elements seems to come from the water used to adjust the alcoholic strength of the whisk(e)y, either after distillation or right before bottling. Despite commonly used water treatment processes, such as ion-exchange cartridges that reduce Ca, Mg, Fe, and Mn ion concentration, it seems that regional differences “survive” these treatment processes.
Besides the large scale differences between whisk(e)y types, the second analysis of elemental differences of 33 different single malt Scotch whiskies also provided several discriminating elements that allowed differentiation by production area within Scotland. Again, copper levels varied considerably and significantly across the five production areas, but V and Sr showed similar variability. The limited availability of geochemical data for Sr levels in Scottish stream sediments or groundwater only allow for a speculation that the source of Sr is again the water used in the whisky production, but data from the US show that Sr is present in 99% of all drinking water sources. The most likely source for vanadium is storage containers, as it was shown that V increased in wine samples during storage.
In contrast to other alcoholic beverages, such as wine, the impact of raw materials seems to be much lower, most likely due to the fact that the distillation process restricts the transfer of non-volatile elements from the wort into the distillate. However, all production steps past the distillation seem to impact the elemental composition of the final product, thus, an elemental analysis of the various steps during production would prove to be useful in establishing elemental criteria for whisk(e)y type and production area discrimination.

Supplementary Materials

Supplementary materials can be found at www.mdpi.com/2306-5710/3/1/8/s1.

Acknowledgments

This work was carried out in the Food Safety & Measurement Facility, which is supported through donations and loans by Agilent Technologies, Inc., Gerstel U.S., and Constellation Brands. We thank Thomas S. Collins for contributing samples. The comments by John Greenough are gratefully acknowledged. The full data set is available from the authors upon request.

Author Contributions

H.H., J.N. and S.E.E. conceived and designed the experiments; H.H., J.N. and G.G. performed the experiments and analyzed the data; all authors interpreted and prepared the paper.

Conflicts of Interest

The founding sponsors had no role in the design of the study; in the collection, analyses, or interpretation of data; in the writing of the manuscript, and in the decision to publish the results.

Abbreviations

The following abbreviations are used in this manuscript:
ANOVAAnalysis of Variance
CVACanonical Variate Analysis
ICP-MSInductively Coupled Plasma-Mass Spectrometry
ISInternal Standard
LSDFisher’s Least Significant Differences
MANOVAMultivariate Analysis of Variance
MP-AESMicrowave Plasma-Atomic Emission Spectroscopy
QCQuality Control

References

  1. Stewart, G.; Russell, I.; Anstruther, A. An Introduction to Whisk(e)y and the Development of Scotch Whisky, 2nd ed.; Elsevier Ltd.: Oxford, UK, 2014. [Google Scholar]
  2. Lyons, T.P. North American Whiskies: A Story of Evolution, Experience, and an Ongoing Entrepreneurial Spirit, 2nd ed.; Elsevier Ltd.: Oxford, UK, 2014. [Google Scholar]
  3. Quinn, D. Irish Whiskey: Technology, Production & Marketing, 2nd ed.; Elsevier Ltd.: Oxford, UK, 2014. [Google Scholar]
  4. Fukuyo, S.; Myojo, Y. Japanese Whisky, 2nd ed.; Elsevier Ltd.: Oxford, UK, 2014. [Google Scholar]
  5. Aylott, R.I.; Clyne, A.H.; Fox, A.P.; Walker, D.A. Analytical Strategies to Confirm Scotch Whisky Authenticity. Analyst 1994, 119, 1741–1746. [Google Scholar] [CrossRef]
  6. Collins, T.S.; Zweigenbaum, J.; Ebeler, S.E. Profiling of nonvolatiles in whiskeys using ultra high pressure liquid chromatography quadrupole time-of-flight mass spectrometry (UHPLC–QTOF MS). Food Chem. 2014, 163, 186–196. [Google Scholar] [CrossRef] [PubMed]
  7. Gonzalez-Arjona, D.; Gonzallez-Gallero, V.; Pablos, F.; Gustavo Gonzallez, A. Authentication and differentiation of Irish whiskeys by higher-alcohol congener analysis. Anal. Chim. Acta 1999, 381, 257–264. [Google Scholar] [CrossRef]
  8. Saxberg, B.E.H.; Duewer, D.L.; Booker, J.L.; Kowalski, B.R. Pattern recognition and blind assay techniques applied to forensic separation of whiskies. Anal. Chim. Acta 1978, 103, 201–212. [Google Scholar] [CrossRef]
  9. Lee, K.Y.M.; Paterson, A.; Piggott, J.R.; Richardson, G.D. Sensory discrimination of blended Scotch whiskies of different product categories. Food Qual. Prefer. 2001, 12, 109–117. [Google Scholar] [CrossRef]
  10. Jack, F.R.; Steele, G.M. Modelling the sensory characteristics of Scotch whisky using neural networks—A novel tool for generic protection. Food Qual. Prefer. 2002, 13, 163–172. [Google Scholar] [CrossRef]
  11. Aylott, R. Whisky Analysis, 2nd ed.; Elsevier Ltd.: Oxford, UK, 2014. [Google Scholar]
  12. Woods, G. Measurement of Trace Elements in Malt Spirit Beverages (Whisky) by 7500cx ICP-MS Agilent Application Note. Available online: https://www.agilent.com/cs/library/applications/5989-7214EN.pdf (accessed on 1 January 2015).
  13. Adam, T.; Duthie, E.; Feldmann, J.; Park, H. Investigations into the use of copper and other metals as indicators for the authenticity of Scotch whiskies. J. Inst. Brew. 2002, 108, 459–464. [Google Scholar] [CrossRef]
  14. Pryde, J.; Conner, J.; Jack, F.; Lancaster, M.; Meek, L.; Owen, C.; Paterson, R.; Steele, G.; Strang, F.; Woods, J. Sensory and Chemical Analysis of “Shackleton”s’ Mackinlay Scotch Whisky. J. Inst. Brew. 2011, 117, 156–165. [Google Scholar] [CrossRef]
  15. Distilled Spirits Council of the United States Scotch: Take the High Road. Available online: http://www.discus.org/assets/1/7/Scotch_2015.pdf (accessed on 1 July 2016).
  16. Distilled Spirits Council of the United States on America’s Whiskey Trail. Available online: http://www.discus.org/assets/1/7/Bourbon_and_Tennessee_Whiskey_2014.pdf (accessed on 1 July 2016).
  17. Heymann, H.; Robinson, A.L.; Buscema, F.; Stoumen, M.E.; King, E.S.; Hopfer, H.; Boulton, R.B.; Ebeler, S.E. Effect of Region on the Volatile Composition and Sensory Profiles of Malbec and Cabernet Sauvignon Wines. In Advances in Wine Research; Ebeler, S.E., Ed.; American Chemical Society: Washington, DC, USA, 2015; pp. 109–122. [Google Scholar]
  18. Nelson, J.; Hopfer, H.; Gilleland, G.; Cuthbertson, D.; Boulton, R.B.; Ebeler, S.E. Elemental Profiling of Malbec Wines under Controlled Conditions Using Microwave Plasma-Atomic Emission Spectroscopy. Am. J. Enol. Vitic. 2015, 66, 373–378. [Google Scholar] [CrossRef]
  19. Hopfer, H.; Nelson, J.; Collins, T.S.; Heymann, H.; Ebeler, S.E. The combined impact of vineyard origin and processing winery on the elemental profile of red wines. Food Chem. 2015, 172, 486–496. [Google Scholar] [CrossRef] [PubMed]
  20. Woods, G. Trace Elemental Analysis of Distilled Alcoholic Beverages Using the Agilent 7700x ICP-MS with Octopole Collision/Reaction Cell Agilent Application Note. Available online: https://www.agilent.com/cs/library/applications/5990-9971EN_AppNote_7700_Alcohol.pdf (accessed on 3 March 2015).
  21. Goossens, J.; Smaele, T.; Moens, L.; Dams, R. Accurate determination of lead in wines by inductively coupled plasma mass spectrometry. Fresenius J. Anal. Chem. 1993, 347, 119–125. [Google Scholar] [CrossRef]
  22. Boorn, A.W.; Browner, R.F. Effects of organic solvents in inductively coupled plasma atomic emission spectrometry. Anal. Chem. 1982, 54, 1402–1410. [Google Scholar] [CrossRef]
  23. Dams, R.F.J.; Goossens, J.; Moens, L. Spectral and non-spectral interferences in inductively coupled plasma mass-spectrometry. Mikrochim. Acta 1995, 119, 277–286. [Google Scholar] [CrossRef]
  24. Rossano, E.C.; Szilágyi, Z.; Malorni, A.; Pocsfalvi, G. Influence of winemaking practices on the concentration of rare earth elements in white wines studied by inductively coupled plasma mass spectrometry. J. Agric. Food Chem. 2007, 55, 311–317. [Google Scholar] [CrossRef] [PubMed]
  25. Drvodelic, N.; Cauduro, J. Determination of Metals in Wine Using the Agilent 4100 Microwave Plasma-Atomic Emission Spectrometer Agilent Application Note. Available online: https://www.agilent.com/cs/library/applications/5991-1586EN_AppNote_4100MP-AES_Food_wine.pdf (accessed on 2 July 2016).
  26. Thomsen, V.; Schatzlein, D.; Mercuro, D. Limits of Detection in Spectroscopy. Spectroscopy 2003, 18, 112–114. [Google Scholar]
  27. Hopfer, H.; Nelson, J.; Mitchell, A.E.; Heymann, H.; Ebeler, S.E. Profiling the trace metal composition of wine as a function of storage temperature and packaging type. J. Anal. At. Spectrom. 2013, 28, 1288–1291. [Google Scholar] [CrossRef]
  28. Croghan, C.W.; Egeghy, P.P. Methods of Dealing with Values below the Limit of Detection Using SAS; Southern SAS User Group: St. Petersburg, FL, USA, 2003. [Google Scholar]
  29. Chatfield, C.; Collins, A.J. Introduction to Multivariate Analysis; CRC Press: Boca Raton, FL, USA, 1980. [Google Scholar]
  30. R Core Team. R: A Language and Environment for Statistical Computing; R Core Team: Vienna, Austria, 2013. [Google Scholar]
  31. De Mendiburu, F. Agricolae: Statistical Procedures for Agricultural Research. Available online: http://cran.r-project.org/package=agricolae (accessed on 3 January 2014).
  32. Friendly, M.; Fox, J. Candisc: Generalized Canonical Discriminant Analysis. Available online: http://cran.r-project.org/package=candisc (accessed on 3 January 2014).
  33. Fox, J.; Weisberg, S. An {R} Companion to Applied Regression, 2nd ed.; Sage Publications: Thousand Oaks, CA, USA, 2011. [Google Scholar]
  34. Maechler, M.; Rousseeuw, P.; Struyf, A.; Hubert, M.; Hornik, K. Cluster: Cluster Analysis Basics and Extensions. Available online: http://cran.r-project.org/package=cluster (accessed on 3 January 2014).
  35. Wickham, H. Ggplot2: Elegant Graphics for Data Analysis; Springer: New York, NY, USA, 2009. [Google Scholar]
  36. Wickham, H. Reshaping Data with the reshape Package. J. Stat. Softw. 2007, 21, 1–20. [Google Scholar] [CrossRef]
  37. Lê, S.; Josse, J.; Husson, F.F. FactoMineR: An R Package for Multivariate Analysis. J. Stat. Softw. 2008, 25, 1–18. [Google Scholar] [CrossRef]
  38. Husson, F.; Josse, J.; Lê, S.; Mazet, J. FactoMineR: Multivariate Exploratory Data Analysis and Data Mining with R. Available online: http://cran.r-project.org/package=FactoMineR (accessed on 3 January 2016).
  39. Bartlett, M.S. Further aspects of the theory of multiple regression. Math. Proc. Camb. Philos. Soc. 1938, 34, 33–40. [Google Scholar] [CrossRef]
  40. State of Tennessee Public Chapter No. 341 House Bill 1084. Available online: http://www.tn.gov/sos/acts/108/pub/pc0341.pdf (accessed on 10 August 2016).
  41. International Molybdenum Association Metallurgy of Mo in Stainless Steel. Available online: http://www.imoa.info/molybdenum-uses/molybdenum-grade-stainless-steels/metallurgy-of-molybdenum-in-stainless-steel.php (accessed on 10 August 2016).
  42. International Stainless Steel Forum (ISSF) Commercial Food Equipment: The Ferritic Solution. Available online: http://www.outokumpu.com/sitecollectiondocuments/commercialfoodequipmenttheferriticsolution1.pdf (accessed on 10 August 2016).
  43. Harrison, B.; Fagnen, O.; Jack, F.; Brosnan, J. The Impact of Copper in Different Parts of Malt Whisky Pot Stills on New Make Spirit Composition and Aroma. J. Ind. Microbiol. Biotechnol. 2011, 117, 106–112. [Google Scholar] [CrossRef]
  44. Clayhammer Supply Copper Stills vs. Stainless Steel Stills. Available online: http://www.clawhammersupply.com/blogs/moonshine-still-blog/54804996-copper-stills-vs-stainless-steel-stills (accessed on 15 August 2016).
  45. Ibanez, J.G.; Carreon-Alvarez, A.; Barcena-Soto, M.; Casillas, N. Metals in alcoholic beverages: A review of sources, effects, concentrations, removal, speciation, and analysis. J. Food Compos. Anal. 2008, 21, 672–683. [Google Scholar] [CrossRef]
  46. Copper Development Association Inc. Copper Facts. Available online: https://www.copper.org/education/c-facts/ (accessed on 10 August 2016).
  47. Fermentation Waters. Available online: http://whiskyscience.blogspot.com/2014/04/fermentation-waters.html (accessed on 8 January 2016).
  48. American Water Works Association Strontium. Available online: http://www.drinktap.org/water-info/whats-in-my-water/strontium.aspx (accessed on 8 January 2016).
  49. Daguillard, R. EPA Makes Preliminary Determination to Regulate Strontium in Drinking Water. Available online: https://www.gpo.gov/fdsys/pkg/FR-2016-01-04/html/2015-32760.htm (accessed on 10 August 2016).
  50. US Environmental Protection Agency (EPA). 40 CRF Part 141. Announcement of Final Regulatory Determinations for Contaminants on the Third Drinking Water Contaminant Candidate List; US Environmental Protection Agency (EPA): Washington, DC, USA, 2016.
  51. British Geological Survey Strontium in Stream Sediment. Available online: http://www.largeimages.bgs.ac.uk/iip/mapsportal.html?id=1007723 (accessed on 12 August 2016).
  52. Volpe, M.G.; la Cara, F.; Volpe, F.; de Mattia, A.; Serino, V.; Petitto, F.; Zavalloni, C.; Limone, F.; Pellecchia, R.; de Prisco, P.P.; et al. Heavy metal uptake in the enological food chain. Food Chem. 2009, 117, 553–560. [Google Scholar] [CrossRef]
  53. Teissedre, P.L.; Krosniak, M.; Portet, K.; Gasc, F.; Waterhouse, A.L.; Serrano, J.J.; Cabanis, J.C.; Cros, G. Vanadium levels in French and Californian wines: Influence on vanadium dietary intake. Food Addit. Contam. 1998, 15, 585–591. [Google Scholar] [CrossRef] [PubMed]
  • 1While distilled grain spirits from Scotland and Ireland are spelled whisky and whiskies, respectively, whiskey and whiskeys are the forms used for New World products. Japanese products are spelled whisky, an indication of the strong influence of the Scottish process.
Figure 1. Canonical Variate Analysis (CVA) plots, showing the separation of different whiskies by their elemental composition: (a) CVA score plot showing the 95% confidence intervals for each of the five different types, together with the 68 whisk(e) samples, coded by their type (blue down-facing triangle … Tennessee; orange up-facing triangle … Irish; black circles … Bourbon; green squares … Scotch; violet diamond … Japanese); (b) Boxplot and total structure coefficients for the first canonical dimension (CV 1), showing the contribution of each element to the separation along CV 1; (c) Boxplot and total structure coefficients for the second canonical dimension (CV 2), showing the contribution of each element to the separation along CV 2.
Beverages 03 00008 g001
Figure 2. Boxplots of elements that differed significantly among five Scotch production areas. For each element, regions that share the same letter do not differ significantly from each other (p < 0.05).
Beverages 03 00008 g002
Table 1. List of 68 whisk(e)y samples, including code, age in years (if known), proof, and distillery.
Code 1Age 2Proof 3Distillery 4Code 1Age 2Proof 3Distillery 4
B17107D1S11086D17 (IL)
B2880D1S21092D18 (IY)
B3N.A.90D2S31280D19 (LL)
B4N.A.100D2S41886D19 (LL)
B51090D2S527116D19 (LL)
B6N.A.86.6D2S61292.6D20 (IY)
B7N.A.100D3S71286D21 (IY)
B81286D1S8N.A.88D22 (HL)
B9N.A.101D4S91080D23 (HL)
B10N.A.90D5S101080D23 (HL)
B119100D1S111280D24 (SS)
B12N.A.114D4S121592D24 (SS)
B13N.A.90.2D6S131280D25 (SS)
B14N.A.90.4D7S141080D26 (SS)
B151290D2S151592D26 (SS)
B16N.A.113D8S162186D26 (SS)
I1N.A.80D9S171280D27 (SS)
I2N.A.80D10S181580D27 (SS)
I3N.A.80D11S191286D28 (LL)
I4880D12S201286D29 (HL)
I5N.A.80D12S211080D30 (HL)
I612115D13S221280D31 (IL)
I71592D13S231886D31 (IL)
I81292D13S241080D32 (IL)
J11286D14S251680D32 (IL)
J21286D14S261686D33 (IY)
J3N.A.96D15S271080D34 (IY)
J4N.A.110D15S281586D34 (IY)
J51090D16S291280D35 (SS)
J61290D16S301280D36 (HL)
J7N.A.80D16S311680D37 (IL)
J81786D16S321592D38 (CA)
J91280D16S331086D30 (HL)
T1N.A.90D39
T2N.A.80D40
1 Whisk(e) types: Bourbon (B), Irish (I), Japanese (J), Scotch (S), Tennessee (T); 2 N.A. not available; 3 In the U.S. proof is twice the alcohol by volume; 4 Products from the same distillery are indicated. Scotch production areas are indicated in brackets after the distillery code: Island (IL), Islay (IY), Lowland (LL), Highland (HL), Speyside (SS), Campbeltown (CA).
Table 2. Measured elements with limits of detection (LOD), and observed concentration range.
ElementLOD (µg/L)Min-Max (µg/L)ElementLOD (µg/L)Min-Max (µg/L)
27 Al0.44247.2–1940140 Ce0.0006<LOD–0.708
47 Ti0.1461.88–12.9141 Pr0.00030.001–0.100
51 V0.0070.161–18.7146 Nd0.0013<LOD–0.393
52 Cr10.1175–1380147 Sm0.0005<LOD–0.094
55 Mn0.0191.05–233153 Eu0.00030.0003–0.056
56 Fe7.01393–1100157 Gd0.0006<LOD–0.178
58 Ni0.0271.52–37.5163 Dy0.0004<LOD–0.142
59 Co0.0020.024–3.13165 Ho0.00010.0001–0.029
63 Cu0.0224.99–2380166 Er0.00020.0009–0.136
66 Zn0.1250.013–586169 Tm0.00020.0003–0.014
71 Ga0.0020.034–0.490172 Yb0.0004<LOD–0.085
75 As0.0020.098–22.4175 Lu0.024<LOD–1.32
82 Se0.016<LOD–0.720178 Hf0.0080.048–0.558
85 Rb0.0133.35–56.0181 Ta0.0020.005–0.042
88 Sr0.0091.29–52.2182 W0.0060.090–0.832
90 Zr0.010<LOD–1.55185 Re0.0004<LOD–0.012
93 Nb0.0020.020–0.159193 Ir0.014<LOD–0.084
97 Mo0.007<LOD–3.72195 Pt0.007<LOD–0.298
101 Ru0.001<LOD–0.014197 Au0.015<LOD–0.105
103 Rh0.0020.056–0.131205 Tl0.001<LOD–0.467
105 Pd0.0412.04–5.05208 Pb0.004<LOD–9.68
107 Ag0.004<LOD–1.15232 Th0.001<LOD–0.092
114 Cd0.003<LOD–9.82238 U0.001<LOD–0.754
118 Sn0.0060.411–337Ca 12.79214–8560
123 Sb0.0040.04–2.01K 19.743210–55400
125 Te0.002<LOD–0.018Mg 17.6614.4–4780
133 Cs0.0020.039-02–2.76Na 18.87434–26800
137 Ba0.0160.174–31.3Si 149.6259–21600
139 La0.0005<LOD–0.355
1 These elements were measured with MP-AES.
Table 3. Means of 23 elements in μg/L that differed between whiskey types. Same letter in rows did not differ significantly in the pairwise comparison (Fisher’s LSD, p < 0.05).
BourbonIrishJapaneseScotchTennessee
Si1005 b852 b6803 a1424 b1206 b
Ca1182 b981 b1042 b2003 a921 b
Mg517 a2578 b861 a1088 a137 c
Na6238 b9370 a13368 a9685 a9251 ab
K18787 a8290 b21556 a20508 a16164 ab
Fe554 b545 b688 a647 a531 b
Cu203 b49.9 c749 a584 a15.2 c
Zn151 b41.56 b107 a19.9 b178 ab
Al151 b117 b175 ab285 a117 ab
Mn49.7 a20.7 b42.2 a52.6 a5.82 c
Ni5.18 b2.50 c14.7 a4.44 b3.03 bc
Rb21.4 a9.67 b22.7 a23.6 a17.0 ab
Sr8.23 a3.24 b5.71 ab10.8 a2.23 b
Sn6.88 b60.2 b76.5 a11.0 b12.5 b
Ba7.59 a5.12 bc1.02 c3.69 b2.57 bc
Co0.213 b0.233 ab0.412 ab0.473 a0.090 b
Mo0.526 b0.156 c0.326 bc0.264 bc1.98 a
Cd0.152 c1.71 b2.189 a0.286 bc0.355 bc
Er0.046 a0.008 b0.008 b0.015 b0.005 b
Hf0.104 c0.091 c0.180 ab0.162 b0.300 a
Irn.d. 1 bn.d. 1 bn.d. 1 bn.d. 1 b0.040 a
Au0.018 b0.016 b0.026 ab0.036 a0.025 ab
U0.064 b0.054 b0.038 b0.132 a0.125 ab
1 n.d., not detected.

