Article

Detection of Intra-Varietal Diversity Based on Differences in the Accumulation of Secondary Metabolites for Winemaking Management of High-Quality Red Wines

1
Council for Agricultural Research and Economics-Research Centre for Cereal and Industrial Crops, Foggia 71121, Italy
2
Council for Agricultural Research and Economics-Research Centre for Viticulture and Enology, Turi (BA) 70010, Italy
3
Sugarloaf Crush Winery, Santa Rosa, CA 95409, United States
4
Botromagno Winery, Bari 70024, Italy
*
Authors to whom correspondence should be addressed.
Beverages 2017, 3(3), 45; https://doi.org/10.3390/beverages3030045
Submission received: 14 July 2017 / Revised: 29 August 2017 / Accepted: 29 August 2017 / Published: 11 September 2017
(This article belongs to the Special Issue Wine Metabolomics and Proteomics)

Abstract

:
The goal of biodiversity preservation is the conservation and enhancement of diversity, which is often stored in different clones of the same grape variety. Fourteen different autochthonous accessions of Aglianico grown in the same area (Vulture, Italy) have been investigated to evaluate the possible significant differences in terms of secondary metabolites belonging to the polyphenolic class, compounds which show a number of beneficial health related properties. During winemaking, grape polyphenols are extracted into wine, therefore the knowledge of the polyphenolic composition of grape is important for the appropriate design of the winemaking process, especially in winemaking management of high-quality red wines. The results of this study are useful tools for the individuation of the most promising candidates in the perspective of Aglianico del Vulture clonal selections from a winemaking point of view.

Graphical Abstract

1. Introduction

Aglianico n. is an important autochthonous red wine grape variety grown in Southern Italy, which shows a great intra-varietal diversity and produces robust and deeply coloured red wines [1]. Aglianico del Vulture DOC wine is produced by single-variety winemaking in Basilicata region, centring around the area of the extinct volcano Monte Vulture. Especially in the nineties, the use of clonal propagation material derived from the selections of Campania biotypes has led to a significant reduction of genetic diversity of this variety. Conversely, Aglianico del Vulture autochthonous vines planted in vineyards within the Vulture area still preserve an interesting intra-varietal biodiversity. Vegetative propagation is commonly used for grapevine (Vitis vinifera L.) and this asexual propagation method ensures that the plants are genetically identical copies. Anyway, during this process, spontaneous somatic mutations could create new allelic variants in plants, which could yield to phenotypes different in some traits with respect to the original mother plant [2]. Ampelography and secondary metabolites profiles have proven to be the best tools for the characterisation of the intra-varietal variability of grapevine germplasm [3].
The term polyphenols comprises of several classes of chemicals that are found in plants which show a number of beneficial properties for the plant itself and, moreover, for human consumption. Colour, sensory attributes, and aging ability of red wine are related to its polyphenolic composition which, in turn, is affected by a number of factors including the genome expression of grapevines in the growing area (influenced by natural factors such as pedoclimatic conditions) together with viticultural and oenological techniques, which explains the diversity of the wines that can be obtained from a grape cultivar in a small production area [4]. Indeed, the phenolic composition of grape is very important for the appropriate design of the winemaking process especially in winemaking management of high-quality red wines [5,6].
In order to evaluate the intra-varietal diversity in Aglianico n. wine grapes, fourteen accessions of Aglianico del Vulture were analysed. Phenolic compounds in grape berries are mainly present in skins and seeds, with anthocyanins and flavonols as the most abundant phenolic compounds in skins, whereas flavan-3-ols, namely catechins and proanthocyanidins, both in skins and seeds [7]. Since seeds are able to influence wine composition [8], therefore, it is useful to investigate phenolic components of skin and seeds separately.

2. Materials and Methods

2.1. Experimental Design and Grape Characteristics

The fourteen autochthonous accessions of Aglianico del Vulture analysed are grown in an experimental vineyard of ALSIA (Agenzia Lucana di Sviluppo e di Innovazione in Agricoltura) located in Melfi (Basilicata region, South-Italy) since 1996. This experimental vineyard collection has been already investigated for the agronomical assessment and detected for viral infections [9]. Vines are trained in the espalier system with unilateral Guyot pruning system. The experimental vineyard is located at 600 m a.s.l., as characterized by the medium grain size of the soil, homogeneous under a geo-pedological point of view and kept naturally grassed over (cover crops). The vines were grafted onto 1103 Paulsen rootstock, with distances of 2.5 m between rows and 0.8–1.2 m between vines. At harvest (second half-end of October), 300 berries with intact pedicels were collected from selected vines for each of the fourteen accessions. Total acidity, reducing sugar, and pH, were determined on grape juice according to the EEC 2676 standard procedure [10].

2.2. Chemicals and Reference Compounds

Tartaric acid, malic acid, lactic acid, and shikimic acid were all purchased from Sigma-Aldrich, Inc. (St. Louis, MO, USA). All chemicals, including malvidin-3-O-glucoside chloride, (+)-catechin and quercetin-3-O-glucoside standards were purchased from Extrasyntehses (Genay, France) and used as HPLC reference standards. All of the solvents, purchased by Carlo Erba (Milan, Italy) were analytical or HPLC grade.

2.3. Organic Acids Analysis in Berry Juice

From the 300 berries picked for each accession, 20 were randomly chosen and the juice was extracted after seed removal. The berry juice was diluted 10 times with distilled water before analysis. Detection and quantification of organic acids were carried out by HPLC using an HP 1100 apparatus (Agilent, Palo Alto, CA, USA) with a diode array detector (DAD) set at 210 nm. The stationary phase was a Synergi Hydro-RP 80A column, 250 × 4.6 mm, 4 µm (Phenomenex Inc., Torrance, CA, USA). The flow rate was 0.7 mL/min and the solvent used for the isocratic elution at 25 °C was H3PO4 10−3 M, according to the method proposed by Cane [11]. The response factors obtained by injecting four solutions of the different acids with different concentration were employed for quantification.

2.4. Total Anthocyanins and Total Flavonoids

The skins of 20 randomly selected berries were manually removed, dried with paper, and macerated for 24 h (in the dark, at room temperature) in 25 mL of hydrochloric ethanol (HCl/water/ethanol, 1/30/70, v/v). Subsequently, other 25 mL of the hydrochloric ethanol solution have been used to rinse the skins. The two extracts have been collected and it was added enough hydrochloric ethanol to bring the volume up to 50 mL. Analyses have been performed in triplicate. A double beam UV-visible Spectrophotometer Hitachi U-2000 was employed. The skin extracts were diluted 25 times with hydrochloric ethanol and the absorption spectrum between 230–700 nm was registered. An absorbance at 540 nm was used to calculate the total anthocyanins content expressed as malvidin-3-O-glucoside [12]. The absorbance at 280 nm was used to calculate the total flavonoids and flavonoids other than anthocyanins with a graphical correction method, as previously described [12], which allowed for the estimation of these compounds expressed as (+)-catechin.
Seeds have been manually removed from berries, dried on paper, and macerated in 25 mL of hydrochloric ethanol for 48 h in the dark at room temperature. The seeds extracts were diluted 25 times with water and used to record an absorption spectrum in the UV. The absorbance at 280 nm was used to calculate the flavonoids as previously described [12].

2.5. Anthocyanins Profile

The skin extracts already used for the previous analyses were diluted 5 times with H3PO4 10−3 M, filtered (0.45 µm) and analyzed with the same HPLC apparatus used for the organic acids, equipped with a DAD detector set at 520 nm. The column used was a Hypersil ODS-RP 100 × 2.1 mm, 5 µm particle size (Phenomenex Inc., Torrance, CA, USA) with a pre-column, using a 0.35 mL/min flow rate. The chromatographic separation was carried out by gradient elution with two different eluents: formic acid 10% (A) and formic acid/methanol/water (10:50:40); (B) as previously described [13]. Individual anthocyanins were tentatively identified according to the HPLC retention time and elution order, or specifically identified by comparison with authentic standards when available. The order of anthocyanin elution was: delphinidin, cyanidin, petunidin, peonidin and malvidin, for both the monoglucosylated forms (-3-O-glucosides), which were eluted first, and the coumaroylated forms (-3-O-(6-p-coumaroyl)glucosides) eluted at the end of the chromatogram [14].

2.6. Resveratrol and Flavonols

The samples were prepared adding 1 mL of H3PO4 1 M to 9 mL of the hydrochloric ethanol skin extract, and then filtered (0.45 µm) and analysed with the same HPLC equipment reported above. The column used was a Hypersil ODS-RP, 2.1 × 200 mm, 5 µm particle size (Agilent Technologies, CA, USA), 0.25 mL/min flow rate. Two eluents were employed: H3PO4 10−3 M (eluent A) and methanol (eluent B). The gradient program of elution was: 0–5 min 85% A; 5–20 min from 85 to 45% A; 20–30 min from 45 to 10% A; 30–35 min from 10 to 0% A; for 5 min 0% A; 40–45 min 85% A. The detection was set at 320 nm for resveratrol and at 360 nm for flavonols. A standard of t-resveratrol was employed for its identification. Individual flavonols were tentatively identified according to the HPLC elution order and UV-vis spectra or specifically identified by comparison with authentic standards when available. Three main flavonols have been identified with the following elution order: myricetin glucuronide and glucoside, quercetin glucuronide and glucoside and kaempferol glucuronide and glucoside.

2.7. Flavanols and Oligomeric Proanthocyanidin in Grape Skins and Seeds

For both the skins and seeds hydrochloric ethanol extracts the following procedure was followed. One millilitre of the hydrochloric ethanol extract was added with 4 mL of distilled H2O. Prior to the HPLC analysis, both of the extracts were filtered (0.45 µm). The stationary phase used was a Kinetex PFP 75 × 4.6 mm, 2.6 µm particle size (Phenomenex Inc., Torrance, CA, USA) with a 1.5 mL/min flow rate. The eluents used were H3PO4 10−3 M (eluent A) and acetonitrile (eluent B), with an elution program of 7 min: 0–1.4 min 91% A; 1.4–2.8 min from 91 to 82% A; 2.8–4.3 min from 82 to 60% A; 4.3–5.7 min from 60 to 40% A; 5.7–7.0 min from 40 to 91% A. Individual compounds were tentatively identified according to the HPLC retention time, and elution order as from published data [15] or specifically identified by comparison with authentic standards when available.

2.8. Statistical Analysis

Multivariate statistical analysis was performed using R Statistical Software (R Core Team (2013), R Foundation for Statistical Computing, Vienna, Austria). One way analysis of variance (ANOVA) and Tukey’s multiple comparison test at a probability level of p < 0.05 were performed. Moreover, a principal component analysis (PCA) was carried out on the 14 grape accessions: the variables were total skin anthocyanins, skin flavonoids other than anthocyanins, skin flavonols, skin resveratrol, and seeds total flavonoids (mainly tannins in grape seeds).

3. Results

The degree of ripeness of the grapes was around 13° of potential alcohol, as usually found in Aglianico del Vulture grape, anyway, four accessions showed an even higher value (M6, M2, M8 and M9) while in other four accessions the sugar accumulation was lower than the average (M1, M5, M10 and M13) (Table 1).
Table 1 also shows the organic acids composition of berry juice. Shikimic acid (3,4,5-trihydroxy-1-cyclohexene-1-carboxylic acid) is an important biochemical intermediate in plants since it is involved in the biosynthesis of a number of compounds comprising of aromatic amino acids, lignin, and most alkaloids. It is also employed as a starting material for the industrial synthesis of drugs and its derivatives are used as herbicides and antibacterial agents in agriculture [16]. Shikimic acid is investigated for its beneficial effects and, moreover, it is considered a varietal marker that is usually employed for authenticity and traceability of wines [17,18]. Red wines have a higher content of shikimic acid than white ones [19] and, among red grapes, Aglianico berries have a higher concentration of shikimic acid in comparison to other varieties [20]. The M1, M6, M10, M11, M13, and M14 accessions showed the highest shikimic acid values, ranging from 30.6 to 35.6 mg/L.
In Table 2, it is reported the total content of various bioactive compounds found in the samples. This table shows that anthocyanins were the main contributors to the total flavonoids only for half of the samples, namely: M1, M6, M8, M9, M12, M16, and M17. The M6 and M16 accessions, characterized by the smallest berries, showed the highest content of both total flavonoids in the skin and total anthocyanins. Total flavonoids in the skin are always higher than those in seeds, with the only exception of M2 showing comparable amounts between skins and seeds. Anyway, anthocyanins are absent in seeds; therefore, it is better to compare other flavonoids in the skins and the total flavonoids in the seeds. This comparison shows that in M10, M11, M13, and M17 samples, the seed flavonoids content is lower. The maximum content of polyphenolic compounds in seeds was found in M1 followed by M2 while the poorest accession was M11.
The anthocyanin profile is quite specific for the same variety. Indeed, the HPLC analysis showed how the anthocyanin profile of all the fourteen accessions was in accordance with the varietal profile of Aglianico del Vulture grape (Table 3) [21]. Malvidin-3-O-glucoside is the main anthocyanin (as in most red grapes), and is present in quantity above the 50% of all the other anthocyanins. While delphinidin-3-O-glucoside and petunidin-3-O-glucoside have been detected in moderate amounts, cyanidin-3-O-glucoside (the most oxidable one) is present only in traces. Concerning acylated anthocyanins, the sum of p-coumaroylated ones is higher than the acetylated ones.
There is a significant difference between the anthocyanin profile of grape and the actual composition of wine. Indeed, anthocyanins can be implicated in chemical reactions (oxidation or covalent linking with other compounds) might form intermolecular bonds (hydrogen bonds and hydrophobic interactions) with other colourless molecules resulting in copigmentation complexes or can polymerize with wine aging [22].
Both grape seeds and skins are good sources of polyphenolic compounds with antioxidant, anti-inflammatory, cardiovascular, and cancer protective effects [23,24]. Phenolic compounds in grape seeds are flavan-3-ols, mainly tannins [25], therefore the total flavonoids of seeds can be regarded as the tannins content. Tannins increase the colour and shelf life of wines since they are able to link with anthocyanins creating stable coloured polymeric pigments [26]. Tannins are important for chromatic (preserving wine colour) and sensory (astringency, mouth feel) characteristic of wine, anyway seed tannins are slightly different from skin ones (more esterification with gallic acid, lower degree of polymerization, different percentage of B-ring hydroxylation). In order to produce wines with a low bitterness and astringency, it is preferred a higher presence of skin proanthocyanidins over an excess of seed tannins in wines [27].
The flavanols and proanthocyanidins analyses were carried out on both berries skins (Table 4) and seeds (Table 5). The content of monomeric flavanols and tannins found in seeds was generally greater than in the berry skins, indeed the values detected were up to 30 times higher in seeds. Gallic acid content was higher in seeds, probably due to the hydrolysis phenomena. The procyanidins were the predominant flavanols in both skins and seeds. The M1 accession was the richest in monomeric flavanols in skins, whereas M1 and M2 were the richest in seeds flavanols, and M11 was the accession with the lowest amount of seeds tannins.
Resveratrol is a phytoalexin since it is synthesised as a response to stress, injury, infection, or UV-light in the plants [28]. In vitro and animal experiments have shown that it possesses many health benefits mainly concerning cardiovascular disease prevention [29] and some authors attributed health benefits of red wine consumption mainly to resveratrol [30]. As shown in Table 6, M1 and M14 showed the highest amounts of resveratrol. In general, the values found in the accessions analyzed were higher than values found in previous works [17], with the only exception of M2 and M10. Although, the resveratrol content depends on both biotic (variety) and abiotic (climatic conditions, agronomic practices, harvest time, etc.) factors, the differences found can be addressed to genetic factors since the plants were grown in the same vineyard, following the same irrigation and frost protection methods, vine training system, as well as fertilization and pest control management.
The flavonols analysis showed a high quantity of glycosylated (3-O-glucuronide and 3-O-glucosyde) myricetin, quercetin, and kaempferol in grape skins (Table 6), with quercetin derivatives being the most representative in all the accessions. The grapes with highest flavonols content were the M1, M6, M8, and M16.
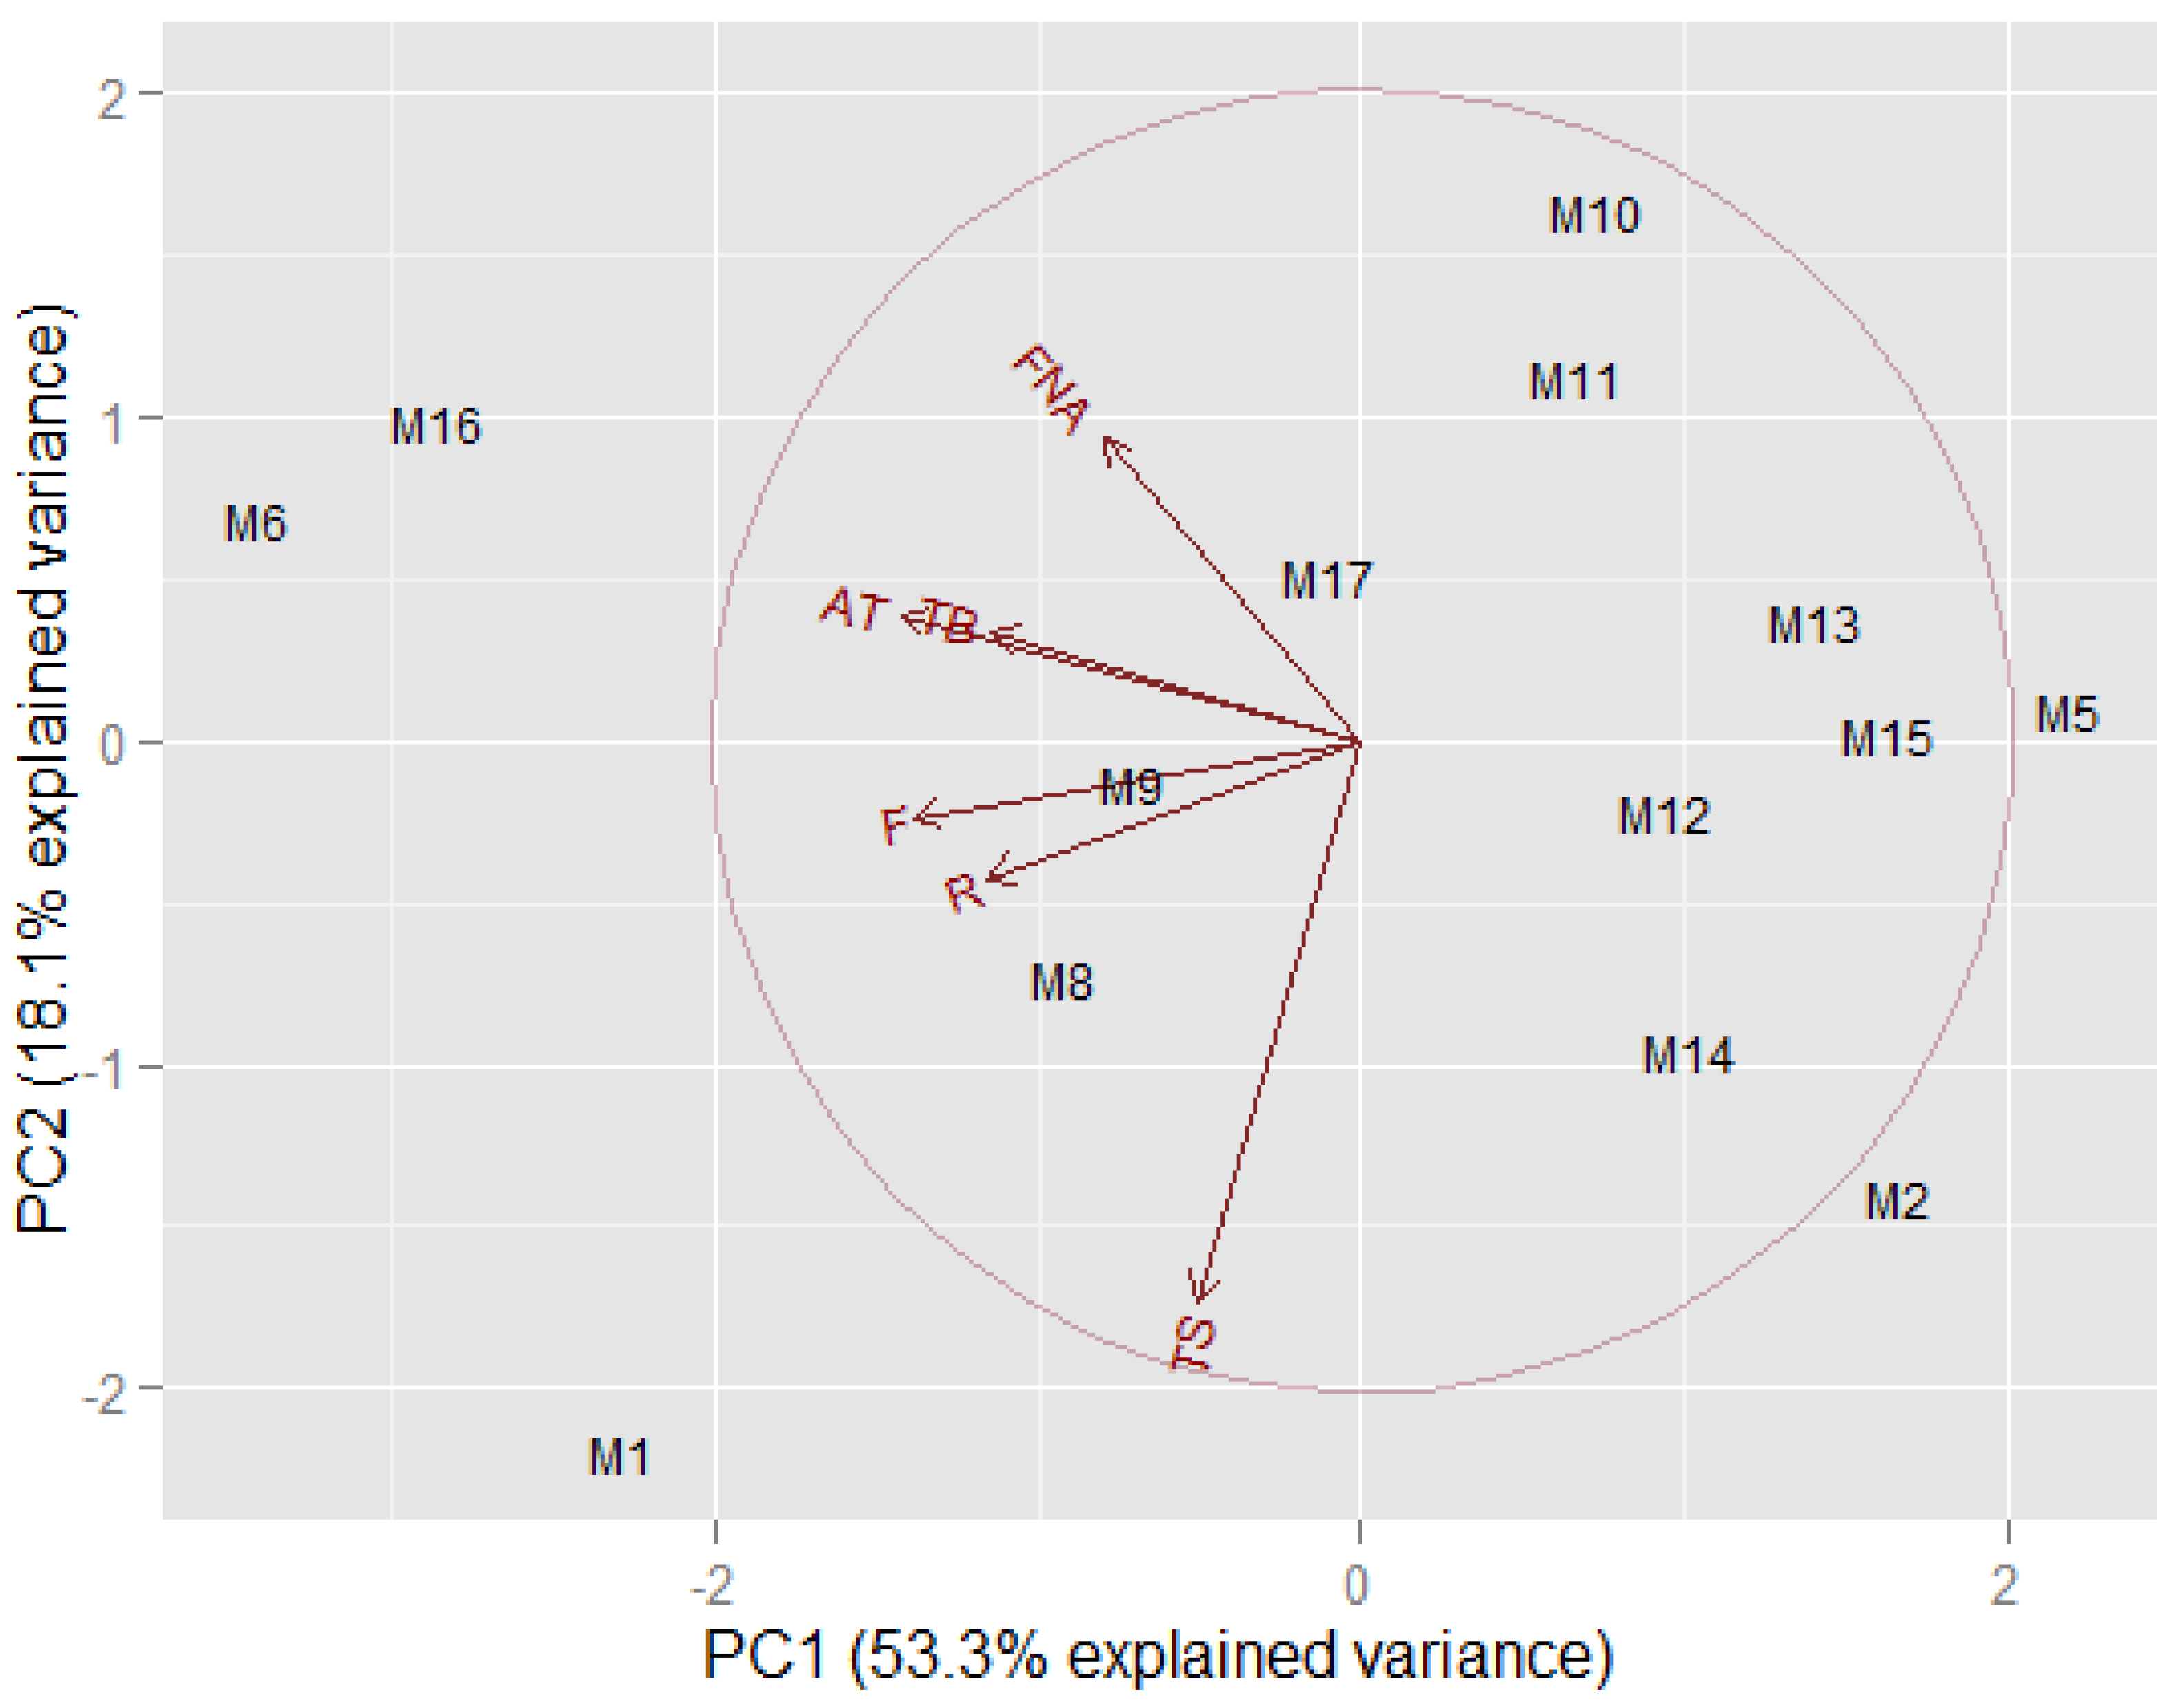
A PCA was carried out on all of the grape accessions, the variables were skin total anthocyanins, total flavonoids, flavonoids other than anthocyanins, flavonols, resveratrol, and seeds flavonoids (mainly tannins). PCA is a useful tool for reducing and interpreting large multivariate data sets and for discovering previously undetectable relationships. This dimensionality-reduction technique transforms the data of a high-dimensional data set into a new, lower-dimensional subspace (i.e., a new coordinate system). To determine the appropriate number of principal components (PCs) to be retained, we employed the scree plot and the Kaiser’s criterion. The number of PC retained was two, indeed PC1 and PC2 together were able to explain a large part of the variance in the original dataset. In the new coordinate system, the X-axis corresponds to the first principal component (PC1), which is the component that explains the greatest highest amount of the variance in the data (53.3%) while the orthogonal Y-axis is the second principal component (PC2), which explains the 18.1% of the variance of the dataset, for a total of 71.4%. The PCA biplot (Figure 1) shows both the loadings of each variable (the relationship between the original variables and the subspace dimension) and the score points/the component score of each observation (a projection of data onto the subspace for the two selected PCs). The relationship between the original variables and the subspace dimension can be seen from the different loadings of the variables on PC1 and PC2. Indeed, in the PCA biplot we can see that skin anthocyanins, flavonoids, resveratrol, and flavonols vectors are close to the negative X-axis, which means that these variables have heavy loadings for PC1, even if they are negatively correlated with it (negative correlation coefficients). The variables with the heaviest loading for PC2, i.e., the main original variables which mainly contributes to the negative Y-axis, is total flavonoids in seeds (negative correlation coefficient −0.50) and flavonoids other than anthocyanins (positive correlation coefficient +0.66). The position of the samples in the PCA biplot was used to interpret relationships between observations. The accessions richest in skin antioxidants (negative PC1 values) are M1, M6, and M16. Among these accessions, M1 also has the highest amount of seed polyphenols (negative PC2 value).

4. Discussion

Among the factors that able to influence the final composition of wine (i.e., pedoclimatic conditions, viticultural, and winemaking practices) the grape composition is of paramount importance. Indeed, the evaluation of the polyphenolic content of red grapes is of fundamental importance for the production of red wines of quality, since they determine the colour, contribute to the taste/structure and improve the wine resistance against oxidation.
In this article fourteen Aglianico accessions were analysed at harvest in terms of both qualitative and quantitative characterization of berry skins and seeds as to assess the secondary metabolites production capacity of each plant in terms of the content of compounds that are able to affect peculiar characteristics of the wine. The Aglianico del Vulture DOC wine is obtained by single-variety winemaking of Aglianico grapes. This red wine cannot be marketed before one year from harvest and is ideally suited for aging (3–5 years). The grape composition is important to assess the winemaking procedure to perform and the final product to obtain: e.g., accession with high seeds tannin content might produce highly astringent wines, which are not appreciated by consumers. Therefore, during red winemaking, grape seeds could be partially or totally removed during fermentation, or the time of contact between must and solid parts of grape must be carefully controlled, in order to extract enough anthocyanins but to avoid the release of an excessive amount of compounds present in seeds into the wine.
Among the accessions richest in skin antioxidants M6 and M16, look like the most interesting ones since they are characterized by the richness of skin antioxidants and are poor of seed tannins which means that could be used in a conventional red winemaking to obtain intense red wines (high level of skin anthocyanins), rich in antioxidants (flavonoids), and not very astringent (seed tannins are low). Between the two accessions, M16 showed lower amounts of seeds tannins, therefore, looks more suitable for the production of less astringent red wines. It is known that tannins increase the colour and shelf life of wines since they are able to link with anthocyanins, creating stable coloured polymeric pigments. Anyway, there is an important difference between grape seed and skins flavanols: seed tannins can increase not appreciated features of wines such as astringency and bitterness [26]. M1 is another accession rich in antioxidants and pigments, moreover with the highest t-resveratrol content, anyway is the richest in seed tannin, therefore during winemaking precaution will be taken in order not to produce a very tannic and coarse wine.
Concerning the other samples, they do not look as promising candidates for high-quality red wines. Anyway, with Aglianico grape, it is also possible to produce rosé and sparkling wines. Therefore, for accessions poor of skin antioxidants and pigments, with more or fewer seed tannins, a rosé or a sparkling version of this wine could be produced. Indeed, even a high content of tannins would not be an issue since the winemaking for both rosé and sparkling wines is performed without maceration with solid parts of grape. In the PCA biplot, it is possible to individuate smaller groups such as: M9 and M8 accessions with a low content of skin antioxidants and coloured compounds and seed tannins not in a very large amount; M2 and M14 rich in seed tannins and low in skin antioxidants and pigments; M10, M11, and M17 poor of skin antioxidants (with the exception of flavonoids other than anthocyanins) and negatively correlated with seeds tannins; finally M5, M12, M13, and M15 which are negatively correlated with antioxidants compounds present in grape skin, and show a poor content of seed tannins. Even if these accessions do not look like optimal candidates for a long aging red wine, alternative winemaking might be performed to produce rosé or sparkling wines, planning an early grape harvest in order to have lower sugar content and a higher fixed acidity.
These results are of significant interest since providing useful information for winemakers, indeed, knowing both the skin and seed content of grape berries, it is possible to choose the best winemaking technique (maceration time, partial seed removal, délestage, racking, etc.) in order to produce a wine with improved features such as antioxidant content, sensory characteristics, and colour stabilization over time. The present work could represent a good basis for future programs of clonal selection for the improvement of Aglianico del Vulture red wine production.

Author Contributions

Michele Savino and Pasquale Tamborra conceived and designed the experiments; Dina Bolettieri and Fiorella Paradiso performed the experiments; Teodora Basile and Luigi Tarricone analyzed and interpreted the data; Teodora Basile and Vittorio Alba wrote the paper; Serafino Suriano and Michele Savino reviewed the article.

Conflicts of Interest

The authors declare no conflicts of interest.

References

  1. Nuzzo, V.; D’Onofrio, C.; Dell’Aglio, M.; Rotundo, A. Aglianico. Italian Vitis Database. Available online: www.vitisdb.it (accessed on 5 September 2017).
  2. Alba, V.; Anaclerio, A.; Gasparro, M.; Caputo, A.R.; Montemurro, C.; Blanco, A.; Antonacci, D. Ampelographic and Molecular Characterisation of Aglianico Accessions (Vitis vinifera L.) Collected in Southern Italy. S. Afr. J. Enol. Vitic. 2011, 32, 164–173. [Google Scholar] [CrossRef]
  3. De Lorenzis, G.; Squadrito, M.; Rossoni, M.; Di Lorenzo, G.S.; Brancadoro, L.; Scienza, A. Study of intra-varietal diversity in biotypes of Aglianico and Muscat of Alexandria (Vitis. vinifera L.) cultivars. Aust. J. Grape Wine Res. 2017, 23, 132–142. [Google Scholar] [CrossRef]
  4. Revilla, E.; Losada, M.M.; Gutiérrez, E. Phenolic Composition and Color of Single Cultivar Young Red Wines Made with Mencia and Alicante-Bouschet Grapes in AOC Valdeorras (Galicia, NW Spain). Beverages 2016, 2, 18. [Google Scholar] [CrossRef]
  5. Mattivi, F.; Prast, A.; Nicolini, G.; Valenti, L. Validation of a new method for the measure of the polyphenolic potential of red grape and discussion of its use in oenology. Riv. Vitic. Enol. 2002, 55, 55–74. [Google Scholar]
  6. De Pascali, S.A.; Coletta, A.; Del Coco, L.; Basile, T.; Gambacorta, G.; Fanizzi, F.P. Viticultural practice and winemaking effects on metabolic profile of Negroamaro. Food Chem. 2014, 161, 112–119. [Google Scholar] [CrossRef] [PubMed]
  7. Cheynier, V.; Rigaud, J. HPLC separation and characterization of flavonols in the skins of Vitis vinifera var. Cinsault. Am. J. Enol. Vitic. 1986, 37, 248–252. [Google Scholar]
  8. Pascual, O.; González-Royo, E.; Gil, M.; Gómez-Alonso, S.; García-Romero, E.; Canals, J.M.; Hermosín-Gutíerrez, I.; Zamora, F. Influence of Grape Seeds and Stems on Wine Composition and Astringency. J. Agric. Food Chem. 2016, 64, 6555–6566. [Google Scholar] [CrossRef] [PubMed]
  9. Nuzzo, V.; Nolè, M. Tradizione ed innovazione nei sistemi viticoli dell’Aglianico del Vulture. In Aglianico. del Vulture: Storie. di Vite., Ambiente., Viticoltura., Enologia., Storia. e Società.; Grafica Zaccara di Lagonegro: Rionero in Vulture (PZ), Italy, 2004; pp. 23–28. [Google Scholar]
  10. EC (European Commission). Commission Regulation No 2676/90 of 03/10/1990 on “Community Analysis Methods to Use in Wine Sector”. Off. J. Europ. Union 1990, L 272, 0001–0192. [Google Scholar]
  11. Cane, P. Il controllo di qualità dei vini mediante HPLC: Determinazione di acidi organici. L’Enotecnico 1990, 26, 69–72. [Google Scholar]
  12. Di Stefano, R.; Cravero, M.C. Metodi per lo studio dei polifenoli dell’uva. Riv. Vitic. Enol. 1991, 44, 37–45. [Google Scholar]
  13. Hebrero, E.; Santos-Buelga, C.; Rivas-Gonzalo, J.C. High Performance Liquid Chromatography-Diode Array Spectroscopy Identification of Anthocyanins of Vitis vinifera variety Tempranillo. Am. J. Enol. Vitic. 1988, 39, 227–233. [Google Scholar]
  14. Welch, C.R.; Wu, Q.; Simon, J.E. Recent Advances in Anthocyanin Analysis and Characterization. Curr. Anal. Chem. 2008, 4, 75–101. [Google Scholar] [CrossRef] [PubMed]
  15. Gabetta, B.; Fuzzati, N.; Griffini, A.; Lolla, E.; Pace, R.; Ruffilli, T.; Peterlongo, F. Characterization of proanthocyanidins from grape seeds. Fitoterapia 2000, 71, 162–175. [Google Scholar] [CrossRef]
  16. Bochkov, D.V.; Sysolyatin, S.V.; Kalashnikov, A.I.; Surmacheva, I.A. Shikimic acid: review of its analytical, isolation, and purification techniques from plant and microbial sources. J. Chem. Biol. 2012, 5, 5–17. [Google Scholar] [CrossRef] [PubMed]
  17. Makris, D.P.; Kallithraka, S.; Mamalos, A. Differentiation of young red wines based on cultivar and geographical origin with application of chemometrics of principal polyphenolic constituents. Talanta 2006, 70, 1143–1152. [Google Scholar] [CrossRef] [PubMed]
  18. Tamborra, P.; Esti, M. Authenticity markers in Aglianico, Uva di Troia, Negramaro and Primitivo grapes. Anal. Chim. Acta 2010, 660, 221–226. [Google Scholar] [CrossRef] [PubMed]
  19. Rapeanu, G.; Vicol, C.; Bichescu, C. Possibilities to assess the wines authenticity. Innov. Rom. Food Biotechnol. 2009, 5, 1–9. [Google Scholar]
  20. Tamborra, P.; Bolettieri, D.; Latorraca, M.; Tamborra, M.; Paradiso, F.; Savino, M. The shikimic acid: An important metabolite for the Aglianico del Vulture wines. Ital. J. Agron. 2014, 9, 182–184. [Google Scholar] [CrossRef]
  21. Alcalde-Eon, C.; García-Estévez, I.; Martín-Baz, A.; Rivas-Gonzalo, J.C.; Escribano-Bailón, M.T. Anthocyanin and flavonol profiles of Vitis vinifera L. cv Rufete grapes. Biochem. Syst. Ecol. 2014, 53, 76–80. [Google Scholar] [CrossRef]
  22. Boulton, R.B. The copigmentation of anthocyanins and its role in the color of red wine: A Critical Review. Am. J. Enol. Vitic. 2001, 52, 67–87. [Google Scholar]
  23. Soleas, G.J.; Grass, L.; Josephy, P.D.; Goldberg, D.M.; Diamandis, E.P. A comparison of the anticarcinogenic properties of four red wine polyphenols. Clin. Biochem. 2006, 39, 492–497. [Google Scholar] [CrossRef]
  24. Fresco, P.; Borges, F.; Diniz, C.; Marques, M.P. New insights on the anticancer properties of dietary polyphenols. Med. Res. Rev. 2006, 26, 747–766. [Google Scholar] [CrossRef] [PubMed]
  25. Rodríguez-Montealegre, R.; Romero-Peces, R.; Chacón-Vozmediano, J.L.; Martínez-Gascueña, J.; García-Romero, E. Phenolic compounds in skins and seeds of ten grape Vitis vinifera varieties grown in a warm climate. J. Food Compos. Anal. 2006, 19, 687–693. [Google Scholar] [CrossRef]
  26. Ribéreau-Gayon, P.; Glories, Y.; Maujean, A.; Dubourdieu, D. Phenolic compounds. In Handbook of Enology: The Chemistry of Wine Stabilization and Treatments Vol 2, 2nd ed.; J. Wiley & Sons, Ltd.: Chichester, UK, 2006. [Google Scholar]
  27. Bautista-Ortín, A.B.; Busse-Valverde, N.; López-Roca, J.M.; Gil-Muñoz, R.; Gómez-Plaza, E. Grape seed removal: Effect on phenolics, chromatic and organoleptic characteristics of red wine. Int. J. Food Sci. Technol. 2014, 49, 34–41. [Google Scholar] [CrossRef]
  28. Crupi, P.; Pichierri, A.; Basile, T.; Antonacci, D. Postharvest stilbenes and flavonoids enrichment of table grape cv Redglobe (Vitis vinifera L.) as affected by interactive UV-C exposure and storage conditions. Food Chem. 2013, 141, 802–808. [Google Scholar] [CrossRef] [PubMed]
  29. Balestrieri, M.L.; Schiano, C.; Felice, F.; Casamassimi, A.; Balestrieri, A.; Milone, L.; Servillo, L.; Napoli, C. Effect of Low Doses of Red Wine and Pure Resveratrol on Circulating Endothelial Progenitor Cells. J. Biochem. 2008, 143, 179–186. [Google Scholar] [CrossRef] [PubMed]
  30. Soleas, G.J.; Diamandis, E.P.; Goldberg, D.M. Resveratrol: A molecule whose time has come? And gone? Clin. Biochem. 1997, 30, 91–113. [Google Scholar] [CrossRef]
Figure 1. Principal Component Analysis (PCA) biplot. Codes: Total anthocyanins (AT), Total flavonoids (TF), Flavonoids other than anthocyanins (FNA), Total flavonoids in seeds (TS), Resveratrol (R) and Flavonols (F).
Beverages 03 00045 g001
Table 1. Weight, sugars and organic acids composition of berries.
SampleBerry Weight g°BrixTartaric Acid g/LMalic Acid g/LShikimic Acid mg/LCitric Acid g/L
M11.87 ± 0.19 abcd17.0 ± 0.5 a3.77 ± 0.18 a2.21 ± 0.30 d34.3 ± 3.5 d0.13 ± 0.02 a
M21.62 ± 0.16 abc23.5 ± 0.8 d3.84 ± 0.19 a1.58 ± 0.21 bcd15.4 ± 1.3 a0.22 ± 0.03 b
M52.2 ± 0.20 d17.8 ± 0.2 a3.75 ± 0.18 a2.01 ± 0.27 d25.2 ± 2.5 bc0.15 ± 0.02 ab
M61.31 ± 0.12 a25.1 ± 0.3 e4.93 ± 0.24 b0.89 ± 0.12 a33.7 ± 2.9 d0.32 ± 0.04 c
M81.54 ± 0.15 ab23.1 ± 0.6 d3.66 ± 0.18 a1.38 ± 0.13 abc15.8 ± 1.6 a0.21 ± 0.03 b
M91.56 ± 0.17 ab23.1 ± 0.3 d3.88 ± 0.19 a0.89 ± 0.12 a21.6 ± 2.2 ab0.20 ± 0.03 b
M101.77 ± 0.16 abcd20.4 ± 0.2 bc3.79 ± 0.19 a1.06 ± 0.14 ab31.3 ± 3.2 cd0.15 ± 0.02 ab
M111.93 ± 0.18 bcd21.1 ± 0.2 c4.65 ± 0.23 b2.09 ± 0.28 d32.2 ± 3.3 cd0.22 ± 0.03 b
M121.96 ± 0.20 bcd21.4 ± 0.5 cd3.80 ± 0.19 a1.87 ± 0.25 cd18.2 ± 1.9 ab0.16 ± 0.02 ab
M131.58 ± 0.15 abc19.3 ± 0.8 b3.91 ± 0.19 a1.60 ± 0.21 bcd30.6 ± 2.3 cd0.13 ± 0.02 a
M141.78 ± 0.18 abcd21.4 ± 0.4 cd3.82 ± 0.19 a2.89 ± 0.39 e35.6 ± 3.3 d0.15 ± 0.02 ab
M152.07 ± 0.19 cd21.5 ± 0.7 cd4.60 ± 0.23 b1.19 ± 0.16 ab22.77 ± 2.34 ab0.09 ± 0.01 a
M161.52 ± 0.14 ab21.6 ± 0.5 cd5.12 ± 0.25 b0.67 ± 0.09 a23.2 ± 2.3 ab0.20 ± 0.03 b
M171.77 ± 0.18 abcd21.6 ± 0.3 cd3.95 ± 0.19 a1.29 ± 0.17 abc23.2 ± 2.4 ab0.13 ± 0.02 a
Values represent mean of three replicates ± SD. a, b, c: the means that do not bear a common letter differ significantly at the 0.05 level of significance.
Table 2. Polyphenolic composition of berries (mg/kg).
SampleTotal Flavonoids (Skins) **Total Anthocyanins *Other Flavonoids (Skins) **Total Flavonoids (Seeds) **
M12593 ± 21 fg1283 ± 30 g1083 ± 37 cd2376.5 ± 16.1 l
M21867 ± 27 c714 ± 54 bc1026 ± 31 d1894.1 ± 14.3 k
M51562 ± 35 a643 ± 25 abc804 ± 60 a1004.4 ± 20.5 f
M63484 ± 13 j1692 ± 70 h1491 ± 23 f1379.2 ± 21.0 i
M82247 ± 23 e1144 ± 35 f900 ± 35 ab1097.9 ± 21.3 gh
M92554 ± 23 f1316 ± 25 g1009 ± 41 bc1517.2 ± 14.5 j
M102688 ± 26 gh1116 ± 36 f1375 ± 42 f741.1 ± 17.5 d
M112107 ± 41 d824 ± 41 c1137 ± 50 de381.1 ± 19.9 a
M122039 ± 42 d978 ± 60 e888 ± 24 ab900.6 ± 14.3 e
M131886 ± 38 c702 ± 21 bc1059 ± 25 cd637.2 ± 13.2 c
M141751 ± 24 b747 ± 42 bc873 ± 35 a1054.0 ± 17.9 g
M151508 ± 25 a564 ± 20 a845 ± 41 a1113.1 ± 10.1 h
M162996 ± 37 i1631 ± 77 h1075 ± 72 d1554.9 ± 7.9 j
M172761 ± 31 h1287 ± 50 g1246 ± 38 e535.5 ± 18.9 b
* expressed as malvidin-3-O-glucoside; ** expressed as (+)-catechin. Values represent mean of three replicates ± SD. a, b, c: the means that do not bear a common letter differ significantly at the 0.05 level of significance.
Table 3. The anthocyanins profile of berry skins.
Compound (%)M1M2M5M6M8M9M10M11M12M13M14M15M16M17
Dp-3-gl5.23.64.56.04.25.53.36.54.55.58.15.24.44.3
Cy-3-gl0.40.10.40.50.30.30.11.00.40.51.60.50.30.4
Pt-3-gl6.05.35.67.46.46.05.17.05.25.77.76.06.95.9
Pn-3-gl3.03.54.03.63.02.13.26.53.34.18.64.22.23.5
Mv-3-gl58.158.560.157.758.062.660.055.960.054.152.453.761.059.1
Total acetylated3.01.20.21.13.51.50.10.80.73.31.43.72.61.0
Total coumaroylated24.327.825.223.724.622.028.222.325.926.820.226.722.625.8
Table 4. Gallic acid, flavanols and oligomeric proanthocyanidins content of berry skins (mg/kg of grape, expressed as (+)-catechin). Values represent mean of three replicates ± SD. a, b, c: the means that do not bear a common letter differ significantly at the 0.05 level of significance.
CompoundM1M2M5M6M8M9M10
Gallic acidn.r.0.7 ± 0.4 a9.0 ± 0.1 f10.5 ± 0.1 h6.4 ± 0.2 c9.8 ± 0.1 g5.4 ± 0.2 b
(−)-Epigallocatechinn.r.n.r.n.r.n.r.8.1 ± 0.5 c1.5 ± 0.2 ab1.4 ± 0.1 ab
(+)-Catechin4.4 ± 0.3 fn.r.n.r.n.r.1.0 ± 0.1 a2.0 ± 0.1 cde1.4 ± 0.2 ab
(−)-Epicatechin6.3 ± 0.4 g1.0 ± 0.3 a2.5 ± 0.1 d3.2 ± 0.2 e2.2 ± 0.1 cd3.9 ± 0.1 f3.2 ± 0.2 e
(−)-Epigallocat. gallate5.4 ± 0.3 g4.1 ± 0.1 ef2.7 ± 0.2 bc4.6 ± 0.1 f2.8 ± 0.2 bc3.6 ± 0.1 de3.1 ± 0.2 cd
Procyanidin B110.8 ± 0.3 f6.9 ± 0.2 cd7.3 ± 0.3 cd6.9 ± 0.2 cd7.1 ± 0.1 d10.5 ± 0.3 e6.1 ± 0.2 bc
Procyanidin B23.7 ± 0.2 a5.2 ± 0.3 bn.r.n.r.n.r.n.r.n.r.
Procyanidin B31.1 ± 0.2 a1.7 ± 0.1 b1.1 ± 0.2 an.r.n.r.2.5 ± 0.1 de2.4 ± 0.2 de
Procyanidin B42.0 ± 0.2 abn.r.3.4 ± 0.2 de8.7 ± 0.5 h6.3 ± 0.1 g5.1 ± 0.1f1.8 ± 0.2 ab
CompoundM11M12M13M14M15M16M17
Gallic acid9.7 ± 0.1 g9.9 ± 0.1 gh5.7 ± 0.3 b8.2 ± 0.1 e7.2 ± 0.2 d12.2 ± 0.2 i6.0 ± 0.3 bc
(−)-Epigallocatechinn.r.n.r.n.r.1.6 ± 0.3 b0.8 ± 0.1 an.r.n.r.
(+)-Catechin1.7 ± 0.1 bcd1.6 ± 0.1 bc1.5 ± 0.2 b1.7 ± 0.1 bcd1.6 ± 0.1 bc2.4 ± 0.2 e2.0 ± 0.1 cde
(−)-Epicatechin2.3 ± 0.1 cd2.4 ± 0.1 cd1.7 ± 0.2 b1.9 ± 0.2 bc1.9 ± 0.2 bc4.4 ± 0.1 f2.5 ± 0.1 d
(−)-Epigallocat. gallate3.4 ± 0.2 d2.3 ± 0.1 ab3.5 ± 0.3 d2.1 ± 0.1 a3.1 ± 0.3 cd2.6 ± 0.1 abc3.4 ± 0.2 d
Procyanidin B19.3 ± 0.4 e7.3 ± 0.2 d5.8 ± 0.1 ab5.2 ± 0.1 a7.7 ± 0.2 d17.5 ± 0.5 g6.3 ± 0.2 bc
Procyanidin B2n.r.n.r.n.r.n.r.n.r.n.r.n.r.
Procyanidin B32.2 ± 0.1 cd2.7 ± 0.2 e2.6 ± 0.2 de1.8 ± 0.1 bc2.8 ± 0.1 ef3.2 ± 0.2 f1.6 ± 0.1 b
Procyanidin B42.9 ± 0.1 cd4.9 ± 0.4 f1.4 ± 0.1 a3.7 ± 0.2 e2.3 ± 0.1 bc9.8 ± 0.3 i4.5 ± 0.1 f
Table 5. Gallic acid, flavanols and oligomeric proanthocyanidins content of berry seeds (mg/kg of grape, expressed as (+)-catechin). Values represent mean of three replicates ± SD. a, b, c: the means that do not bear a common letter differ significantly at the 0.05 level of significance.
CompoundM1M2M5M6M8M9M10
Gallic acid31.1 ± 0.5 j26.8 ± 0.3 i8.3 ± 0.1 de10.4 ± 0.2 g13.2 ± 0.3 h10.4 ± 0.1 g6.0 ± 0.2 a
(−)-Epigallocatechin65.6 ± 0.4 l52.2 ± 0.3 k26.9 ± 0.1 d41.0 ± 0.5 h38.1 ± 0.2 g47.0 ± 0.2 j21.7 ± 0.3 b
(+)-Catechin136.1 ± 0.2 m132.6 ± 0.2 l59.6 ± 0.4 e92.1 ± 0.3 i85.8 ± 0.4 g101.4 ± 0.1 k47.7 ± 0.3 b
(−)-Epigallocat. gallate93.9 ± 0.3 m73.3 ± 0.2 l40.6 ± 0.1 f51.7 ± 0.1 h59.9 ± 0.2 j64.3 ± 0.1 k31.1 ± 0.1 b
(−)-Epicatechin gallate138.3 ± 0.3 n106.7 ± 0.2 m18.7 ± 0.2 d24.3 ± 0.3 g73.4 ± 0.2 l29.3 ± 0.3 i13.2 ± 0.1 b
(−)-Epicatechin107.0 ± 0.3 m90.3 ± 0.2 l48.1 ± 0.2 e55.0 ± 0.3 f74.4 ± 0.3 k68.1 ± 0.2 i34.4 ± 0.2 b
Procyanidin B15.1 ± 0.2 l4.6 ± 0.2 kl2.4 ± 0.1 bcd3.7 ± 0.2 hi3.4 ± 0.2 fgh4.0 ± 0.1 hijk2.0 ± 0.2 b
Procyanidin B344.2 ± 0.3 j39.6 ± 0.2 i18.6 ± 0.4 d33.5 ± 0.1 h27.4 ± 0.3 f34.1 ± 0.1 h15.1 ± 0.2 b
Procyanidin B479.8 ± 0.3 l47.1 ± 0.2 k27.2 ± 0.4 e32.4 ± 0.3 f42.0 ± 0.3 j41.2 ± 0.3 ij19.7 ± 0.2 b
Procyanidin B214.3 ± 0.1 k10.1 ± 0.1 j6.0 ± 0.1 e6.9 ± 0.1 f8.3 ± 0.2 i8.8 ± 0.4 i4.0 ± 0.1 b
Other Procyanidins137.1108.935.375.273.4100.589.2
CompoundM11M12M13M14M15M16M17
Gallic acid10.9 ± 0.1 g9.0 ± 0.1 ef7.0 ± 0.3 b12.7 ± 0.3 h7.3 ± 0.2 bc7.9 ± 0.1 cd9.3 ± 0.2 f
(−)-Epigallocatechin17.0 ± 0.2 a31.6 ± 0.1 f23.8 ± 0.2 c42.5 ± 0.4 i29.2 ± 0.1 e23.0 ± 0.3 c42.6 ± 0.3 i
(+)-Catechin40.7 ± 0.1 a70.0 ± 0.3 f55.0 ± 0.1 d97.6 ± 0.2 j58.7 ± 0.4 e49.1 ± 0.1 c87.4 ± 0.3 h
(−)-Epigallocat. gallate20.2 ± 0.2 a50.3 ± 0.3 g32.6 ± 0.1 c52.0 ± 0.3 h37.8 ± 0.2 e36.2 ± 0.2 d54.5 ± 0.2 i
(−)-Epicatechin gallate9.7 ± 0.2 a21.3 ± 0.2 f17.7 ± 0.3 c70.1 ± 0.4 k19.5 ± 0.2 e43.8 ± 0.4 j28.5 ± 0.3 h
(−)-Epicatechin26.3 ± 0.1 a59.2 ± 0.1 g41.6 ± 0.1 cd70.8 ± 0.2 j41.1 ± 0.4 c42.2 ± 0.1 d60.6 ± 0.3 h
Procyanidin B11.2 ± 0.4 a2.6 ± 0.1 bcde2.0 ± 0.3 b3.0 ± 0.2 defg2.8 ± 0.1 cdef2.2 ± 0.2 bc3.7 ± 0.2 hij
Procyanidin B310.8 ± 0.2 a21.5 ± 0.4 e17.8 ± 0.3 c28.4 ± 0.2 g22.1 ± 0.2 e18.1 ± 0.1 cd29.0 ± 0.3 g
Procyanidin B417.4 ± 0.1 a34.9 ± 0.2 g23.6 ± 0.2 c40.5 ± 0.2 i25.1 ± 0.2 d24.8 ± 0.1 d36.9 ± 0.3 h
Procyanidin B22.9 ± 0.2 a7.3 ± 0.1 g4.7 ± 0.2 c7.6 ± 0.1 h5.4 ± 0.2 d4.6 ± 0.3 c7.7 ± 0.1 h
Other Procyanidins48.1121.890.8134.849.691.7141.3
Table 6. Resveratrol and flavonols in berry skins (mg/kg of grape). Values represent mean of three replicates ± SD. a, b, c: the means that do not bear a common letter differ significantly at the 0.05 level of significance. ‡ Sum of two glycosides: glucuronide and glucoside.
SampleResveratrolMyricetin Derivatives ‡Quercetin Derivatives ‡Kaempferol Derivatives ‡
M116.8 ± 0.6 i66.5 ± 0.4 i71.9 ± 3 e30.5 ± 1.9 g
M25.1 ± 1.4 a29.1 ± 0.2 fg33.6 ± 1.3 ab9.4 ± 0.6 b
M59.1 ± 0.2 cde19.0 ± 0.1 d33.5 ± 1.2 ab0.5 ± 0.5 a
M611.8 ± 0.3 gh66.0 ± 1.0 i94.0 ± 3.2 f19.3 ± 0.4 cd
M811.0 ± 0.2 fg28.7 ± 0.9 f92.5 ± 1.9 f45.7 ± 1.0 h
M97.6 ± 0.1 b31.1 ± 1.5 gh62.2 ± 4.7 d25.2 ± 0.6 f
M106.0 ± 0.2 a14.3 ± 0.2 b40.2 ± 0.3 bc18.0 ± 0.4 cd
M1111.7 ± 1.1 fgh14.7 ± 0.4 bc41.3 ± 0.2 bc16.4 ± 0.5 c
M128.8 ± 0.4 cd19.2 ± 0.2 de37.8 ± 1.7 b15.8 ± 1.7 c
M138.9 ± 0.3 cde16.2 ± 0.7 bc46.8 ± 4.2 c23.4 ± 0.6 ef
M1415.8 ± 0.5 i12.1 ± 0.2 a29.2 ± 0.5 a8.5 ± 3.2 b
M157.5 ± 0.1 b14.3 ± 0.6 b56.6 ± 3.6 d30.6 ± 0.6 g
M1610.6 ± 0.3 f32.3 ± 1.4 h101.0 ± 4.2 f44.8 ± 0.4 h
M178.6 ± 0.2 c20.9 ± 0.3 de46.3 ± 1.9 c21.3 ± 1.1 de

