Article

The Effect of Soundwaves on Foamability Properties and Sensory of Beers with a Machine Learning Modeling Approach

School of Agriculture and Food, Faculty of Veterinary and Agricultural Sciences, University of Melbourne, Melbourne, VIC 3010, Australia
*
Author to whom correspondence should be addressed.
Beverages 2018, 4(3), 53; https://doi.org/10.3390/beverages4030053
Submission received: 10 July 2018 / Revised: 25 July 2018 / Accepted: 25 July 2018 / Published: 26 July 2018
(This article belongs to the Special Issue Brewing and Craft Beer)

Abstract

:
The use of ultrasounds has been implemented to increase yeast viability, de-foaming, and cavitation in foods and beverages. However, the application of low frequency audible sound to decrease bubble size and improve foamability has not been explored. In this study, three treatments using India Pale Ale beers were tested, which include (1) a control, (2) the application of audible sound during fermentation, and (3) the application of audible sound during natural carbonation. Five different audible frequencies (20 Hz, 30 Hz, 45 Hz, 55 Hz, and 75 Hz) were applied daily for one minute each (starting from the lowest frequency) during fermentation (11 days, treatment 2) and carbonation (22 days, treatment 3). Samples were measured in triplicates using the RoboBEER to assess color and foam-related parameters. A trained panel (n = 10) evaluated the intensity of sensory descriptors. Results showed that samples with sonication treatment had significant differences in the number of small bubbles, alcohol, and viscosity compared to the control. Furthermore, except for foam texture, foam height, and viscosity, there were non-significant differences in the intensity of any sensory descriptor, according to the rating from the trained sensory panel. The use of soundwaves is a potential treatment for brewing to improve beer quality by increasing the number of small bubbles and foamability without disrupting yeast or modifying the aroma and flavor profile.

1. Introduction

Sound consists of a mechanical longitudinal wave, which propagates through gas and liquid media such as air and water but may also do so through solid materials [1]. Furthermore, frequency is defined as the number of complete oscillations per second and is expressed in Hertz [2,3]. The wavelength is the distance between the peaks of the sound signal [4] and is calculated using the following equation: V = λ F , where “V” is the speed of sound, λ is the wavelength, and “F” is the frequency [5]. The wavelength depends on the velocity. Therefore, the medium affects the wavelength since the density and elasticity of the medium will change the velocity of sound [6]. Soundwaves are divided in three different classes according to their frequency range including (i) infrasound, which are those below 20 Hz and not audible by the human ear but may be detected by measuring the variation in pressure and vibrations. This type of soundwaves is naturally produced by earthquakes, volcanic eruptions, among others. A second class of soundwaves includes (ii) audible sound, which is produced within 20 Hz and 2000 Hz and, as its name implies, it can be perceived by the human ear and (iii) ultrasound that is above 2000 Hz and cannot be heard by humans. However, some animals are able to hear it [7,8,9]. In food-related products, infrasound has been used to reduce membrane fouling in beer and wine filtration [10] while audible sound has been used to increase Escherichia coli growth [11], in the control of insects in stored products such as grains [12], and to increase yeast cells growth rate [13] among others. However, ultrasound has been the most applied frequency range in food and beverages to increase the retention of nutritional compounds in fruit beverages [14], to increase production capacity and promote lightness of juices, and to aid in their preservation by the inactivation of enzymes [15] for the degassing of liquids [16] among others.
The amount and stability of foam and bubbles are essential in carbonated beverages such as beer since they comprise the most important factors that consumers consider when assessing the quality of beer. According to previous studies, consumers have a preference for beers with a medium level of foam height and consider the low foam as non-desirable with the lowest liking, lowest perceived quality scores, and highest penalty scores [17,18,19,20,21]. Therefore, it is important to explore methods such as sonication during its production process to increase foam in beer. However, the application of soundwave frequencies in beer has been limited to infra-sound or ultrasound with other purposes such as the aforementioned reduction of membrane fouling during filtration [10], to measure density of beer during fermentation [22], hops extraction [23], to increase yeast viability, and to increase alcohol concentration applying ultrasound during fermentation [24] among others.
The use of soundwaves to modify bubble size has been narrowed to the purpose of degassing, de-foaming [16], and to produce cavitation, which is the effect of forming bubbles that increase their size and cause their implosion [25]. Nevertheless, there are no studies that had assessed the effects of audible sound in bubbles and foam quality in carbonated beverages. Some breweries such as Philadelphia’s Dock Street Brewery, Mikkeller craft brewery, and Garage Project have applied music during the fermentation stage of the brewing process by claiming that music improves beers sensory characteristics and increases yeast activity [26,27,28]. However, music has a mix of different frequencies and soundwaves, which does not allow us to isolate the effects of the specific frequency levels. This can potentially have a higher, lower, or no effect on beer characteristics such as foaming and bubble size.
This paper aims to present the results from the assessment of the effects of audible soundwaves on beer bubbles and foam quality during fermentation and natural carbonation stages of the brewing process. The study was conducted using triplicates of three different treatments including (i) a control using the usual brewing process, (ii) the application of frequencies during fermentation, and (iii) the application of frequencies during the carbonation stage. Five different frequency levels (20 Hz, 30 Hz, 45 Hz, 55 Hz, and 75 Hz) were used for the treatments. These were applied using two speakers including an amplifier and an iPhone application Audio Function Generator (Thomas Gruber, Forchenstein, Austria). The samples were analyzed using a robotic pourer RoboBEER and Matlab® R2018b (Mathworks, Inc., Matick, MA, USA) to assess foam and color-related parameters and through a trained sensory panel (n = 10) to assess significant differences between the treatments in their sensory descriptors. Lastly, two machine learning models previously developed by Gonzalez Viejo et al. [29,30] were tested by feeding the inputs from the RoboBEER of the triplicates of the three treatments to (i) predict the type of fermentation and (ii) to predict the intensities of sensory descriptors by obtaining high accuracy in the testing.

2. Materials and Methods

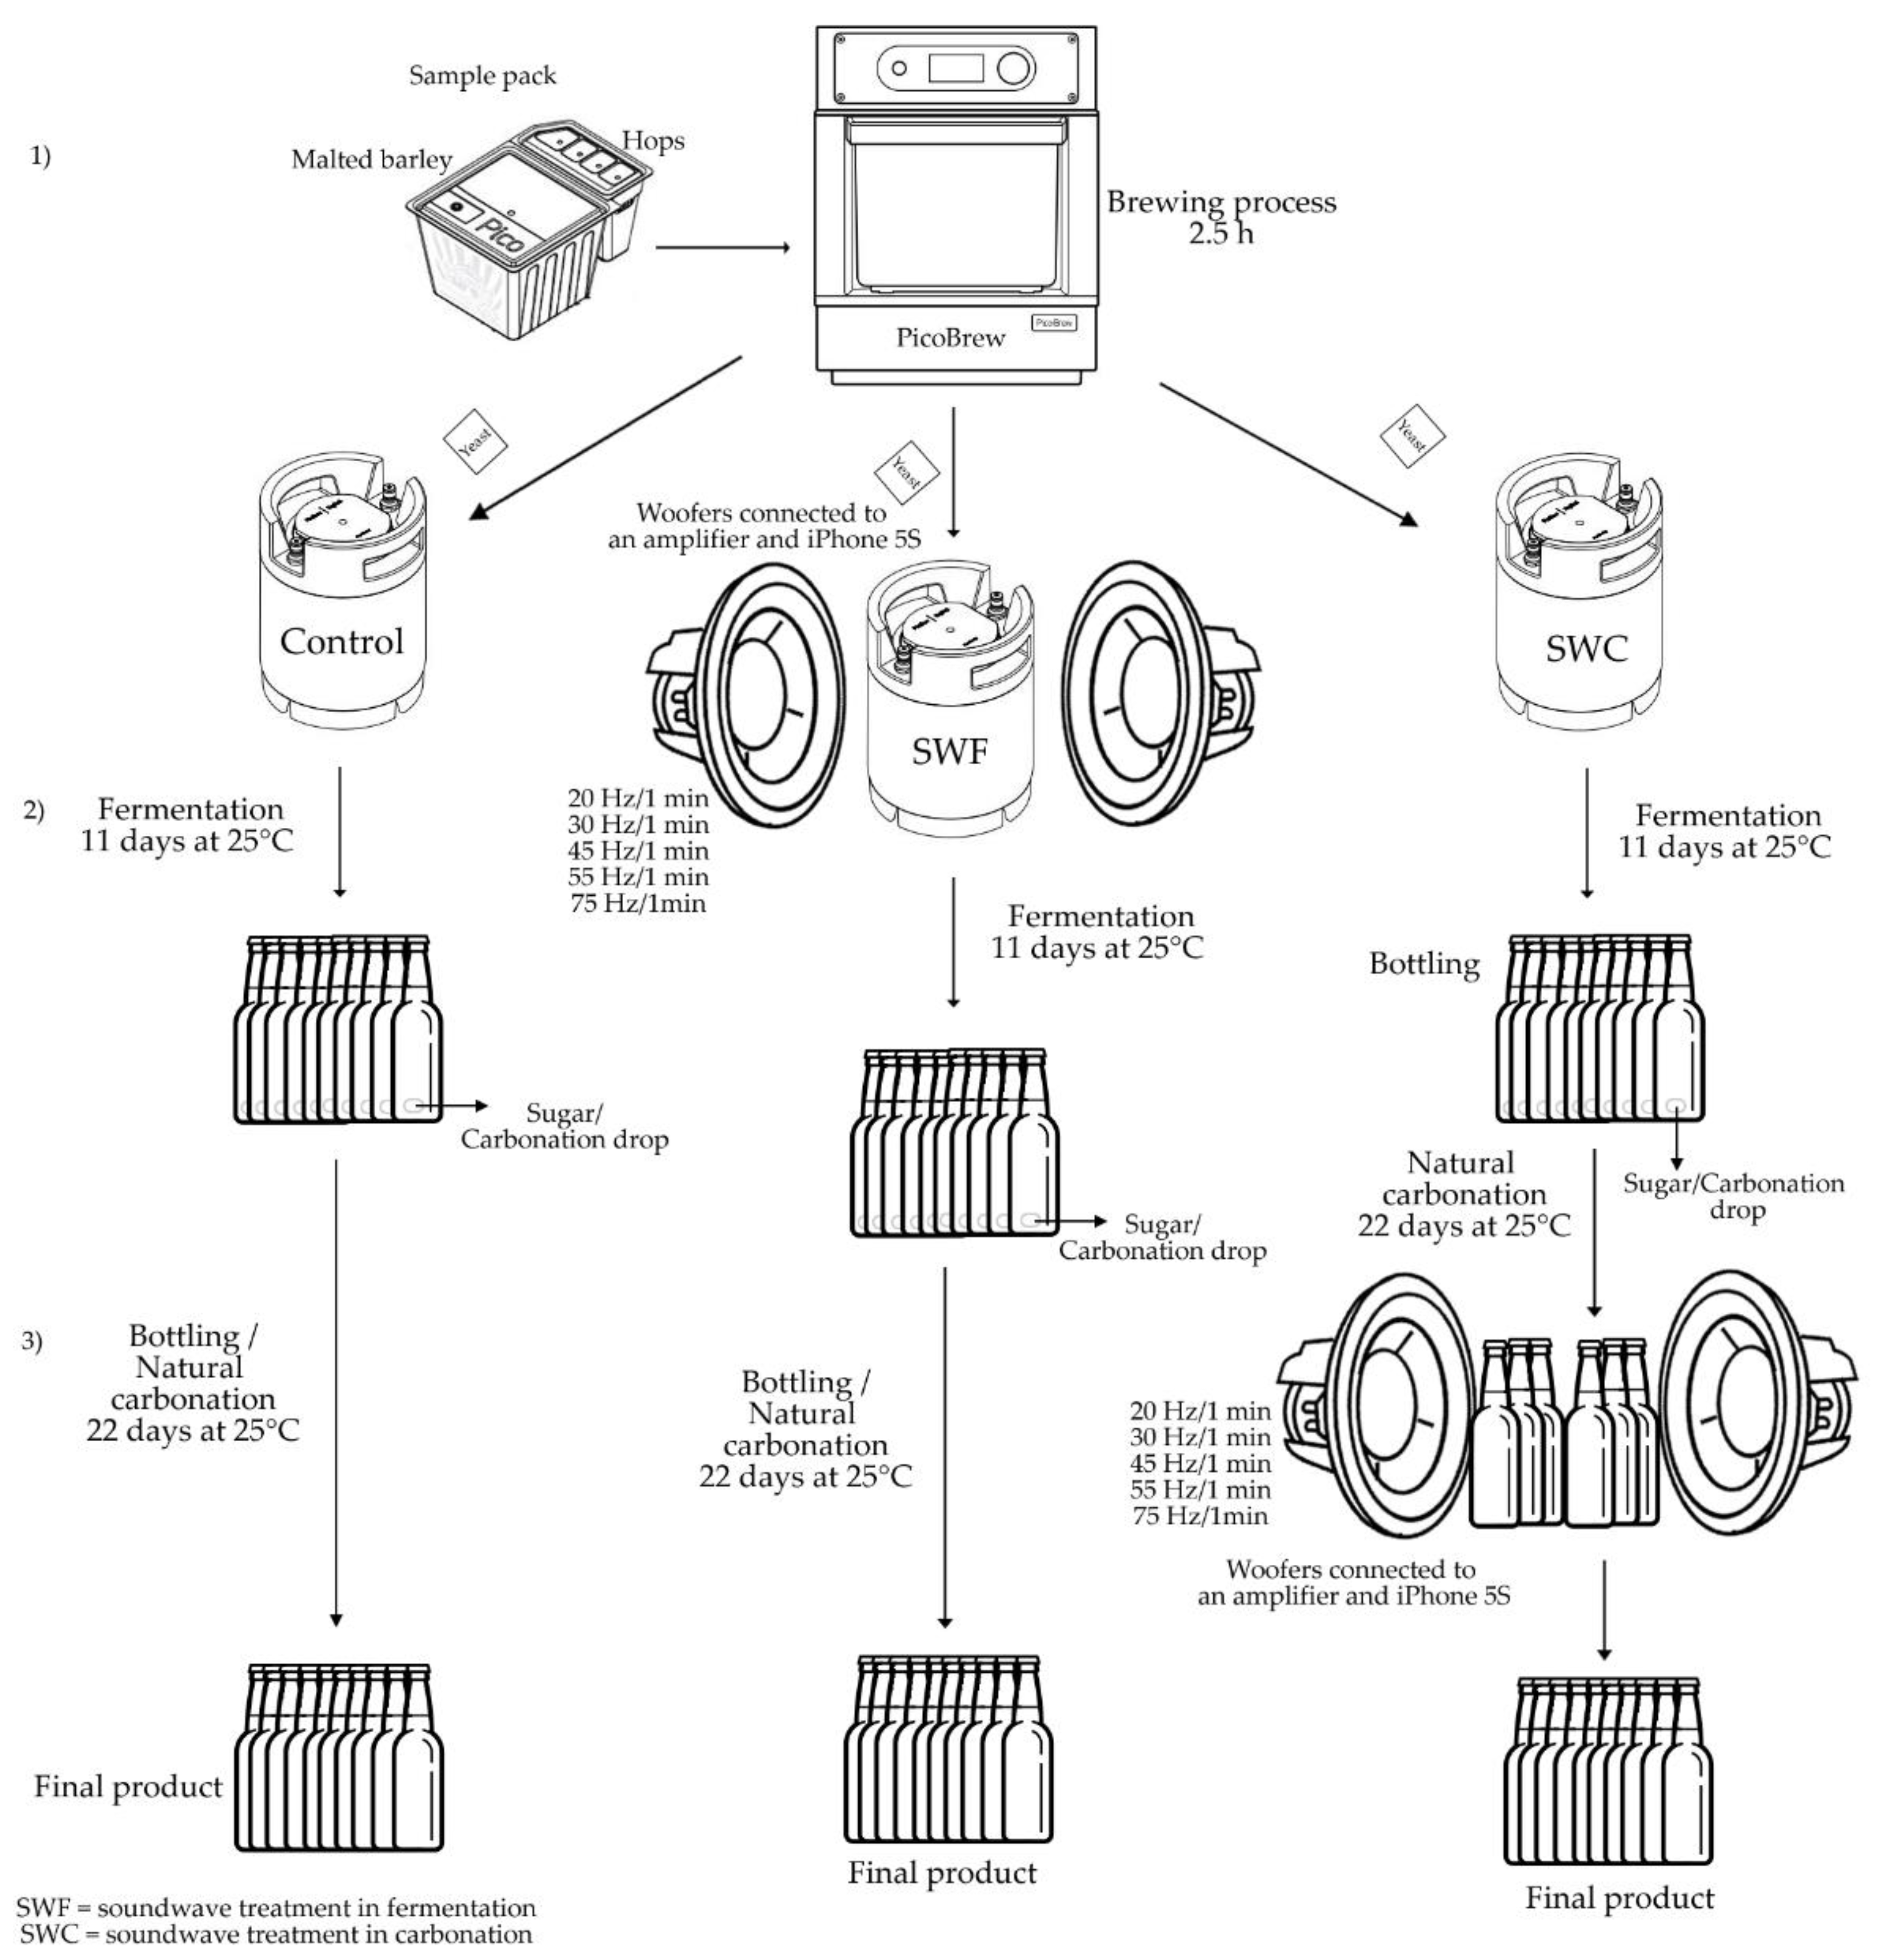
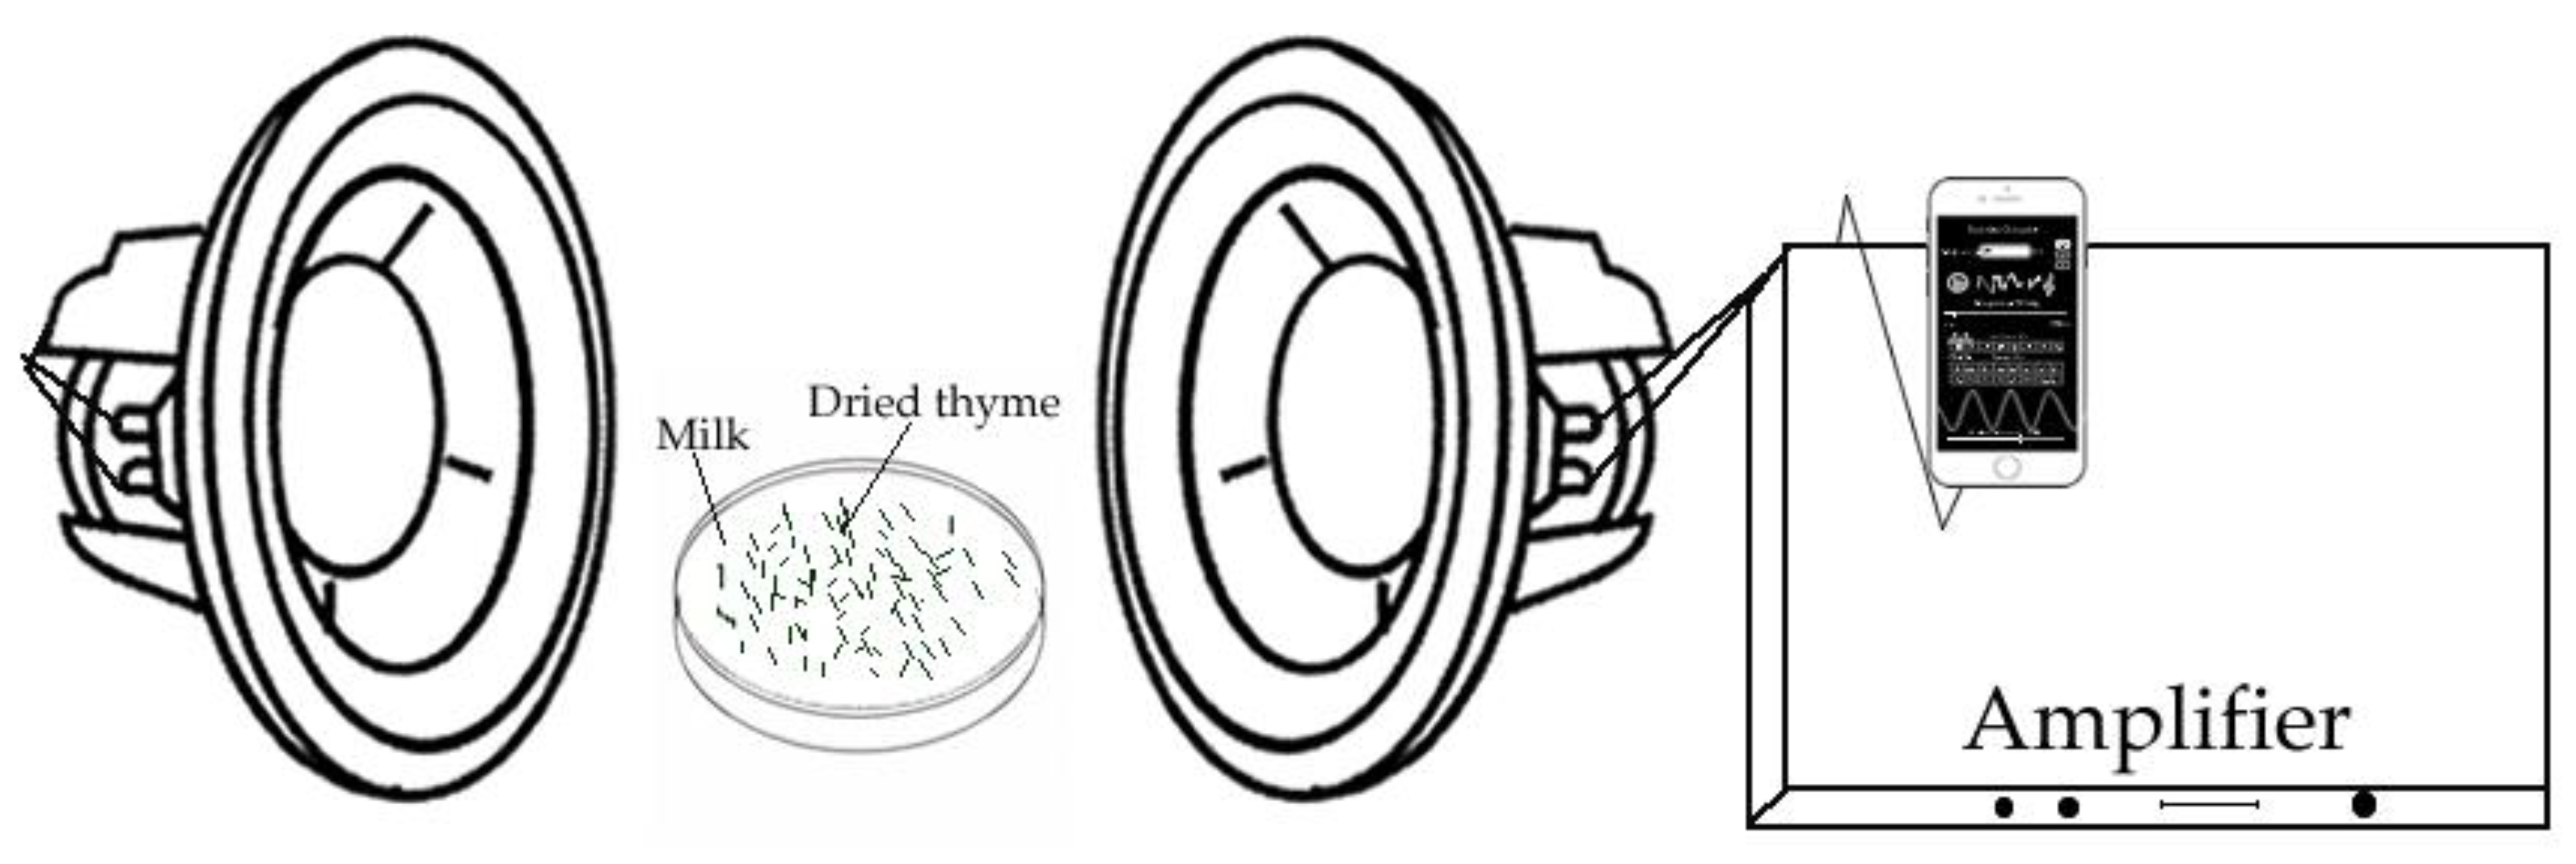
2.1. Beer Samples Description and Processing

English style India Pale Ale (IPA, Berlin IPA, BrewBaker, Berlin, Germany) samples were selected for this study since breweries who have used music for brewing have done it using this style of beer [26,28]. The samples were brewed using the PicoBrew S (PicoBrew, Seattle, WA, USA). The samples came in special containers specific for the PicoBrew, which included the malted barley and different types of hops (Perle, Polaris, Tettnanger, Smaragd, and Cascade). As shown in Figure 1, for the control and the other two treatments (soundwaves during fermentation = SWF and soundwaves during carbonation = SWC), the container including the ingredients was inserted in the PicoBrew machine and followed the default formula in the machine for the specified IPA sample (Bitterness = 65 IBU). The first part of the brewing process for the control and two treatments lasted 2.5 h and consisted of heating, doughing, mash 1, mash 2, mash out, boiling to a maximum temperature of 114 °C, and holding at 94 °C for 1 h with the addition of four different types of hops at the start, the middle, and the end of the boiling process (Figure 1 (1)). Following the first part of the process, the yeast (Saccharomyces cerevisiae; strain 1056; Safale US-05, Belgium) was added to the three treatments in the same way. Then the hermetically sealed kegs for the control and SWC were left at room temperature (25 °C) in the same place for 11 days while the SWF, which was also hermetically sealed, was treated with audible soundwaves daily by applying frequencies of 20 Hz, 30 Hz, 45 Hz, 55 Hz, and 75 Hz at −4 dB for 1 min each during 11 days of fermentation. The soundwaves were applied using two speakers, an amplifier, an iPhone 5s (Apple Inc., Cupertino, CA, USA), and an Audio Function Generator application (Thomas Gruber) (Figure 1 (2)). To make sure the fermentation was completed, the CO2 from the keg was released once and then tried again 1 h later to make sure there was no more gas production. The last part of the process consisted of bottling the samples in brown bottles and adding one sugar drop for the natural carbonation process in which all the samples were left at 25 °C for 22 days. The control and SWF were left in the sample place during this stage of the process while the SWC were treated with audible soundwaves every day by applying frequencies of 20 Hz, 30 Hz, 45 Hz, 55 Hz, and 75 Hz at −4 dB for 1 min each for 22 days (Figure 1 (3)).
The specific frequencies were selected by recording videos of the application of different levels (20–100 Hz) at −4 dB of amplitude to milk and dry thyme leaves in a Petri dish (Figure 2) and were further magnified using the Eulerian Magnification Algorithm [31] in Matlab® R2018b (Mathworks, Inc., Matick, MA, USA). Those frequencies that produced movements of the thyme in different directions such as grouping particles, separating them, and vibrating in the same position were selected (20 Hz, 30 Hz, 45 Hz, 55 Hz, and 75 Hz). Dry thyme and milk were used due to the lack of solubility and to ease the magnification and visibility of particle movement.

2.2. Color and Foam-Related Parameters

All samples were analyzed in triplicates using computer vision algorithms written in Matlab® R2018b (Mathworks, Inc., Matick, MA, USA) to analyze 5-min videos recorded while using the automatic robotic pourer RoboBEER to obtain 15 color and foam-related parameters including: (i) maximum volume of foam (MaxVol), (ii) total lifetime of foam (TLTF), (iii) lifetime of foam (LTF), (iv) foam drainage (FDrain), color in two scales (v ), (vi), (vii) CIELab and (viii), (ix), (x) RGB and bubble size distribution of (xi) small (SmBubb), (xii) medium (MedBubb), and (xiii) large bubbles (LgBubb) as well as (xiv) alcohol gas (OH) and (xv) carbon dioxide (CO2) release. The samples were poured in the same International Standard Wine Tasting Glass Luigi Bormioli to avoid differences due to the glass. Details about the procedure of the RoboBEER can be found in the paper published by Gonzalez Viejo et al. [29]. The three parameters from the RGB color scale were converted to a color index using Equations (1)–(4). The samples were also analyzed for alcohol content in the liquid (Alcohol) using an Alcolyzer Wine M alcohol-meter (Anton Paar GmbH, Graz, Austria). Additionally, pH was measured using a pH-meter Benchtop pH/mV meter 860031 (Sper scientific direct, Scottsdale, AZ, USA) with 50 mL of the sample at an ambient temperature (25 °C). Furthermore, viscosity (Visc) was measured with a Brookfield viscometer DV-II+ (AMETEK Brookfield, Middleborough, MA, USA) using 150 mL of the sample and an RV02 spindle at 50 rpm for 20 s.
R G B   I n t e n s i t y   r a t i o ( I ) = R + G + B
R e d   i n t e n s i t y   r a t i o   ( R I ) = R I
G r e e n   i n t e n s i t y   r a t i o   ( G I ) = G I
B l u e   i n t e n s i t y   r a t i o   ( B I ) = B I

2.3. Sensory Descriptive Analysis

A sensory session was conducted using a trained panel of 10 participants who were regular beer consumers using the quantitative descriptive analysis (QDA) method. Two 1.5 h training sessions using IPA beers were conducted previous to the evaluation of the samples to obtain the descriptors and for the participants to familiarize themselves with the test. The sensory session was conducted at room temperature (24 °C) in a focus room in the sensory laboratory of the Faculty of Veterinary and Agricultural Sciences of The University of Melbourne, Australia (FVAS-UoM). Triplicates of the samples were evaluated and all were served in 1 oz plastic glasses at a refrigerated temperature (4 °C). The tasting was double blind and all samples were labeled with 3-digit random codes. Table 1 shows the parameters evaluated for all samples and the anchors used for each. For the visual assessment, the first 20 s of the videos obtained using the RoboBEER were shown on a large screen to all participants at the same time to ensure uniformity in the pouring and to evaluate all samples under the same conditions. The questionnaire was displayed in a Samsung Galaxy View Tablet (Samsung Group, Seoul, South Korea) using the Bio-sensory application [17,18,32,33]. All descriptors were rated using a 15 cm non-structured scale.

2.4. Statistical Analysis

Data obtained from the RoboBEER were analyzed using multivariate data analysis based on the PCA with a customized code written in Matlab® R2018b. The factor loadings are shown as supplementary material (Table S1). A correlation matrix (CM) was developed in Matlab® R2018b to assess significant correlations (p < 0.05). Furthermore, all data were assessed for significant differences using ANOVA and the least significant differences (LSD) post-hoc test (α = 0.05) in SAS® 9.4 software (SAS Institute Inc., Cary, NC, USA). Mean and standard deviation (SD) values were obtained.
Two machine learning models developed using commercial beers with artificial neural networks (ANN) [29,30] were fed with the 15 parameters obtained from the RoboBEER for the control. SWF and SWC were used as inputs to predict the type of fermentation and to predict the intensity of ten sensory descriptors (AHops, AYeast, AGrain, MVisc, MAstr, MCarb, TBitt, TSweet, TSour, and FHops). Results were correlated with those obtained using the trained sensory panel to validate the accuracy of the model for sensory descriptors. To assess the later, a Pearson linear correlation (y = ax + b) was developed, Statistical data such as the correlation coefficient (R), determination coefficient (R2), and slope were obtained.

3. Results

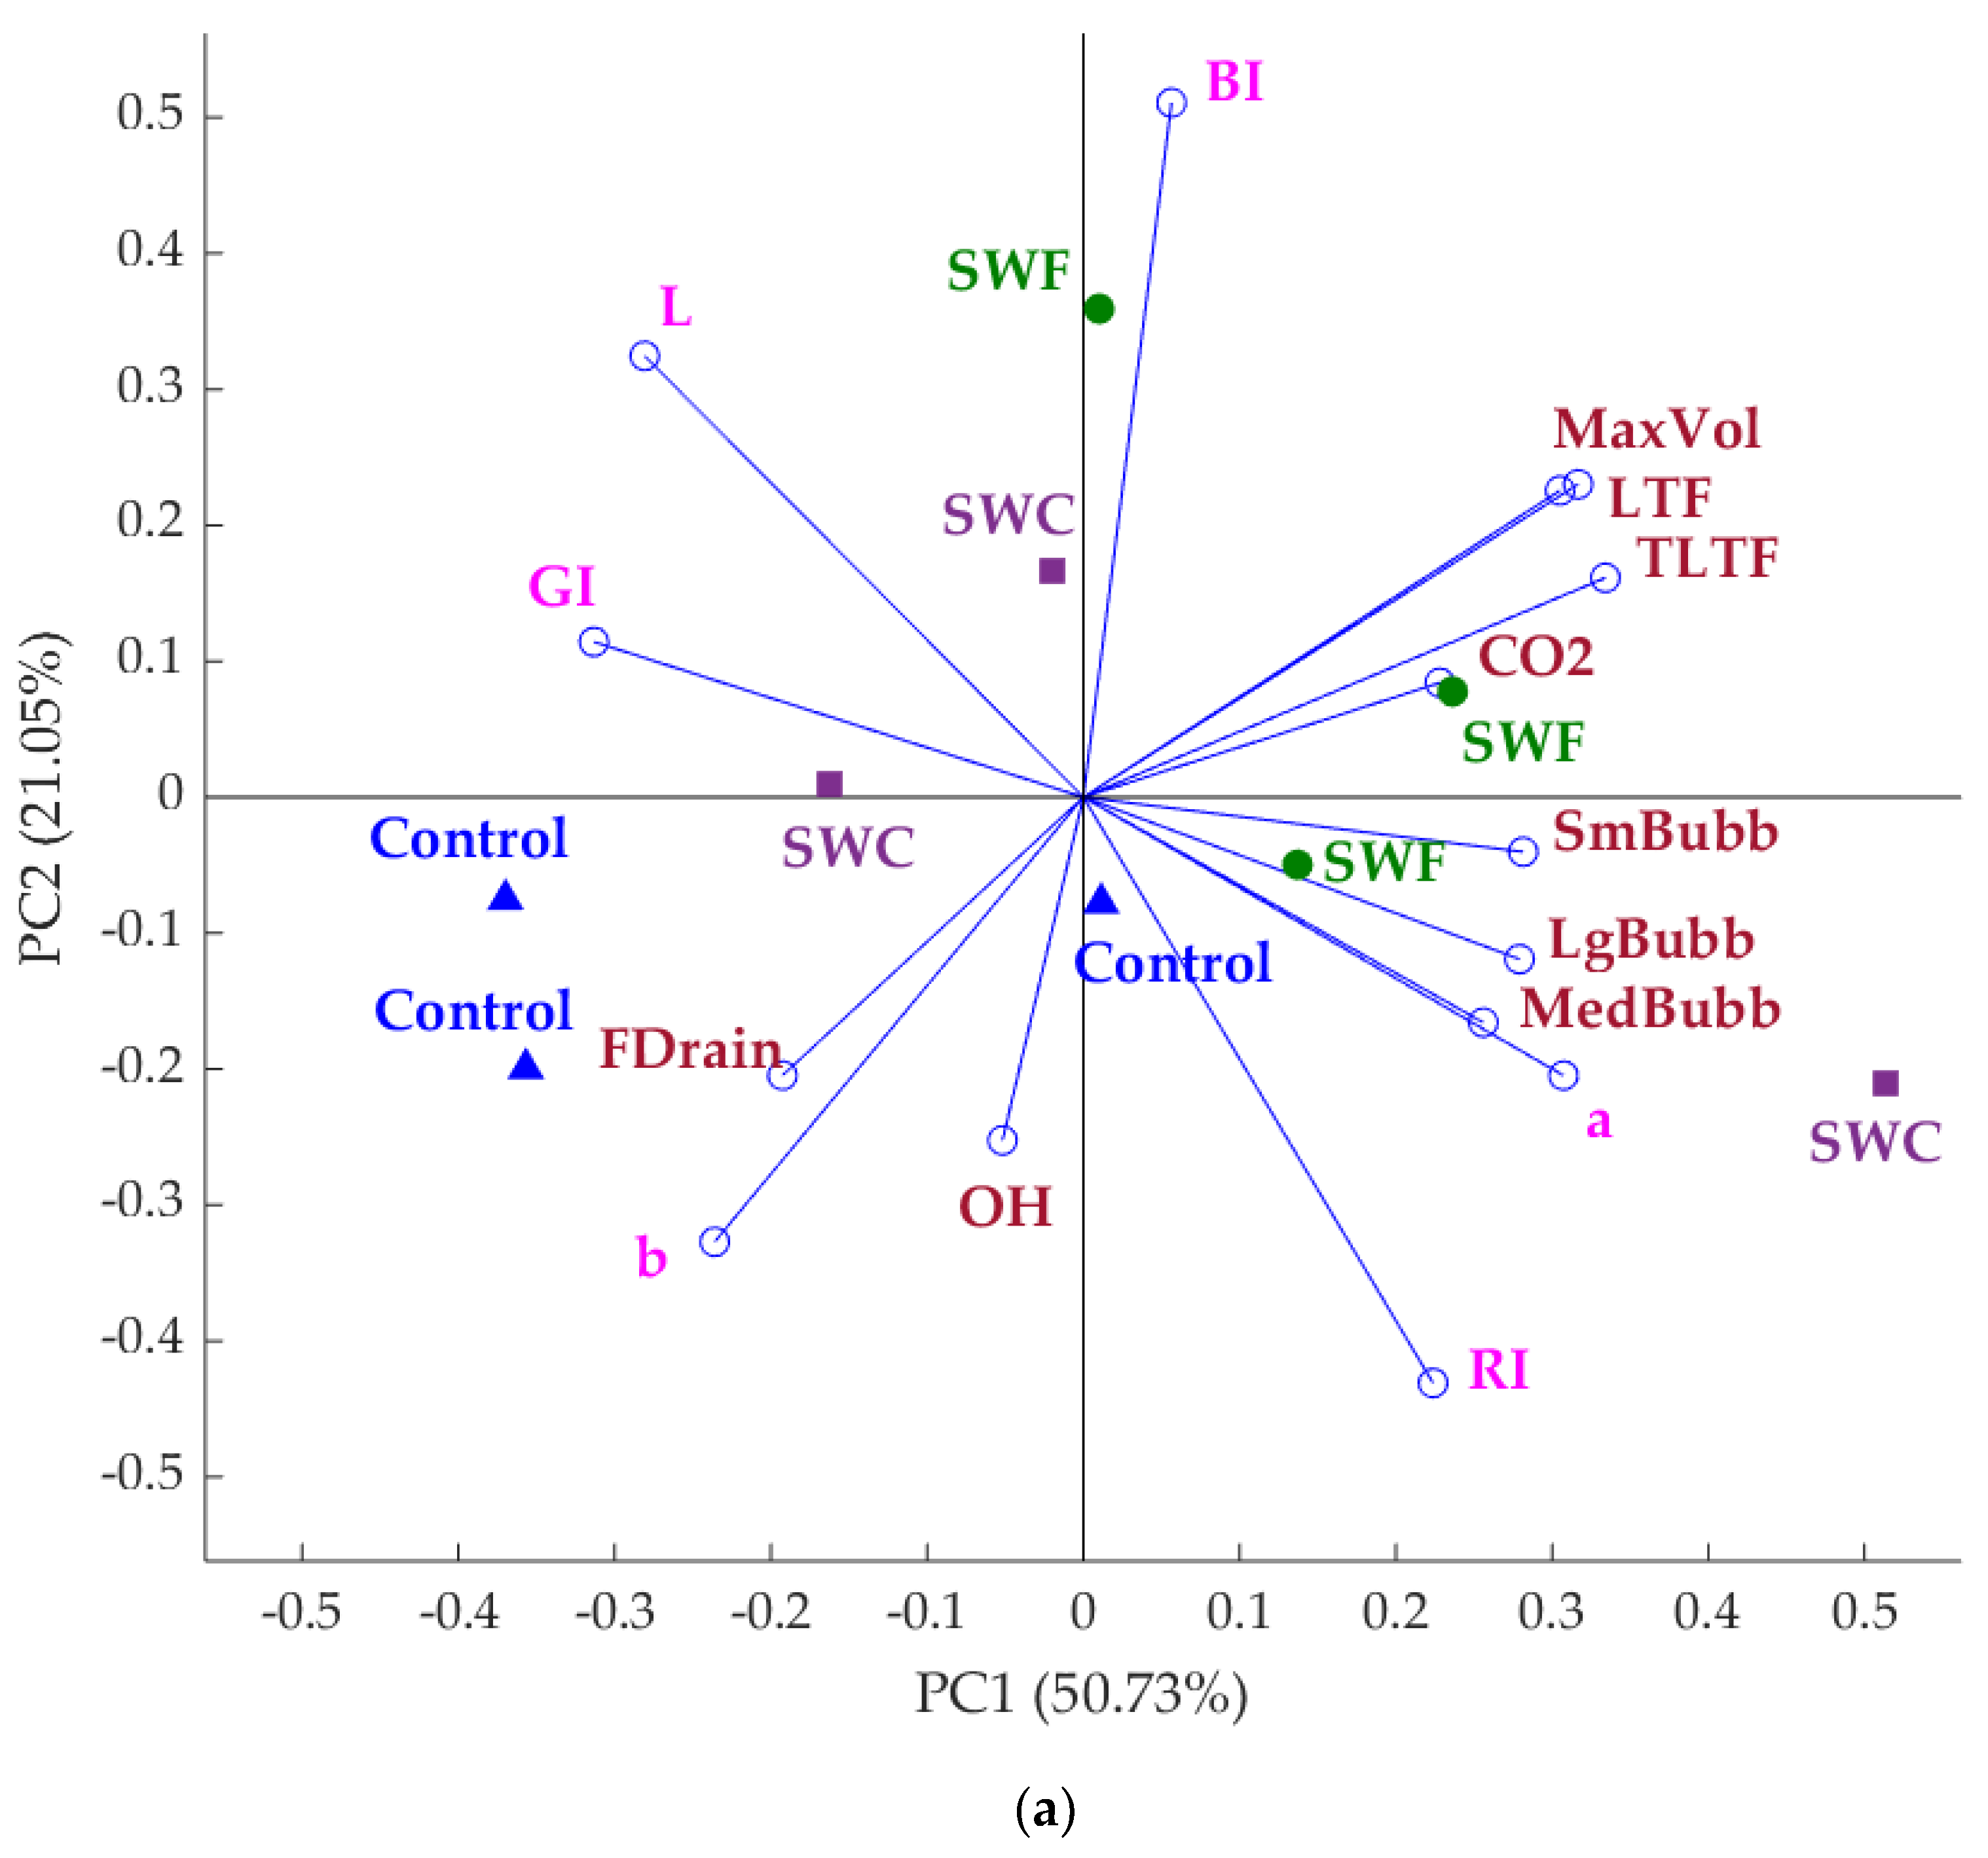
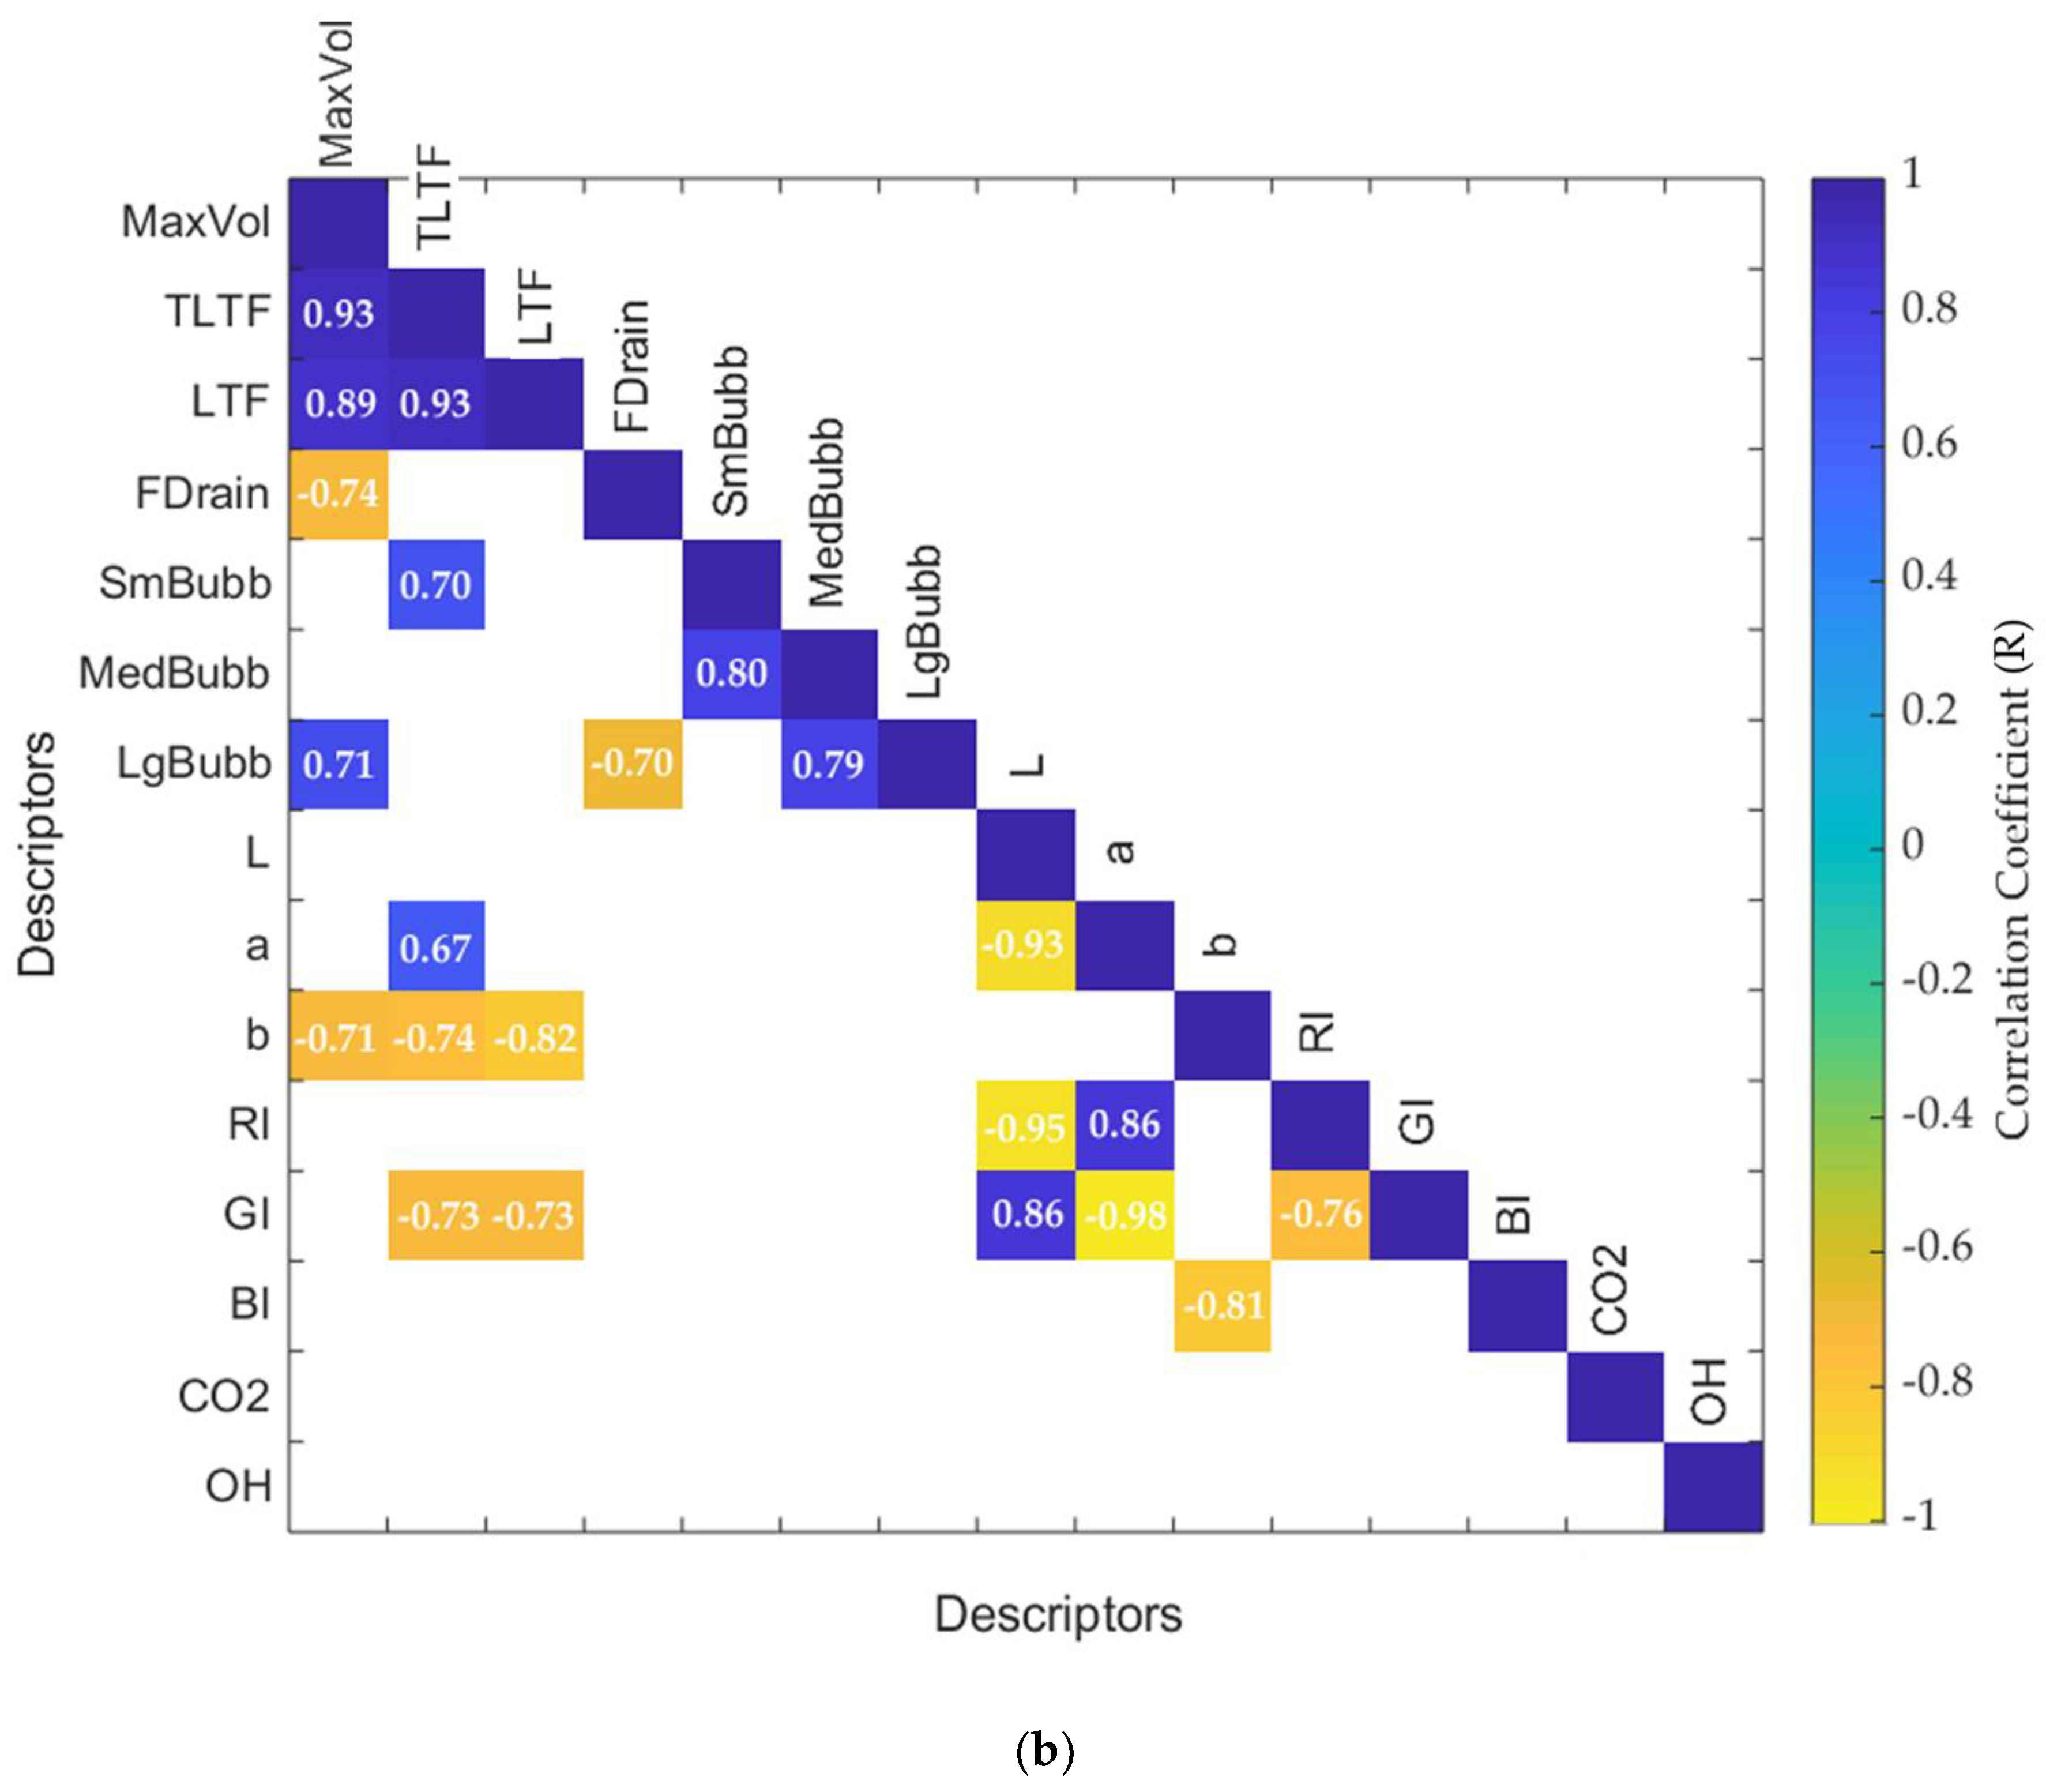
3.1. Color and Foam-Related Parameters

Figure 3a shows the principal components analysis (PCA) of the foam and color-related parameters and CO2 and alcohol gas release were obtained using the RoboBEER. It can be observed that the principal component one (PC1) represented 50.73% of data variability while principal component two (PC2) accounted for 21.05% with the PCA explaining a total of 71.78%. According to the factor loadings (Table S1), the PC1 was mainly represented by the TLTF, MaxVol, LTF, and color parameter a in the positive side and by GI and L on the negative side of the axis. On the other hand, the PC2 was primarily represented by BI and L on the positive side and by RI and a color parameter b on the negative side of the axis. It is shown that the control samples were more represented by the FDrain and green and yellow colors (GI and b) while two of the replicates of SWC had more GI, L, and BI. The third replicate was more characterized by small, medium, and large bubbles and a red color (a and RI). The SWF samples were more represented by the foam-related parameters such as MaxVol, LTF, TLTF, SmBubb, LgBubb, MedBubb, and CO2.
Figure 3b shows the CM in which MaxVol had positive and significant correlation with TLTF (R = 0.93), TLF (R = 0.89), LgBubb (0.71), and a negative correlation with FDrain (R = −0.74). Furthermore, TLTF had a positive correlation with SmBubb (R = 0.70). Yet, as expected, the red color from the RGB scale (RI) had a positive correlation with a red color (a) from the Lab scale (R = 0.86). Likewise, there was a negative correlation between the blue color (BI) from the RGB scale and b from the Lab scale (R = −0.81).
Table 2 shows the results of the ANOVA for the foam-related parameters measured with the RoboBEER. It can be observed that there were significant differences in the number of small bubbles in the foam with SWC being the highest and significantly different from the control. While there were no significant differences for the other foam-related parameters, the MaxVol had a p-value of 0.055, which is close to the significant value. According to the SD, the SWF treatment was the most consistent in MaxVol, TLTF, LTF, FDrain, and LgBubb since it had the lowest values compared to the control and SWC.
Table 3 shows the means and results from the ANOVA and LSD tests for the color parameters, alcohol, and CO2. There were no significant differences in most of the parameters except for the +b (yellow color) being the highest value and the blue color index (BI) with SWC being the highest in this parameter. There were also significant differences between the SWF, which had the highest value as well as significant differences between the control and SWC for the alcohol content in the liquid and viscosity (Visc).

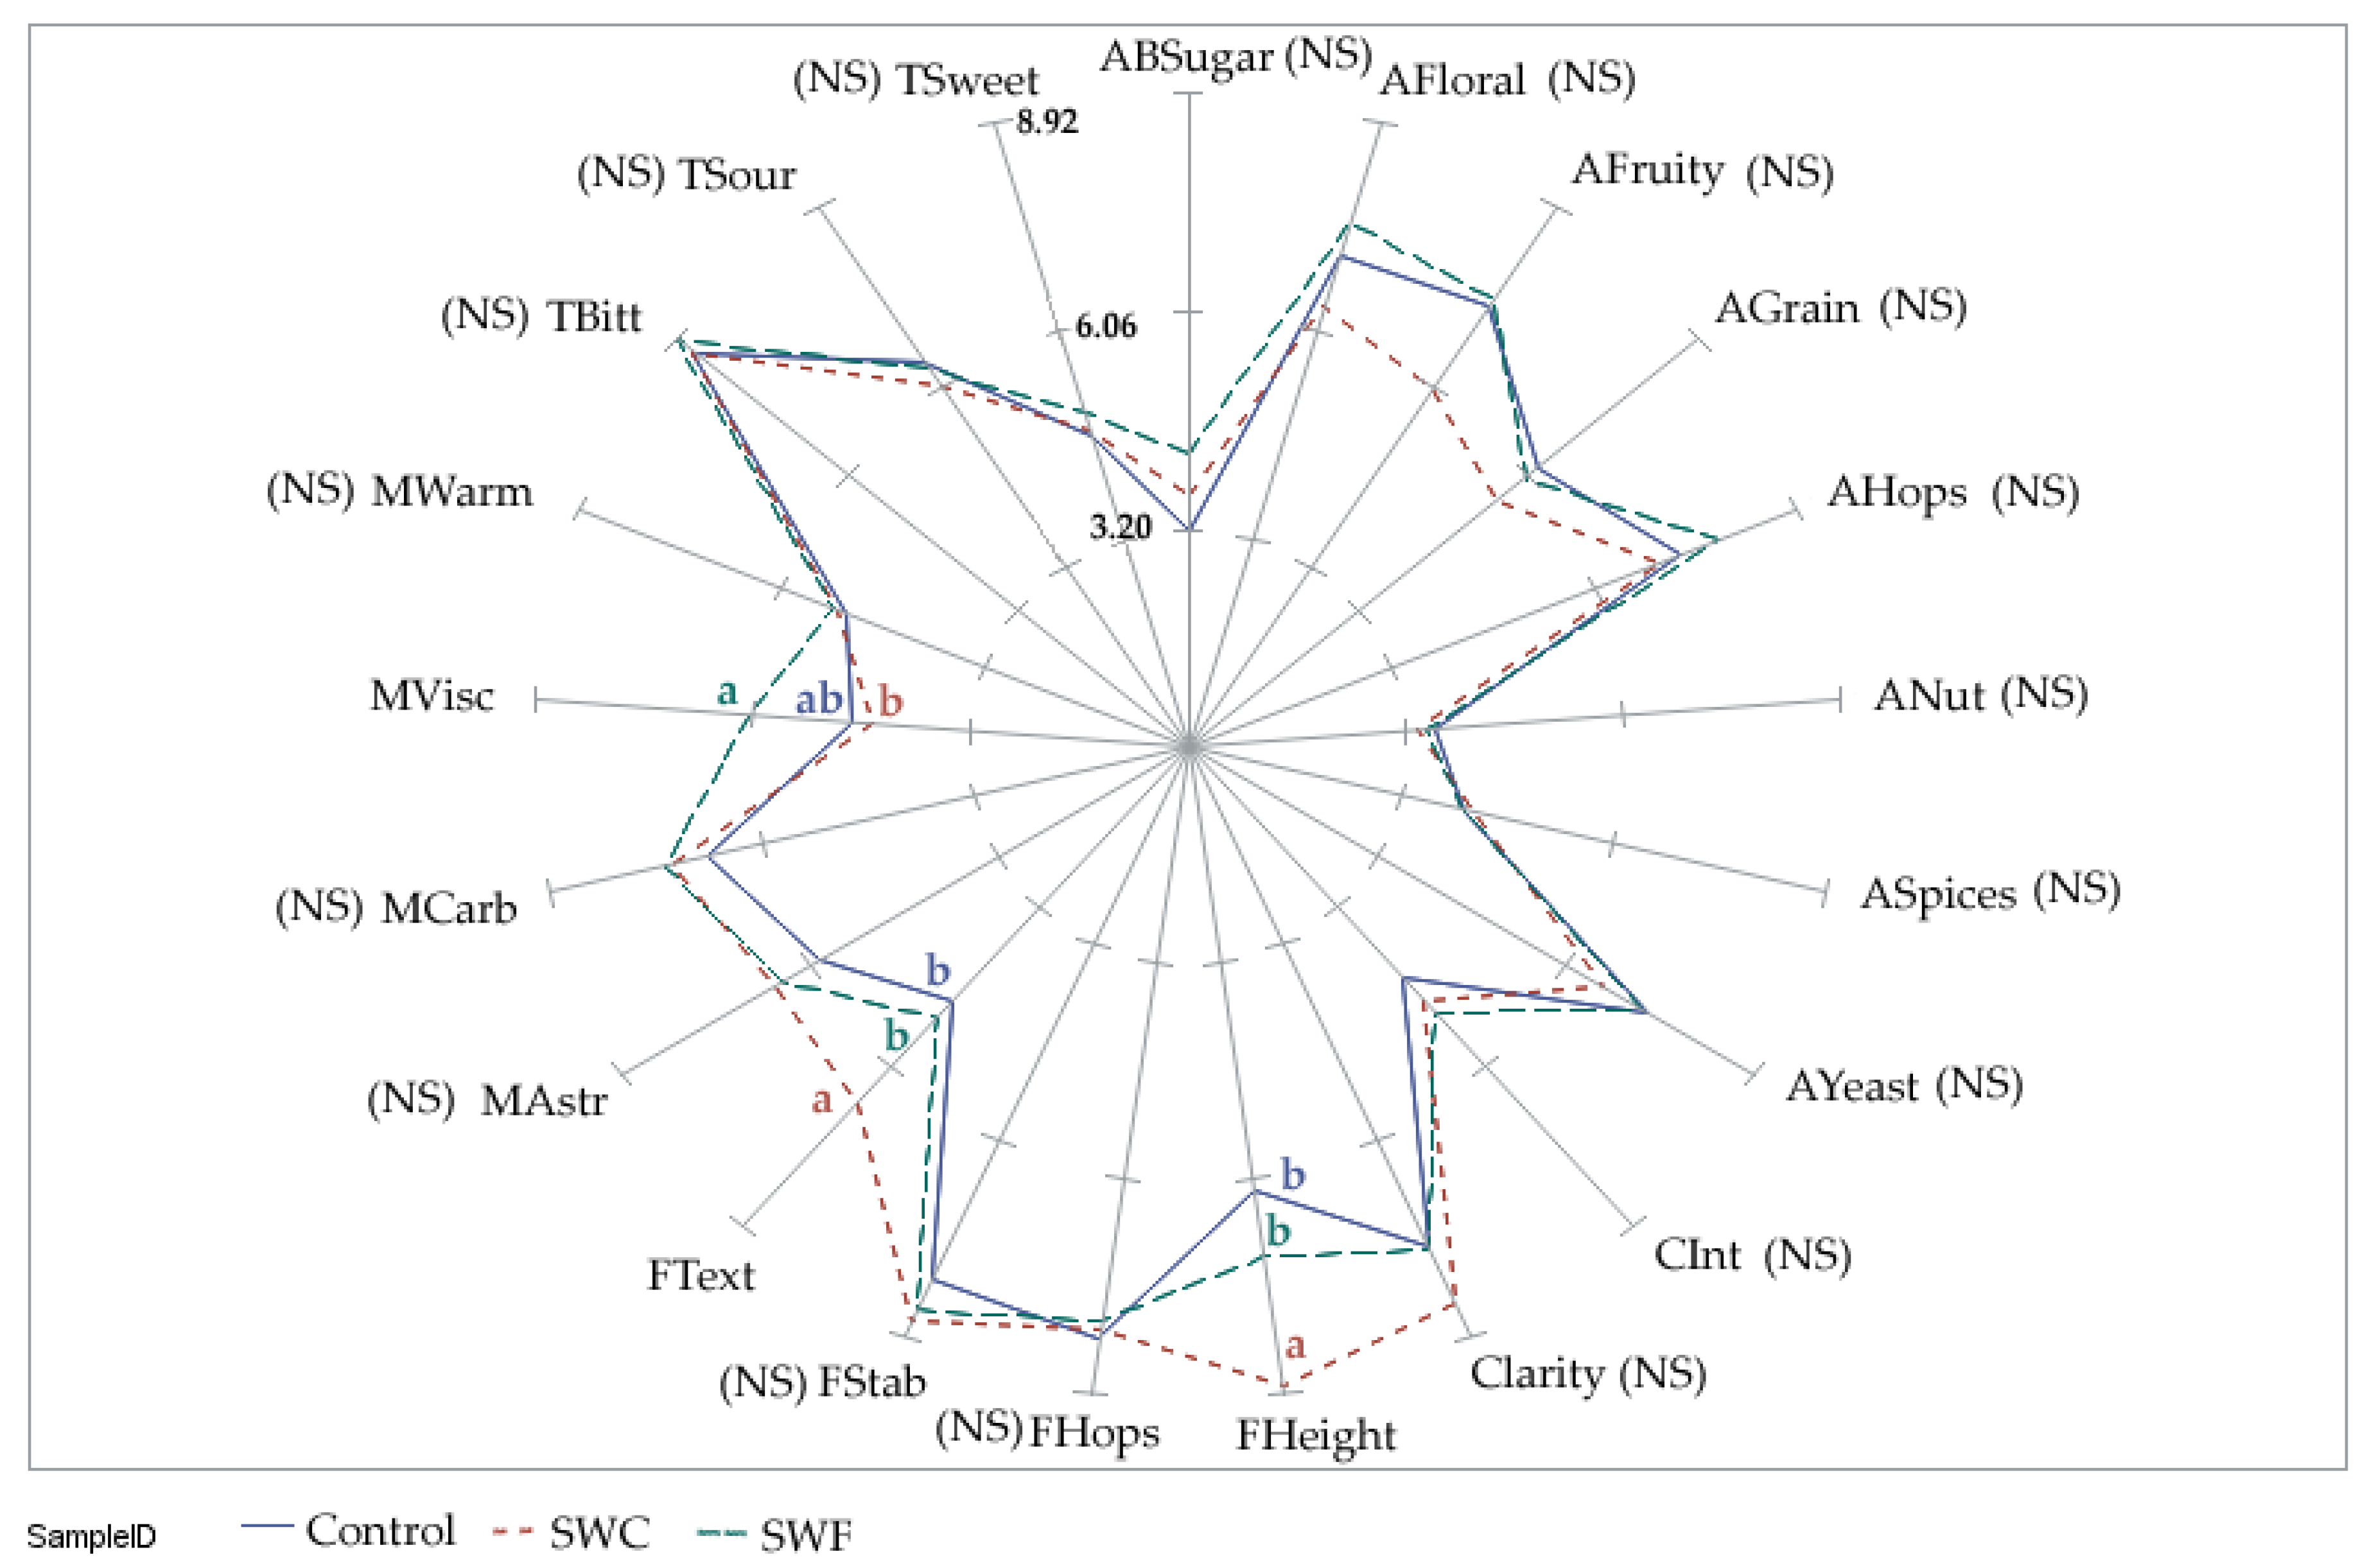
3.2. Descriptive Sensory Evaluation

Results from the descriptive sensory evaluation are found in Figure 4. It can be observed that there were non-significant differences in most of the sensory descriptors except for FHeight, FText, and MVisc. The sample rated as the highest in foam (FHeight) and foam texture (FText) was SWC, which is significantly different from and followed by SWF and control. Yet, SWF was the highest in viscosity (MVisc), which was similar to the control and with significant differences with SWC. Although there were no significant differences in AFruity, AFloral, and AGrain, the control and SWF had a higher rating than SWC. The three samples were rated high in bitter taste with ratings between 8.6 and 8.9 in a 15 cm intensity scale (Figure 4).

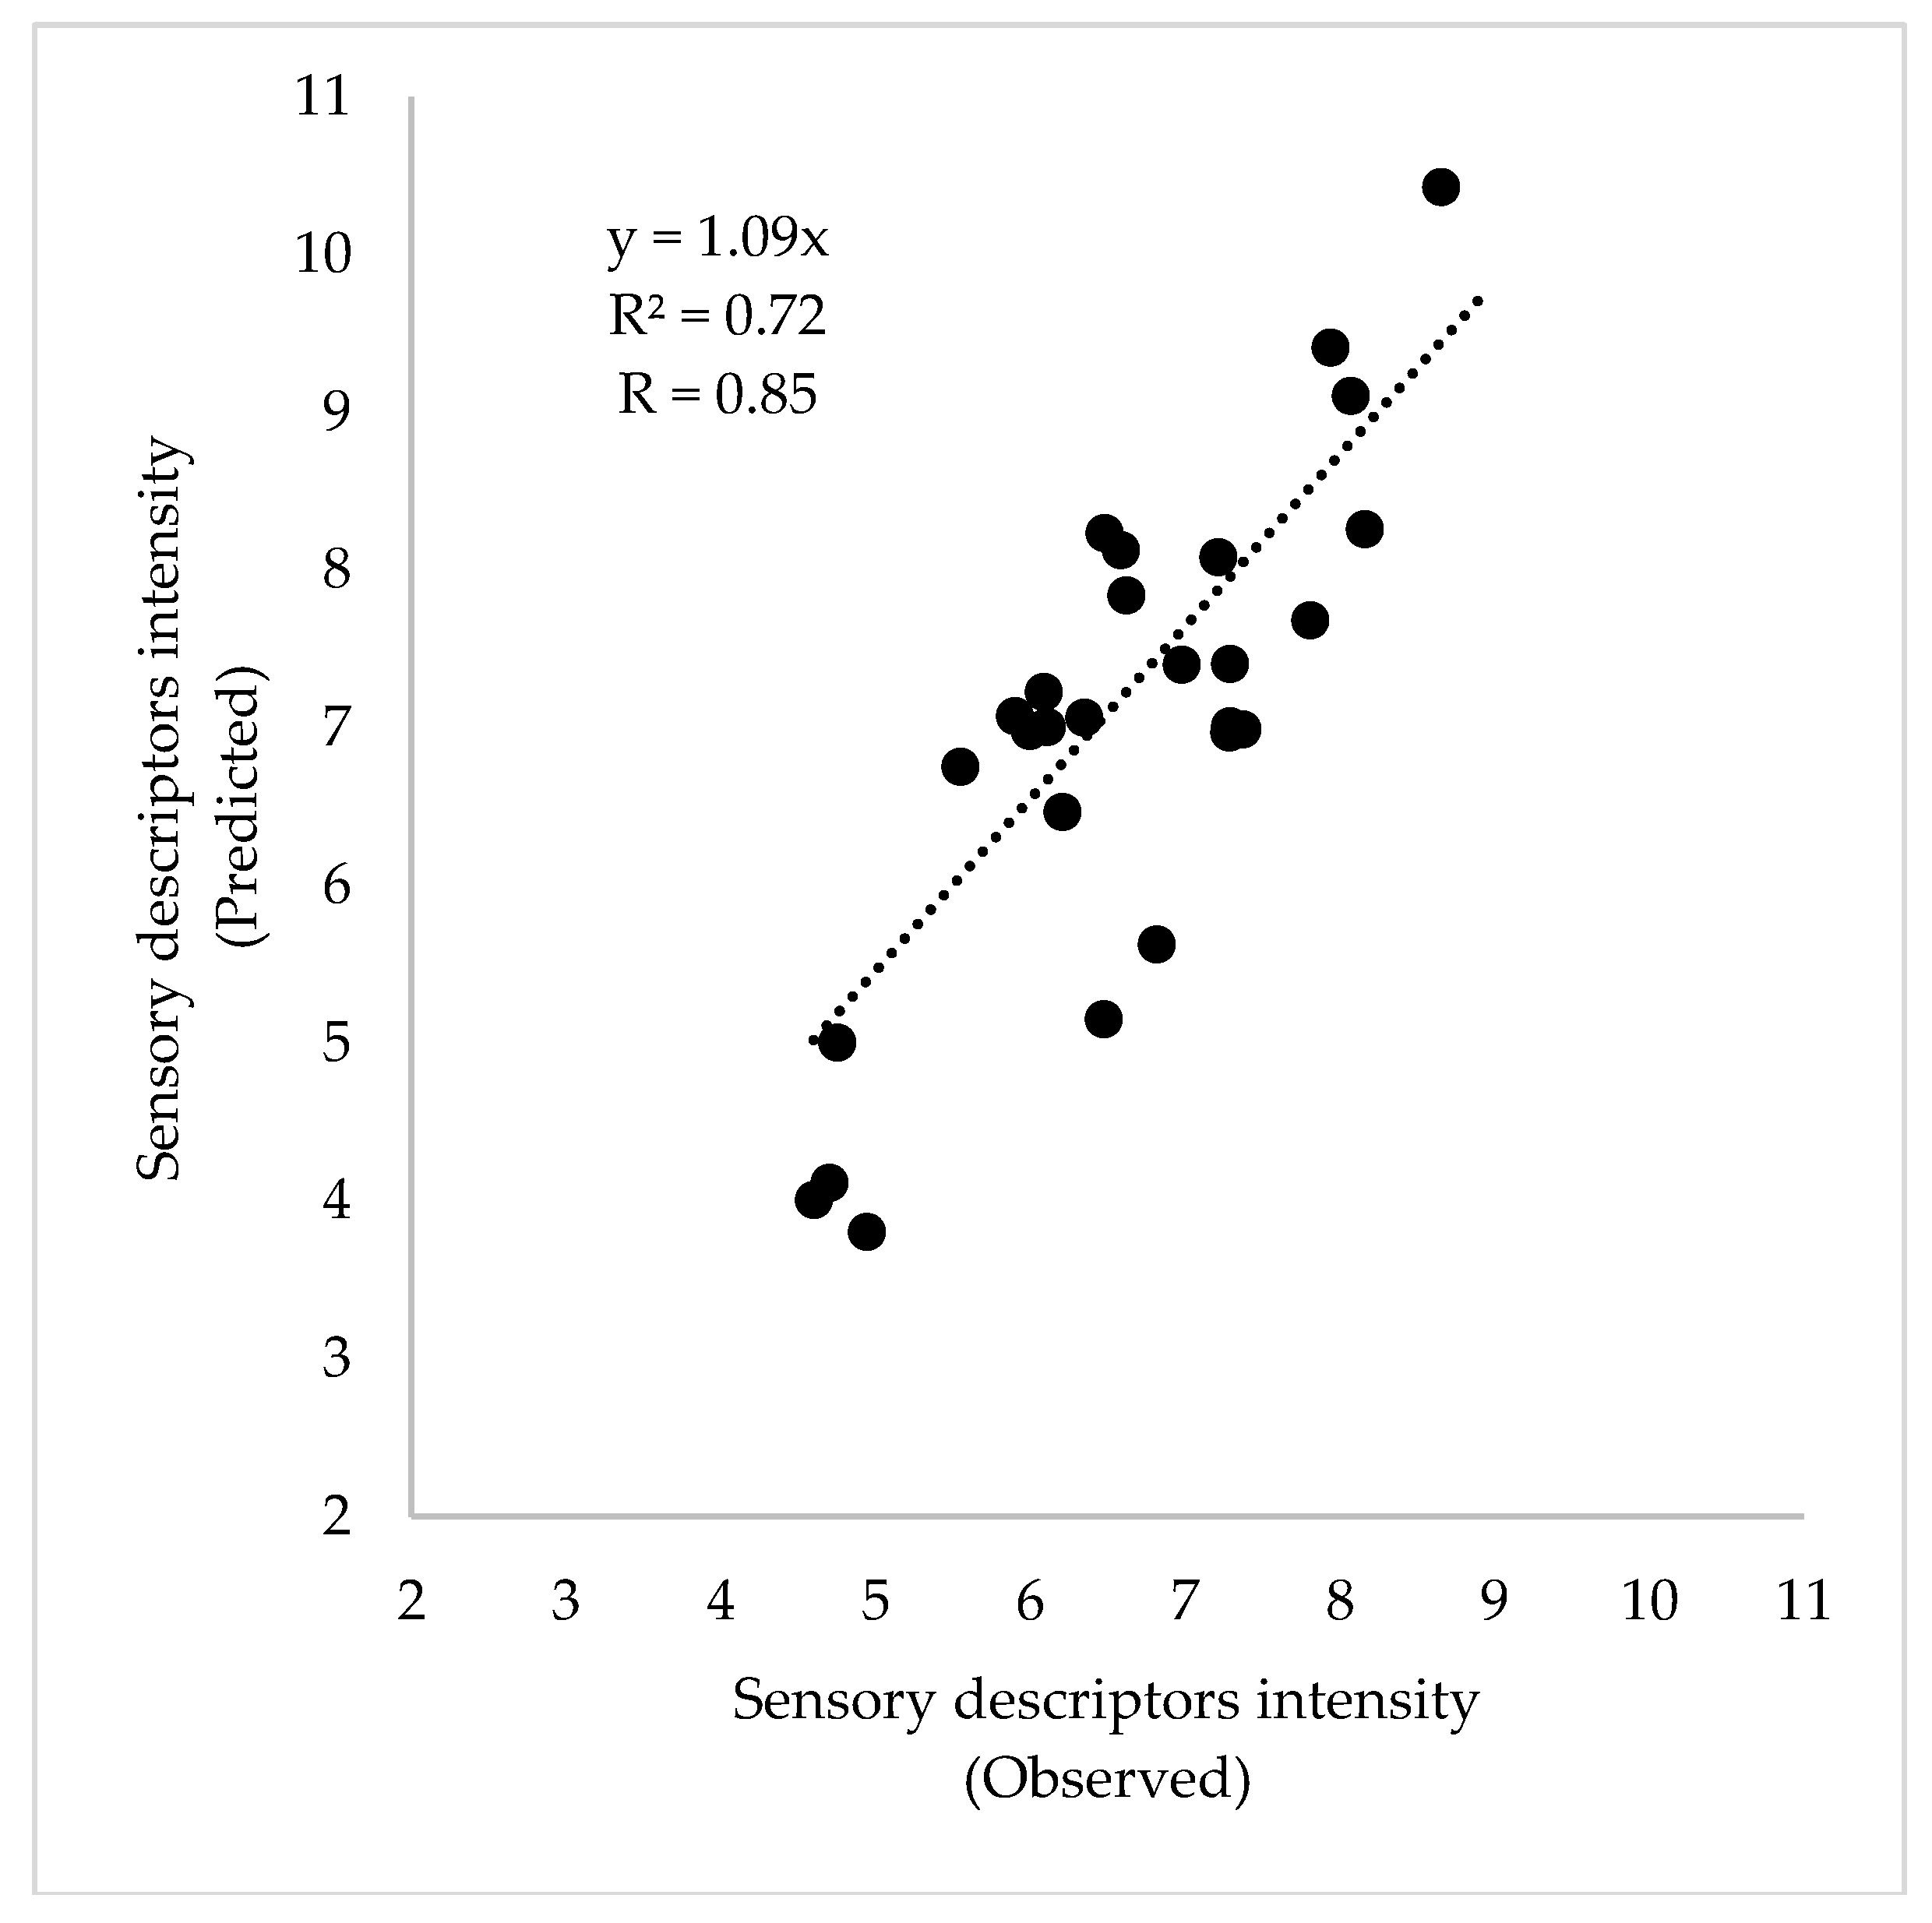
3.3. Validation of Machine Learning Models

The results from the 15 foam and color-related parameters obtained using the RoboBEER were fed as inputs in an ANN model developed using commercial beers, which had a 92% accuracy as shown by Gonzalez Viejo et al. [29] to predict the type of fermentation. The results obtained showed that the three samples were classified as top fermentation (Table 4), which is accurate since IPA beers are brewed using top fermenting yeast at an ambient temperature (~25 °C). However, the three treatments especially SWC presented a few characteristics from spontaneous fermentation beers.
Figure 5 shows the results from the validation of the second ANN model, which was also fed using the 15 foam and color-related parameters obtained using the RoboBEER to predict 10 of the sensory descriptors (AHops, AYeast, AGrain, MVisc, MAstr, MCarb, TBitt, TSweet, TSour, and FHops). The model used to predict the values had a correlation of R = 0.91 and a determination coefficient R2 = 0.83. It can be found from Gonzalez Viejo et al. [30]. For the samples developed in this study, the correlation between the observed values obtained with the trained sensory panel and the predicted values using the model was R = 0.85 with a determination coefficient R2 = 0.72 and a slope of 1.09.

4. Discussion

4.1. Color and Foam-Related Parameters

The negative correlation found between MaxVol and FDrain (Figure 3b) was expected since the FDrain is the excess of liquid drained by gravity from the wet foam to produce dry foam [34]. Therefore, the volume of foam decreases and the liquid volume increases [29]. In the PCA (Figure 3a), it was observed that there was a separation of the triplicates since one bottle of each had different characteristics. However, for the SWF, the separation of the triplicates in the PCA and the SD of the means (Table 2 and Table 3) for most of the parameters was lower than the other treatments. Therefore, this might be due to the soundwaves treatment applied during the fermentation process, which could make the sample more uniform. According to Choi et al. [24], there is an increase in yeast viability when applying ultrasound during the fermentation process and, therefore, an increase in alcohol content in the beer. A similar effect was found in the present study, but, using audible sound, higher and significantly different values were found between the SWF and the other treatments in alcohol content in the liquid. Although non-significant, the MaxVol, TLTF, LTF, and SmBubb tended to be higher for the SWC and SWF when compared to the control. Significant differences were found for viscosity with SWF being the different treatment with the highest value followed by SWC. The viscosity of beer, which is mainly defined by the amount of surfactant substances such as proteins and carbohydrates, is directly linked with foam stability [35,36]. According to previous research, an ultrasound has been used for de-foaming since it causes the foam to collapse as the ultra-high frequencies provoke the coalescence of the bubbles, which causes bubbles breakage [37]. Another effect of ultrasound is to increase bubble size until it implodes (cavitation) [25]. Therefore, according to the findings in the present study, the effects of audible sound in foam and bubbles are opposite to those found using ultrasound.
In beer, color is defined due to the Maillard reaction that occurs when malted barley is exposed to high temperatures during the kilning process [38]. The yellow color is produced by melanoidins before turning brown. However, a yellow color is maintained when the kilning process is mild. During fermentation, the pH drops and produces a lighter color [35]. Results showed the control had a slightly lighter color (L) and was significantly higher in yellow color (b) than SWF and SWC. However, although non-significant, pH tended to be lower for the control (Table 3). Further studies are needed to assess the cause of the difference in yellow color when applying audible sound to beer processing.

4.2. Descriptive Sensory Evaluation

The trained sensory panel was able to perceive significant differences in FHeight between the three treatments (Figure 4). Similar to the data obtained using the RoboBEER for MaxVol, SWC was rated as the highest in foam height followed by SWF and control. Significant differences were also found for FText, which had SWC rated as the highest and the control as the lowest. The significant differences found using the trained panel in MVisc coincide with those found using the viscometer with SWF rated as the highest in viscosity. This shows that the panel had an appropriate training since they were able to detect differences similar to the more objective measurements. There were no significant differences found in any of the tastes, aromas, and flavors, which was desired since it shows that there was no modification in the sensory profile that could be indicative that there was no breakage of yeast cells with the use of audible sound. Authors such as Martin et al. [39] have found a high yeast cell disruption when applying ultrasound to wine. Therefore, although further research using different types of beer is needed, results from this study showed that using lower frequencies (20–75 Hz) have an effect in foam and bubbles without disturbing the yeast cells, which is a potential treatment that might be applied to beer processing to improve beer quality.

4.3. Validation and Testing of Machine Learning Models

The slightly lower value obtained for SWC from top fermentation and slightly higher value for spontaneous fermentation are mainly due to the higher foam volume and stability, which are two of the main characteristics from spontaneous fermentation beers. However, despite this, the three treatments were classified as top fermentation with a very high accuracy (~99%). This shows that the use of audible sound in beer processing either during fermentation or carbonation stages, even though it improves the beer foamability and bubble size distribution, does not drastically change the nature of the style of beer. Yet, the results obtained from the validation of the ANN model to predict the intensity of sensory descriptors showed that the use of the RoboBEER along with machine learning modeling are potential tools to assess beer quality at the end of the production process to sample every single batch as well as for new products or processing techniques testing in a more objective, effective, and rapid manner when compared to traditional methods.

5. Conclusions

The use of audible sound is a potential treatment to implement in beer processing during the fermentation or carbonation stages to improve the products’ quality by increasing the number of small bubbles and increasing foamability and foam stability without modifying the aroma and flavor profile of the specific beer style. However, further research is required to assess the effects of the application of audible sound during both the fermentation and carbonation stages and to find the possible causes for the significant differences in the color. Furthermore, in further research, it would be important to assess the microbiological aspects to analyze yeast viability. The use of the robotic pourer, RoboBEER, the computing vision algorithms and machine learning algorithms are accurate, objective, affordable, and rapid. Tools are used to assess the beer quality in terms of its physical and sensory descriptors for all existing products, new products, and processing techniques.

Supplementary Materials

The following are available online at https://www.mdpi.com/2306-5710/4/3/53/s1, Table S1: Factor loadings of each descriptor in the principal components analysis for the principal components one and two (PC1 and PC2).

Author Contributions

C.G.V. and S.F. contributed equally in the experiment design, data analysis, and paper writing. M.H.L., Y.Q.H., and S.C. contributed in the experiment layout, beer making, and data acquisition. D.T. and F.R.D. contributed to the experiment design and paper writing.

Funding

This research received no external funding.

Acknowledgments

We gratefully acknowledge the support of NVIDIA Corporation with the donation of the Titan Xp GPU used for this research. This research was supported by the Australian Government through the Australian Research Council [Grant number IH120100053] ‘Unlocking the Food Value Chain: Australian industry transformation for ASEAN markets.’

Conflicts of Interest

The authors declare no conflict of interest.

References

  1. Cromer, A.H.; Vázquez, J.C. Física Para Las Ciencias de la Vida; Reverté: Barcelona, Spain, 1981. [Google Scholar]
  2. Serrano Vida, M.; Gil Corral, J. Musica. Volumen III. Profesores de Educacion Secundaria. Temario Para la Preparacion de Oposiciones; Ebook; MAD-Eduforma: Sevilla, Spain, 2003. [Google Scholar]
  3. Figura, L.O.; Teixeira, A.A. Acoustical properties. In Food Physics: Physical Properties—Measurement and Applications; Springer: Berlin, Germany, 2007. [Google Scholar]
  4. Glasscock, M.E.; Gulya, A.J.; Shambaugh, G.E. Glasscock-Shambaugh Surgery of the Ear; BC Decker: Hamilton, ON, Canada, 2003. [Google Scholar]
  5. Vining, W.; Day, R.; Botch, B. General Chemistry: Atoms First; Cengage Learning: Boston, MA, USA, 2017. [Google Scholar]
  6. Hassani, S.N.; Bard, R.L. Real Time Opthalmic Ultrasonography; Springer: New York, NY, USA, 2012. [Google Scholar]
  7. Malik, H.K.; Singh, A.K. Engineering Physics; Tata McGraw Hill Education Private Ltd.: New Delhi, India, 2010. [Google Scholar]
  8. Ferrer, J.F.; Carrera, M.P. Iniciación a la Física; Reverté: Barcelona, Spain, 1981. [Google Scholar]
  9. Hassanien, R.H.; Hou, T.-Z.; Li, Y.-F.; Li, B.-M. Advances in effects of sound waves on plants. J. Integr. Agric. 2014, 13, 335–348. [Google Scholar] [CrossRef]
  10. Czekaj, P.; López, F.; Güell, C. Membrane fouling by turbidity constituents of beer and wine: Characterization and prevention by means of infrasonic pulsing. J. Food Eng. 2001, 49, 25–36. [Google Scholar] [CrossRef]
  11. Ying, J.C.L.; Dayou, J.; Phin, C.K. Experimental investigation on the effects of audible sound to the growth of Escherichia coli. Mod. Appl. Sci. 2009, 3. [Google Scholar] [CrossRef]
  12. Jasmine, K.R.; Manohar Das, S.S. Studies on the changes induced by audible sound waves in the total body protein profile of corcyra cephalonica (stainton). J. Scott Res. Forum 2008, 2–4, 32–39. [Google Scholar]
  13. Aggio, R.B.M.; Obolonkin, V.; Villas-Bôas, S.G. Sonic vibration affects the metabolism of yeast cells growing in liquid culture: A metabolomic study. Metabolomics 2012, 8, 670–678. [Google Scholar] [CrossRef]
  14. Morales-de la Peña, M.; Welti-Chanes, J.; Martín-Belloso, O. Application of novel processing methods for greater retention of functional compounds in fruit-based beverages. Beverages 2016, 2, 14. [Google Scholar] [CrossRef]
  15. Abdullah, N.; Chin, N.L. Application of thermosonication treatment in processing and production of high quality and safe-to-drink fruit juices. Agric. Agric. Sci. Procedia 2014, 2, 320–327. [Google Scholar] [CrossRef]
  16. de Sousa, D.P. Application of Ultrasounds for Transformation Processes of Agroalimentary Products; Université d’Avignon: Avignon, France, 2012. [Google Scholar]
  17. Viejo, C.G.; Fuentes, S.; Howell, K.; Torrico, D.; Dunshea, F.R. Robotics and computer vision techniques combined with non-invasive consumer biometrics to assess quality traits from beer foamability using machine learning: A potential for artificial intelligence applications. Food Control 2018, 92, 72–79. [Google Scholar] [CrossRef]
  18. Viejo, C.G.; Fuentes, S.; Howell, K.; Torrico, D.D.; Dunshea, F.R. Integration of non-invasive biometrics with sensory analysis techniques to assess acceptability of beer by consumers. Physiol. Behav. 2018. [Google Scholar] [CrossRef]
  19. Bamforth, C. Perceptions of beer foam. J. Inst. Brew. 2000, 106, 229–238. [Google Scholar] [CrossRef]
  20. Donadini, G.; Fumi, M.D.; Faveri, M. How foam appearance influences the Italian consumer’s beer perception and preference. J. Inst. Brew. 2011, 117, 523–533. [Google Scholar] [CrossRef]
  21. Smythe, J.E.; Bamforth, C.W. The path analysis method of eliminating preferred stimuli (PAMEPS) as a means to determine foam preferences for lagers in European judges based upon image assessment. Food Qual. Preference 2003, 14, 567–572. [Google Scholar] [CrossRef]
  22. Becker, T.; Mitzscherling, M.; Delgado, A. Ultrasonic velocity—A noninvasive method for the determination of density during beer fermentation. Eng. Life Sci. 2001, 1, 61–67. [Google Scholar] [CrossRef]
  23. Hoggan, J. Ultrasonic hop extraction. Ultrasonics 1968, 6, 217–219. [Google Scholar] [CrossRef]
  24. Choi, E.J.; Ahn, H.; Kim, M.; Han, H.; Kim, W.J. Effect of ultrasonication on fermentation kinetics of beer using six-row barley cultivated in Korea. J. Inst. Brew. 2015, 121, 510–517. [Google Scholar] [CrossRef] [Green Version]
  25. Flint, E.B.; Suslick, K.S. The Temperature of cavitation. Science 1991, 253, 1397–1399. [Google Scholar] [CrossRef] [PubMed]
  26. Galuszka, J. Universities Receive $1 Million to Study Impact of Sound on Fermenting Beer. Available online: https://www.stuff.co.nz/national/education/97068212/universities-receive-1-million-to-study-impact-of-sound-on-fermenting-beer (accessed on 26 June 2018).
  27. Fowle, Z. Good Vibrations: Brewers Use Music to Ferment Their Beers. Available online: http://draftmag.com/brewers-ferment-beer-with-music/ (accessed on 26 June 2018).
  28. Boxall, A. Does Music Affect the Taste of Beer? Try B&O Play’s Beobrew to Find Out. Available online: https://www.digitaltrends.com/home-theater/beoplay-beobrew-music-infused-beer-news/ (accessed on 4 July 2018).
  29. Gonzalez Viejo, C.; Fuentes, S.; Li, G.; Collmann, R.; Condé, B.; Torrico, D. Development of a robotic pourer constructed with ubiquitous materials, open hardware and sensors to assess beer foam quality using computer vision and pattern recognition algorithms: RoboBEER. Food Res. Int. 2016, 89, 504–513. [Google Scholar] [CrossRef] [PubMed]
  30. Gonzalez Viejo, C.; Fuentes, S.; Torrico, D.D.; Howell, K.; Dunshea, F.R. Assessment of beer quality based on a robotic pourer, computer vision, and machine learning algorithms using commercial beers. J. Food Sci. 2018, 83, 1381–1388. [Google Scholar] [CrossRef] [PubMed]
  31. Wu, H.-Y.; Rubinstein, M.; Shih, E.; Guttag, J.; Durand, F.; Freeman, W. Eulerian video magnification for revealing subtle changes in the world. Video Magnif. 2012. [Google Scholar] [CrossRef]
  32. Torrico, D.D.; Fuentes, S.; Gonzalez Viejo, C.; Ashman, H.; Gunaratne, N.M.; Gunaratne, T.M.; Dunshea, F.R. Images and chocolate stimuli affect physiological and affective responses of consumers: A cross-cultural study. Food Qual. Preference 2018, 65, 60–71. [Google Scholar] [CrossRef]
  33. Torrico, D.D.; Fuentes, S.; Viejo, C.G.; Ashman, H.; Gurr, P.A.; Dunshea, F.R. Analysis of thermochromic label elements and colour transitions using sensory acceptability and eye tracking techniques. LWT Food Sci. Technol. 2018, 89, 475–481. [Google Scholar] [CrossRef]
  34. Bamforth, C.; Russell, I.; Stewart, G. Beer: A Quality Perspective; Elsevier Science: Cambridge, MA, USA, 2011. [Google Scholar]
  35. Badui Dergal, S.; Cejudo Gómez, H.R.T. Química de los Alimentos; Pearson Educación: Naucalpan de Juárez, Estado de Mexico, Mexico, 2006. [Google Scholar]
  36. Delcour, J.A.; Hoseney, R.C. Principles of Cereal Science and Technology; AACC International: St. Paul, MN, USA, 2010. [Google Scholar]
  37. Gallego-Juárez, J.; Rodríguez, G.; Riera, E.; Cardoni, A. Ultrasonic defoaming and debubbling in food processing and other applications. In Power Ultrasonics; Elsevier: New York, NY, USA, 2015; pp. 793–814. [Google Scholar] [CrossRef]
  38. Piggott, J. Alcoholic Beverages: Sensory Evaluation and Consumer Research; Elsevier: Philadelphia, PA, USA, 2011. [Google Scholar]
  39. Martín, J.F.G.; Guillemet, L.; Feng, C.; Sun, D.-W. Cell viability and proteins release during ultrasound-assisted yeast lysis of light lees in model wine. Food Chem. 2013, 141, 934–939. [Google Scholar] [CrossRef] [PubMed]
Figure 1. Diagram representing the brewing process and soundwave treatments applied to the different beer samples such as Control, SWF = soundwaves application at fermentation, and SWC = soundwaves applied in the carbonation process. Where (1) brewing process, (2) fermentation, and (3) bottling and natural carbonation.
Beverages 04 00053 g001
Figure 2. Diagram representing the setup of the testing of different audible sound frequencies to select the most appropriate ones for the treatments.
Beverages 04 00053 g002
Figure 3. Results from multivariate data analysis showing: (a) principal component analysis where the x-axis represents the principal component one (PC1) and y-axis represents the principal component two (PC2), samples in blue and triangles represent the control, those in green, and circles the treatment of soundwaves during fermentation (SWF) and the purple squares the soundwaves during carbonation (SWC), and (b) the correlation matrix shows only the significant correlations (p < 0.05) where the color bar depicts the positive (blue) and negative (yellow) correlations between the different descriptors. The values inside the boxes are the correlation coefficients (R). Abbreviations: MaxVol = maximum volume of foam, TLTF = total lifetime of foam, LTF = lifetime of foam, FDrain = foam drainage, L, a, b = color in CIELab scale, RI, GI, and BI indices of color in the RGB scale. SmBubb = small bubbles. MedBubb = medium bubbles. LgBubb = large bubbles. OH = alcohol gas and CO2 = carbon dioxide release.
Beverages 04 00053 g003aBeverages 04 00053 g003b
Figure 4. Spider chart showing the significant differences found for the intensity of sensory descriptors using the least significant difference (LSD) post-hoc test where NS represents non-significant differences and different letters depict significant differences. The numbers in the chart represent the mean values at that position of the scale. SWC = application of soundwaves during carbonation, and SWF = application of soundwaves during fermentation. Abbreviations of the descriptors can be found in Table 1.
Beverages 04 00053 g004
Figure 5. Correlation of the observed values (x-axis) of 10 sensory descriptors (AHops, AYeast, AGrain, MVisc, MAstr, MCarb, TBitt, TSweet, TSour, and FHops) obtained using the trained sensory panel and the predicted values (y-axis) using an artificial neural network model developed using the color and foam-related parameters.
Beverages 04 00053 g005
Table 1. Descriptors, abbreviation, and anchors used for the sensory descriptive test.
DescriptorAbbreviationAnchors
Foam StabilityFStabShort time–Long time
Foam HeightFHeightShort–High
Foam Texture (Bubble size)FTextSmall–Large
Color IntensityCIntLight–Dark
ClarityClarityHaze–Clear
Aroma–HopsAHopsAbsent–Intense
Aroma–SpicesASpicesAbsent–Intense
Aroma–FloralAFloralAbsent–Intense
Aroma–FruityAFruityAbsent–Intense
Aroma–Brown SugarABSugarAbsent–Intense
Aroma–YeastAYeastAbsent–Intense
Aroma–NutsANutAbsent–Intense
Aroma–GrainsAGrainAbsent–Intense
ViscosityMViscThin–Thick
AstringencyMAstrAbsent–Intense
Carbonation MouthfeelMCarbAbsent–Intense
Warming MouthfeelMWarmAbsent–Intense
Taste–BitterTBittAbsent–Intense
Taste–SweetTSweetAbsent–Intense
Taste–SourTSourAbsent–Intense
Flavor–HopsFHopsAbsent–Intense
Table 2. Means and standard deviation (SD) of the three treatments for the foam-related parameters.
TreatmentMaxVol (mL)TLTF(s)LTF (mL s−1)FDrain (mL s−1)SmBubb (number)MedBubb (number)LgBubb (number)
Control25.7 a ± 14.01647.6 a ± 1288.5594.9 a ± 537.742.4 a ± 16.4597.2 b ± 390.08.3 a ± 9.94.0 a ± 4.3
SWC43.9 a ± 12.93243.7 a ± 1468.01552.3 a ± 1222.336.2 a ± 9.22519.5 a ± 1651.528.2 a ± 49.95.7 a ± 4.9
SWF39.2 a ± 9.43005.5 a ± 1139.41100.7 a ± 482.834.4 a ± 3.11400.0 ab ± 1030.27.8 a ± 11.34.5 a ± 3.3
Abbreviations: MaxVol = maximum volume of foam, TLTF = total lifetime of foam, LTF = lifetime of foam, FDrain = foam drainage, SmBubb = small bubbles, MedBubb = medium bubbles, LgBubb = large bubbles, SWC = application of soundwaves during carbonation, and SWF = application of soundwaves during fermentation. a – b: Different letters depict significant differences using the least significant difference (LSD) post-hoc test.
Table 3. Means and standard deviation (SD) of the three treatments for the color and analytical measurements.
Treatment* L* a* b* RI* GI* BI* OHCO2 (ppm)Alcohol (%)* pHVisc (cP)
Control74.7 a ± 1.6−3.9 a ± 1.468.6 a ± 1.20.6 a ± 0.00.4 a ± 0.00.02 b ± 0.0287.0 a ± 16.612,055.6 a ± 10514.75.3 b ± 0.24.25 a ± 0.0311.2 b ± 1.0
SWC73.8 a ± 2.9−2.0 a ± 1.963.2 b ± 2.50.6 a ± 0.00.4 a ± 0.00.04 a ± 0.01286.8 a ± 43.616,020.5 a ± 13469.65.2 b ± 0.34.26 a ± 0.0311.5 b ± 0.7
SWF73.6 a ± 3.8−2.5 a ± 2.865.5 b ± 2.80.6 a ± 0.00.4 a ± 0.00.03 ab ± 0.01288.3 a ± 37.116,853.2 a ± 11429.45.6 a ± 0.14.28 a ± 0.0212.7 a ± 0.6
* Unitless parameters. Abbreviations: L, a, b = color in CIELab scale, RI, GI, BI indices of color in RGB scale, OH = alcohol gas and CO2 = carbon dioxide release, Visc = viscosity, SWC = application of soundwaves during carbonation, and SWF = application of soundwaves during fermentation. a – b: Different letters depict significant differences using the least significant difference (LSD) post-hoc test.
Table 4. Results from the classification of the type of fermentation using an artificial neural network model was developed using the color and foam-related parameters.
TreatmentTopBottomSpontaneous
Control0.9960.0000.004
SWF0.9970.0000.003
SWC0.9940.0000.006
Abbreviations: SWC = application of soundwaves during carbonation and SWF = application of soundwaves during fermentation.

