1. Summary
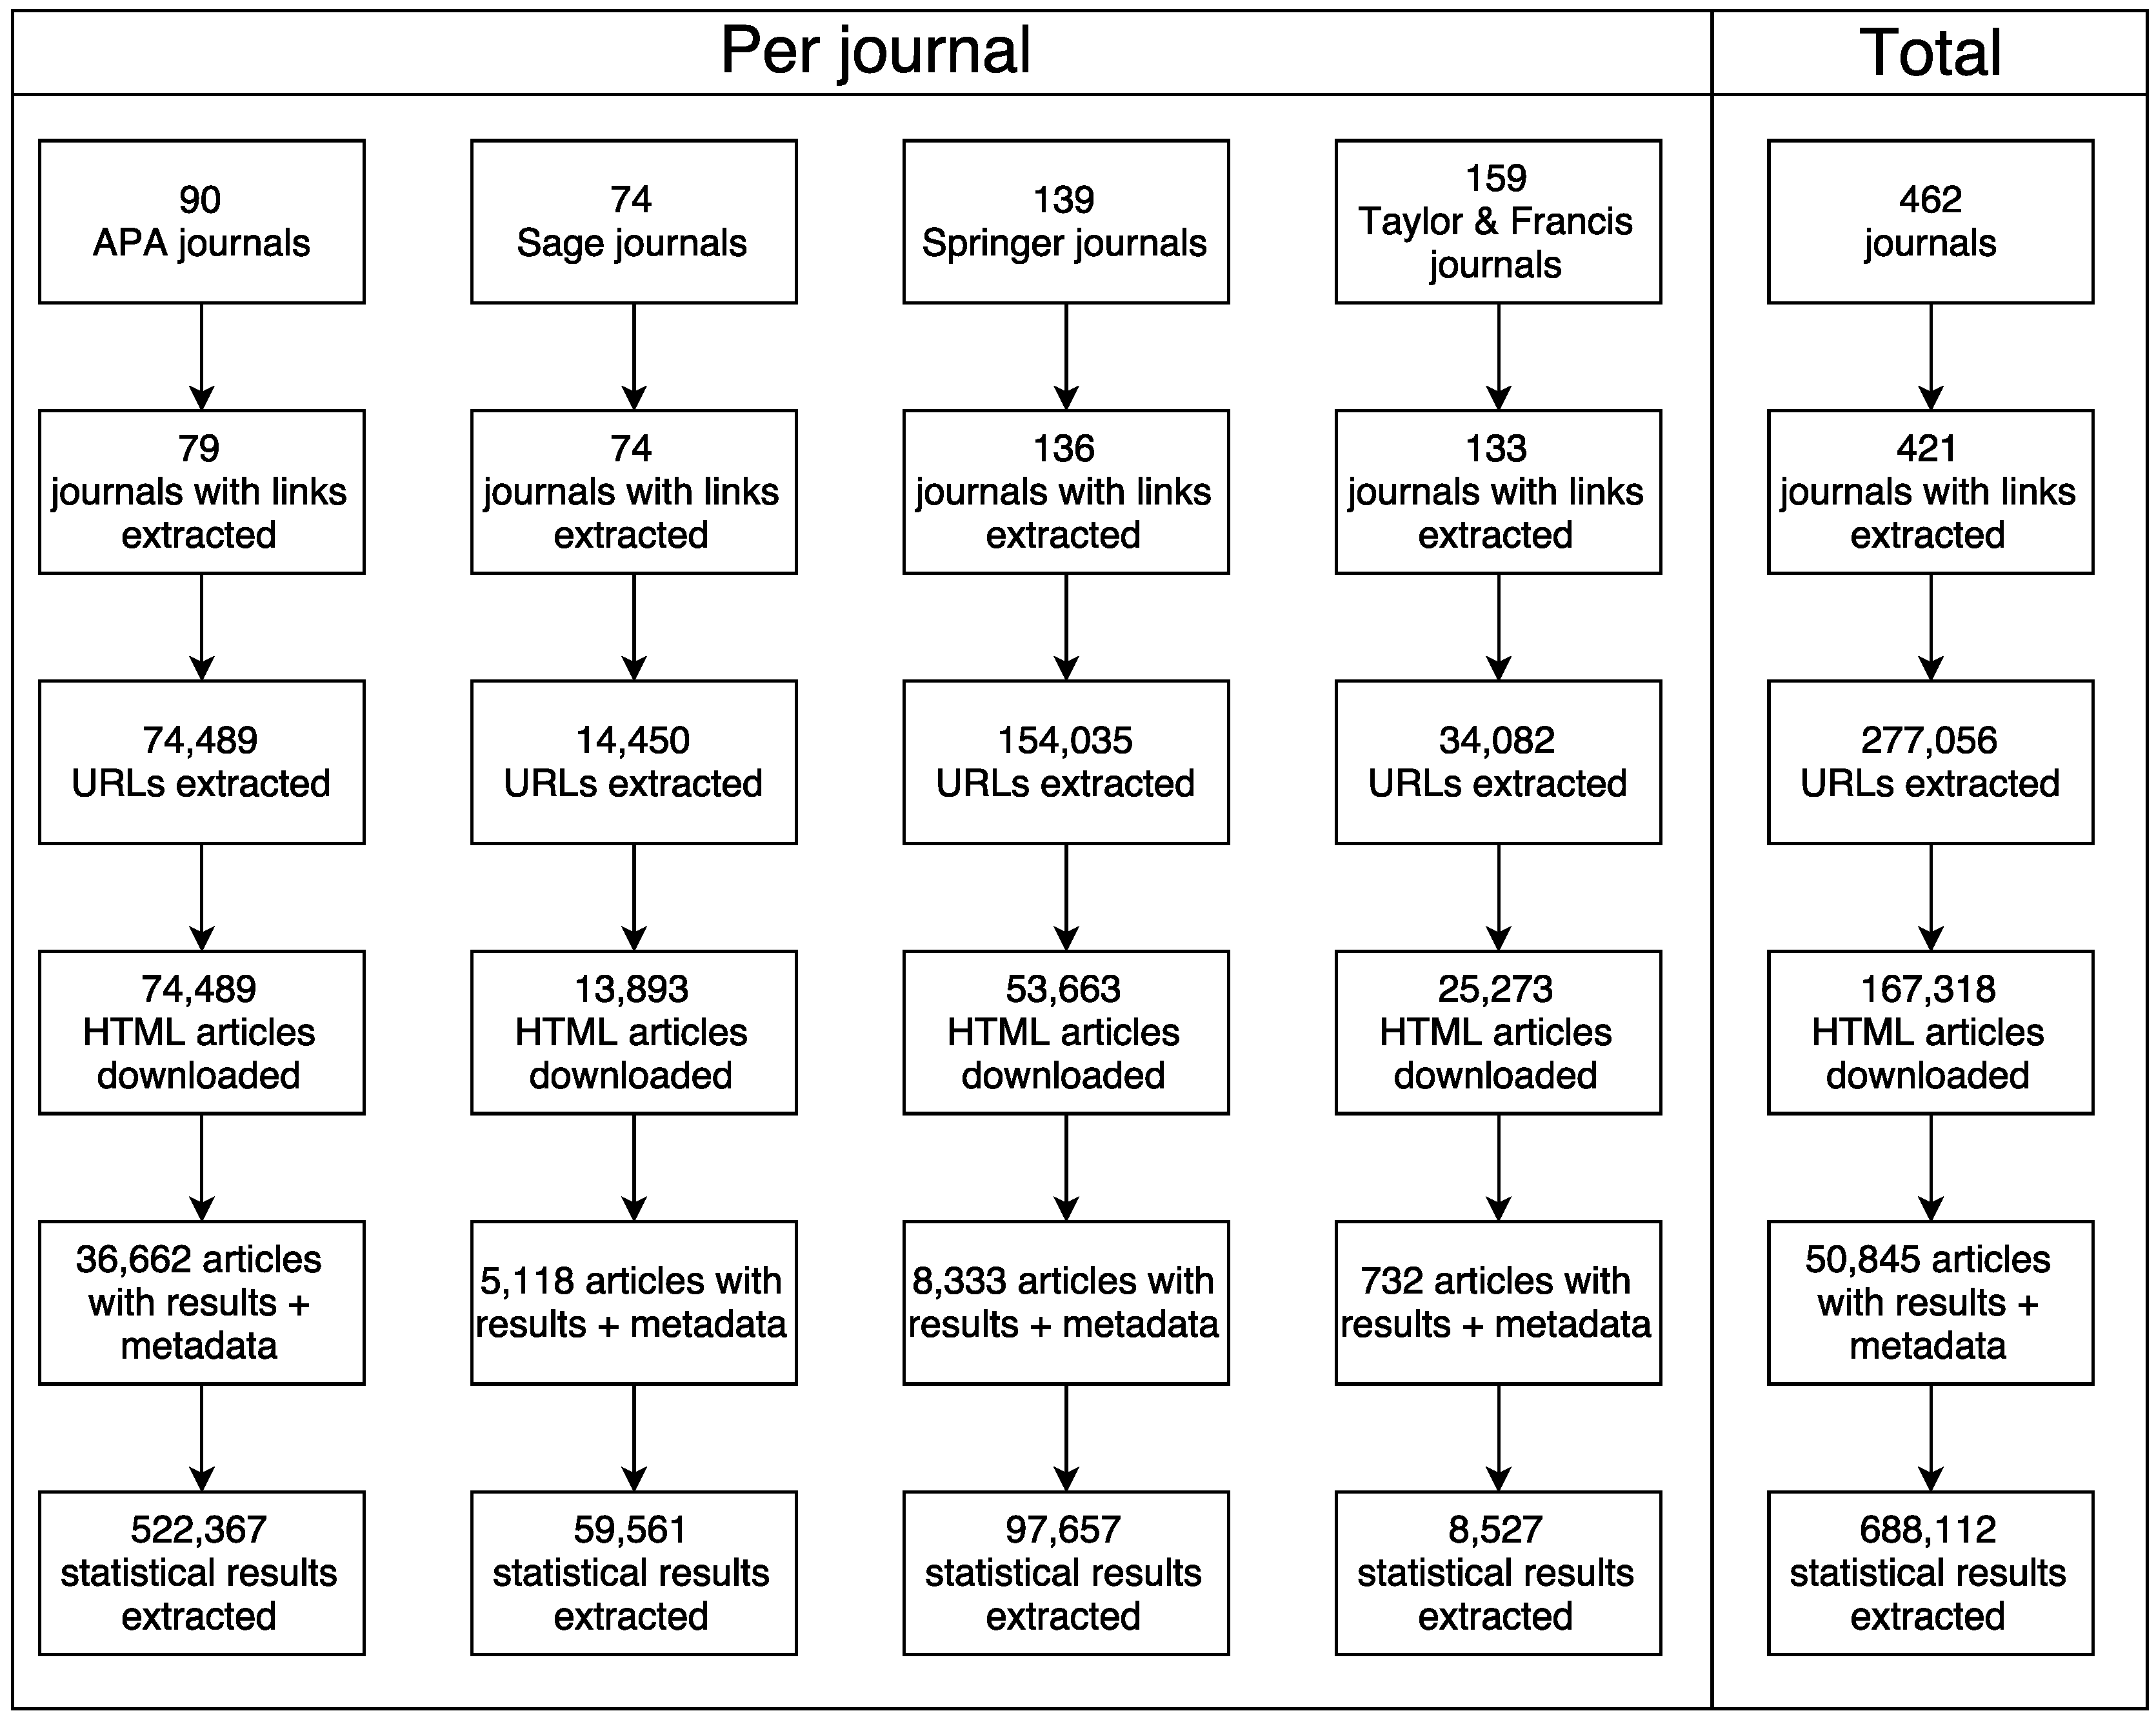
In this data deposit, I describe a dataset that is the result of content mining 167,318 published psychology articles for statistical test results. I tried to mine the content of HTML articles in all psychology journals published by the six major publishers in psychology, and succeeded in doing so for four major publishers (see
Table 1 for descriptives per publisher). This content mining was done with the
R package
statcheck [
1,
2], which extracts statistical results from research articles in an automated fashion, given that they are reported in the format prescribed by the American Psychological Association (APA). I only inspected psychology journals, because this is a standard within the field of psychology and not necessarily outside of this field.
The
statcheck software extracted 688,112 results from 50,845 articles (out of 167,318 articles). The extracted statistical test results are presented in long format in this dataset (i.e., each row corresponds to one statistical result). For each extracted statistical test result, the reported statistical values are used to recalculate the
p-value for the reported statistical result. These recalculated
p-values are checked against the reported
p-value for (decision) errors. A potential error has occurred when the reported
p-value is not congruent with the recalculated
p-value, whereas a decision error (or gross error) occurs when the recalculated
p-value does not correspond to the reported
p-value and alters the significance of the result, assuming
. The results of this comparison are available in the dataset. The articles for which no results were found are not included in the dataset (filenames without results available at [
3]).
In order to provide a comprehensive dataset, the statistical results are supplemented with metadata of the original article as available in CrossRef (
http://crossref.org). These metadata include the
doi, the publisher, the publication year, the journal, the author names, the author count, and the publication title. Given that the dataset is in long format, multiple rows can contain duplicate metadata if multiple results are extracted from the same article.
This dataset of statistical results and accompanying metadata can be used to inspect if specific papers include potential statistical errors or for trends in statistical results over time. Articles based on a similar dataset inspected the degree to which reporting errors occur [
1], tried to assess whether such data could be modeled for
p-hacking [
4], and the degree to which sample sizes and potential false negative results developed over time [
5]. This dataset can be used to replicate these findings and correlate findings with the available metadata. These data can also be used as baseline data to identify extreme statistical results in the literature by determining their percentile score, or to replicate other meta-research. These are only a few examples, and “the best thing to do with [the] data will be thought of by someone else” (quote from Rufus Pollock).
2. Data Description
The data are provided in a comma separated file (CSV) and in long-format, where each row contains one statistical result. As such, multiple rows can pertain to the same article and include the same metadata. This information is provided in duplicate because any other file format (wide-format or separate files per article) is unfeasible without increasing the difficulty to reuse the data (e.g., in JSON format). Given the size of the full dataset (>200 MB), a smaller test dataset is also included to pilot analysis scripts.
For each of the 688,112 results, 20 variables are included, of which seven pertain to article metadata and 13 pertain to the individual statistical results.
Table 2 lists all variables included in the dataset. Two specific sets of variables are worth explaining further. First, only
F-values have two degrees of freedom (i.e.,
df1 and
df2). For
t-values, the reported degrees of freedom are
df2, because
. For all other test statistics that include degrees of freedom, they are included in
df1 (i.e.,
;
Z contains no degrees of freedom). Second, the variable
DecisionError indicates whether an error results in wrongly concluding statistical significance (report
whereas the recalculated
p-value yields
, or vice versa). If the variables
OneTail and
OneTailedInTxt are
TRUE (see
Table 2), a decision error is reverted to
FALSE.
3. Methods
The data were collected in five steps: (i) collect journal lists; (ii) spider journal pages for articles; (iii) download articles; (iv) add article metadata; and (v) mine articles for statistical results. These five steps are specified below. All code and version history is available at [
6].
Figure 1 gives a flowchart of the different steps in the data collection process.
Lists of psychology journals from six major publishers were collected manually. Six publishers were included at the start of this project: Elsevier, Wiley, Sage, Springer, Taylor & Francis, and the APA. These six publishers cover >70% of the published psychology literature [
7]. Except for the APA, only journals included in the “Psychology” or “Behavioral Sciences” sections were included (as categorized by the publishers themselves). These journal lists were collected in October 2015 and available at [
8].
Journals from two of the six publishers had to be removed from the journal list, because Elsevier and Wiley prevented me from automatically downloading research articles [
9,
10,
11]. The library at my university was prompted by these publishers that suspicious downloading activity occurred, which they thought indicated compromised user credentials and theft of copyrighted material. The Tilburg University library services requested me to halt the automated downloading, in light of potential blocks for the entire university. As a result, Elsevier and Wiley were excluded from the journal list, resulting in a remainder of 461 journals from the original 1011 (this renewed list is available at [
12]).
Article URLs were collected with a web spider in April 2016. A web spider visits a webpage and collects all or a specific set of URLs included on that webpage. Subsequently, the web spider visits the pages that are referred to on the initial webpage and again collects URLs, which it repeats over and over. For this project, a web spider was developed to extract specific links that referred to full texts [
13]. This web spider produced a set of URLs, which provided direct links to full-text articles in HTML format (all URLs available at [
14]). Only those HTMLs that were accessible within the Tilburg University subscription were collected (list of available journal titles within subscription available at [
15]). The original sample, including Elsevier and Wiley, was ~900,000 articles.
The research articles were subsequently automatically downloaded, with the command-line utilities
wget (i.e., APA articles) and
quickscrape (v0.4.6 [
16]; i.e., Sage, Springer, Taylor & Francis). This downloading occurred in April–May 2016 and took into account potential strain on the publisher’s servers by restricting downloads to weekends or limiting the download rate to 10 per minute at most.
Metadata for each article were collected with the Ruby module
terrier [
17]. This module queries the CrossRef database when provided with a Digital Object Identifier (DOI). If available, it returns the available metadata such as the journal name, publication year, etc. These metadata were collected in April–June 2016 for all included articles [
18]. Not all articles contained a DOI and no metadata could be collected from CrossRef as a result.
Finally, after all HTML files were collected and metadata were added,
statcheck (v1.0.1 [
1,
2,
19]) was run in August 2016 to create the final dataset. This
R package scans the text from an article for APA style statistical results, extracts these statistical results, and checks whether the reported
p-values are equivalent to the recalculated
p-value (with a margin of error due to potential rounding). For example, the result
would be automatically extracted. Version 1.0.1 of
statcheck is able to mine
and
results.
4. Usage Notes
Usage of the data requires understanding several limitations of the
statcheck package, in order to provide context for results obtained from this dataset. A manual validity check for
statcheck proved that the software is valid for extracting APA style reported test results [
1]. However, it does not extract results that are not in line with what the APA prescribes. Additionally,
statcheck only extracts results reported in the text and not those reported in tabular format or in images. As such, statistical results from tables and images are systematically excluded. As a result, any conclusions based on this dataset should not be extrapolated without caution.
Additionally, it is worth mentioning that relatively few articles contained results that were extracted by statcheck (~1/3 downloaded articles). This could be due to at least three reasons. First, results might not be reported according to the APA format in some psychology journals/volumes, which results in fewer extracted results. Second, statistical results could be reported in APA format, but these statistical results are not or . Third, a considerable part of the literature might pertain to theoretical papers, case studies, or narrative reviews, instead of empirical research.
The presented data have been deposited in the Dutch Archival Network for the Sciences (DANS) and are available under a public domain license (CC0 1.0 rights waiver). The DANS repository is a trustworthy digital repository and has received the Data Seal of Approval (DSA), the World Data System (WDS) certificate, and the NESTOR-seal. This ensures that deposited data will remain available for a substantial amount of time. All rights to this dataset are waived to the furthest extent possible, such that reuse is maximized.
In addition to preserving the data in the DANS repository, individual reports have been generated for each of the 50,845 articles and posted on PubPeer (
https://pubpeer.com/). The
Appendix shows a fictitious example of such a report. These reports were generated in order to increase the accessibility of the data for those wanting to investigate a specific paper instead of the entire dataset. Additionally, this increases the discoverability of potential errors by posting them in a central forum of post-publication peer review.


