
Description of a Database Containing Wrist PPG Signals Recorded during Physical Exercise with Both Accelerometer and Gyroscope Measures of Motion


Abstract
:1. Summary
- While walking on a treadmill.
- While running on a treadmill.
- While using an exercise bike set to a low resistance (giving high cycling speeds).
- While using an exercise bike set to a high resistance (giving low cycling speeds).
- A low-noise 3-axis accelerometer.
- A wide-range 3-axis accelerometer, up to .
- A 3-axis gyroscope with 0.0481 degrees per second (dps) noise floor.
2. Data Description
3. Methods
4. Usage Notes
Acknowledgments
Author Contributions
Conflicts of Interest
Appendix Combining Accelerometer and Gyroscope Data to Estimate Motion
References
- Allen, J. Photoplethysmography and its application in clinical physiological measurement. Physiol. Meas. 2007, 28, R1–R39. [Google Scholar] [CrossRef] [PubMed]
- Simband. Available online: http://www.voiceofthebody.io/ (accessed on 4 July 2016).
- Khan, E.; Hossain, F.A.; Uddin, S.Z.; Alam, S.K.; Hasan, M.K. A Robust Heart Rate Monitoring Scheme Using Photoplethysmographic Signals Corrupted by Intense Motion Artifacts. IEEE Trans. Biomed. Eng. 2016, 63, 550–562. [Google Scholar] [CrossRef] [PubMed]
- Krishnan, R.; Natarajan, B.; Warren, S. Two-Stage Approach for Detection and Reduction of Motion Artifacts in Photoplethysmographic Data. IEEE Trans. Biomed. Eng. 2010, 57, 1867–1876. [Google Scholar] [CrossRef] [PubMed]
- Zhang, Z.; Pi, Z.; Liu, B. TROIKA: A General Framework for Heart Rate Monitoring Using Wrist-Type Photoplethysmographic Signals During Intensive Physical Exercise. IEEE Trans. Biomed. Eng. 2015, 62, 522–531. [Google Scholar] [CrossRef] [PubMed]
- Zhang, Z. Photoplethysmography-Based Heart Rate Monitoring in Physical Activities via Joint Sparse Spectrum Reconstruction. IEEE Trans. Biomed. Eng. 2015, 62, 1902–1910. [Google Scholar] [CrossRef] [PubMed]
- Zong, C.; Jafari, R. Robust Heart Rate Estimation using Wrist-based PPG Signals in the Presence of Intense Physical Activities. In Proceedings of the 2015 37th Annual International Conference of the IEEE Engineering in Medicine and Biology Society (EMBC), Milan, Italy, 25–29 August 2015; pp. 8078–8082.
- Nathan, V.; Akkaya, I.; Jafari, R. A Particle Filter Framework for the Estimation of Heart Rate from ECG Signals Corrupted by Motion Artifacts. In Proceedings of the 2015 37th Annual International Conference of the IEEE Engineering in Medicine and Biology Society (EMBC), Milan, Italy, 25–29 August 2015; pp. 6560–6565.
- Mullan, P.; Kanzler, C.M.; Lorch, B.; Schroeder, L.; Winkler, L.; Laich, L.; Riedel, F.; Richer, R.; Luckner, C.; Leutheuser, H.; et al. Unobtrusive Heart Rate Estimation during Physical Exercise using Photoplethysmographic and Acceleration Data. In Proceedings of the 2015 37th Annual International Conference of the IEEE Engineering in Medicine and Biology Society (EMBC), Milan, Italy, 25–29 August 2015; pp. 6114–6117.
- Temko, A. Estimation of Heart Rate from Photoplethysmography during Physical Exercise using Wiener Filtering and the Phase Vocoder. In Proceedings of the 2015 37th Annual International Conference of the IEEE Engineering in Medicine and Biology Society (EMBC), Milan, Italy, 25–29 August 2015; pp. 1500–1503.
- Zhu, S.; Tan, K.; Zhang, X.; Liu, Z.; Liu, B. MICROST: A Mixed Approach for Heart Rate Monitoring During Intensive Physical Exercise Using Wrist-Type PPG Signals. In Proceedings of the 2015 37th Annual International Conference of the IEEE Engineering in Medicine and Biology Society (EMBC), Milan, Italy, 25–29 August 2015; pp. 2347–2350.
- Schack, T.; Sledz, C.; Muma, M.; Zoubir, A.M. A New Method for Heart Rate Monitoring During Physical Exercise Using Photoplethysmographic Signals. In Proceedings of the 2015 European Signal Processing Conference (EUSIPCO 2015), Nice, France, 31 August–4 September 2015; pp. 2666–2670.
- Lam, K.M.; Sorzano, C.O.S.; Zhang, Z.; Campisi, P. Undergraduate students compete in the IEEE Signal Processing Cup: Part 1. IEEE Signal Processing Mag. 2015, 32, 123–125. [Google Scholar] [CrossRef]
- Farhang-Boroujeny, B. Adaptive Filters: Theory and Applications; John Wiley & Sons Ltd: Chichester, UK, 2011. [Google Scholar]
- Rueterbories, J.; Spaich, E.G.; Larsen, B.; Andersen, O.K. Methods for gait event detection and analysis in ambulatory systems. Med. Eng. Phys. 2010, 32, 545–552. [Google Scholar] [CrossRef] [PubMed]
- Tong, K.; Granat, M.H. A practical gait analysis system using gyroscopes. Med. Eng. Phys. 1999, 21, 87–94. [Google Scholar] [CrossRef]
- Mayagoitia, R.E.; Nene, A.V.; Veltink, P.H. Accelerometer and rate gyroscope measurement of kinematics: An inexpensive alternative to optical motion analysis systems. J. Biomech. 2002, 35, 537–542. [Google Scholar] [CrossRef]
- Luinge, H.J.; Veltink, P.H. Measuring orientation of human body segments using miniature gyroscopes and accelerometers. Med. Biol. Eng. Comput. 2005, 43, 273–282. [Google Scholar] [CrossRef] [PubMed]
- Goldberger, A.L.; Amaral, L.A.N.; Glass, L.; Hausdorff, J.M.; Ivanov, P.C.; Mark, R.G.; Mietus, J.E.; Moody, G.B.; Peng, C.K.; Stanley, H.E. PhysioBank, PhysioToolkit, and PhysioNet: Components of a New Research Resource for Complex Physiologic Signals. Circulation 2000, 101, e215–e220. [Google Scholar] [CrossRef] [PubMed]
- Camntech Actiwave. Available online: http://www.camntech.com/ (accessed on 4 July 2016).
- Webster, J.G. Reducing Motion Artifacts and Interference in Biopotential Recording. IEEE Trans. Biomed. Eng. 1984, 31, 823–826. [Google Scholar] [CrossRef] [PubMed]
- Shimmer Sensing. Available online: http://www.shimmersensing.com/ (accessed on 4 July 2016).
- Elisseeff, A.; Pontil, M. Leave-one-out error and stability of learning algorithms with applications. NATO Sci. Ser. III 2003, 190, 111–130. [Google Scholar]
- Scosche Rhythm+. Available online: http://www.scosche.com/rhytthm+/ (accessed on 4 July 2016).
- Kemp, B.; Olivan, J. European data format ‘plus’ (EDF+), an EDF alike standard format for the exchange of physiological data. Clin. Neurophysiol. 2003, 114, 1755–1761. [Google Scholar] [CrossRef]
- Lee, J.K.; Park, E.J.; Robinovitch, S.N. Estimation of Attitude and External Acceleration Using Inertial Sensor Measurement During Various Dynamic Conditions. IEEE Trans. Instrum. Meas. 2012, 61, 2262–2273. [Google Scholar] [CrossRef] [PubMed]
- Yun, X.; Calusdian, J.; Bachmann, E.R.; McGhee, R.B. Estimation of Human Foot Motion During Normal Walking Using Inertial and Magnetic Sensor Measurements. IEEE Trans. Instrum. Meas. 2012, 61, 2059–2072. [Google Scholar] [CrossRef]
- Zihajehzadeh, S.; Loh, D.; Lee, M.; Hoskinson, R.; Park, E.J. A cascaded two-step Kalman filter for estimation of human body segment orientation using MEMS-IMU. In Proceedings of the 2014 36th Annual International Conference of the IEEE Engineering in Medicine and Biology Society (EMBC), Chicago, IL, USA, 26–30 August 2014; pp. 6270–6273.
- Zihajehzadeh, S.; Park, E.J. Regression Model-Based Walking Speed Estimation Using Wrist-Worn Inertial Sensor. PLoS ONE 2016, 11, e0165211. [Google Scholar] [CrossRef] [PubMed]
- Jarchi, D.; Casson, A.J. Estimation of Heart Rate From Foot Worn Photoplethysmography During Fast Bike Exercise. In Proceedings of the 2016 38th Annual International Conference of the IEEE Engineering in Medicine and Biology Society (EMBC), Orlando, FL, USA, 16–20 August 2016; pp. 3155–3158.


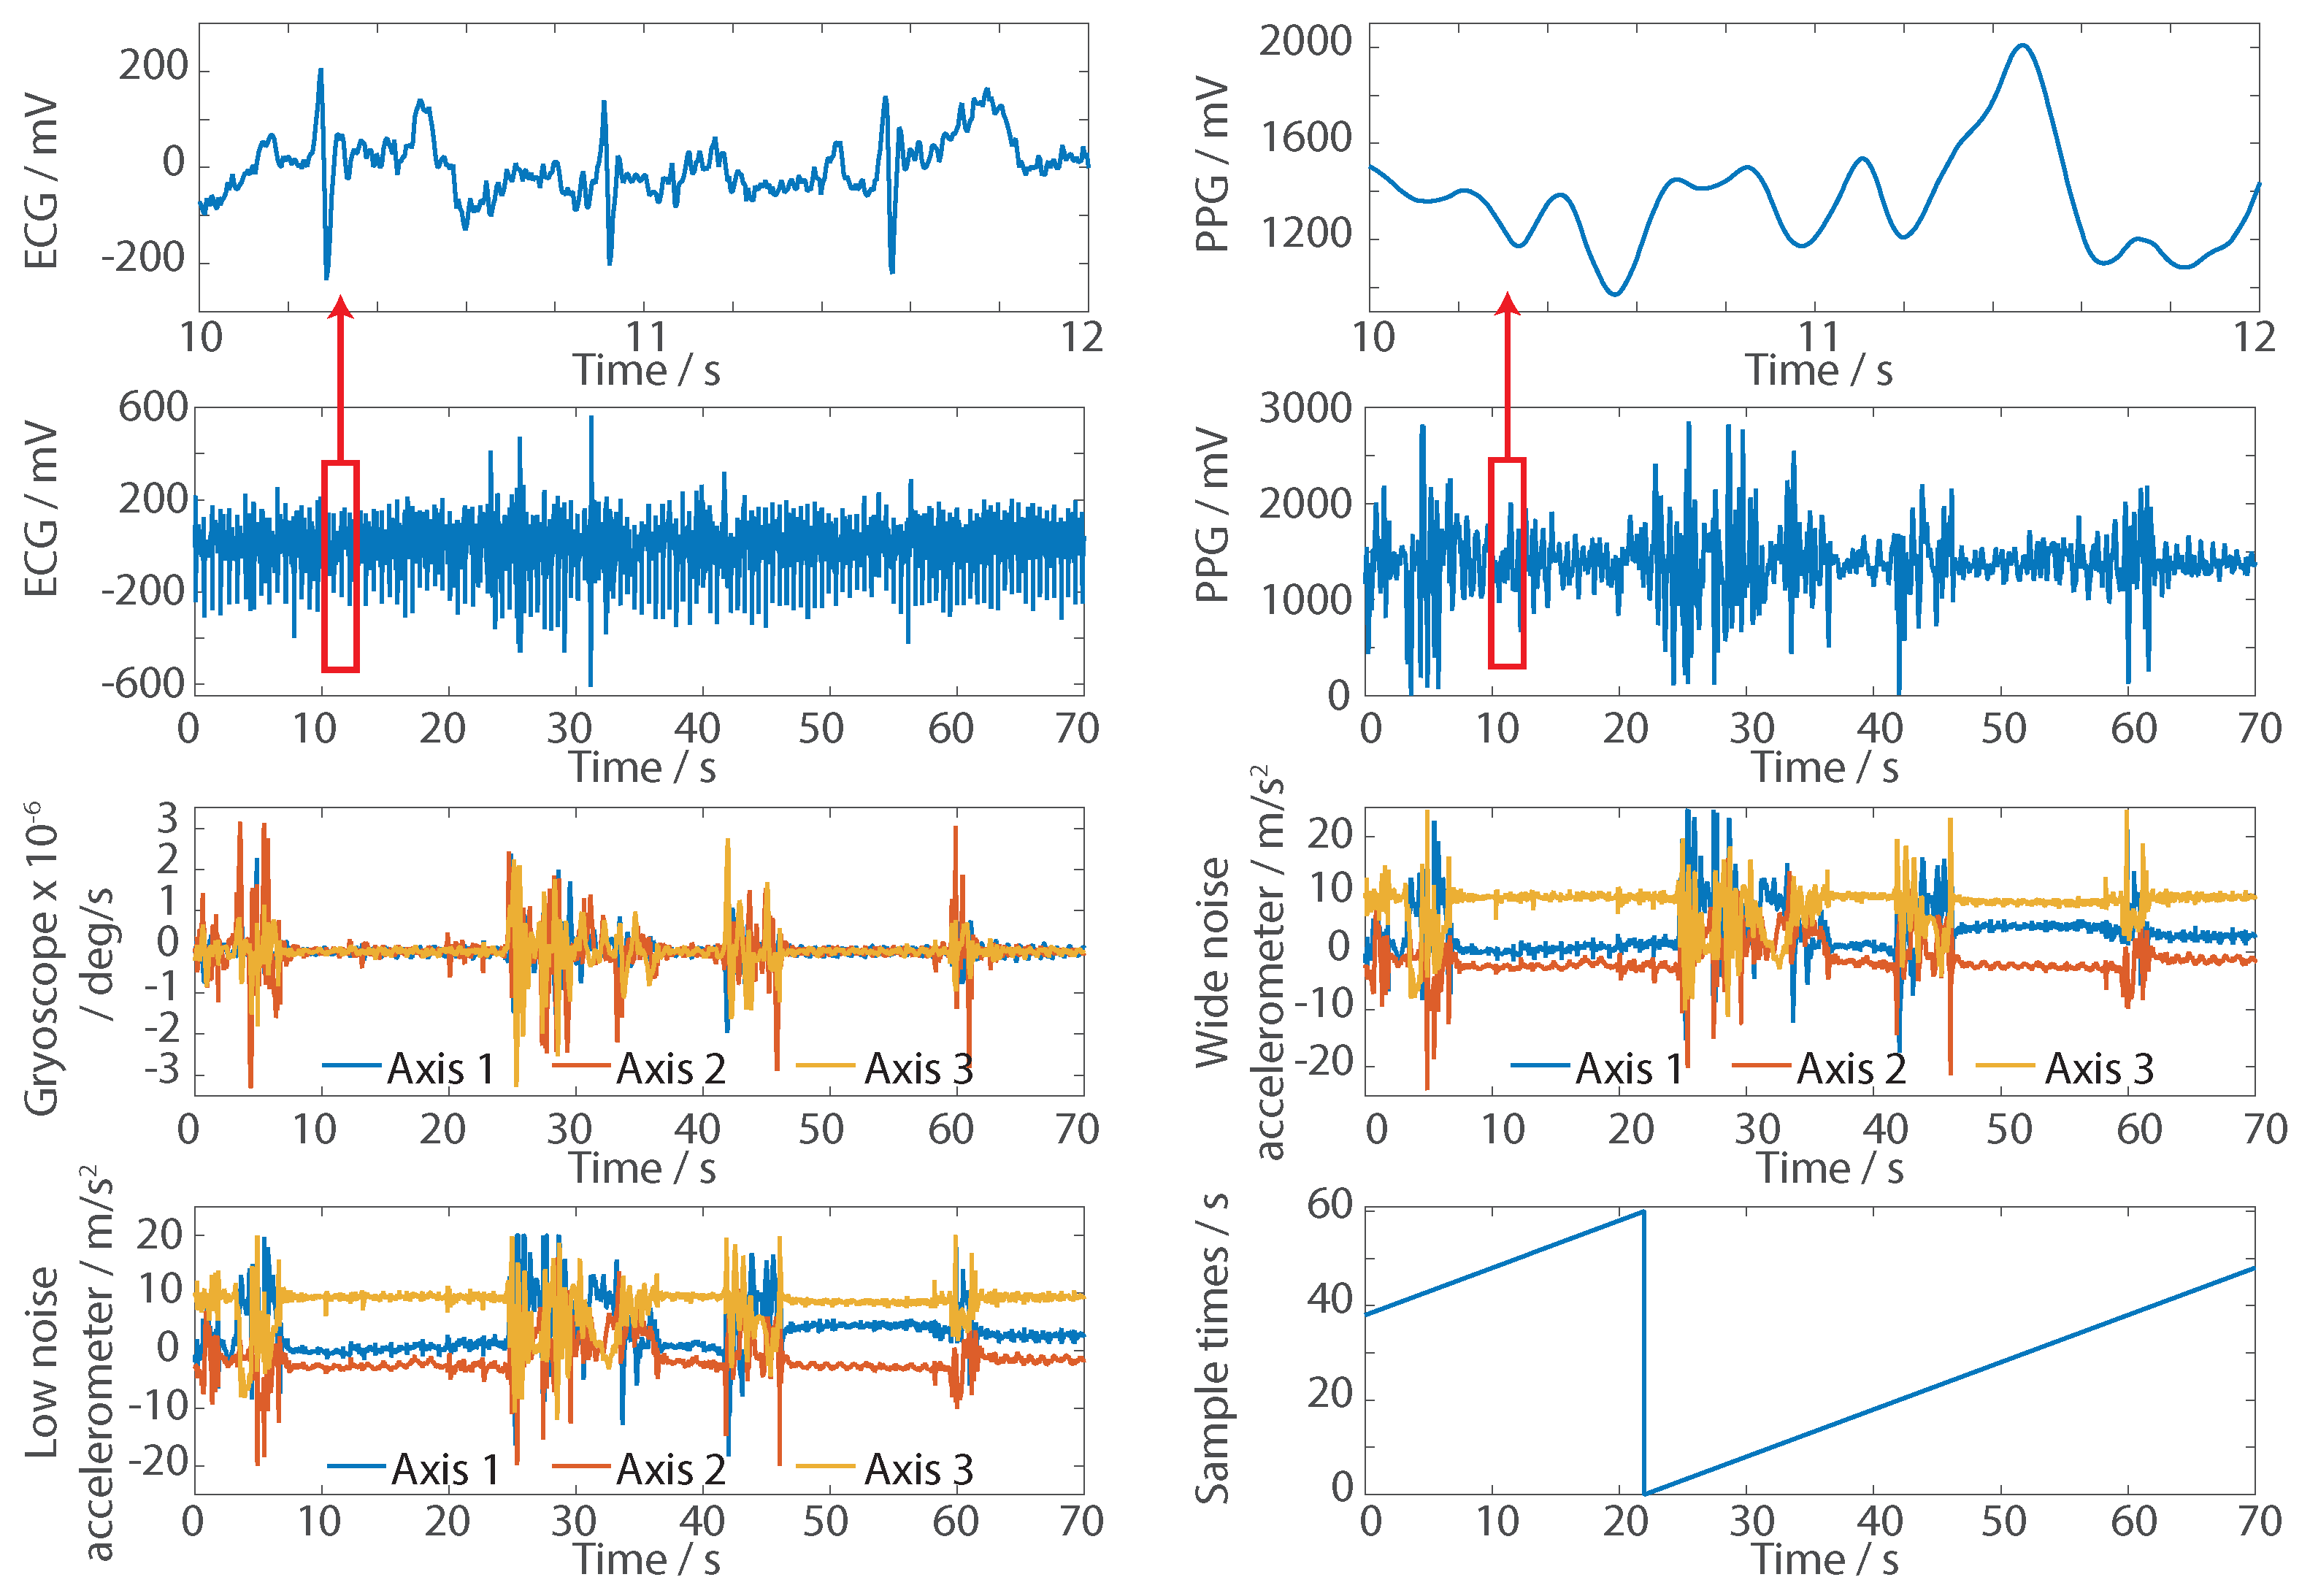
| Signal Name | Unit | Signal Description |
|---|---|---|
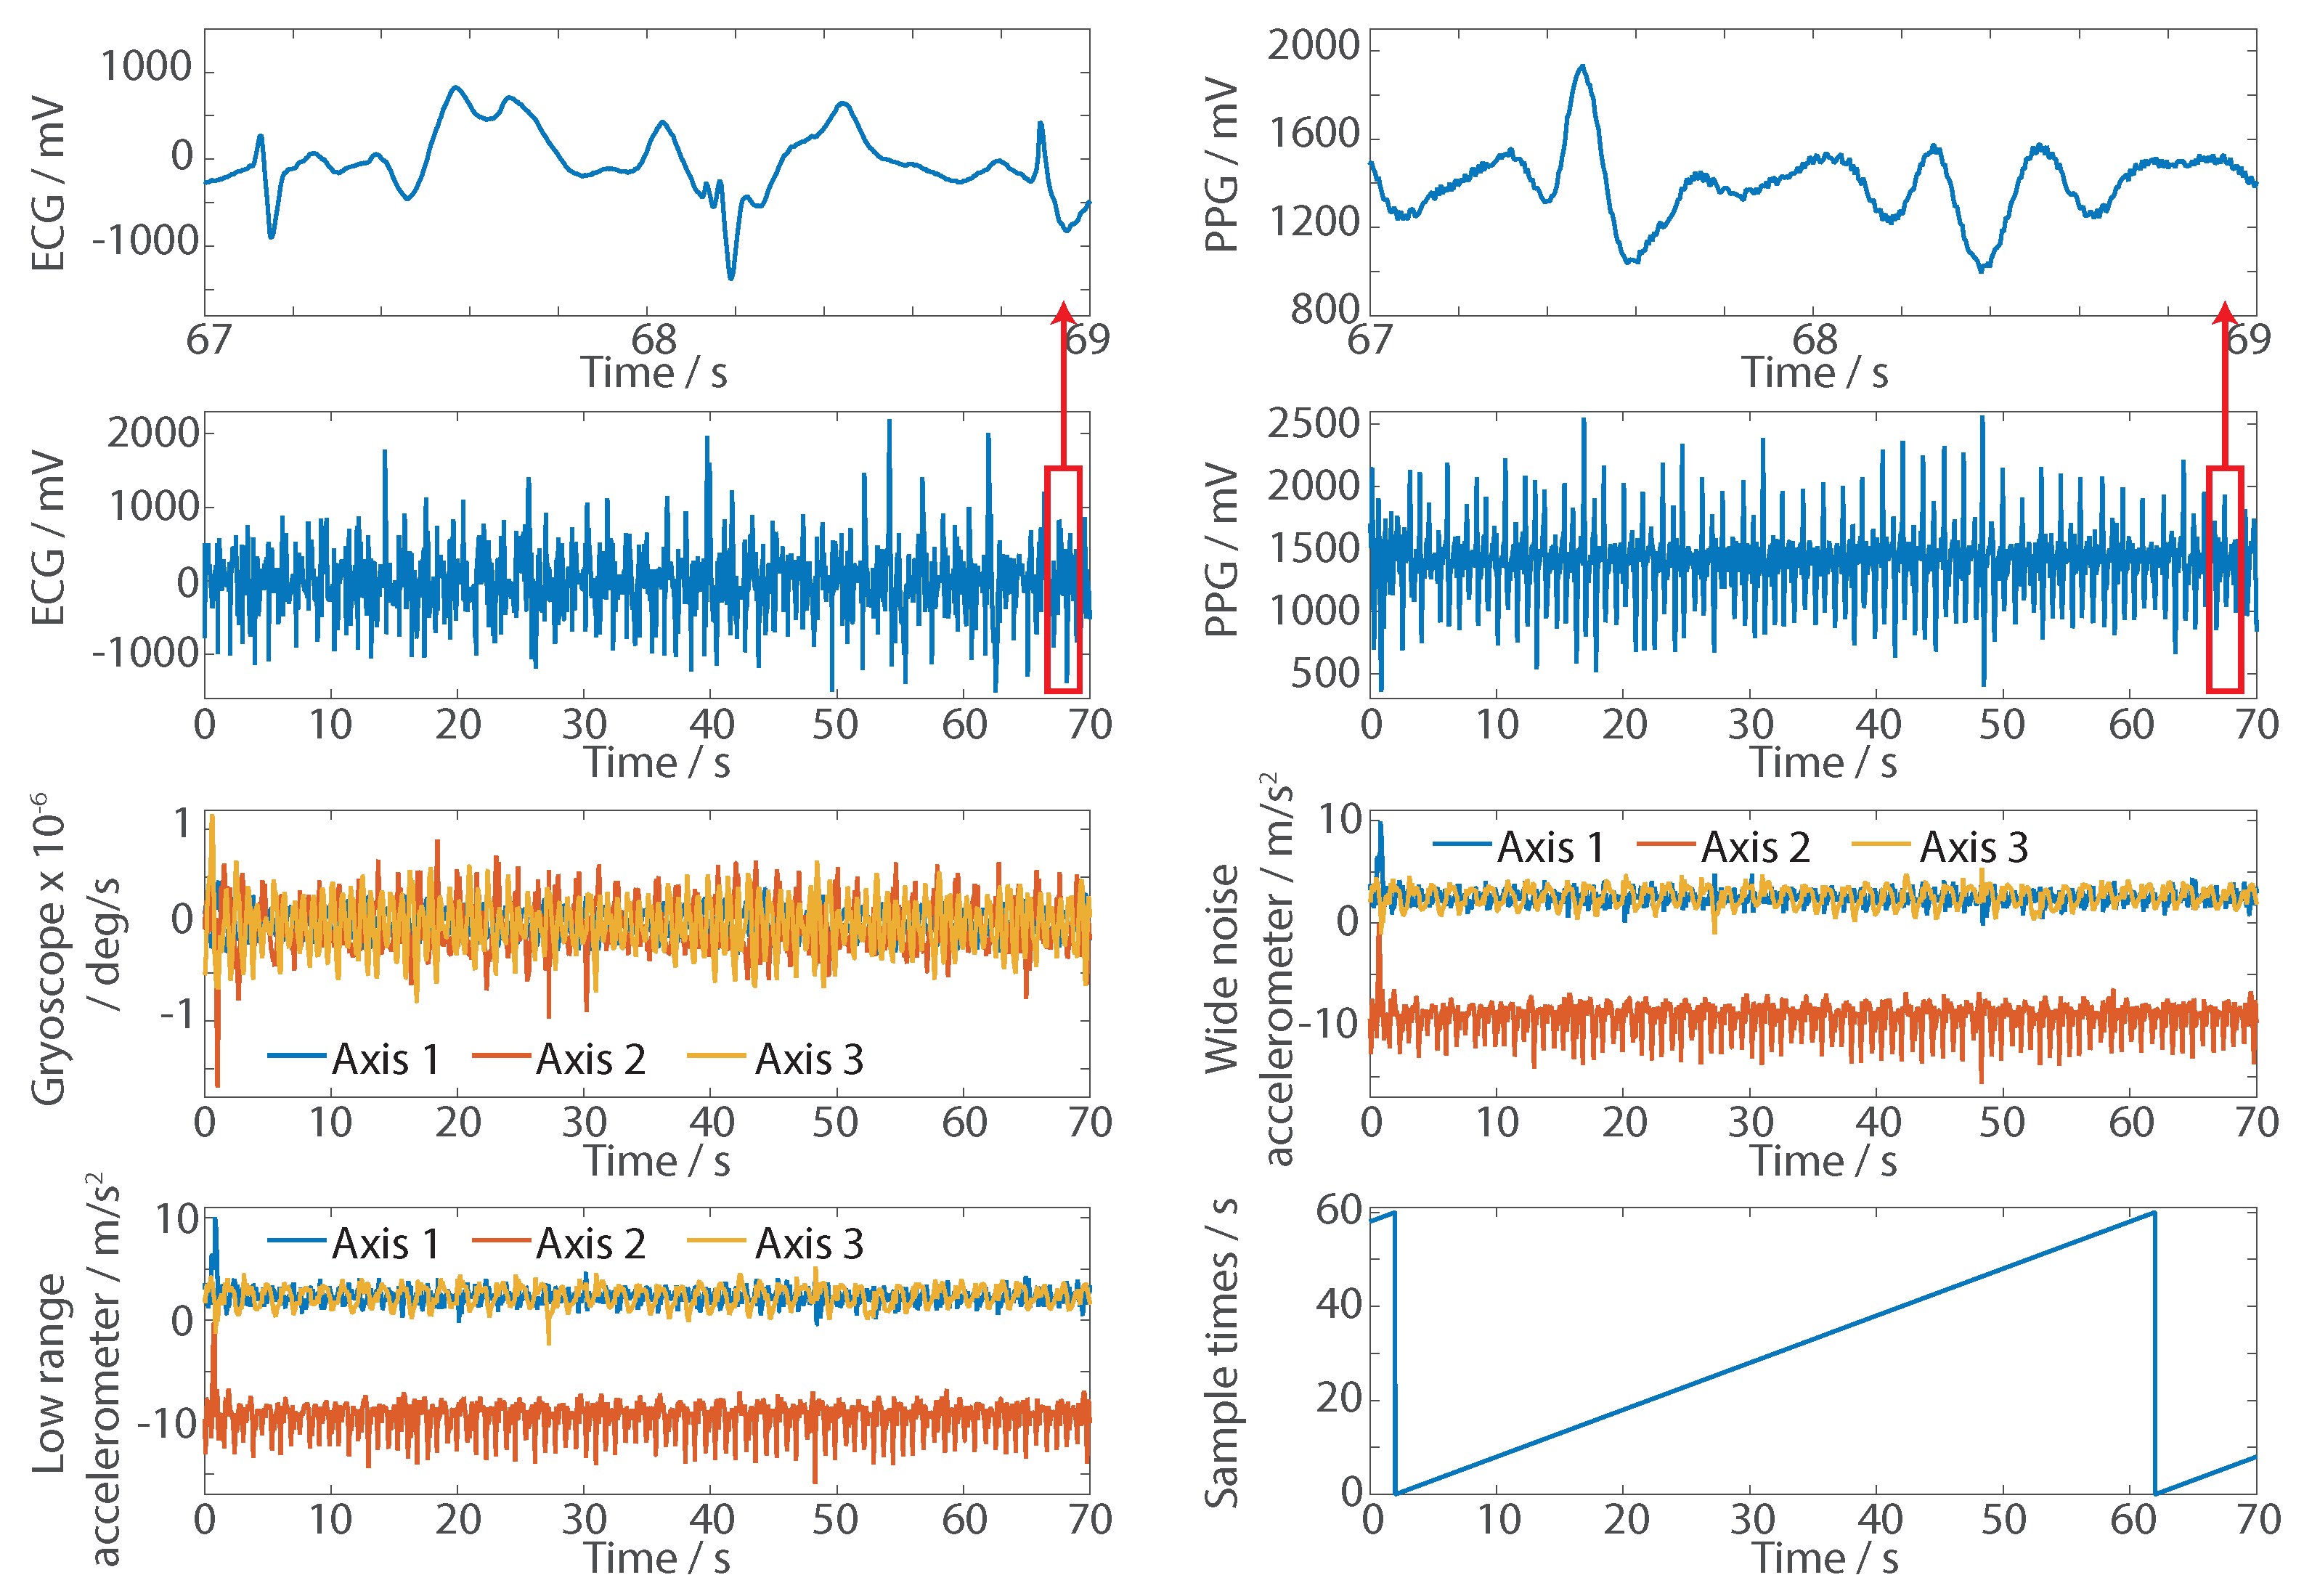
| Electrocardiography (ECG) | mV | The ECG signal recorded from the chest which can be used as a gold standard comparison for determining the heart rate. |
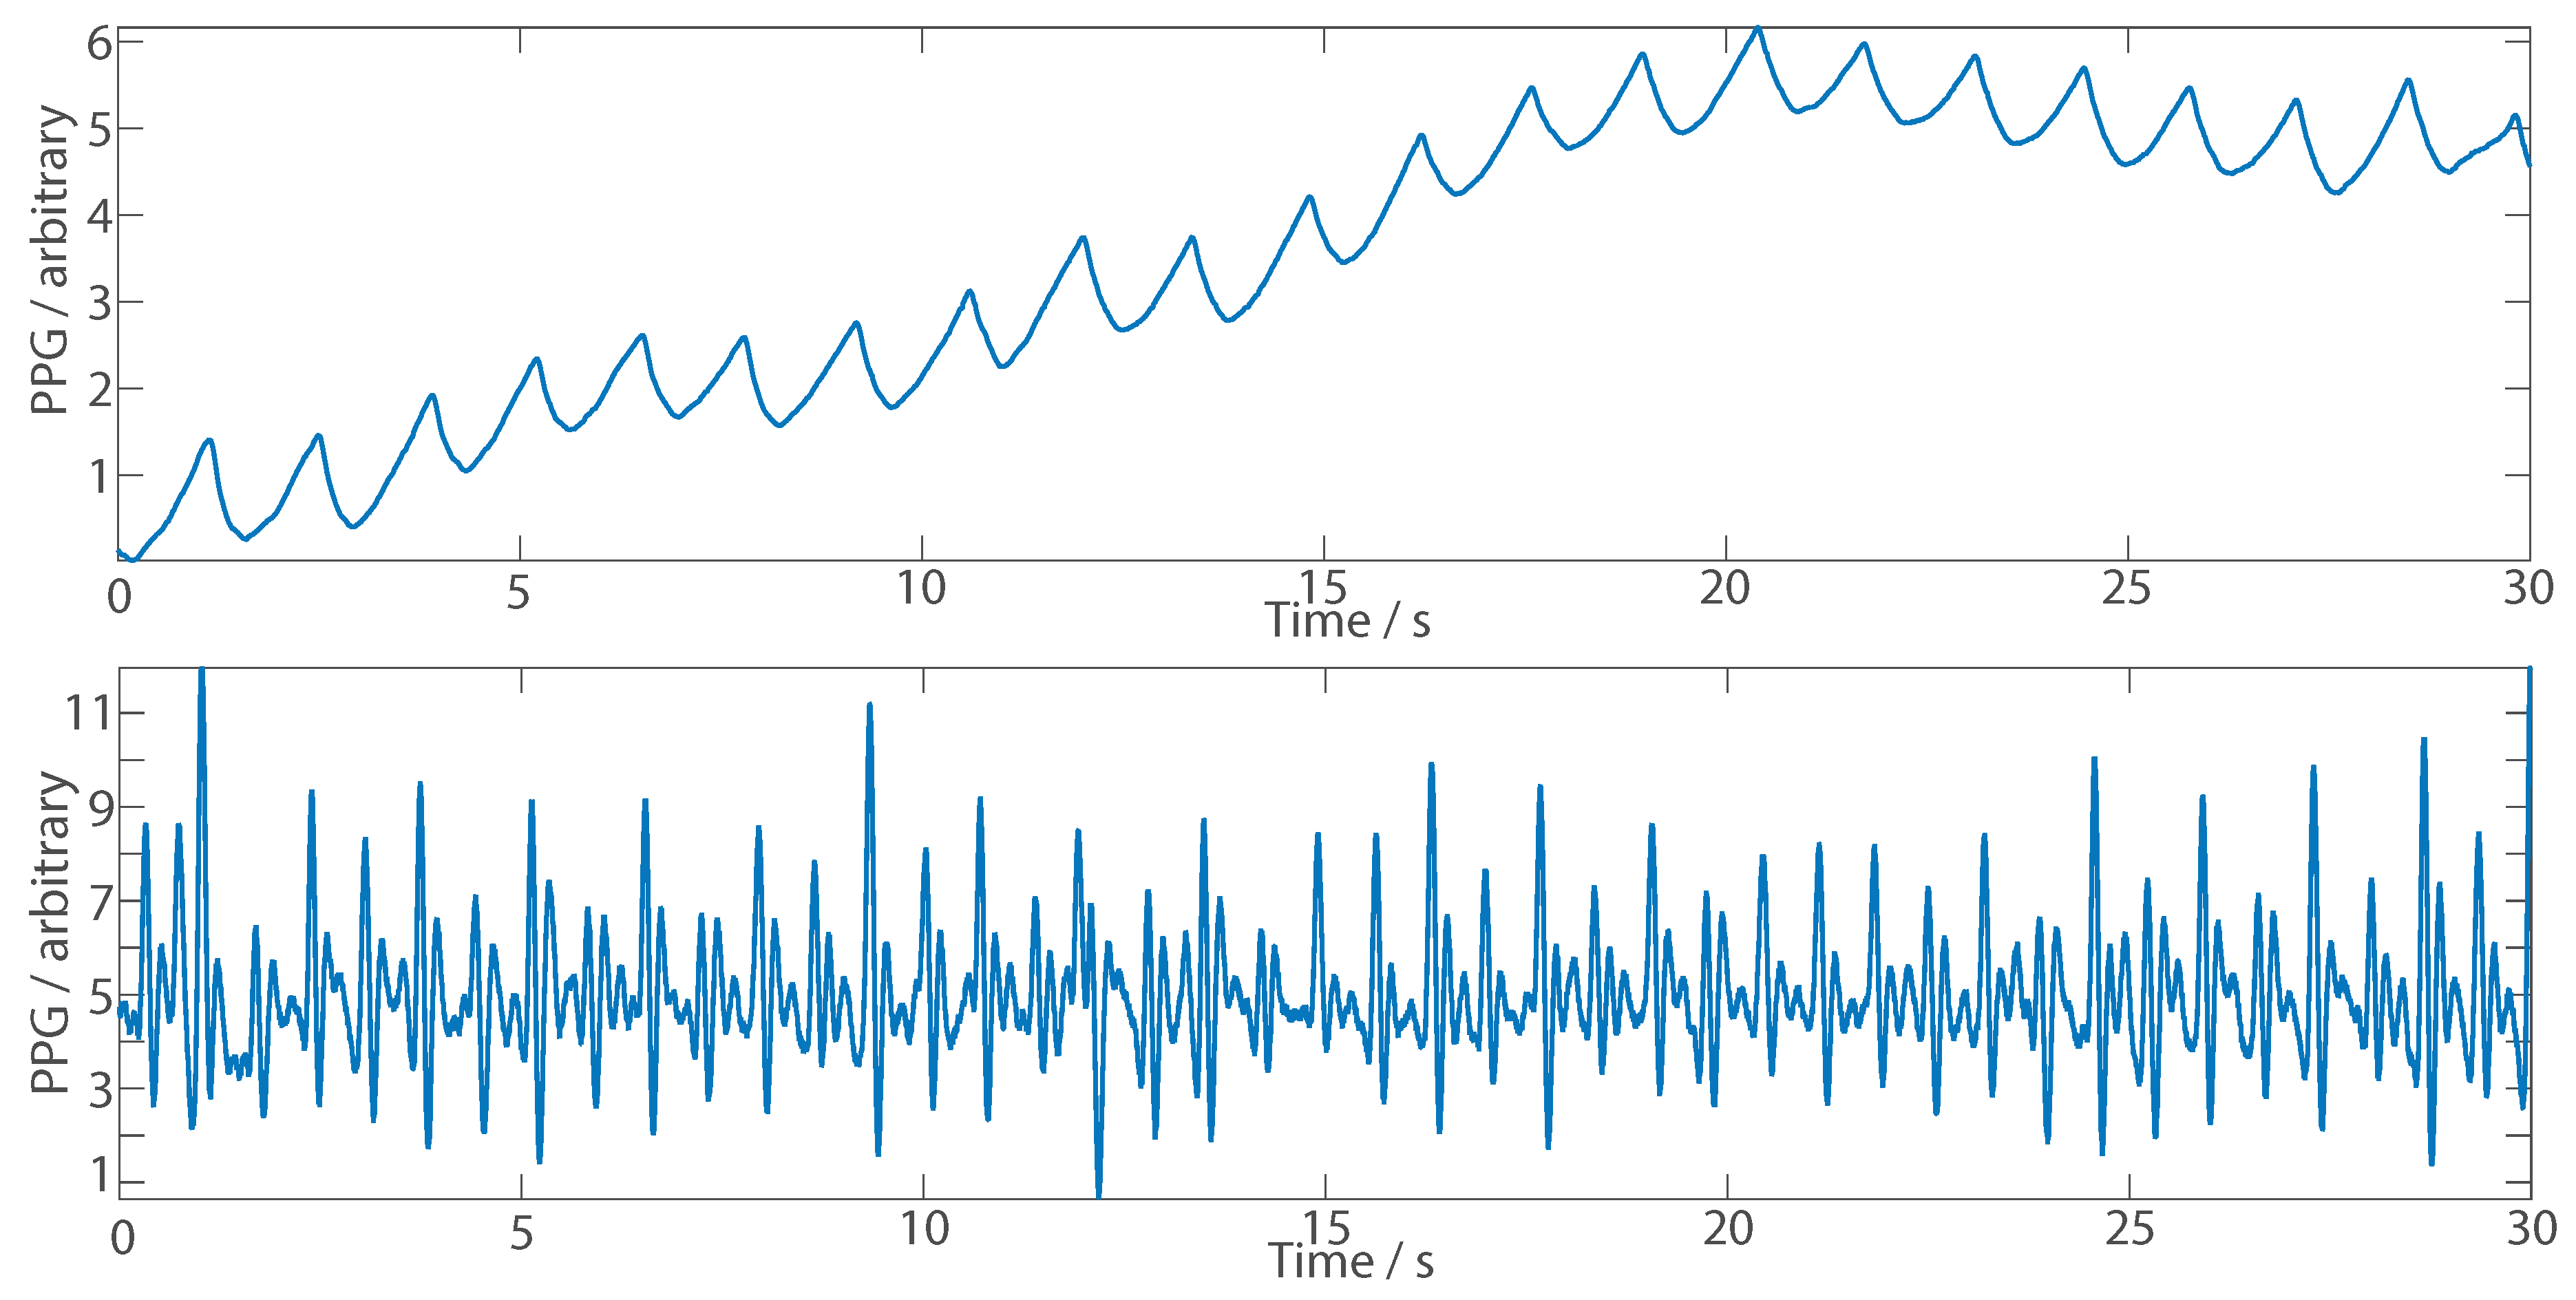
| PPG | mV | The reflective PPG signal recorded from the wrist. |
| Gyro 1 | deg/s | Gyroscope data recorded on first axis. |
| Gyro 2 | deg/s | Gyroscope data recorded on second axis. |
| Gyro 3 | deg/s | Gyroscope data recorded on third axis. |
| Low noise accelerometer 1 | m/s | accelerometer data recorded on first axis. |
| Low noise accelerometer 2 | m/s | accelerometer data recorded on second axis. |
| Low noise accelerometer 3 | m/s | accelerometer data recorded on third axis. |
| Wide range accelerometer 1 | m/s | accelerometer data recorded on first axis. |
| Wide range accelerometer 2 | m/s | accelerometer data recorded on second axis. |
| Wide range accelerometer 3 | m/s | accelerometer data recorded on third axis. |
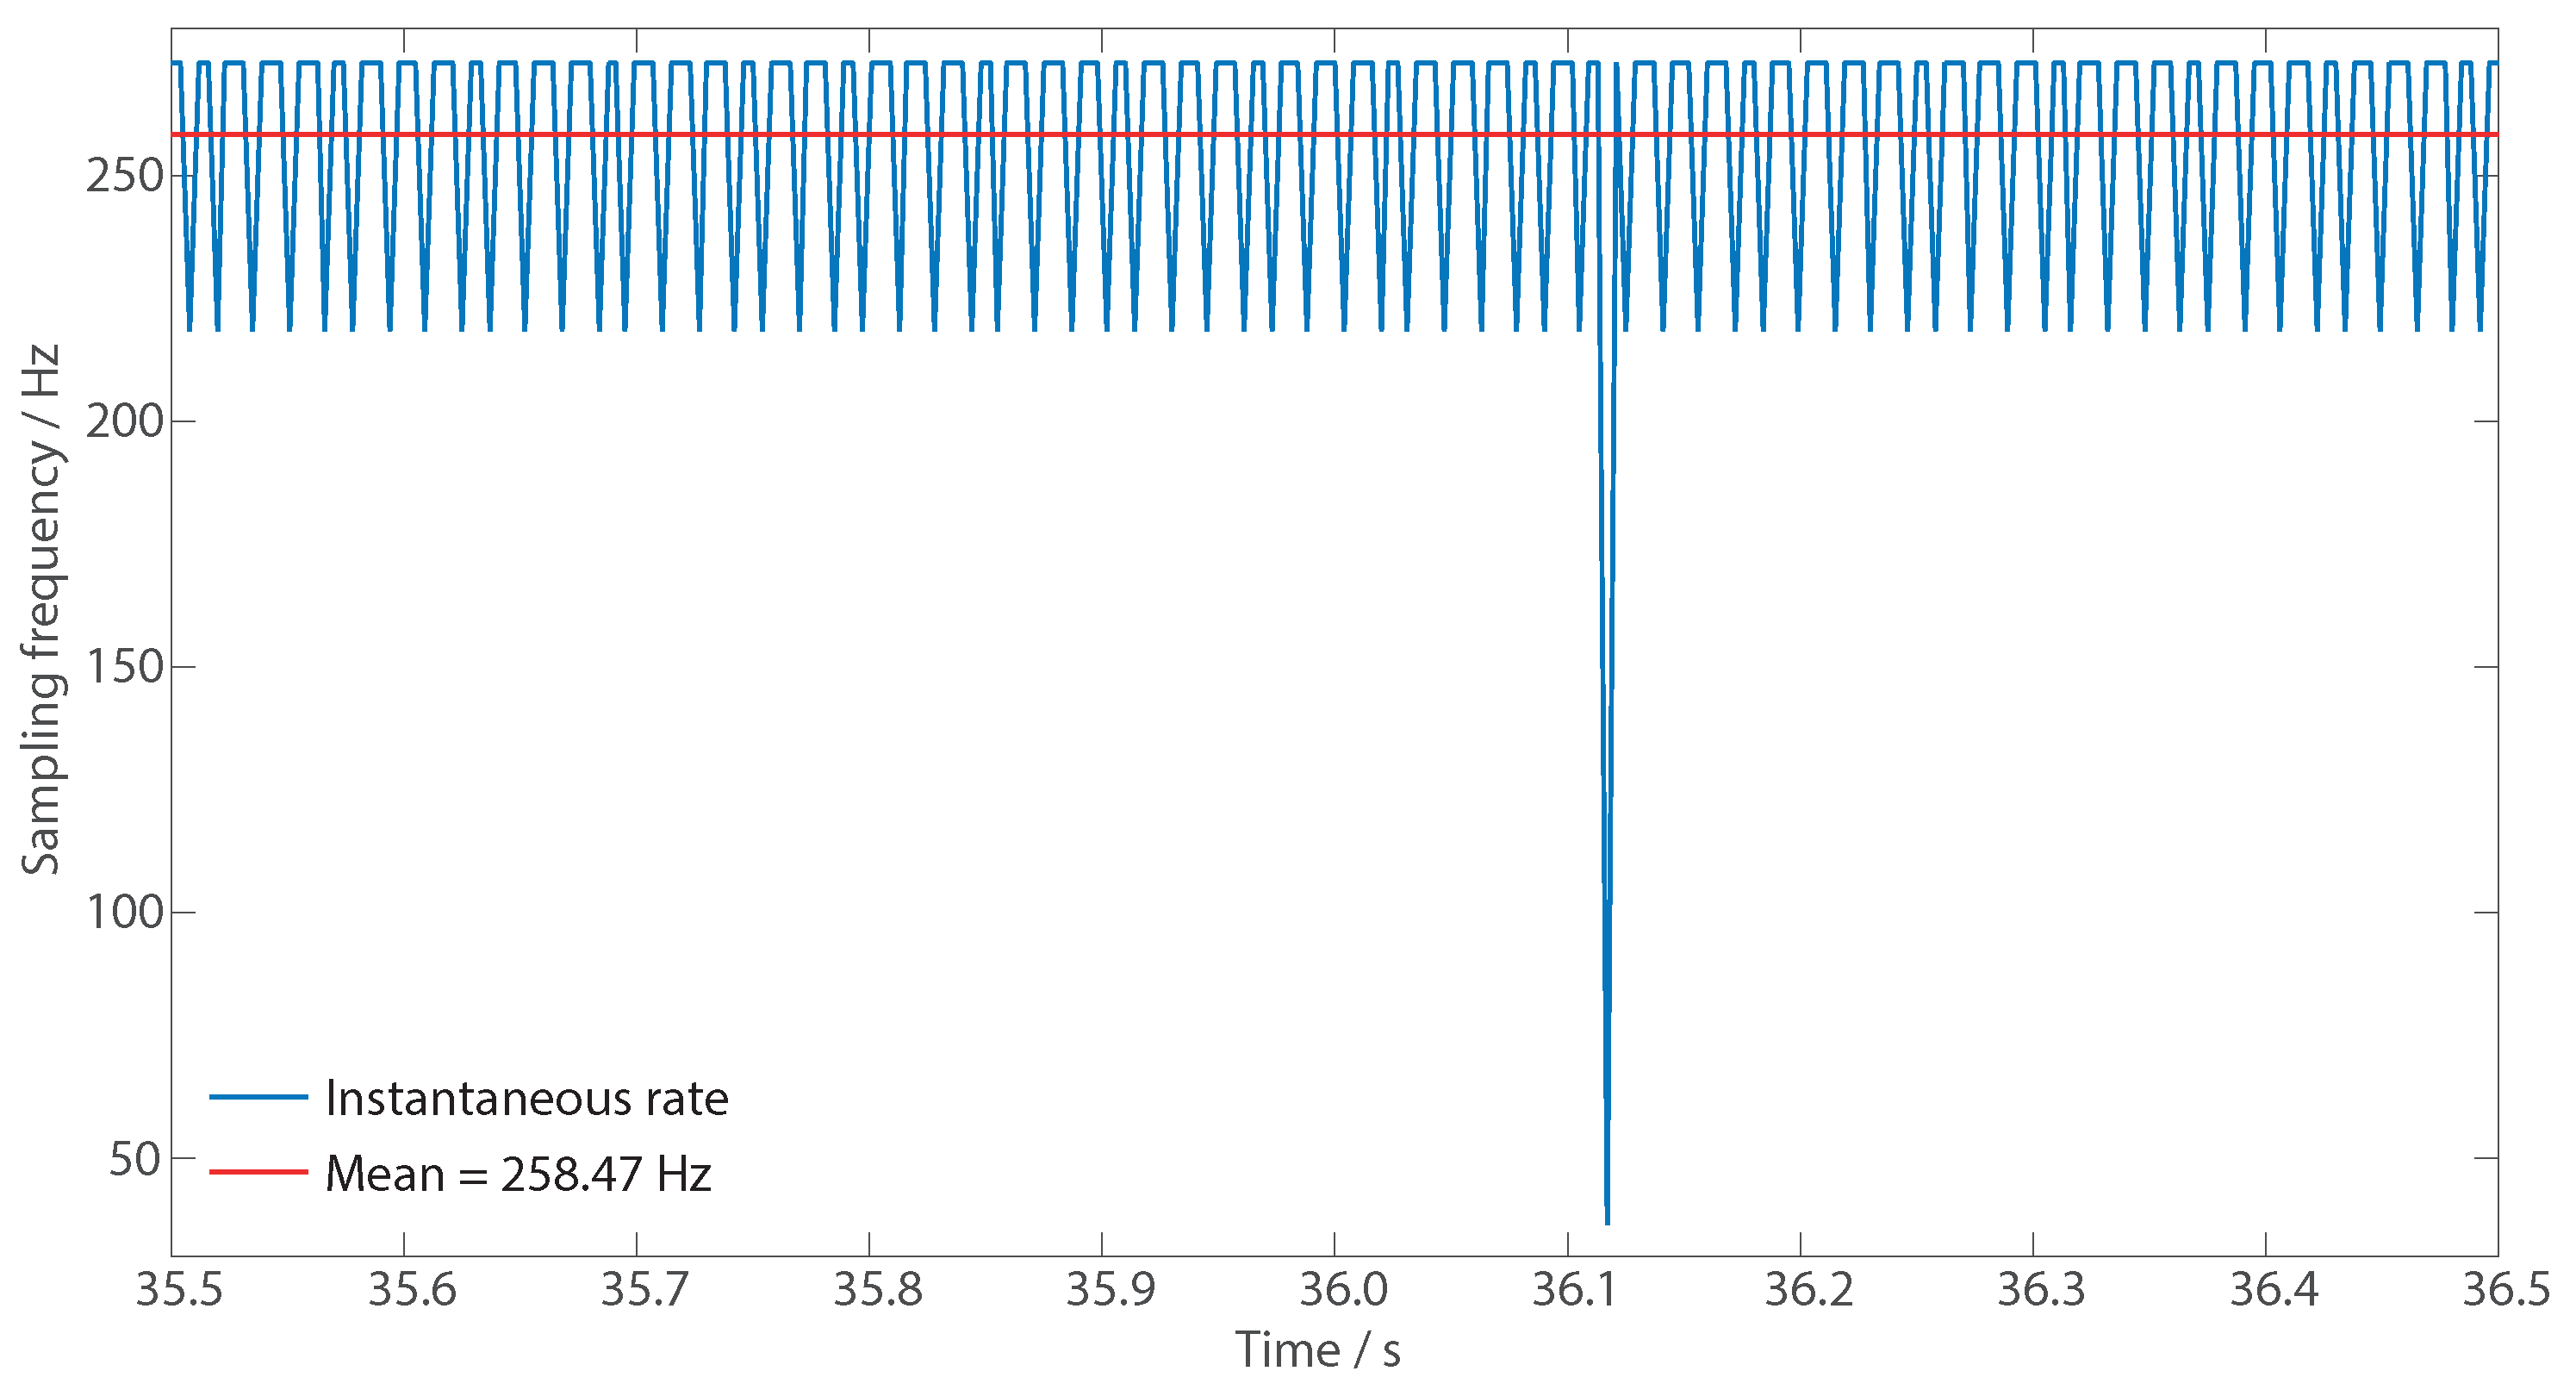
| Sample times for all signals apart from ECG | s | Sample times to help with data synchronization as discussed in Section 4. These values wrap 0–60 s. |
| R peak times | s | Times of ECG R peaks identified by hand, referenced to time 0 s at the start of the record. |
| Subject ID | Walk | Run | Exercise Activity | |
|---|---|---|---|---|
| Low-Resistance Bike | High-Resistance Bike | |||
| 1 | 9:48 | – | 9:39 | 9:48 |
| 2 | 6:39 | – | 5:41 | 6:54 |
| 3 | 4:47 | 5:07 | 4:54 | 4:41 |
| 4 | – | 4:52 | – | – |
| 5 | – | 5:08 | 4:40 | – |
| 6 | 5:36 | 5:02 | 4:40 | – |
| 8 | 6:42 | 4:47 | – | – |
| 9 | 3:40 | – | – | – |
| Subject ID | Walk | Run | Exercise Activity | |
|---|---|---|---|---|
| Low Resistance Bike | High Resistance Bike | |||
| 1 | 0.91 | – | 0.56 | 0.32 |
| 2 | 1.21 | – | 0.34 | 0.19 |
| 3 | 0.59 | 0.14 | 0.12 | 0.19 |
| 4 | – | 0.14 | – | – |
| 5 | – | 0.96 | 0.63 | – |
| 6 | 0.16 | 0.20 | 0.20 | – |
| 8 | 0.65 | 0.56 | – | – |
| 9 | 0.10 | – | – | – |
© 2016 by the authors; licensee MDPI, Basel, Switzerland. This article is an open access article distributed under the terms and conditions of the Creative Commons Attribution (CC-BY) license (http://creativecommons.org/licenses/by/4.0/).
Share and Cite
Jarchi, D.; Casson, A.J. Description of a Database Containing Wrist PPG Signals Recorded during Physical Exercise with Both Accelerometer and Gyroscope Measures of Motion. Data 2017, 2, 1. https://doi.org/10.3390/data2010001
Jarchi D, Casson AJ. Description of a Database Containing Wrist PPG Signals Recorded during Physical Exercise with Both Accelerometer and Gyroscope Measures of Motion. Data. 2017; 2(1):1. https://doi.org/10.3390/data2010001
Chicago/Turabian StyleJarchi, Delaram, and Alexander J. Casson. 2017. "Description of a Database Containing Wrist PPG Signals Recorded during Physical Exercise with Both Accelerometer and Gyroscope Measures of Motion" Data 2, no. 1: 1. https://doi.org/10.3390/data2010001