Article

Investigating the Evolution of Linkage Dynamics among Equity Markets Using Network Models and Measures: The Case of Asian Equity Market Integration

by
Biplab Bhattacharjee
1,
Muhammad Shafi
1 and
Animesh Acharjee
2,3,4,*
1
School of Management Studies, National Institute of Technology, Calicut 673601, Kerala, India
2
Department of Biochemistry, Sanger Building, University of Cambridge, 80 Tennis Court Road, Cambridge CB2 1GA, UK
3
Institute of Cancer and Genomic Sciences, Centre for Computational Biology, University of Birmingham, Birmingham B15 2TT, UK
4
Institute of Translational Medicine, University Hospitals Birmingham NHS, Foundation Trust, Birmingham B15 2TT, UK
*
Author to whom correspondence should be addressed.
Submission received: 8 November 2017 / Revised: 5 December 2017 / Accepted: 5 December 2017 / Published: 9 December 2017

Abstract

:
The state of cross-market linkage structures and its stability over varying time-periods play a key role in the performance of international diversified portfolios. There has been an increasing interest of global investors in emerging capital markets in the Asian region. In this setting, an investigation into the temporal dynamics of cross-market linkage structures becomes significant for the selection and optimal allocation of securities in an internationally-diversified portfolio. In the quest for this, in the current study, weighted network models along with network metrics are employed to decipher the underlying cross-market linkage structures among Asian markets. The study analyses the daily return data of fourteen major Asian indices for a period of 14 years (2002–2016). The topological properties of the network are computed using centrality measures and measures of influence strength and are investigated over temporal scales. In particular, the overall influence strengths and India-specific influence strengths are computed and examined over a temporal scale. Threshold filtering is also performed to characterize the dynamics related to the linkage structure of these networks. The impacts of the 2008 financial crisis on the linkage structural patterns of these equity networks are also investigated. The key findings of this study include: a set of central and peripheral indices, the evolution of the linkage structures over the 2002–2016 period and the linkage dynamics during times of market stress. Mainly, the set of indices possessing influence over the Asian region in general and the Indian market in particular is also identified. The findings of this study can be utilized in effective systemic risk management and for the selection of an optimally-diversified portfolio, resilient to system-level shocks.

1. Introduction

In the field of international finance, the investigation into the integration patterns of the capital market has gained prominence because of its associated significance in financial decision making in the areas of portfolio diversification and asset allocation. Contrary to the segmented capital markets, which offer higher leverage for international diversification, the capital market indices with high interdependencies provide lesser benefits of the international diversification exercise [1]. Hereof, it is critical for policymakers and fund managers to realize that there exist financial integrations of varying degrees, each of which has ramifications on various far-reaching issues affecting the domestic economy. Some of the issues that are prone to be impacted by the direction of market integration are the steadiness of the domestic economy and the shock-absorbance capability of the local economy to disturbances arising out of the enhanced market return volatility or cross-market capital flow reversals.
Several studies have observed that the state of the country-specific domestic market seems to be enjoying one of the following statuses: completely integrated market, segmented market or partially-segmented market [2]. The information regarding the state of cross-market linkage structures, especially during different market conditions, is an important factor to be considered in deciding the selection of securities and their optimum allocation to the portfolio. This is more significant in cases where the portfolio has been designed based on the historical correlational structure of markets, and such structures do not stay robust during times of market stress; hence, the whole exercise of diversification becomes futile. In this context, studying the evolutionary trends of cross-market linkage structures and their behaviour during periods of market crisis is an interesting case for investigation.
The earlier studies [3,4,5,6] on cross-market linkage structures in Asia have demonstrated that over the years, there has been a steady incline in the correlation structures among the market indices. Other related studies like [7,8,9,10,11] have reported mixed empirical evidence concerning both the long-run and the short-run relationships in Asian markets. Considering this, the empirical support of the scale of financial integration amongst Asian capital markets has been incomplete and unsatisfying. The majority of earlier studies on Asian cross-market integration have employed econometrics techniques, which rest on the assumptions of the rationality of market participants and the ‘i.i.d. distribution’ of asset returns. However, in the real case of international market pricing, these assumptions do not truly hold ground. The econophysics methods and techniques have provided an alternative way of deciphering the cross-market financial time series. There have been many econophysics-based network modelling studies on financial correlations of time series data captured from equity market transactions [12,13,14,15,16,17,18,19,20,21,22,23,24,25].
Several of these studies have focused on cross-market linkage structures amongst global markets; however, very little attention has been paid to the complex network modelling of cross-market indices in Asia. The only study to attempt this was by Sensoy and Tabak [26]. The study obtained some initial exploratory insights of the equity market network amongst Asian market indices. However, this study focused predominantly on the static nature of segmentation. The dynamics of connectedness in different market conditions have been mostly ignored. Our study performs a deeper analysis with a completely different methodological approach and identifies a set of isolated markets in Asia that stay disjointed during times of financial crisis. The central and peripheral market indices in the Asian equity network are also identified. The study captures the overall influence strengths and the India-specific influence strengths of Asian markets’ indices.
In this investigation, we have utilized the weighted cross-correlation values as measures for cross-market integration. The study by Pukthuanthong and Roll [27] contends that simple correlations of market index returns are inadequate in the theoretical sense, and this measure gives an empirically incomplete and prejudiced portrayal of true cross-market integration scenarios. In cases wherein there exist several numbers of global factors (arbitrage pricing theory or factors contributed by industrial linkages), one cannot truly rely on such a measure. The study by Volosovych [28] has relied on principal component analysis for examining the cross-market integration among various market indices, and the author has argued that this measure is not susceptible to outliers (or heavy-tailed distributions that are customarily encountered with asset pricing distributions). The author also contends that this measure takes into consideration shocks of both country-specific and global forms, and thereby, it is able to capture the trends in cross-market integration more precisely than the estimate of simple correlations. The study by Billio et al. [29] has suggested that any measure employed for capturing the cross-market integration patterns should satisfy the following conditions: (i) the easy accessibility of the data to be investigated; (ii) trustworthiness of the data source; (iii) economic meaningfulness of the measures; and (iv) the easiness with which one can build and update the measures. The measure in the current network-based study is the weighted cross-correlation coefficients, and this measure fulfils all the above pre-conditions. Additionally, the weighted cross-correlation coefficients are also insusceptible to heavy-tailed distributions. Thereby, this measure fits well in the scheme of quantifying cross-market integrations from market indices’ datasets.
The current study employs an econophysics-derived weighted network modelling approach adapted from the studies by Bhattacharjee et al. [30] and Kim et al. [31,32]. This is followed by network filtering protocols to generate information-rich, noise-poor sparse graphs possessing relevant connectivity structures. The temporal variation of the linkage structures obtained after being threshold filtered is examined. This is done with the intention of characterizing the evolution of the correlation structures among cross-market securities and for quantifying its persistence. The investigation of the cross-market linkage structures among Asian capital markets in the current study is examined at four levels. First, the evolutionary trend of the integration patterns over the past 14 years is analysed. The second level of analysis attempts to identify the potential positions (central or peripheral) and the possible role that would be played by different Asian markets in the event of possible shock transmission to the integrated financial system. The shock transmission, in this case, may be due to the influence of diverse types of events originating from any domestic, regional or international source. In the third-level analysis, the transformation in the cross-market linkage patterns during the 2008 financial crisis is examined, and the consequences of such changes on an investable portfolio are identified. The fourth-level analysis pertains to the identification, characterization and quantification of the influence relationships of Asian markets with each other and with India in particular. This analysis attempts to identify the potential sets of Asian markets having the highest influence over peer markets in Asia and India, respectively.
On the whole, the present study endeavours to address the following queries: What is the extent of integration amongst Asian capital markets? What stages of evolution in the integration structure have the Asian capital markets gone through over the past 14 years? In the Asian region, what is the current state of cross-market integration? Is the equity market integration at a progressive state, or is at a standstill position, or is the market integration at a regressive state? Are these segmentation patterns stable over an extended time frame? Which Asian indices enjoy the central and peripheral positions in an integrated financial system? Does the centrality or peripherality of the Asian indices vary with time? Which Asian market indices have had the highest influence on the remaining indices in the integrated connectivity structures? Which Asian indices have the highest influence on the Indian equity market in the last fourteen years (2002–2016)? Does the 2008 crisis period have any bearing on the cross-market segmentation patterns in Asia?

2. Related Works

2.1. Dependencies in Financial Time Series

Several studies have investigated the dependencies in financial time series using linear dependencies and non-linear dependencies. The absenteeism of linear dependencies in financial timer series does not essentially indicate an independent behaviour; rather, it demonstrates simply an absence of linear autocorrelation. Many empirical studies have adopted tests originally developed in the physics domain to assess linear and non-linear dependencies in financial time series, and those tests have reported non-linear patterns in many time series data of economies and financial fields [33,34]. The works by Campbell et al. [35] and others have contended that imperfections and some topological properties of market microstructure might lead to a situation where postponement of the reaction to fresh information happens. This all implies that the non-linear dependencies in asset pricing contributes to the changes in capital markets. Non-linear dependencies in financial time series have also been investigated in several studies. The study by Bampinas and Panagiotis [36] examined the linear, non-linear and temporally-varying causality patterns among commodity prices using linear and non-linear Granger causality tests. The same authors have performed another study on causality patterns among commodity prices using another non-linear approach, namely the Gaussian correlation approach [37]. The studies also examined the causal relationships between those time series during periods of market stress. The next section elaborates on the existing methodologies, both measures of the strength of cross-market integration and indicators of cross-market integration in temporal scales.

2.2. Existing Methodologies

Several researchers investigating market integration have proposed different measures taking into account the conditions of the dynamics of cross-market integration structures, the robustness of the measure in varying market conditions and the stochastic interdependence and heteroscedasticity of the measure. Some of the measures of cross-market integration discussed by other researchers are summarized in Table 1.

2.3. Existing Results

Several studies employing different methodologies have reported mixed findings of the cross-market integration analysis amongst Asian markets during the normal periods and the period of Asian market crisis. The results obtained from some of these studies are summarized in Table 2.

3. Materials and Methods

3.1. Data

In this study, we have considered a total of 14 Asian indices from among the Asian countries. The countries in Asia whose indices were considered for the current study are India, China, Sri Lanka, Malaysia, Pakistan, Indonesia, Israel, Hong Kong, Japan, Jordan, The Philippines, Taiwan, South Korea and Singapore. There were two reasons for selecting these indices: first, the aforementioned countries are the greatest emerging economies in Asia, and second, they have been financially liberated to a large extent, which has resulted in the transformation of their equity markets to a relatively developed form. The data taken up were for a period of 14 years from 1 January 2002–31 January 2016 (3511 data points). The daily closing prices of the benchmark indices of these stock markets were retrieved in their local currencies from Yahoo Finance, Investing.com and the Thomson Reuters Eikon database. There was no currency transformation step undertaken during the retrieval of the historical closing prices of the market indices. This kind of measure was taken because of three reasons: (i) to avoid issues related to currency transformation owing to exchange rate fluctuations; (ii) to fend off the restrictive belief that is customarily embraced of the relative purchasing power parity concept; and (iii) to focus on local currencies, as concentrating on this line directs the efforts towards understanding the stock market interdependence as an outcome of domestic causes. The study by Leong and Felmingham [55] advocates the use of local currency for cross-market interdependency studies in equity markets, as conversion of these indices into a common currency (supposedly USD) will lead to distortion of the real effects of both the local country-specific domestic economic conditions and domestic economic policies. Sometimes, the values of the closing prices of some of the indices were missing on certain days. In such circumstances, the missing values were replaced by the previous working day’s closing price. The final data sample consisted of 3511 data points (trading days) representing closing price data of fourteen years.

3.2. Steps in Building Asian Indices Weighted Network Model

The detailed procedure for the construction of the weighted indices network model is described below. First, the weights that are to be assigned to the edges of the weighted network are computed. Using Equation (1), the daily log returns of the market indices are initially computed for the 3511 trading days.
S i = ln ( C P t C P t 1 )
Here, CPt refers to the daily closing price of the respective Asian indices in the local currency on the tth day, and CPt−1 refers to the daily closing price of the respective Asian index on the previous working day, i.e., on the (t − 1)th day. This resulted in the generation of 3510 log returns dataset (the number of the closing prices minus one) in the respective local currencies. The log returns dataset represents 14 years.
Econometric studies on market integration in Asia have either used the weekly or the daily closing prices. In the current study, the weighted networks are built from the daily prices of the market indices at closing times. The advantage of using weekly datasets for such an analysis is that they can handle the time asynchronous nature of different capital markets. However, by utilizing the daily dataset, one can feasibly capture the linkages that are the outcomes of swift information transmission activities in cross-market scenarios. Both the long-run and short-run linkage dynamics can hence be captured, whereas in weekly data analysis, the short-run linkage dynamics are neglected. In today’s international financial systems, wherein IT-based online trading, payment and settlement systems are in place in all cross-geographical markets, the capturing of higher frequency data, such as daily data, would provide better insights about cross-market linkage patterns [56,57]. Thus, using daily data, the cross-market linkage analysis can be performed better at a micro-level than that of weekly data. All the Asian market indices considered in the present study have their trading hours operating on the same day. Many of them have overlapping trading hours, so simultaneous information transmission is also possible in those markets, and that would get reflected in their network structures. The study by Leonidas Sandoval Junior [58] has employed Eigen vector e2 (associated with the second largest Eigen value) to assess whether the markets operating in non-synchronous time-frames have significant alterations in their equity networks. The study highlighted that the equity networks are robust enough to accommodate lagging or leading time-frames of the market indices. The study also contends that there is no statistically significant difference evident in network structures obtained from the closing prices datasets and the lagged (or leading) datasets.

3.2.1. The Rolling Window Approach

Investigating the temporal network linkage dynamics is also one of the key objectives of this study. In line with this objective, we employed the rolling window protocol to examine the temporal level variations of the topological measures of the weighted indices networks. On the combined dataset of 3510 log returns of 14 Asian indices, the rolling window approach was executed. As an outcome of the rolling window approach, the combined dataset was binned into 151 observations, each possessing a size of 500 data points (trading days), and each successive observation had a step-up window of 20 data points. Through this protocol, there was a generation of 151 temporally-synchronous observations corresponding to the fourteen years of data (1 January 2002 and 31 January 2016). For each of these 151 temporally-synchronous observations, representative weighted networks were built according to the methodology described below.

3.2.2. Computation of Weights of Edges in the Asian Indices Network

The studies by Kim et al. [31,32] and Bhattacharjee et al. [30] have evolved a methodology for the construction of weighted equity networks. We adopted a similar methodology for the computation of weights in the weighted networks of Asian market indices. For the construction of a weighted network of the market indices, we computed the residual log returns ‘Gi(t)’ and the weighted cross-correlation coefficients ‘wi,j
G i ( t ) = S i ( t ) 1 N i S i ( t )
where Si(t) is the daily log return of a market index i for a tth day as explained in Equation (1) and Gi(t) refers to the residual log return of a market index i for the tth day. The value of Gi is obtained by deducting the mean value of Si (mean value for the period of N trading days) from each of the values of Si(t), where the value of t represents 1–N days. Here, in this study, the value of N is 500 days (500 is the window size of each of the observations created by the protocol of the rolling window approach).
The past studies have established that the distribution of correlation coefficients of Si has a bell-shaped distribution, and the average value of this distribution is time-dependent, as well as a constant value of standard deviation measure exists for this distribution [59]. The mean value’s temporal-dependent behaviour may be possibly caused as a result of external economic environments. The external economic environmental fluctuations that could cause the variations in mean value are temporal changes in the inflation index, crude oil prices, bank interest rates and the exchange rates. On the other hand, the distribution of the weighted cross-correlation values wi,j are time-independent in behaviour [31]. Hence, the values of wi,j are more generic in nature and are more robust than the cross-correlation values of Si in capturing the cross-linkage strengths of Asian market indices.
The ‘weighted cross-correlation coefficient’ represented by wi,j is computed using the equation given below:
w i , j G i G j G i G j ( G i 2 G i 2 ) ( G j 2 G j 2 )

3.2.3. Weighted Network Model Building

The weighted cross-correlation coefficients of the 14 Asian indices for each of the 151 temporally-synchronous observations were computed. The weighted cross-correlation values of the 14 Asian indices can be represented by symmetric matrices with diagonal elements being one. Undirected weighted networks were generated using these weighted cross-correlation matrices as input files. For the generation of these networks, the igraph package in R was used [60].
Figure 1 shows a complete graph consisting of 14 vertices (representing 14 different indices belonging to 14 Asian countries) and 91 edges between them. The network exhibited here is a type of dense graph possessing 91 edges, wherein all the vertices have N − 1 edge connections.
The resultant weighted indices network can be described thusly: the network’s vertices are representative of the time series of the daily log returns of the individual indices, and between each pair (i,j) of nodes, there is an associated weight wi,j establishing the strength of the connectivity in the network model.

3.3. Computation of Network Metrics

In this study, the topological properties of the weighted indices network are inferred from the computation of the centrality measures and the influence strength measures. For the 151 weighted indices networks, the network metrics were computed and investigated over an aggregate scale (averaged) and temporal scale.

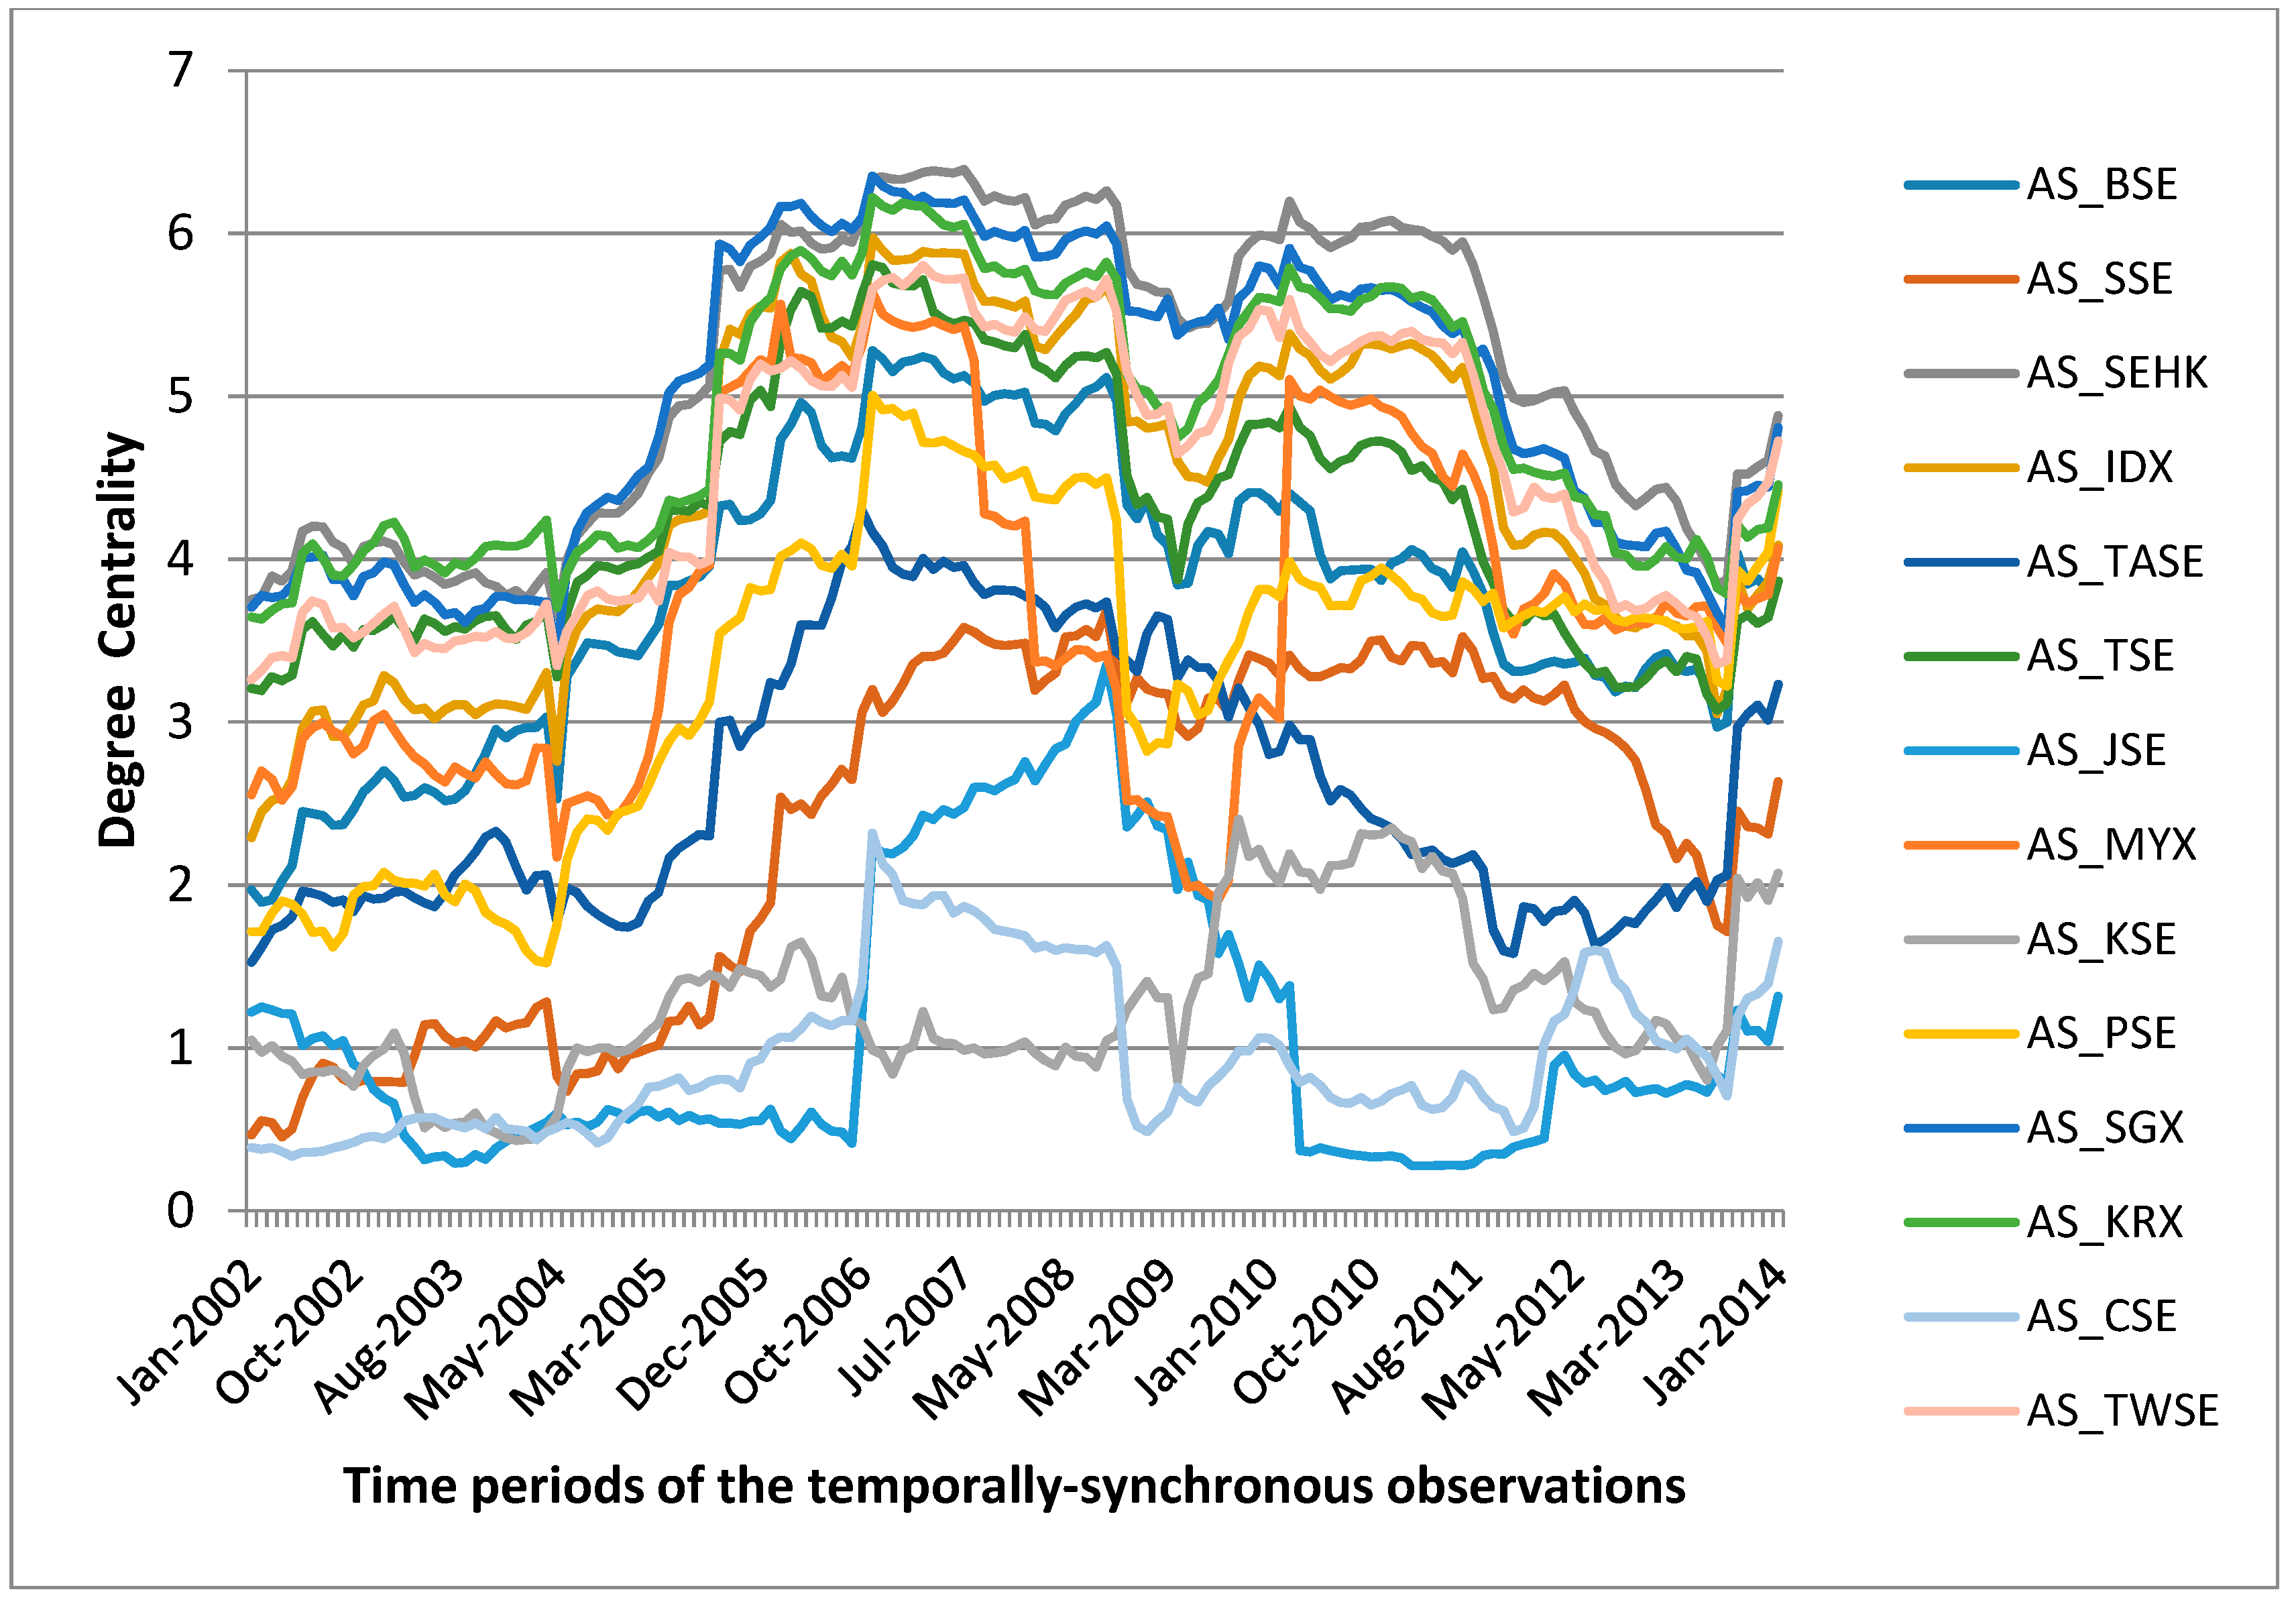
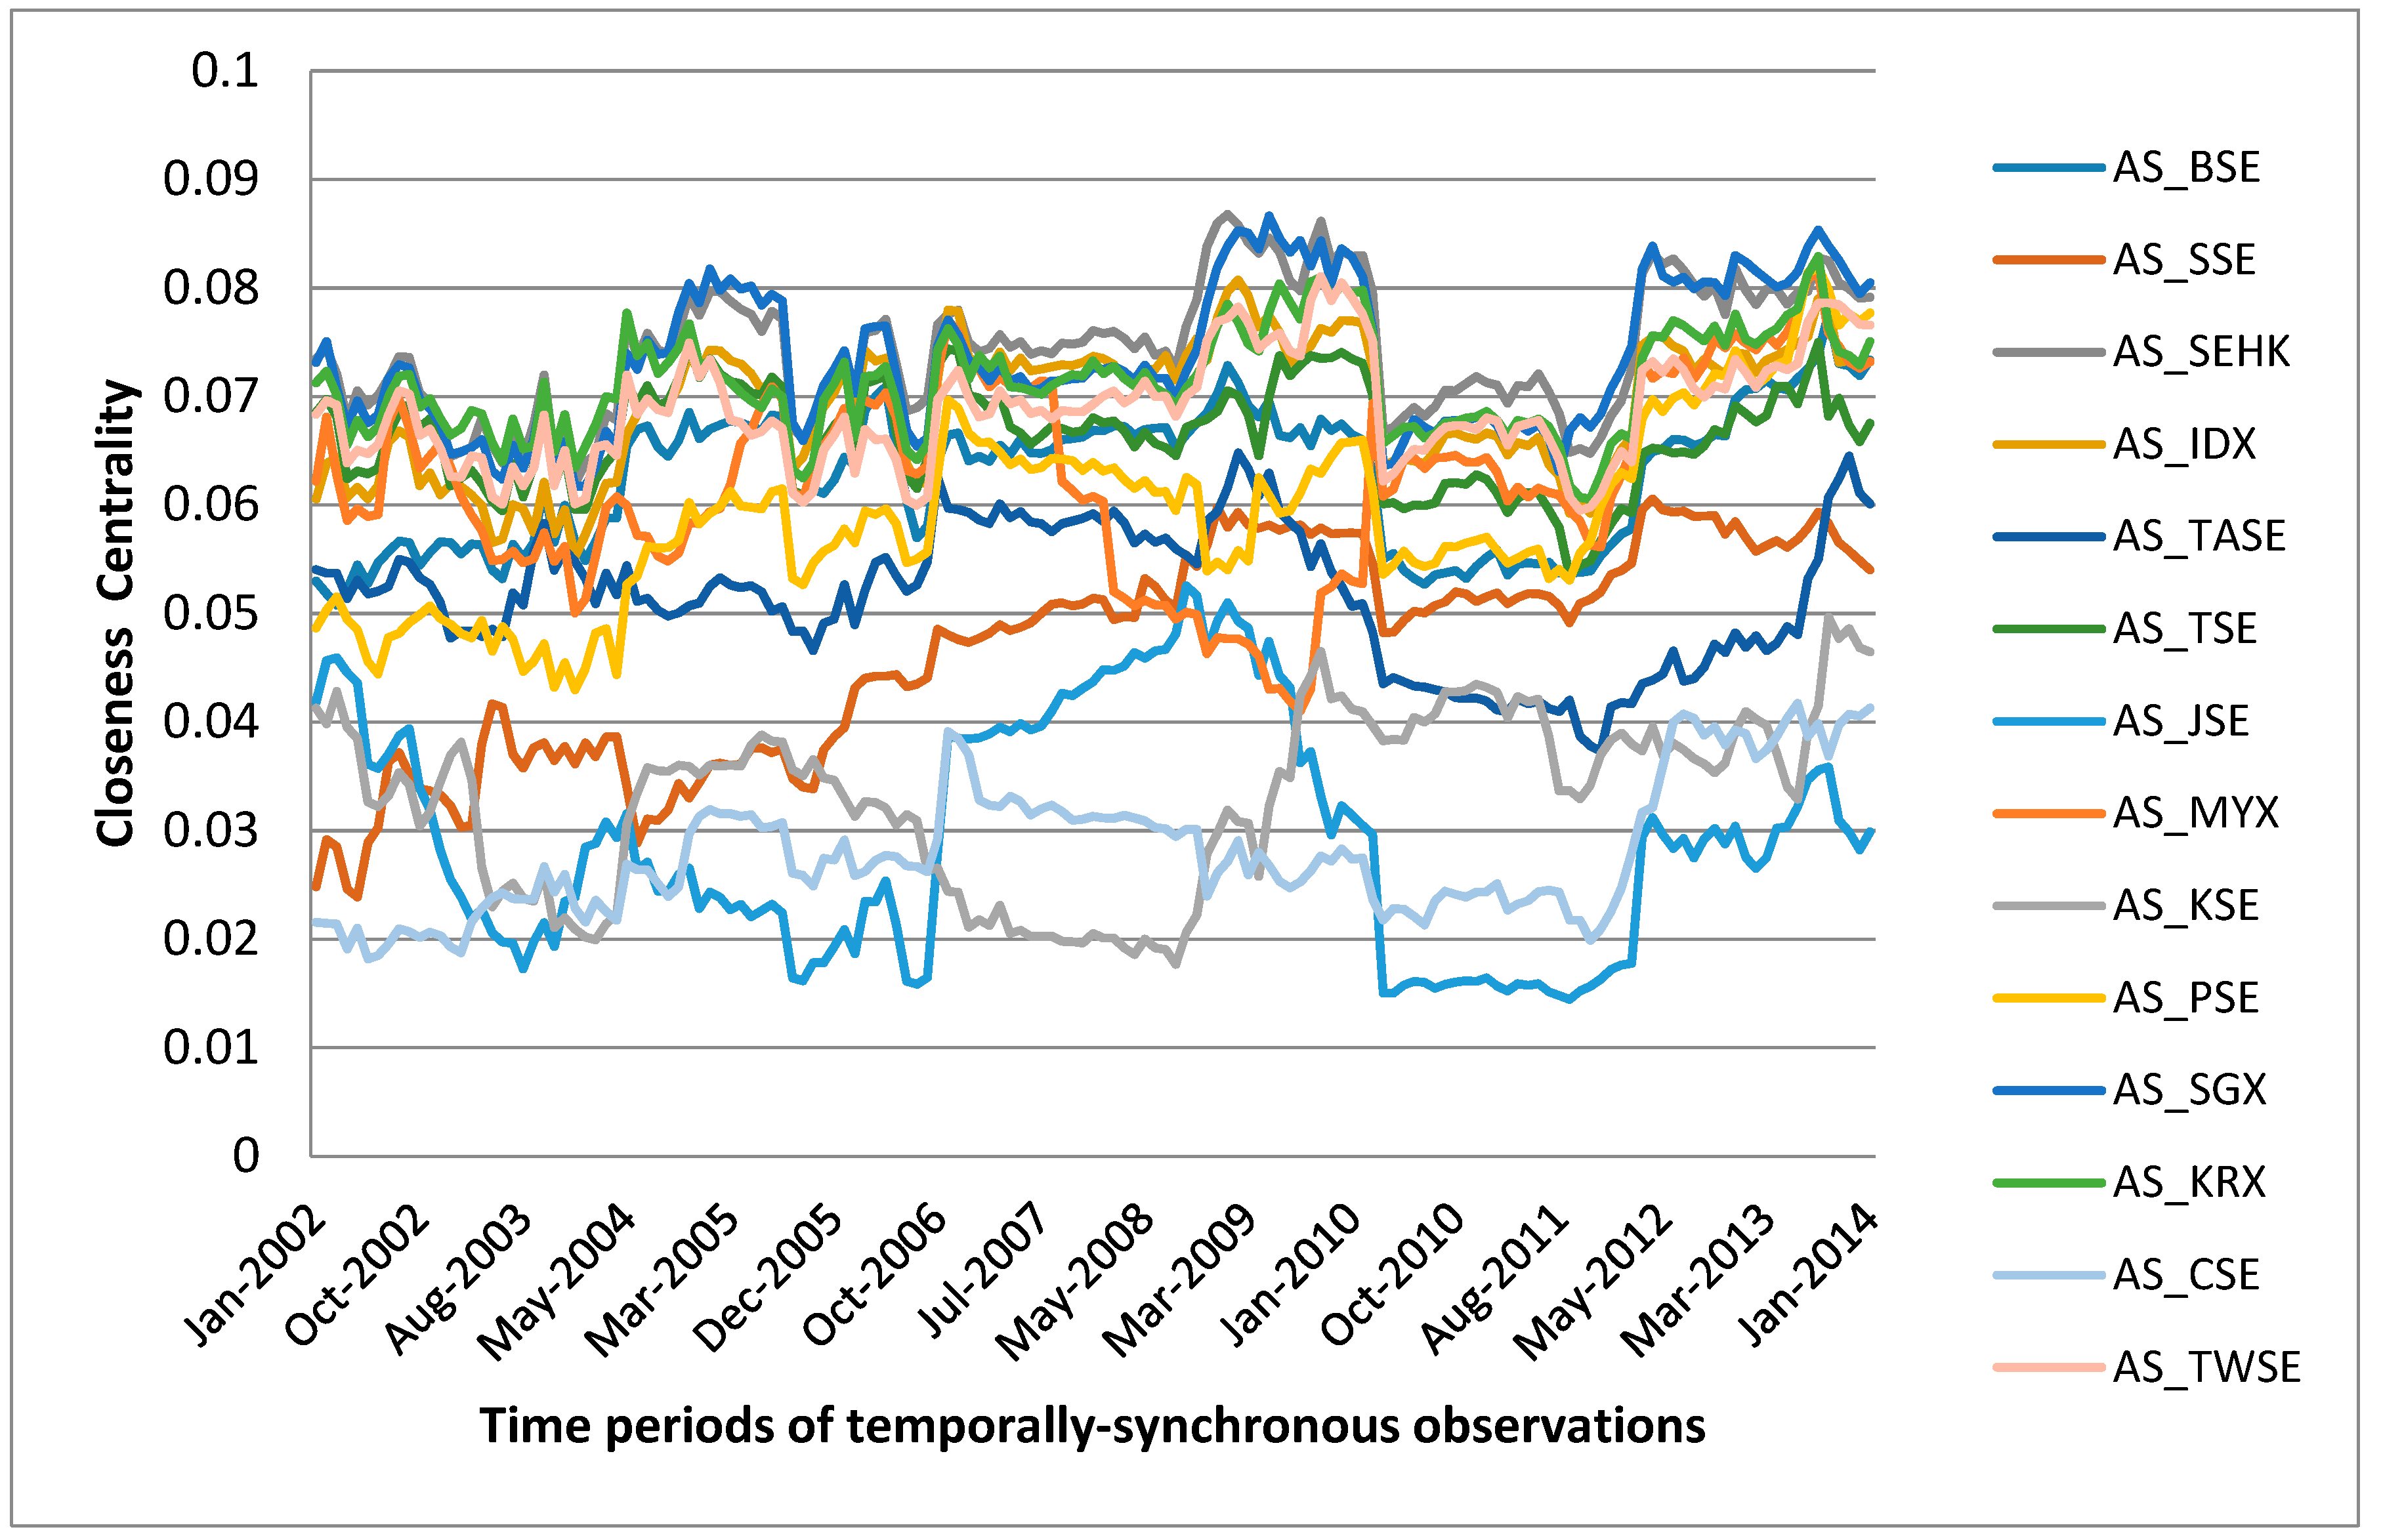
3.3.1. Centrality Measures

The degree centrality, closeness centrality and Eigen vector centrality for all the nodes (Asian indices) in the networks are computed here.
1. Degree centrality
The degree centrality of a given node is quantitatively expressed as the amount of adjacencies in a given network, viz., the quantity of nodes to which a given node has connectivity [61]. The first step in analysing any network structure is to compute the degree of nodes in the network, as it is a basic indicator of the connectivity structure [62,63,64]. In weighted networks, the degree centrality has been expressed as a summed up value of the weights of the edges of a given node connected to others in the network [62,65,66]. This network metric has been formalized in this manner:
C D w ( i ) = j N w i , j
where wij refers to the weighted adjacency matrix, wherein the value of wij is larger than zero in cases where there is a given connectivity between the nodes i and j. The wij value is the measure of the weight of the tie.
2. Closeness centrality
Closeness centrality was the next measure that was computed. This network metric gives a quantification of a vertex’s proximity to the remaining vertices present in the weighted indices network [67]. A relatively greater level of values of closeness centrality for a vertex is indicative of the vertex’s higher proximity to the other residual nodes in the network. For a weighted graph G, the closeness centrality for a given vertex k is computed by the following equation,
C D w ( i ) = j N w i , j
where dG (k,h) refers to the minimum distance between two vertices k and h.
3. Eigen vector centrality
The next metric that we computed for the weighted network model is the Eigen vector centrality. This measure is an extension of the degree centrality measure. The mathematical equation for the Eigen vector centrality measure for a typical weighted network is postulated in the paper by Newman [68]. This equation forms the foundation for the PageRank algorithm that was deployed in the Google search engine [69]. The basic conceptual element underlying this centrality measure is that the relevance of an edge is reliant exclusively on its linkage quality. This indicates that a node possessing connectivity to an extremely central node has relatively more weight in comparison to any other vertex having a connectedness to nodes maintaining lower centrality scores. For an unweighted network, the general mathematical form is expressed as:
x i = 1 λ j = 1 N A i j x j
where the Eigen vector centrality score for node i is indicated by the dependent variable xi, and in the left side of the equation, the parameter λ denotes a constant term. This constant term is expressed in the form of a vector-matrix system and is denoted by the following equation,
λ x = A x
where x denotes the Eigen vector of the adjacency matrix A possessing an Eigenvalue λ.
In this study, for the computation of the Eigen vector centrality of the weighted network, we use the equation postulated by Soh et al. [70].
C E w ( i ) = 1 λ j = 1 N A i j w i j x j
where the average weighted centrality of node i is referred to as x i w .
4. Average centrality
Next, the average centrality measure, which is the averaged value of the three centrality measures, was computed. In the current study, we quantifiably express the ‘average centrality’ values as the average of the degree centrality, the closeness centrality and the Eigen value centrality, each considered with equal weighting. This measure has been formalized as follows:
C a v g = 1 3 C D + 1 3 C C + 1 3 C E
where CD is the degree centrality, CC is the closeness centrality and CE is the Eigen vector centrality.
The mean value of the average centrality measure for the 151 observations and the temporally-varying graph of this measure were plotted. Based on the mean value of the average centrality measure, the top-ranked indices were selected as central indices and the bottom-ranked indices as peripheral indices.

3.3.2. Influence Strength Measures

In the influence strength measures, we performed a two-stage influence strength analysis. First, we computed the overall influence strength of the market index on the remaining market indices in Asia. The overall strength provides us with a measure of the total influence of a capital market on the entire Asian markets, and this will aid in the identification of the most and the least influential markets in the Asian region. Second, we computed the India-specific influence strength of each of the remaining 13 Asian market indices. This measure helps in identifying the most and the least influential markets in Asia in terms of the influence it has had on Indian capital market movements. The identification of influential Asian markets that have a profound influence on the Indian capital market will aid Indian fund investors searching for diversifying options in Asian markets. This analysis will provide insightful information to those investors about the countries in Asia that are the least prone to be influenced by impactful events from India and vice versa. There are many mutual funds operating in India that offer opportunities to invest in the Asian markets. Hence, India-specific influence relationship information would be useful for such mutual funds managers.
1. Overall influence strength of an index
The first measure that was computed was the overall influence strength. In a vertex Vi, connected with edges with associated edge weights wi,j , in this case, the influence strength [71] of Vi is computed using the following equation,
s i = j i w i , j
where wi,j stands for the weighted correlation coefficient of neighbours of vertex j. While computing the overall influence strength of a market index, the absolute measures of weights of edges are taken for summation.
2. India-specific influence strength of an index
The India-specific influence strengths of the 13 Asian indices in the network were computed next. We refer to the India-specific influence strength of an index as the weight of the edge connecting the Asian indices with the Indian market index (AS_BSE). The true measures of the weight are considered here without any sign conversions, so that directionality of the India-specific influence can be captured using this metric.
s i I n d i a = w i , j
where wi,j stands for the weights of the edges connecting any given Asian index to the Indian market index (AS_BSE), i stands for the 13 Asian indices (excluding India) and j refers to Indian market index (AS_BSE).
Both of these strength measures were computed for the 151 observations and were investigated in aggregated (averaged) and temporal scales. Based on the computed values of both the influence strength measures (overall influence strength ranking and India-specific influence strength) for 151 observations, the Asian indices were ranked in terms of their frequency of occurrence in the top four positions in both ranking tables.
After computation of the six network metrics for each of the 14 Asian market indices for the 151 observations, the network measures are visualized using temporal variation plots of a time-frame of 14 years (each plot has the continuous time-scale of the temporally-synchronous observation in the y-axis).

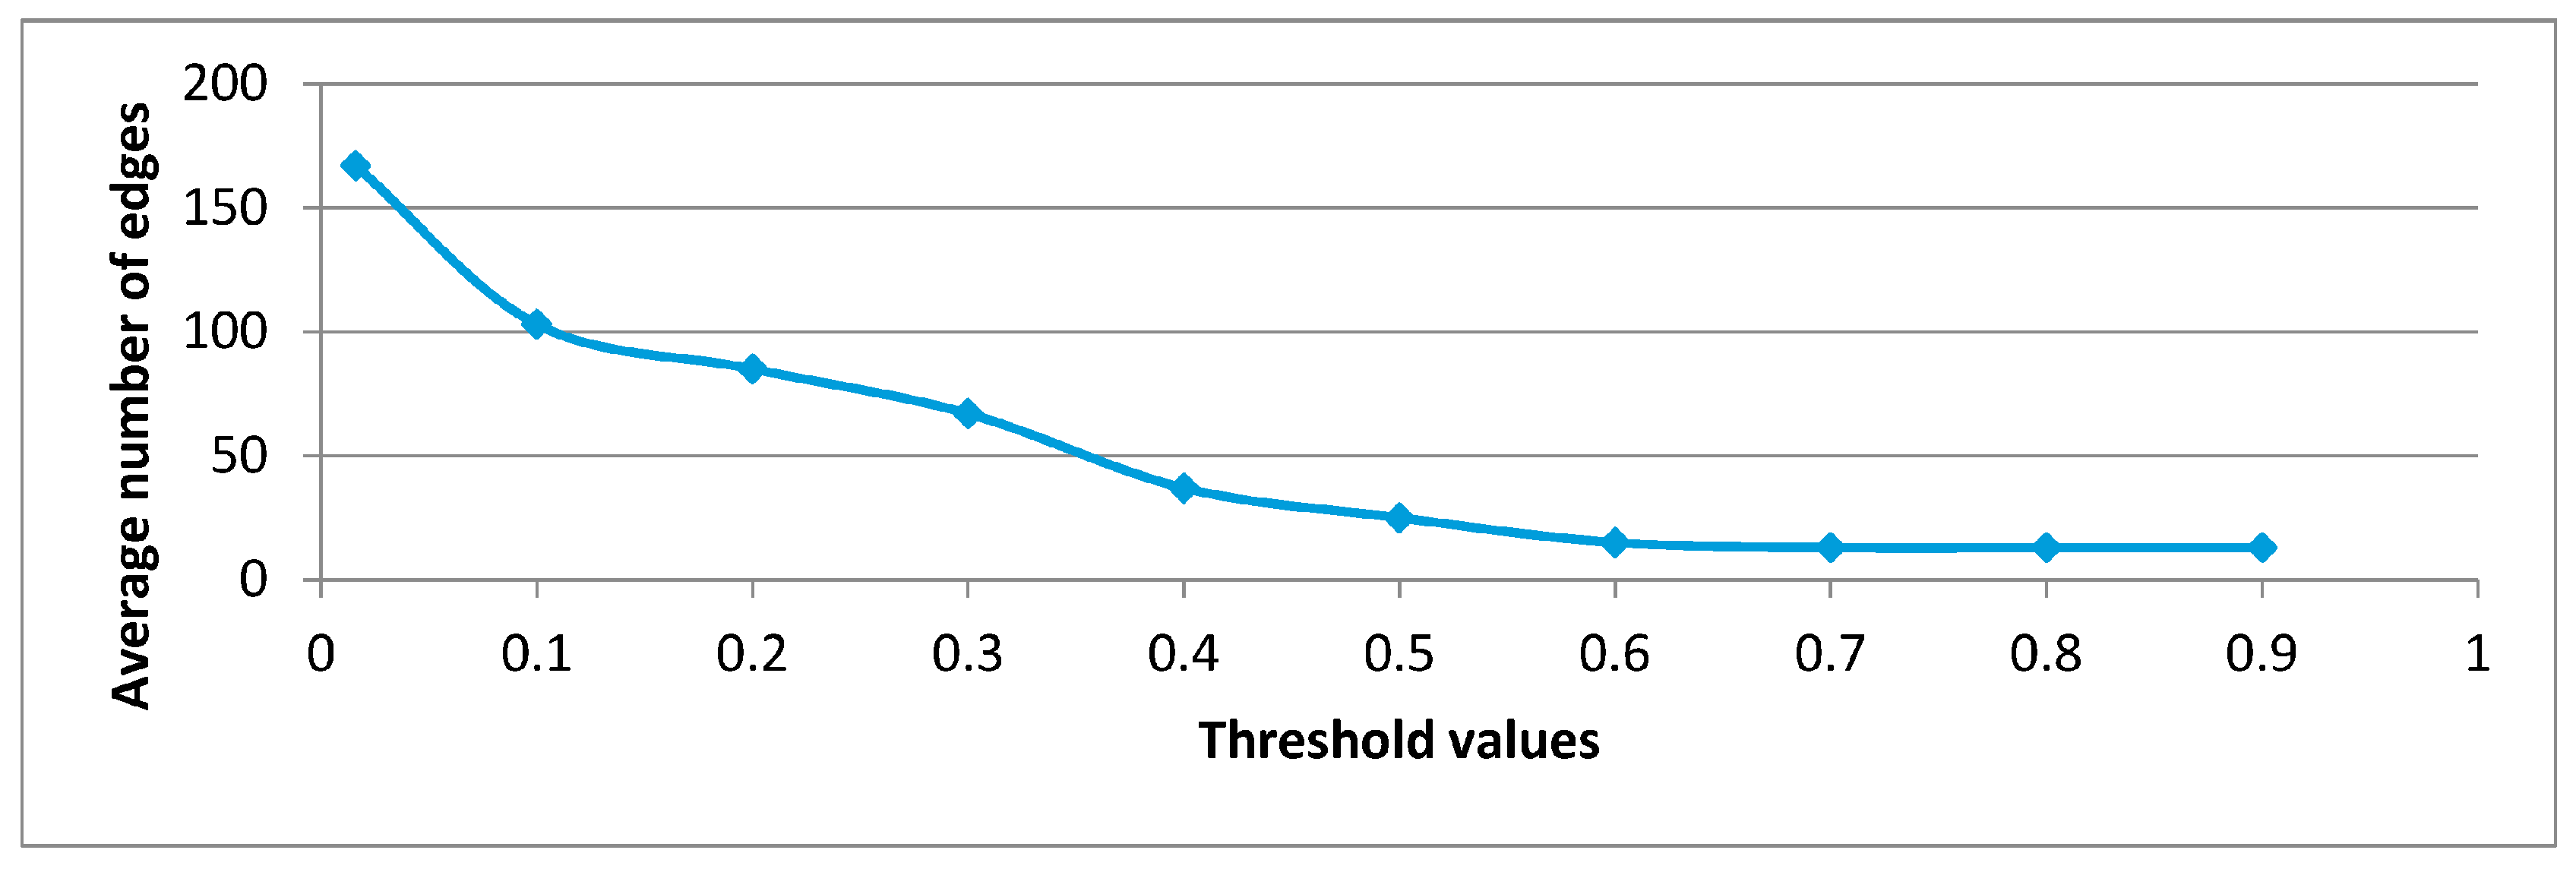
3.4. Threshold Filtering

In complex network models from financial time series data, the network structure of observed binary relationships is excessively dense in nature and may not have any immediate use unless filtering to some extent is performed. The topologies of such graphs tend to have an abundant number of noisy edge connections that should be eliminated so as to obtain the most significant edge connections. The first step in threshold filtering is to set an optimum threshold value for network filtering. The setting of this value is a trade-off amongst retrieval of too little information and retrieval of too much: complicated structures with a large associated noise. For identification of the threshold level, one has to theoretically explore all the possible values wherein the filtering of noise can take place and then detect a point where the maximization of noise filtering and the signal retention may occur. In doing so, one cannot apply any fixed rule of thumb since the edge weight distribution depends on several factors that are particular to the investigative study under consideration, the data source used and the time frames of the study. For detecting an appropriate optimal threshold level at which the filtered Asian indices network exhibits information-rich and noise-poor patterns, we used a first level optimization step. A very high value of threshold will result in a minimal number of significant edges; however, a lot of other significant pieces of information will be lost in the process. On the other hand, a very low value of threshold will result in a large number of edge connections, a significant portion of which will be noisy edges. Therefore, choosing a threshold value from the middle range is an appropriate option. In the current study, we adopted a strategy of maximum slope determination for fixing the optimum threshold value. A similar strategy has been adopted by an earlier study by Bhattacharjee et al. [30]. This strategy detects a point in the mid-range values in the edge weights wherein maximum variation may occur upon an iterative incremental change in the weight. In this strategy, we generated threshold filtered networks at values in the ranges between 0.00 and 0.8 (separated by 0.2 at each step-up). We performed threshold filtering for these range intervals for all 151 empirical observations. Once we obtained the threshold filtered networks for each of these point intervals of the range, the average of (average of 151 observations) the ‘number of edges’ of these filtered networks was computed at each interval point. Following this, the average values of the ‘number of edges’ obtained for each interval points were plotted (Figure 2) against the range of threshold values, each subsequent value separated by 0.1 spacing (the range of the threshold values lies between 0.001 and 0.8, and they are subsequently separated by 0.1). The interval point at which the minimum change in the slope is obtained was noted. This point is considered as the optimum threshold level for the network filtering purposes. In the current study’s dataset, the optimum threshold level was found to be 0.4.
All 151 complete weighted indices networks (generated from 151 temporally-synchronous observations) were filtered at the threshold point of 0.4. This resulted in the generation of 151 filtered networks of 14 Asian indices. In these filtered networks, edges connecting two nodes (Asian indices) exist only in cases wherein the edge weights (i.e., the weighted cross-correlation values) are equal to or higher than that of the optimal threshold value θ. In the filtered networks, the adjacent matrix A is expressed by,
A i , j = { 1 if   w i , j   > = θ   and   i j 0 otherwise
Further, the connectivity structures of the 151 filtered Asian indices networks were inspected visually, and insights regarding the status of cross-market segmentation were derived. For validating the network filtering approach adopted, the significance of detected edges obtained from the threshold filtering approach (at the optimum value of 0.4) was tested using null permutation models. The value of the False Discovery Rate (FDR) of the identified edge list for each of the 151 networks was then computed.

3.5. Segmentation Structure of Filtered Networks during the 2008 Crisis

For enquiring about the state of segmentation during the 2008 financial crisis, the Asian market indices’ returns were segregated into three time-frames: (i) pre-crisis period: 1 August 2006–15 September 2008; in this period, the study data possess 530 data points for each of the Asian indices; (ii) the crisis-period: 16 September 2008–21 July 2011; in this period, the study data possess 704 data points for each of the Asian indices; and (iii) post-crisis period: 22 July 2011–30 September 2013; in this time-frame, the study data possess 547 data points for each of the Asian indices. The current study adopted the time frames used in the study by Yang et al. [72] for the temporal segmentation of the pre-crisis, the crisis and the post-crisis periods. After performing the temporal segmentation steps, the weighted networks were built for each of the three observations employing similar methodologies explained in the earlier sections. Next, threshold filtering is performed on the three weighted networks (belonging to pre-crisis, crisis and post-crisis periods), and these networks are visually compared to decipher the segmentation patterns.

4. Results

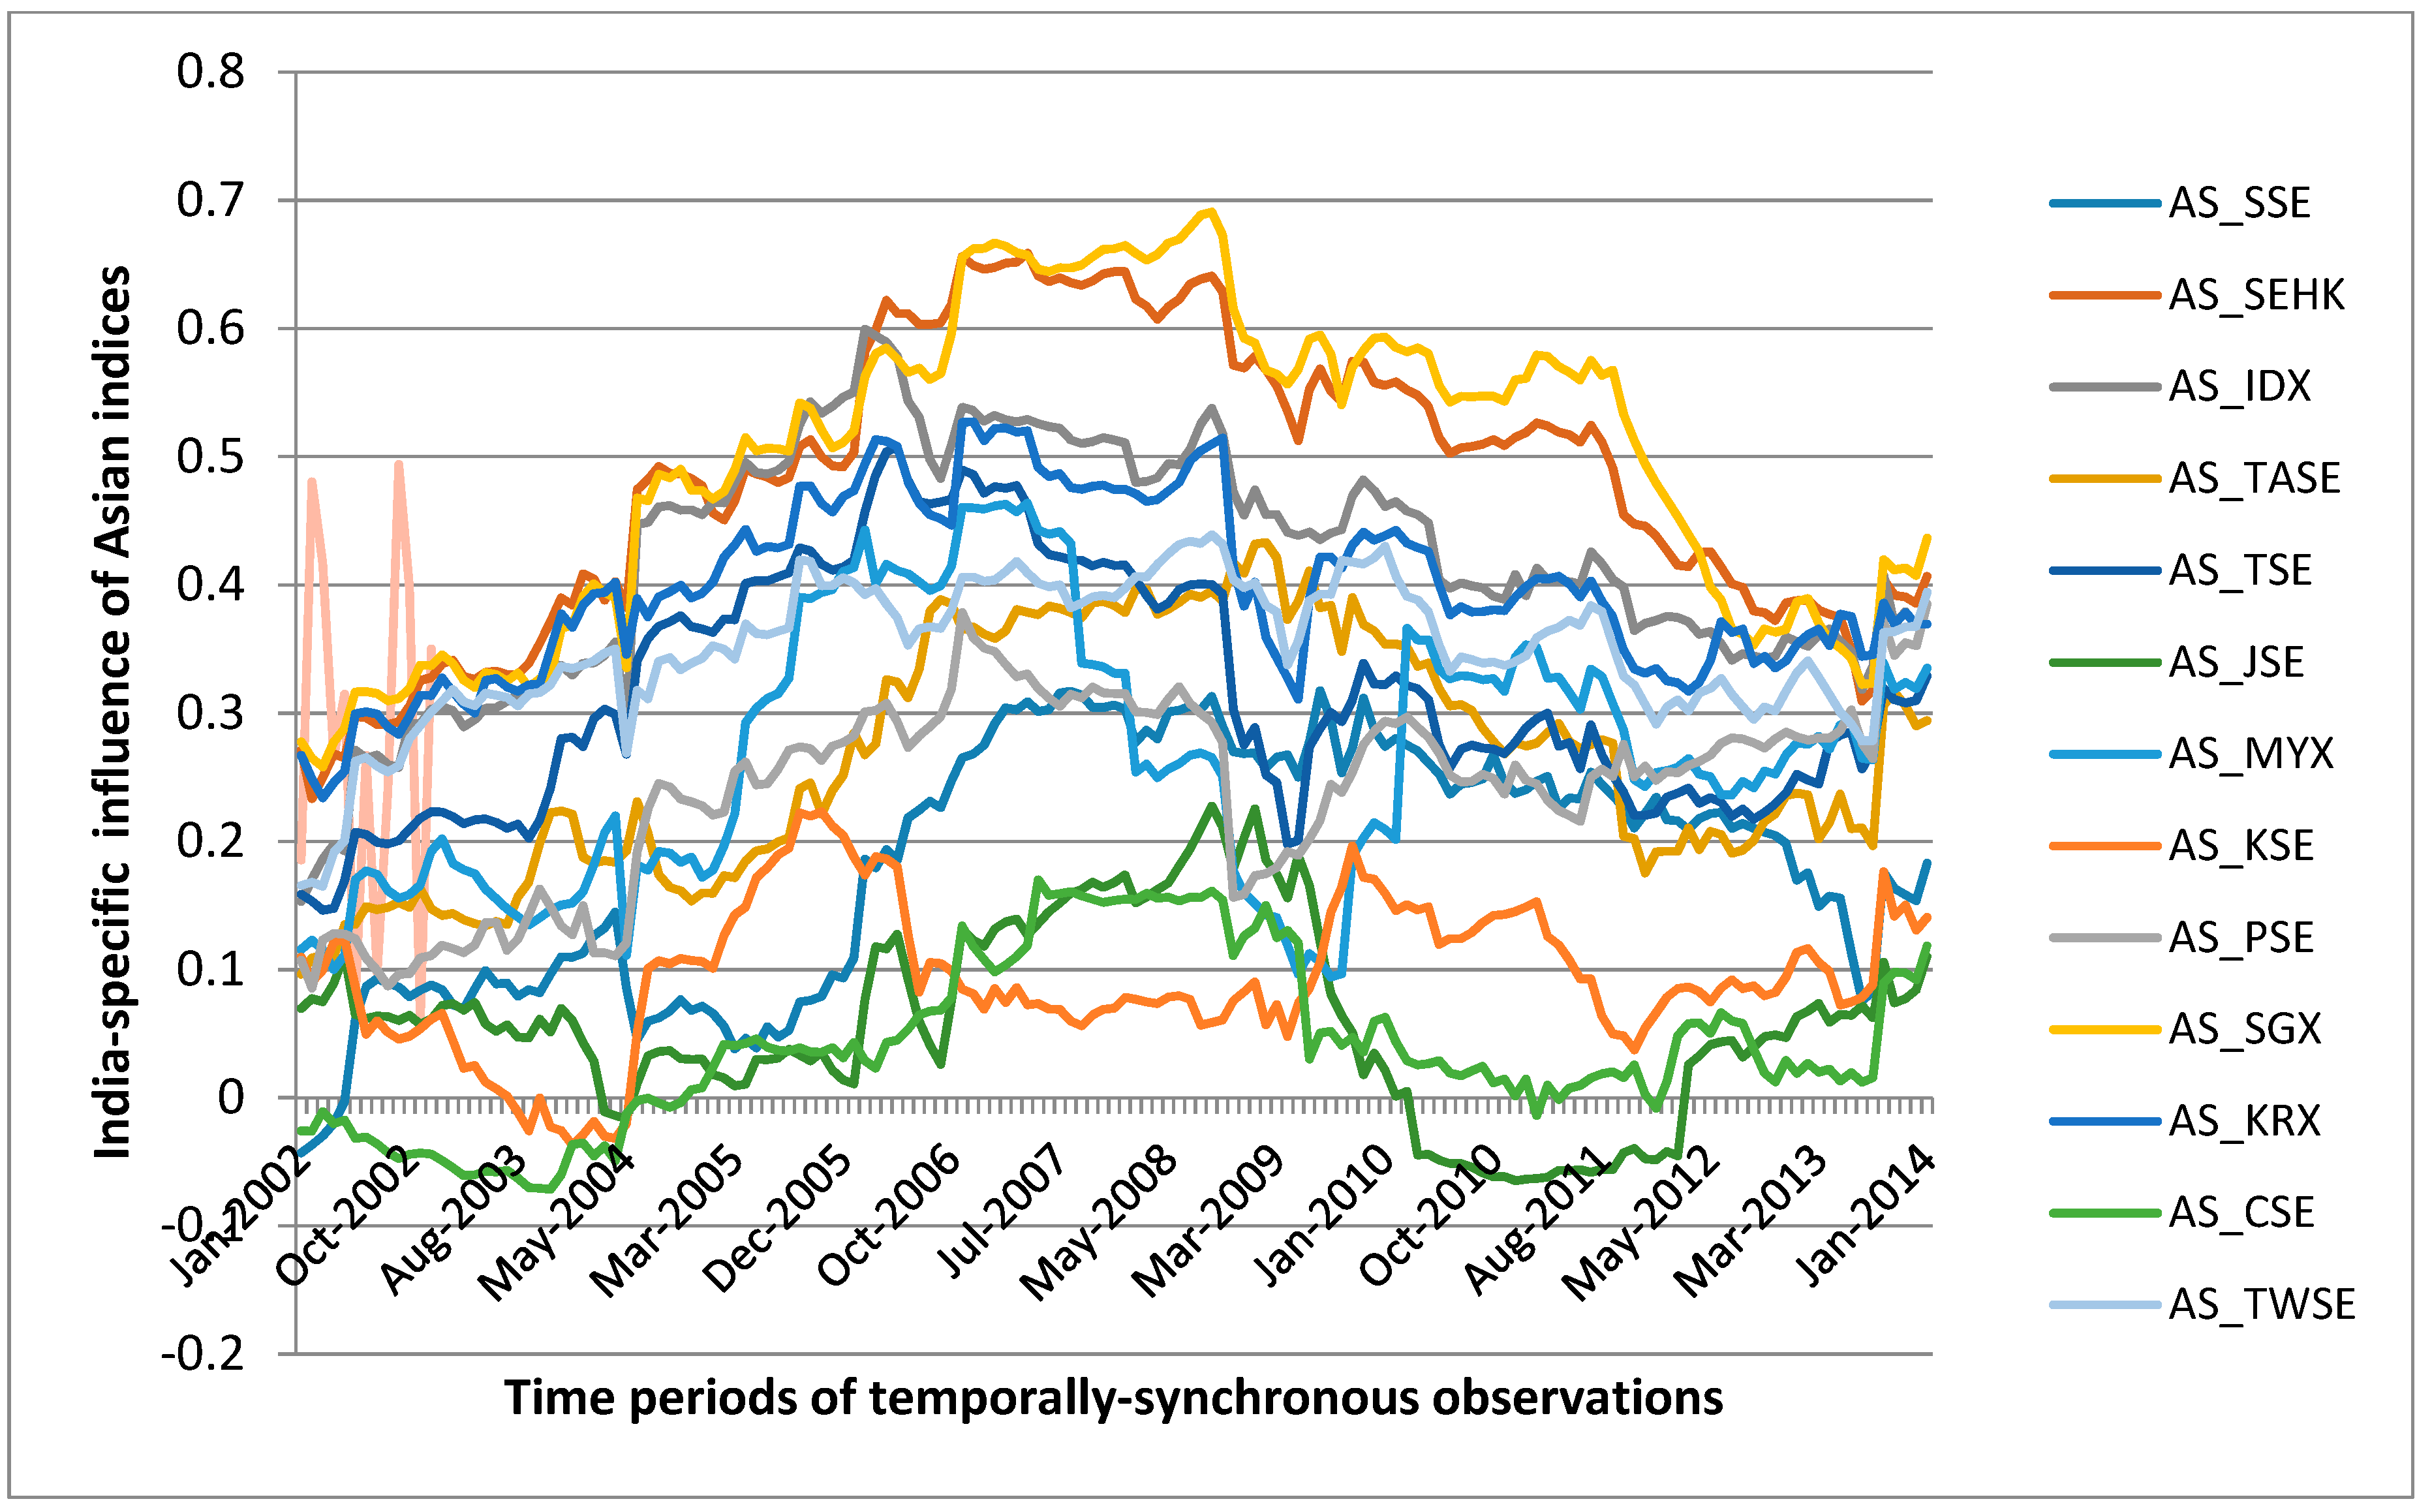
4.1. Topological Properties of the Asian Indices Network

Topological properties are characteristic of networks abstracting real-world system-level interdependencies. The interdependency structures present in the equity market networks may be classified under the category of complex networks and possess some unique topological properties identifiable by a set of quantifiable network metrics. To this end, we have calculated network-based topological metrics that give a quantifiable interpretation of the position of a node (an index) within the weighted network (the Asian equity markets linkage structure) in a relative scale. The topological measures computed in this study are centrality measures (degree, closeness and Eigen vector) and influence strength measures (overall and India-specific). Because these centrality measures are indicative of the position of the Asian indices (in order of criticality in the network), their computations and further elucidation in light of cross-market linkages are important in terms of information transmission in the network. In conceptual terms, each of these centrality measures is demonstrative of the alternative processes by which the selected markets may influence the information flow through the Asian indices network. Recognizing the most essential nodes in an interlinked system helps financial managers understand the information flow dynamics of such networked systems. The symbolic representations used in this study for referring to the Asian market indices are provided in Table 3.
The average values of closeness centrality, betweenness centrality, Eigen vector centrality and the overall influence strength of each of the Asian indices are presented in Table 4.
The network analysis methodology facilitates the identification of some distinctive characteristics for each of the market indices representing the nodes in the equity network. In this study, the distinctive characteristics of the nodes are elucidated using the centrality measures (degree centrality, Eigen vector centrality and closeness centrality) and the influence strength measures (overall and India-specific). These attributes symbolize the significance of market indices in terms of different metrics. On the basis of the assumption that the market indices networks have consistent structural make-ups over a temporal scale, the same consistency will be reflected in the network attributes. However, systemic shocks, internally or externally aroused, will definitely have a bearing on the network structures of these market indices, which will soon get reflected in the network attributes. Thus, tracking these network attributes on a temporal scale will basically serve three main purposes. First, it will provide us with a reflection of the changes in the interdependency structure among the Asian indices and will possibly serve as lagging indicators of structural changes in the equity networks. The structural changes may be an outcome of macroeconomic shocks affecting a part of the system or its whole, and such alterations are indirect pointers to the impact of such shocks on the system. Second, it will demonstrate the role played by each of the market indices in the information propagation process in the event of a possible shock transmission through the network. The information propagation process determined from historical empirical data may also be true in futuristic time periods also; thereby, this knowledge is of key significance for the policymakers and regulators in determining future interventional measures. Third, it will facilitate the identification of peripheral and central market indices in the equity network. This will lead to the determination of the risk premium associated with investing in each of these markets.
In the context of investment decisions, the identification of peripheral and central market indices via network attributes has a major role to play in the portfolio selection process. Empirical studies in the past have provided evidence that future returns of portfolios are considerably impacted by the present and the future level of interdependence amongst the securities constituting this portfolio. Essentially, the level of the intrinsic correlation risk is represented by the closeness for stocks [73]. To be specific, the securities possessing the highest linkages in the equity network acquire the maximum value of expected return amongst the central nodes in the network. On the other hand, the securities that are most affected by the hub node in the network possess the highest value of risk premium amongst all the peripheral securities in the networks. Therefore, it is a reasonable expectation by the investors that securities located centrally should deliver relatively higher returns on investments, as they perceive this as a premium for the enhanced level of contagion risk associated with such securities. Hence, the security comovements as reflected in equity networks play a significant part in the determination of the mechanisms of asset pricing [73]. Taking all this into consideration, international portfolios constituted by selected peripheral markets would possess relatively lesser risk and higher returns than portfolios constituted by selected centrally-located markets (in which the network centrality measures quantify the centrality or peripherality of the market).
Next, we elaborate upon the findings obtained from the analysis of each of the network centrality measures. The first centrality measure considered in this study is degree centrality. This centrality measure indicates the number of links a given market index possesses. The market indices possessing higher values on this measure will have a quick transmission of information directed to the networked system. The market indices possessing a high degree centrality are more likely to possess higher levels of linkages to other market indices; hence, they would be less dependent on other market indices for the information flow. These centrally-located market indices, since they possess a greater number of linkages, would have more opportunities to exchange information targeted at them and would, therefore, be a more central character in the information flow system. In Table 2, we can notice that Hong Kong (AS_SEHK) and Singapore (AS_SGX) have the highest average degree centrality for all 151 observations. This is followed by the market index of South Korea. In the temporally-varying plot of degree centrality (Figure 3), we can notice that during January 2002–May 2004, the Korean stock market index (AS_KRX) has the highest degree centrality. From May 2004 to October 2006, the market indices of Singapore (AS_SGX) and Hong Kong (AS_SEHK) are competing for the highest values of degree centrality. After that period; the Hong Kong market index (AS_SEHK) has the highest level of degree centrality throughout the remaining time frames.
The second centrality measure considered in this study is closeness centrality. Closeness centrality in the context of equity networks is the measure of how swiftly the spread of information may happen from a given Asian index to other indices in the network. In the temporally-varying plot of closeness centrality (Figure 4), we can notice that Hong Kong (AS_SEHK), Singapore (AS_SGX) and South Korea (AS_KRX) have the highest average closeness centrality values. As a result of being situated close to others in the Asian indices network, indices high in closeness measures (i.e., the market indices of Hong Kong, Singapore and South Korea) can perform an information-transmission process better and in an efficient manner. They also have much higher degrees of autonomy as they do not have to look for information from other indices located peripherally. Basically, closeness centrality is a measure of how close a given index is to all other market indices in the network. The higher the scores of a particular market index, the faster the index spreads the information to all others in the network.
In Figure 4, we can observe that the Singapore stock market index (AS_SGX) has the highest values of closeness centrality in the initial periods of 2002 and 2003. After that period, till the end of 2005, the highest position is well contested by four indices together, i.e., Korea (AS_KRX), Taiwan (AS_TWSE), Singapore (AS_SGX) and Hong Kong (AS_SEHK). Succeeding this time-frame, the Singapore stock market index has dominated the rankings till 2016, except during a few periods when the Hong Kong stock market index has had relatively higher values.
The third centrality measure considered in this study is Eigen vector centrality. Eigen vector centrality in the context of equity networks gives high scores to market indices according to the centrality of the neighbours of that market index. The temporal plot of Eigen vector centrality is provided as Supplementary Figure S1. The temporal plot indicates that most of the market indices have their values lying in the range of 0.8–1 in all 151 temporally-varying observations, which reflects that the majority of them are connected to highly central nodes in the equity network.
The temporally-varying plot (Figure 5) of the average centrality captures the properties of all three different centrality measures in an equally weighted proportion. In this plot, we can notice that the market indices of Hong Kong (AS_SEHK) have the highest value of average centrality during the initial periods of January 2002–October 2002, after which the market index South Korea (AS_KRX) has gained the top position for the period between October 2002 and May 2004. The period May 2004–July 2007 is dominated by the Singapore market index (AS_SGX). From July 2007 till the end of the study period, the market index of Hong Kong (AS_SEHK) possessed the highest values in the average centrality measure.
The mean value of the average centrality measures for the top four and bottom four market indices are presented in Table 5. In this study, the top four market indices with the highest average centrality measures are referred to as ‘central nodes’, and the bottom four market indices with the lowest average centrality measures are referred to as ‘peripheral nodes’.
Next, we elaborate on the findings obtained from the analysis of each of the influence strength measures. In the temporally-varying plot of the overall influence strength (Figure 6), it can be observed that from the initial phases of 2002 till the early months of 2005, the Korean stock market index (AS_KRX) has had the highest influence on the remaining Asian indices in the network. After this period until the final phase of 2006, we can observe that the Singapore market index (AS_SGX) has the highest influence. From the initial phases of 2007 till the end of 2016, the Hong Kong stock market index (AS_SEHK) has had a strong influence on the other members of the Asian indices network.
From the temporally-varying plot of the overall influence strength (Figure 6), it is clear that the market indices of Hong Kong (AS_SEHK), Singapore (AS_SGX) and South Korea (AS_KRX) have had the highest influence on the Asian indices network. This indicates that any sort of shocks (external or internal) arising in the domestic, regional or global economy having an impact on these markets will subsequently spread the effects to other capital markets in Asia in a substantial way.
The market indices of Pakistan (AS_KSE), Jordan (AS_JSE) and Sri Lanka (AS_CSE) have the lowest levels of average influence over the entire Asian indices network. This indicates that any sort of shocks (external or internal) arising in the domestic, regional or global economy having an impact on these markets will not get efficiently transmitted to other markets in Asia. Even if the transmission happens from these markets, the overall impact of this transmission on other markets would be minimal.
Based on the number of times the Asian index is ranked in the top four positions in overall influence strength scores in the ranking list across 151 observations, we observe that the four top Asian indices are Hong Kong, Singapore, Korea and Taiwan.
Next, the India-specific influence strength of the Asian market indices is discussed. The average influence of each of the Asian indices on the Indian equity market (AS_BSE) is depicted in Figure 7. To compare the relative influence of Asian indices on the Indian market index (AS_BSE), we have summed up the weights in absolute terms for computing node strength. From this averaged plot (Figure 7), it is clear that the market indices of Singapore (AS_SGX) and Hong Kong (AS_SEHK) have had the highest influence on the Indian market index. This is followed by the market indices of Indonesia (AS_IDX), South Korea (AS_KRX) and Taiwan (AS_TWSE). The least influential Asian stock market indices in terms of India-specific influence are those of Pakistan (AS_KSE), Sri Lanka (AS_CSE) and Jordan (AS_JSE).
In the temporally-varying plot of the India-specific influence strength of the Asian market indices (Figure 8), we can notice that during the initial months of 2002, the South Korean and Singaporean market indices have had the highest influence on the Indian market index (AS_BSE). From October 2002–August 2003, the Singaporean market index had had the highest influence on the Indian market index (AS_BSE). Later, for the period from August 2003–July 2007, both the market indices of Singapore and Hong Kong have had a relatively equivalent amount of influence on the Indian market index (AS_BSE). From July 2007 till the end of the study period, the Singaporean market index had had the highest influence throughout, which is closely followed by the Hong Kong market index. We can notice that Singapore and Hong Kong have a positive weight of the edge, which reflects their directionality.
On the other hand, on observing the market indices bearing lower India-specific influence strengths, we observe that at initial periods, the Shanghai market index (AS_SSE) has negative weights of edges. This reflects that the direction of influence is opposite. In addition to this, we can note that for short periods of time. The market indices of Sri Lanka (AS_CSE) and Jordan (AS_JSE) have had negative weights of the edges. This reflects that the direction of influence is opposite.

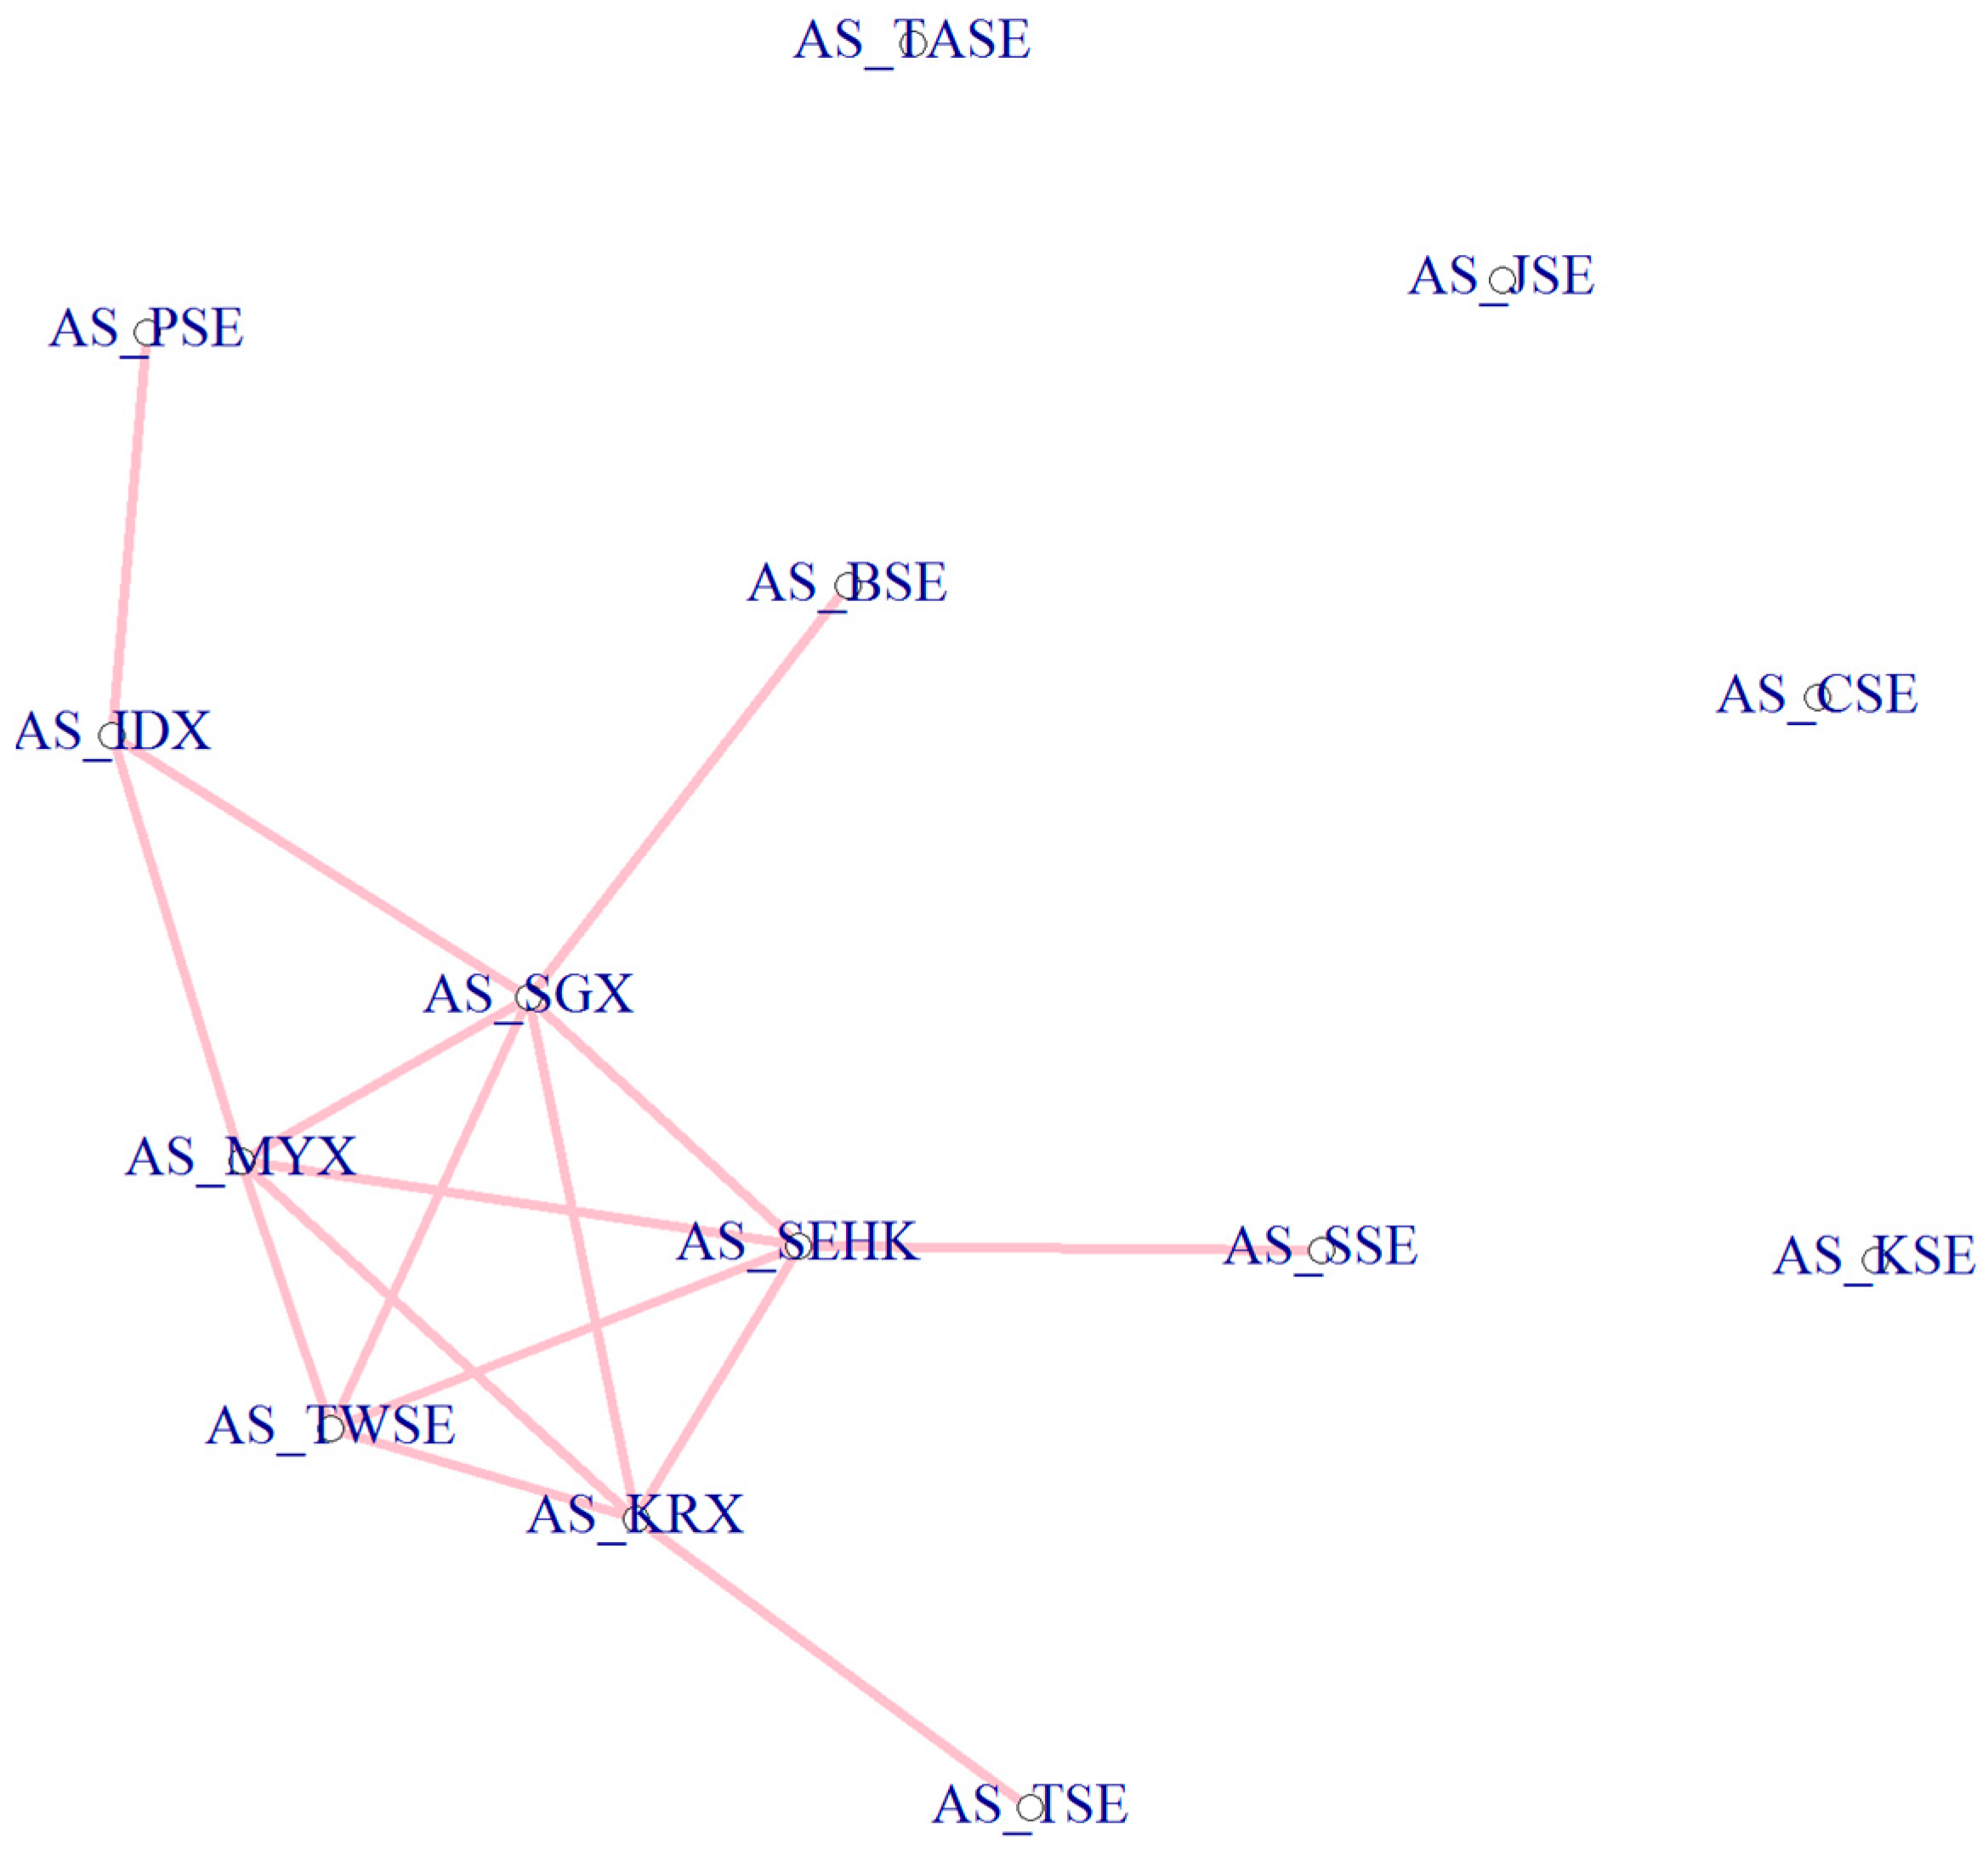
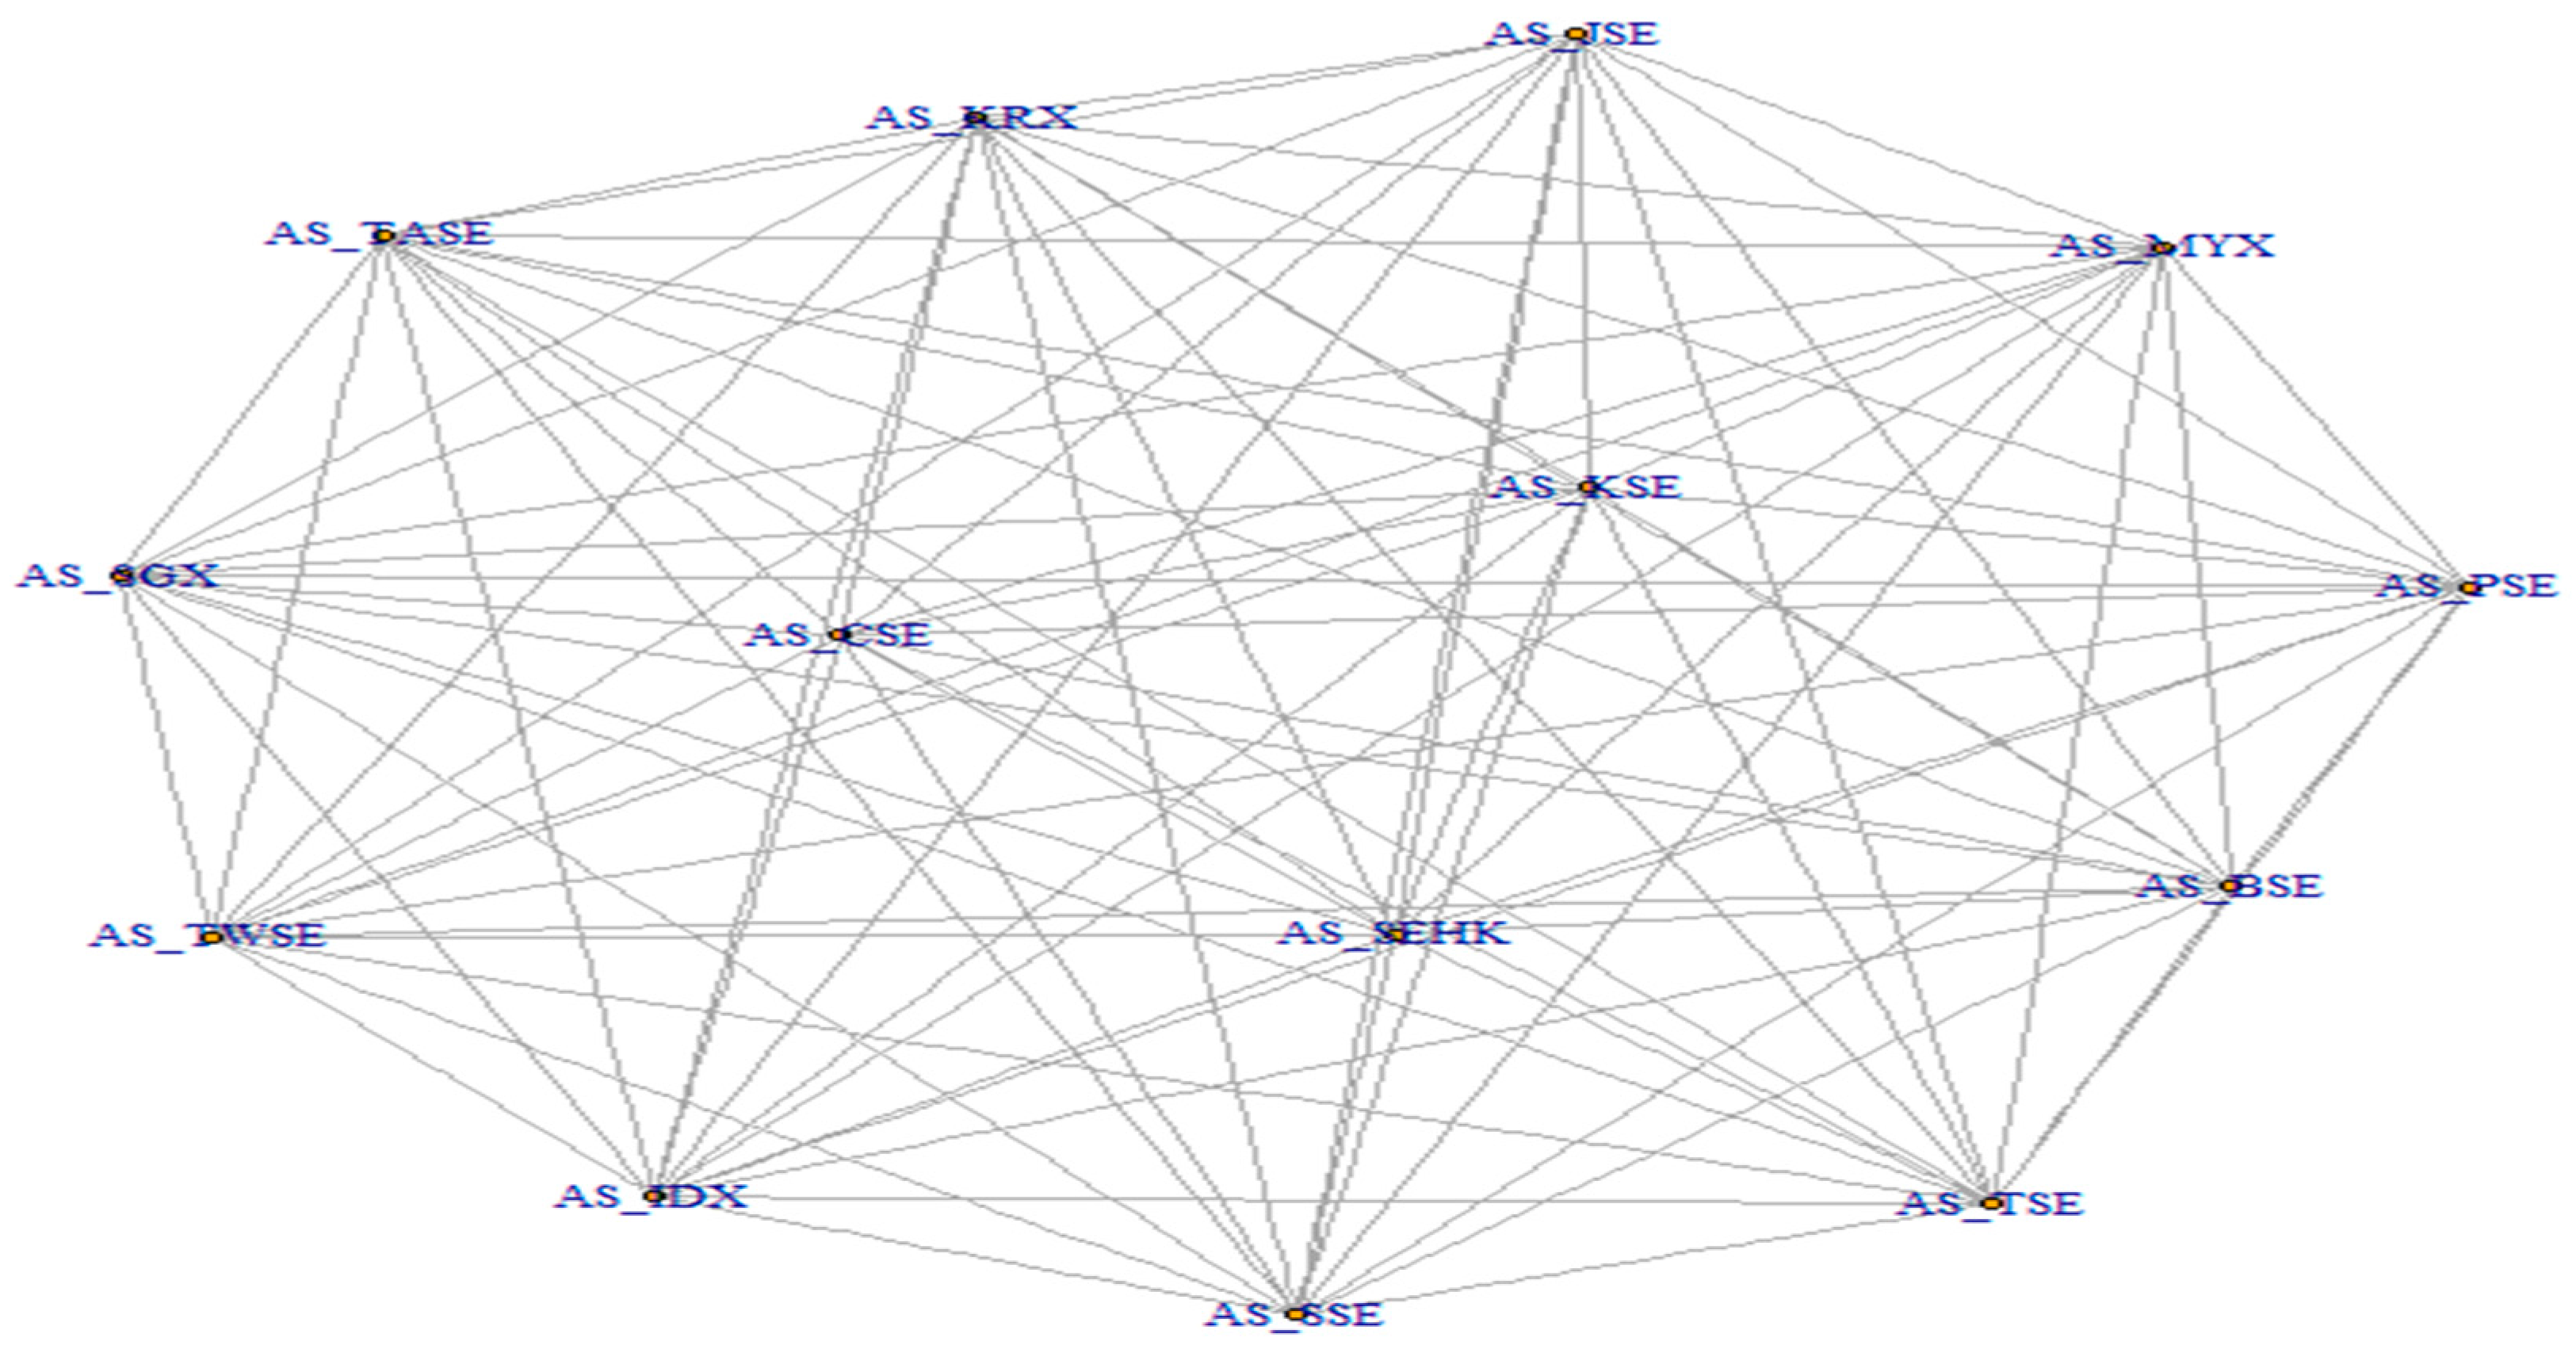
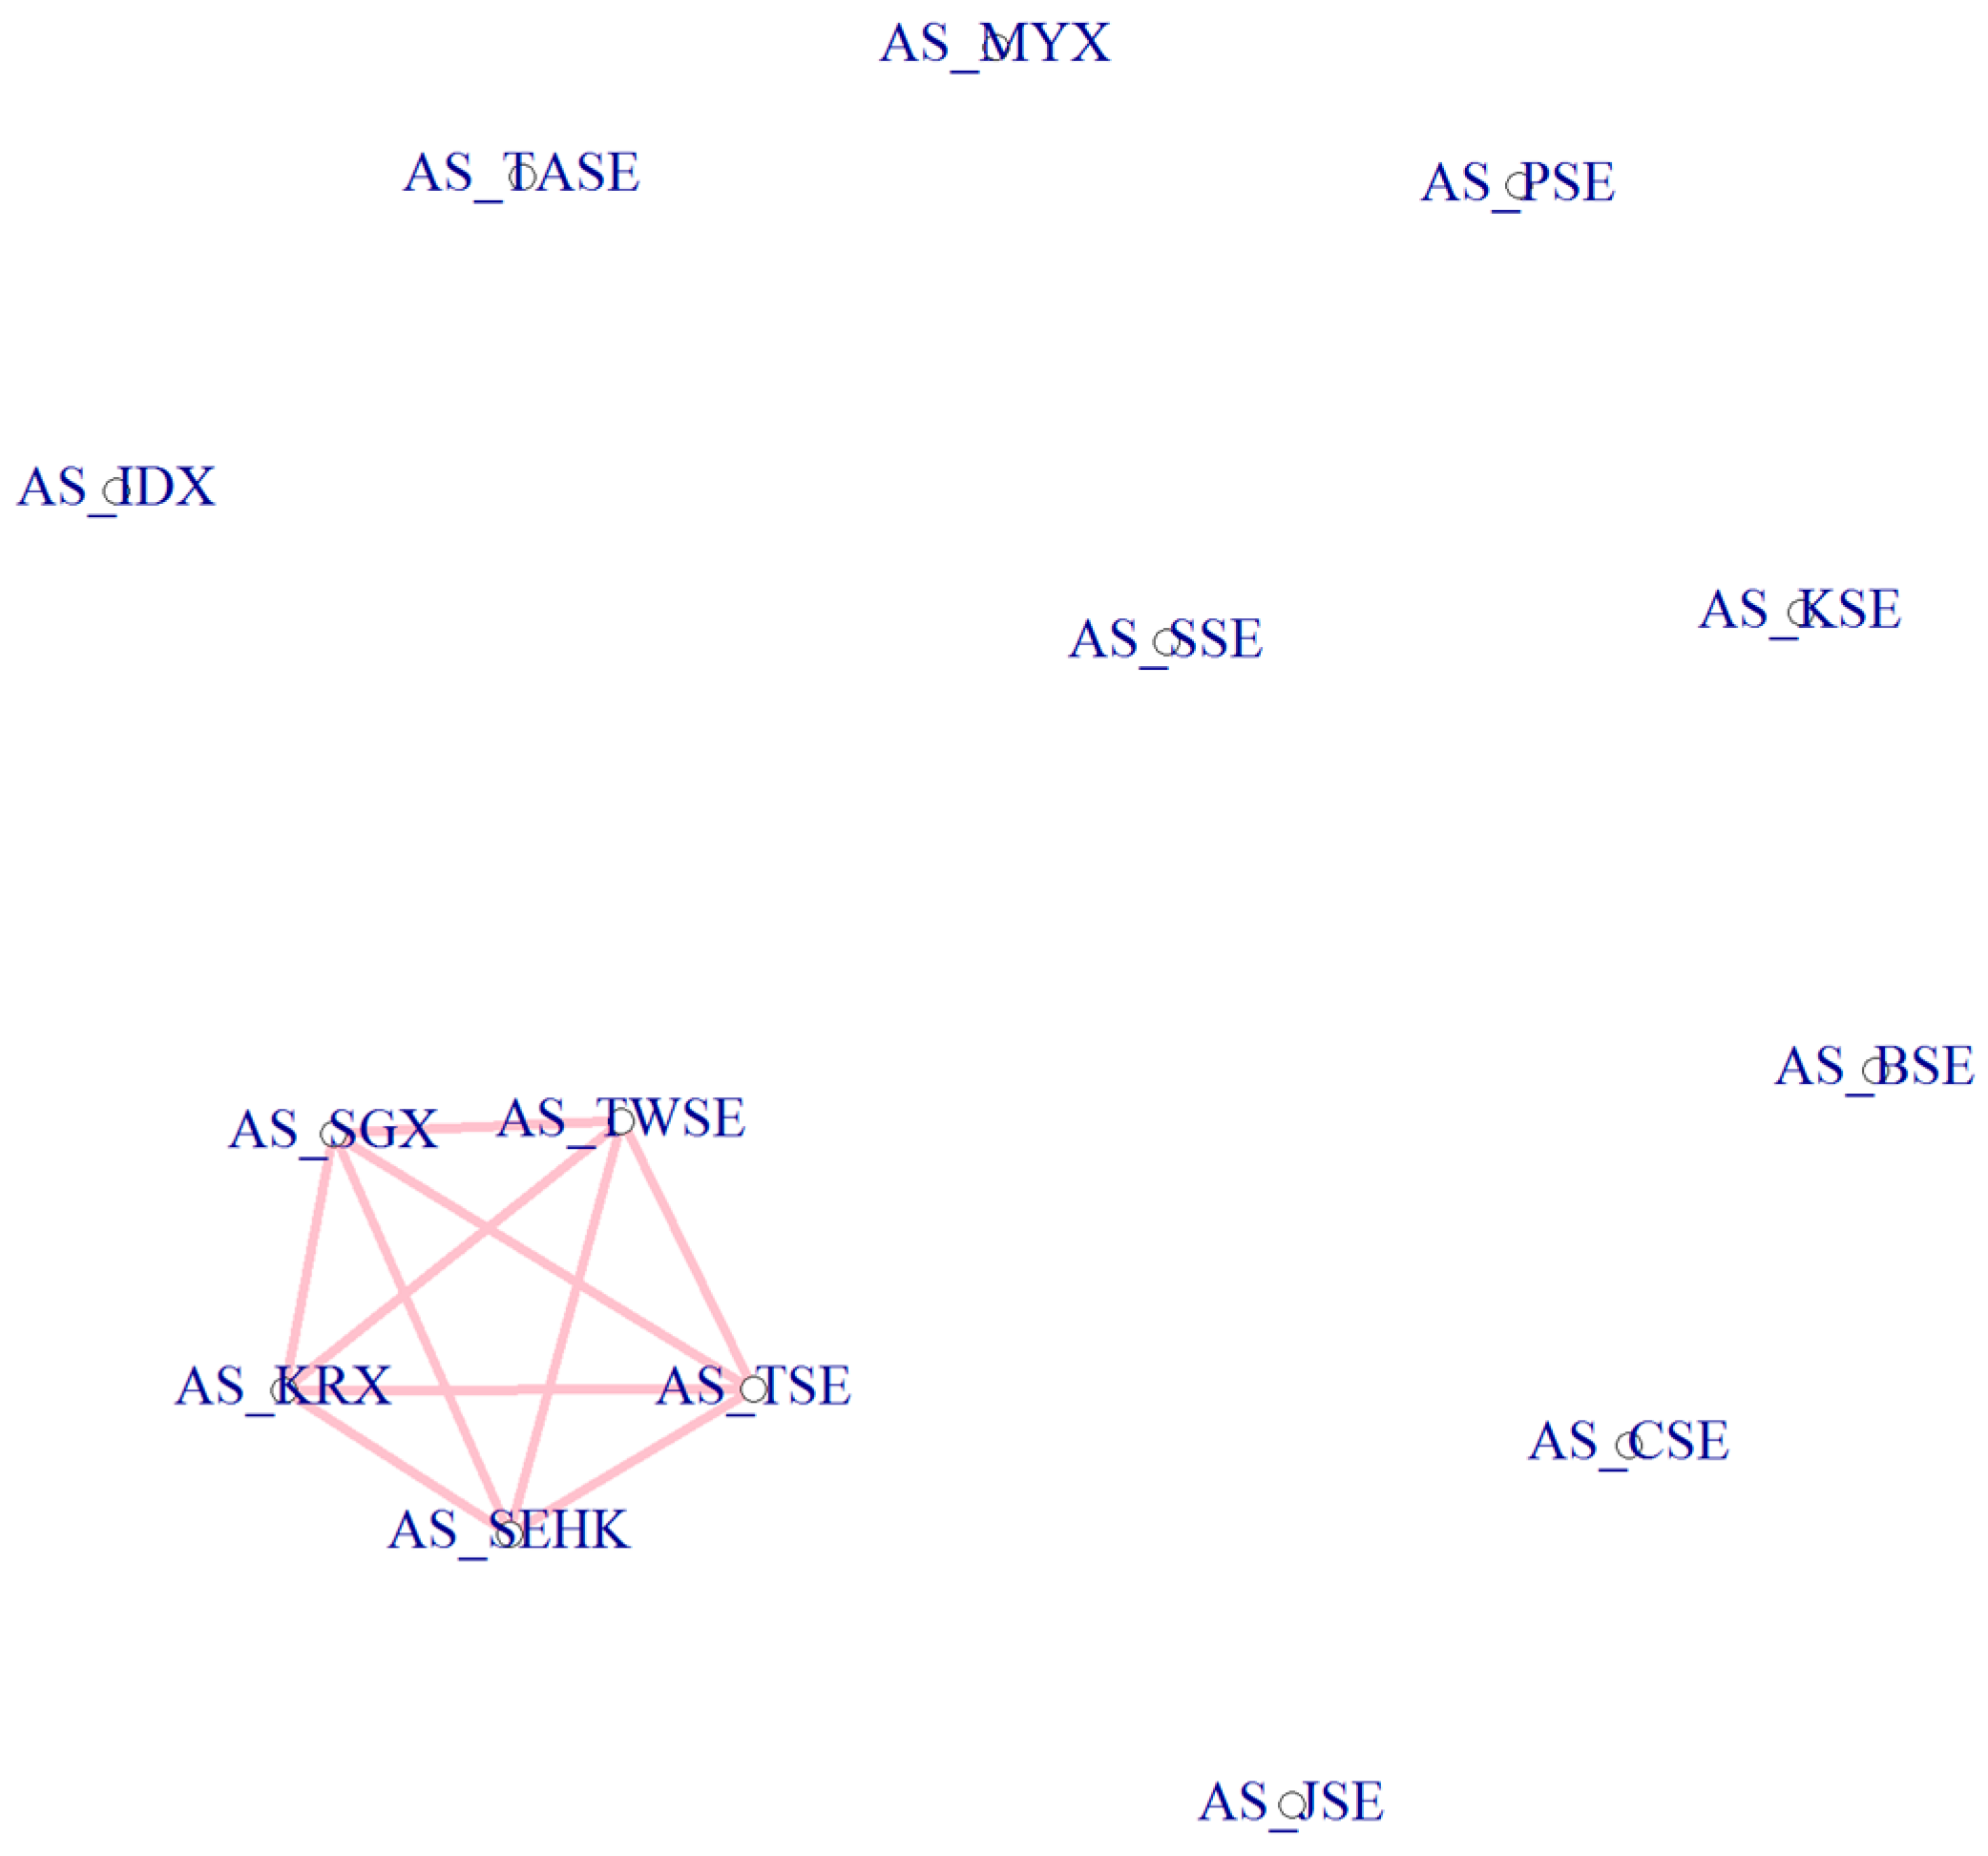
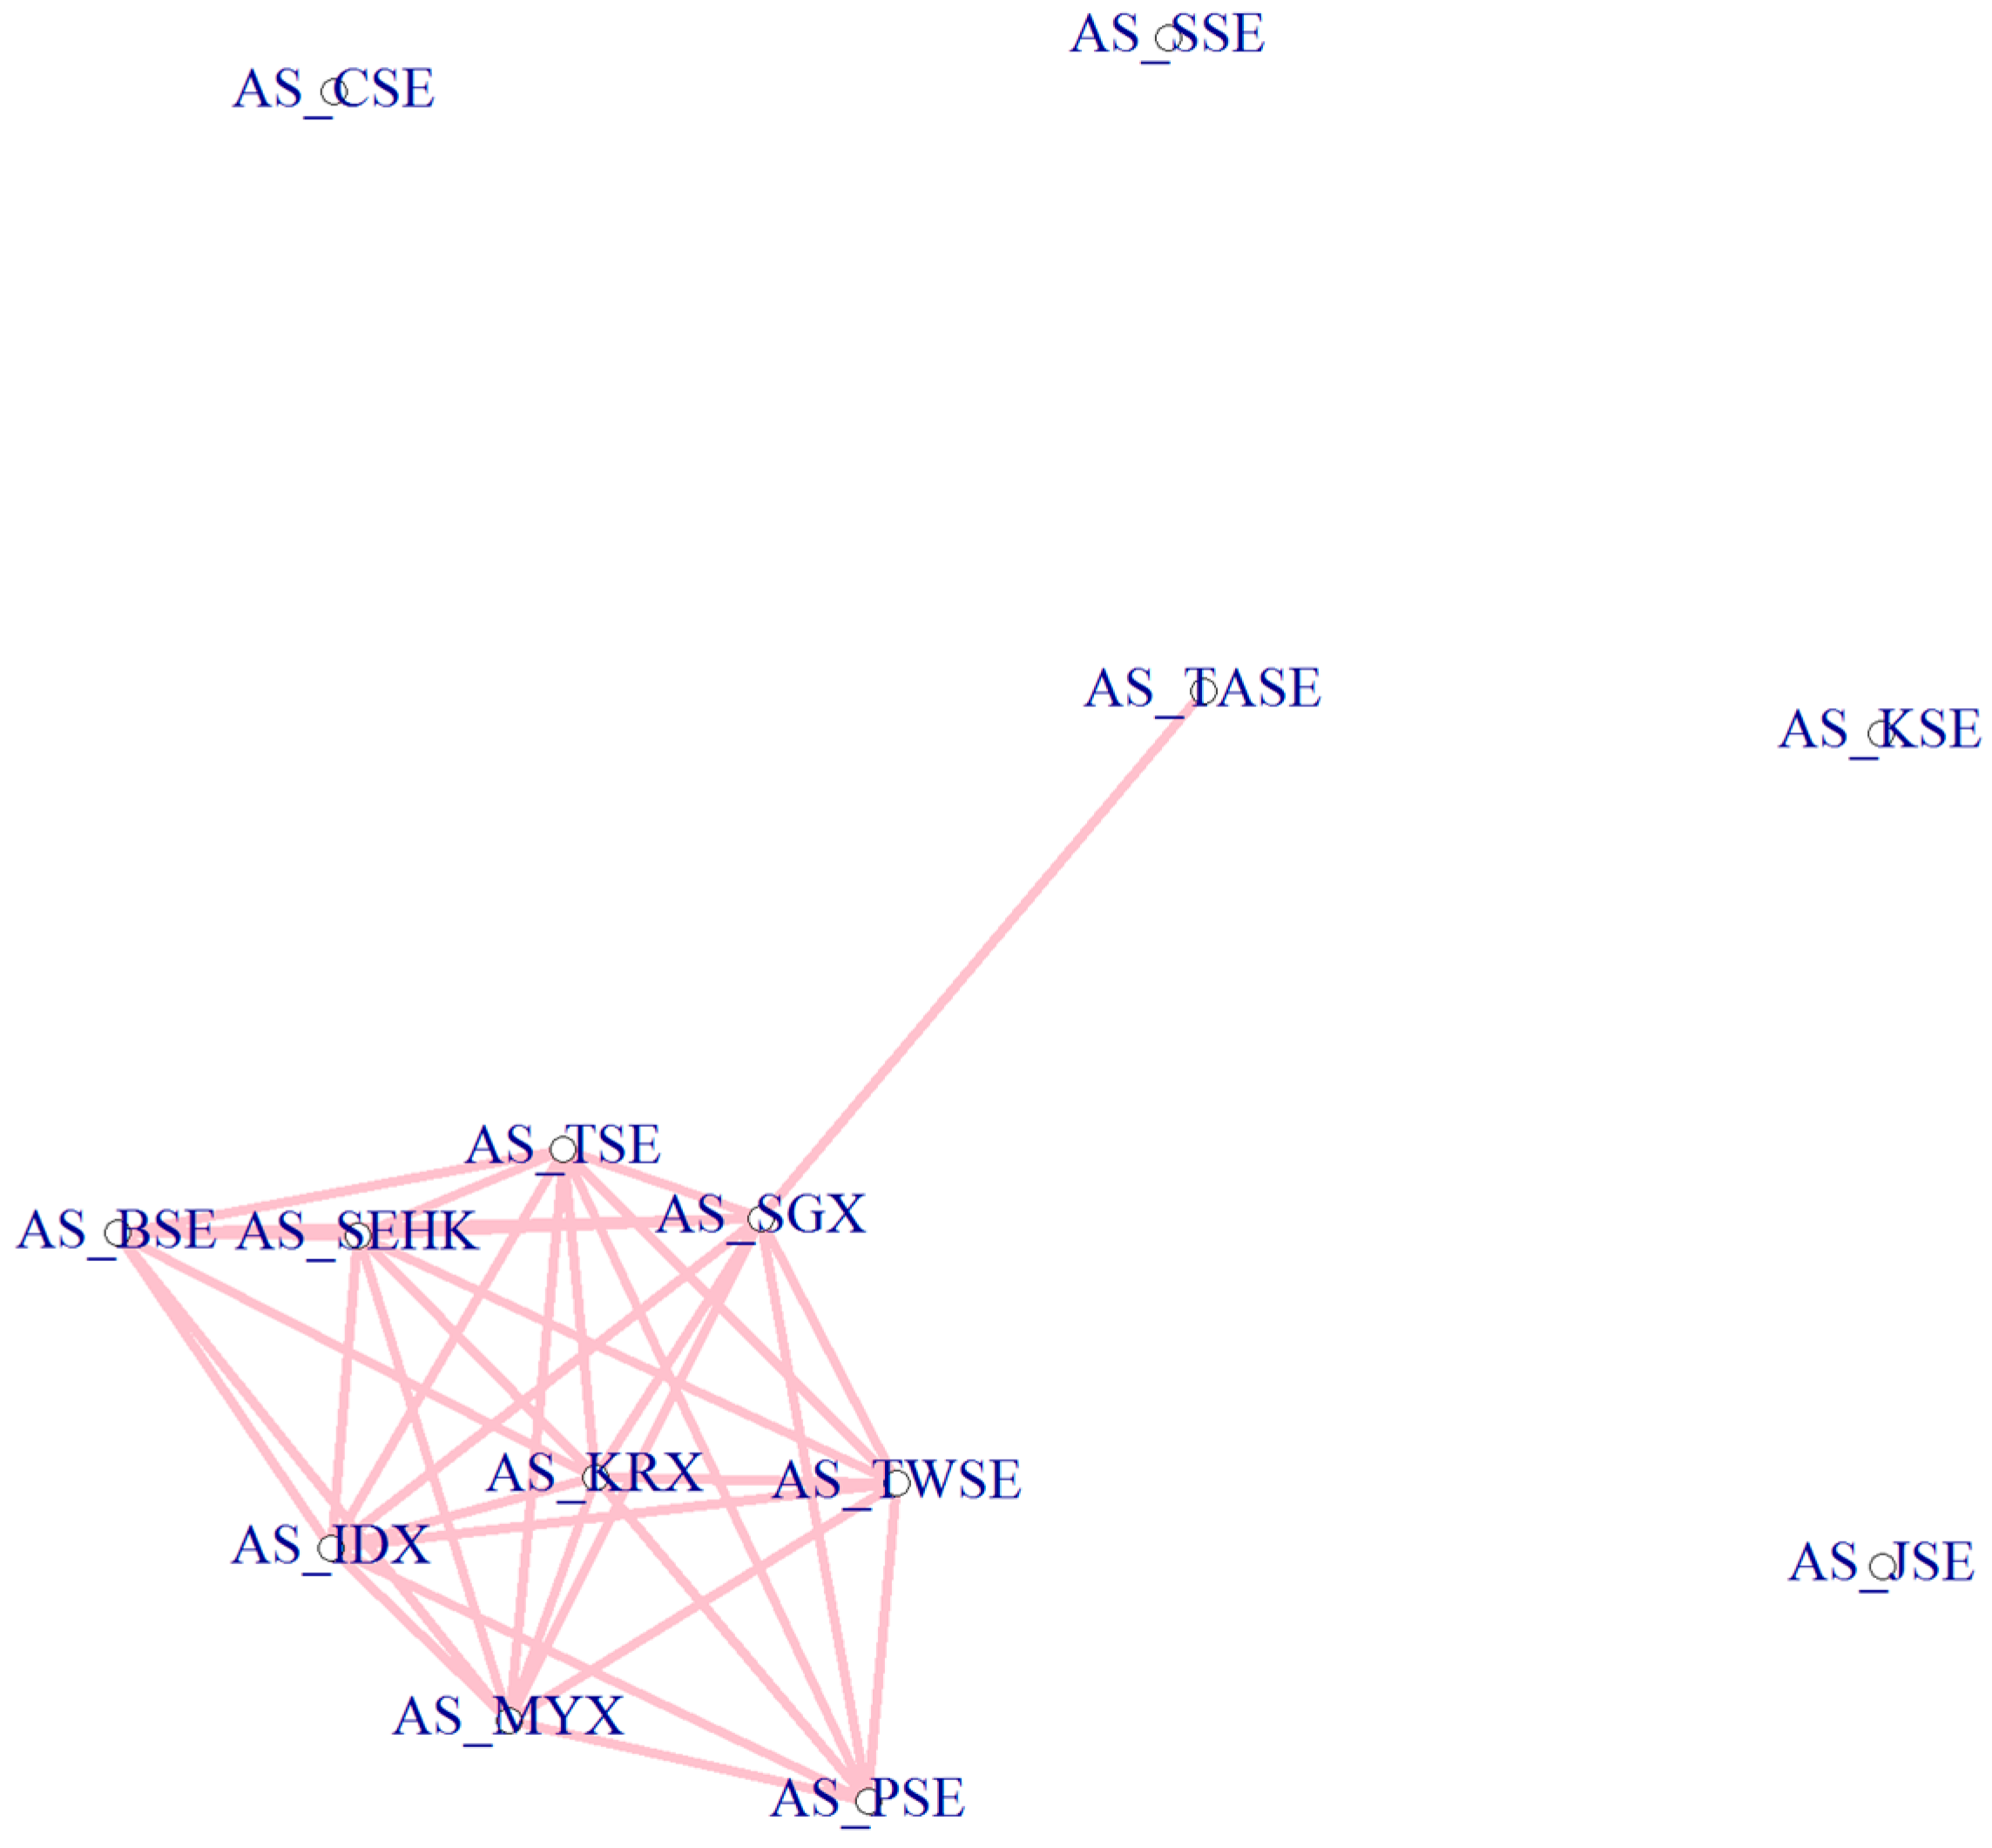
4.2. Reduced Network Visualization

In cases where the weighted correlations over a moving time window are used for computing threshold filtered networks, the topological structures of these filtered networks can be altered in a dynamic fashion with the transformations in the window position, mirroring the progressions happening in the market structure amid such a timeframe. Here, we employed filtered graphs to quantitatively evaluate the relevance and centrality of these Asian indices in the context of an integrated regional Asian block.
From the visualization of these threshold filtered networks belonging to the 151 temporally-synchronous observations, the following key findings emerge: (i) The country-specific stock market indices of Singapore, South Korea, Hong Kong and Taiwan are interconnected throughout the 151 observations. (ii) From Observation Number 57 (beginning in June 2006), the Chinese stock market index (AS_SSE) started becoming linked to the Hong Kong stock market index (AS_SEHK), and after that period, the Chinese stock market index (AS_SSE) has been rarely connected to any index other than the Hong Kong stock market index (AS_SEHK). This connectivity pattern is exhibited in Figure 9. (iii) Over the past 14 years, there has been a progressive increase in the number of connections between the major Asian indices. In the initial time periods (Figure 10), the developed markets of Singapore, South Korea, Hong Kong and Taiwan were the only ones that had connectivity with one another, and they formed an interconnected mesh structure. After a particular period of time, the remaining Asian indices became connected one after the other to this large block of developed markets (Singapore, South Korea, Hong Kong and Taiwan). (iv) A segmented set of Asian indices having no linkages with any peers (and the large block) is also evident in this study. These indices belong to the stock exchanges of Jordan (Amman Stock Exchange), Pakistan (Karachi Stock Exchange) and Sri Lanka (Colombo Stock Exchange). These kind of disjointed indices are evident in recent time frames of the study period also (Figure 11). They form the biggest group of distanced indices (vertices) throughout all the observations. These disconnected indices depict the state of segmentation existent in the Asian markets. These disconnected groups of indices are a clear opportunity for regional portfolio diversification, supported by a proper market liquidity ratio and growing market capitalization of these markets.
From among the disconnected indices, the stock market of Jordan deserves special attention. In past studies on the Amman Stock Exchange, it has been demonstrated that there is a steady rise of average market capitalization as a percentage of GDP (average market capitalization figures have also increased from 0.49 in 2000 to 3.6 in the year 2005) measures [74]. This makes the Jordan stock market an attractive investment destination and a suitable destination for Asian portfolio diversification. The paper by Saadi-Sedik and Petri [75] also stresses the same point of disconnection of Asian markets with Jordan as is evident in our study. It employs the cointegration approach to demonstrate that there is no cointegration relationship between the Amman Stock Exchange and other emerging and developed stock markets in Asia.
We computed the FDR for the detected edge connections obtained from the threshold filtering approach. The FDR values are computed for all 151 filtered weighted networks, and then, they are further averaged. The averaged value of the FDR was obtained to be 0.00357. The low value of FDR for the detected edge-list signifies that the connectivity structures obtained from the threshold filtering approach are statistically significant and reliable.

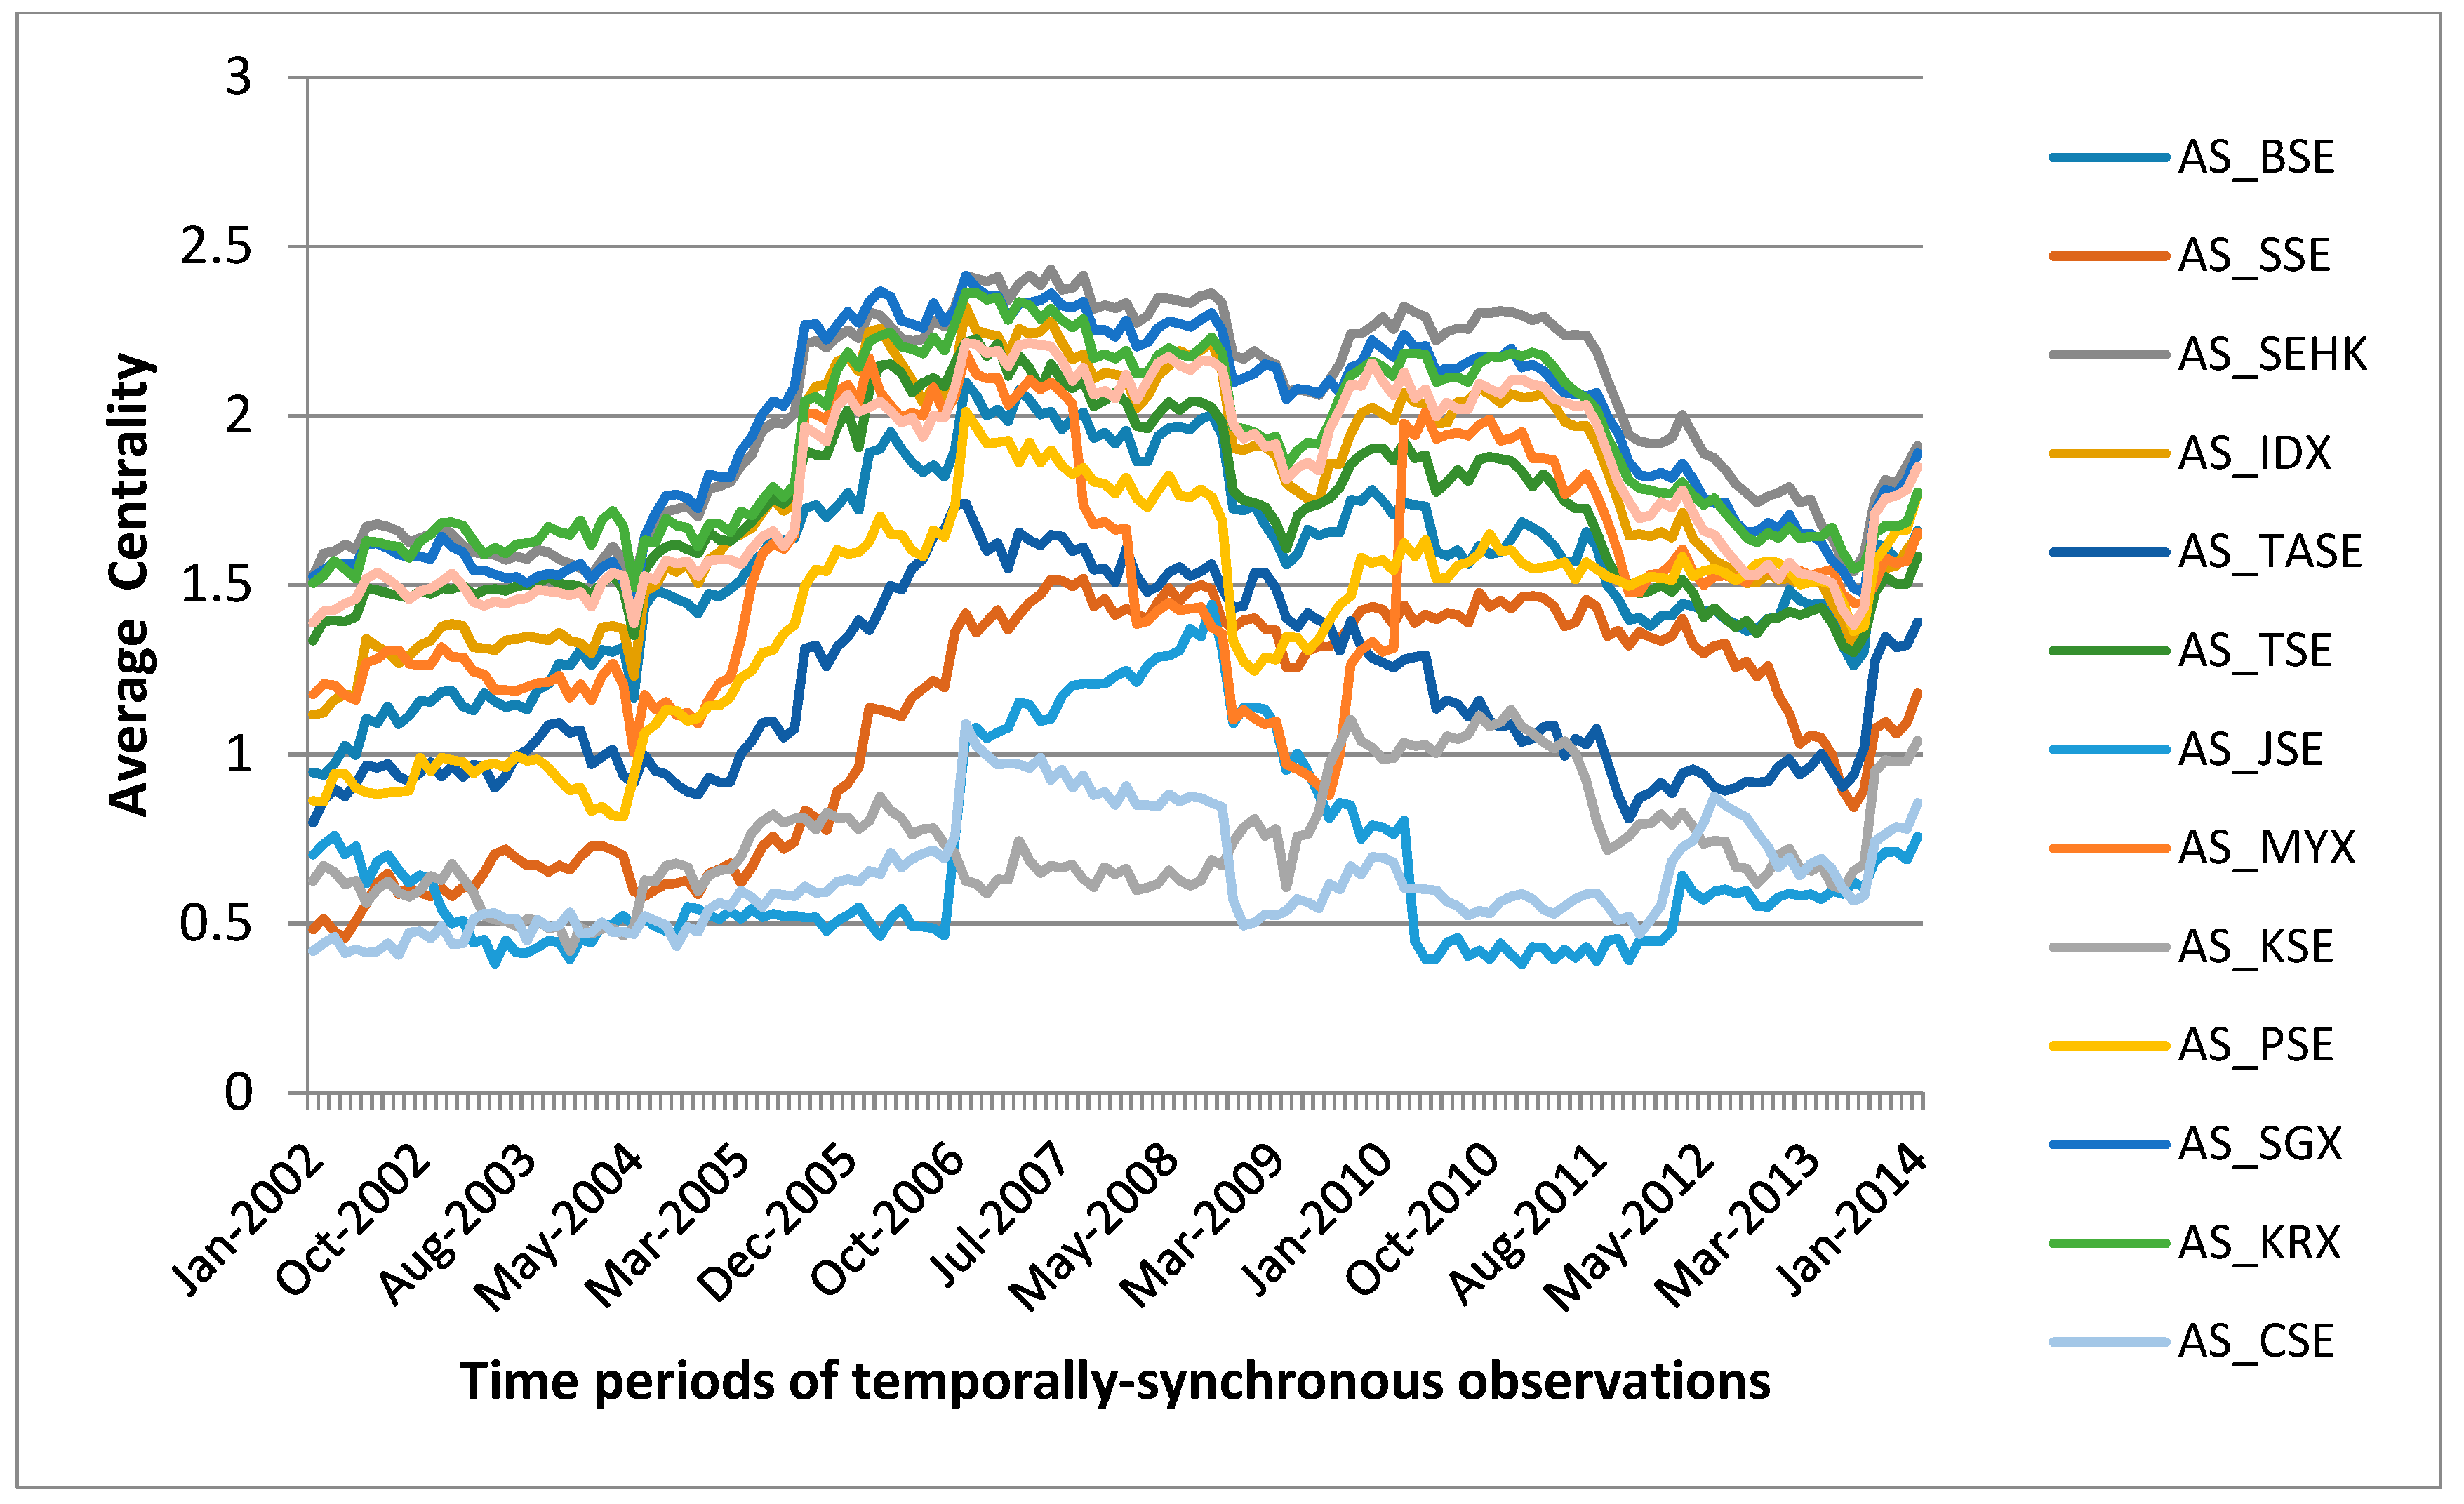
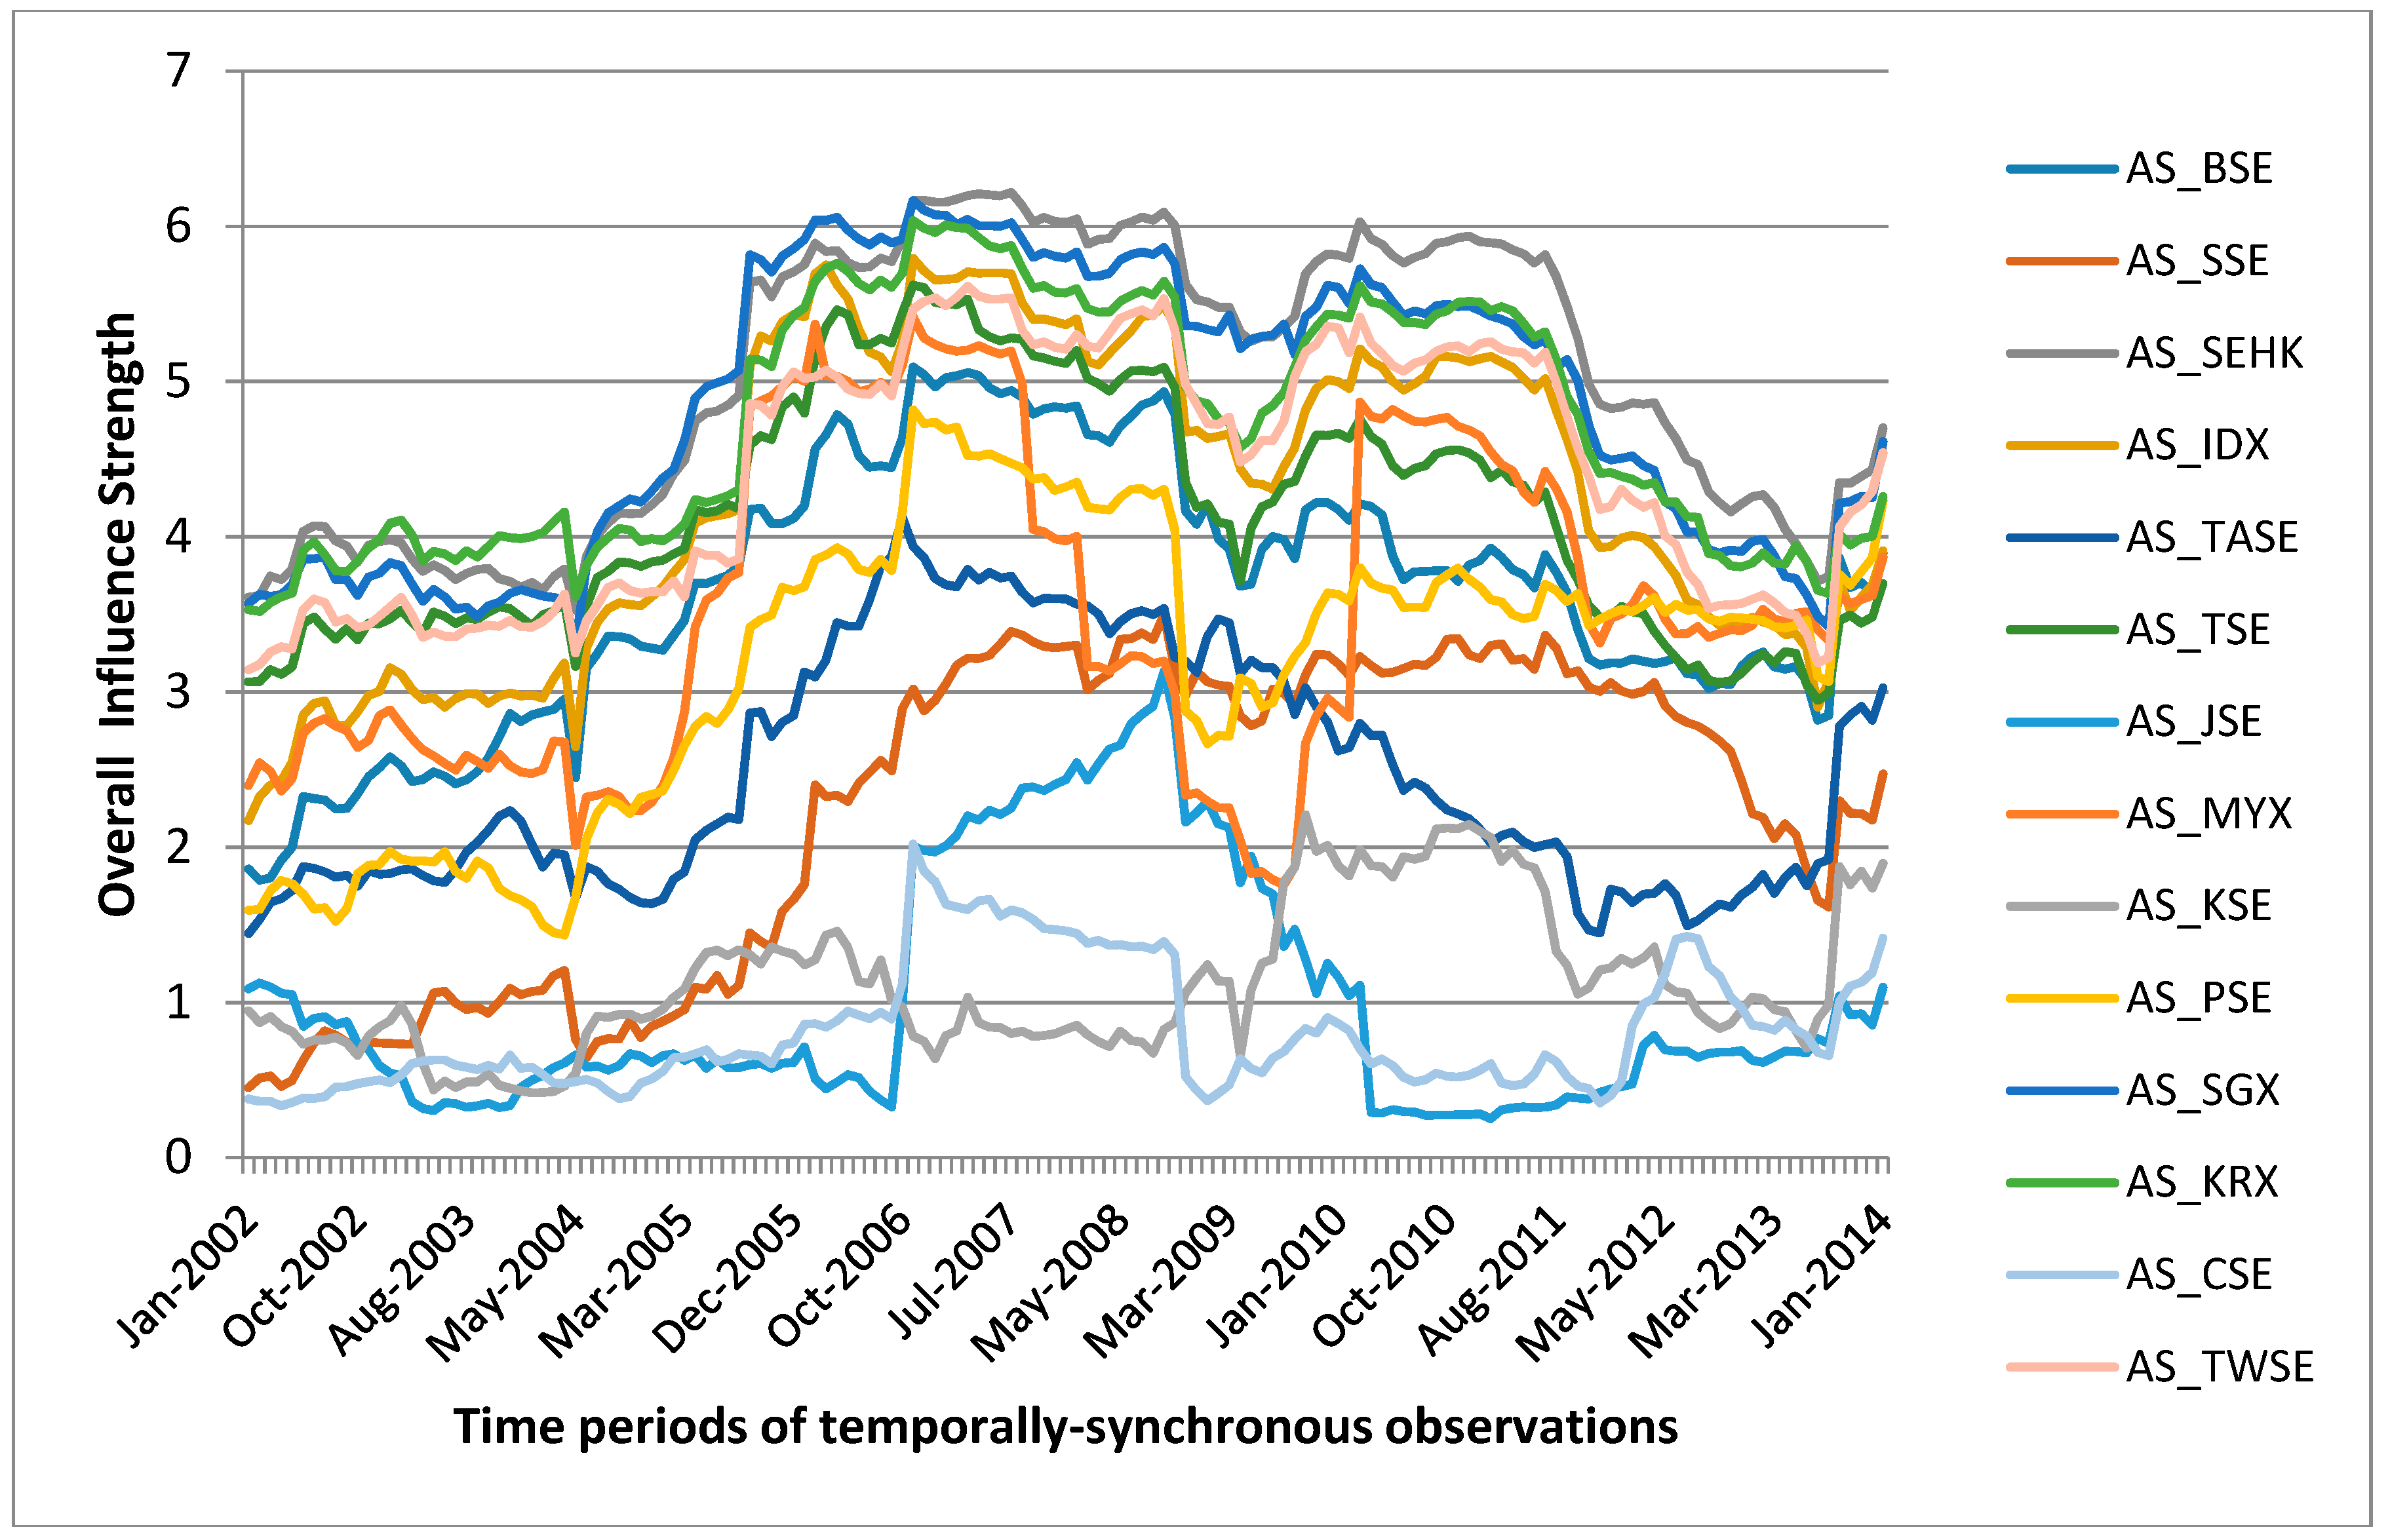
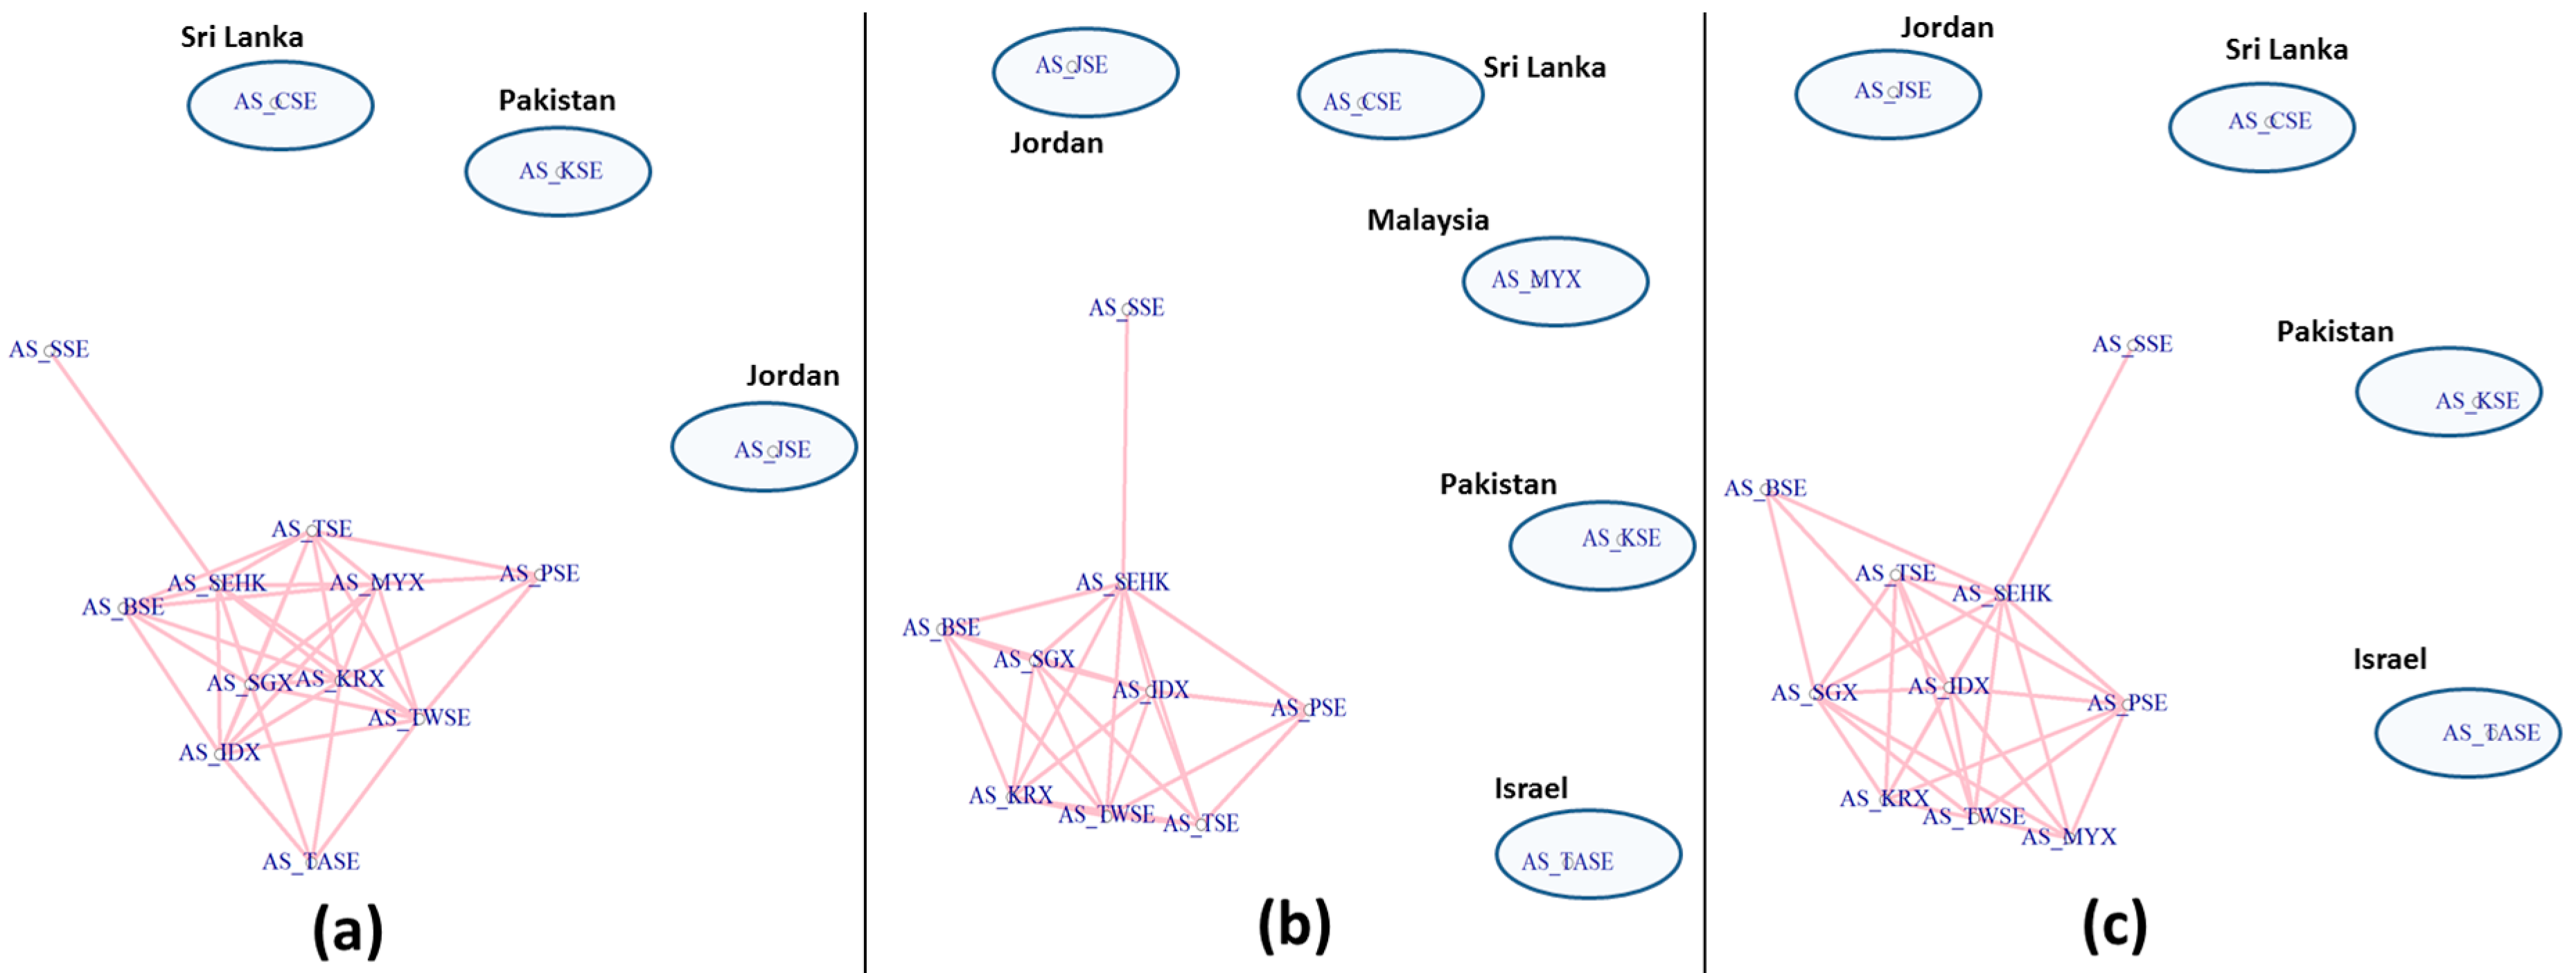
4.3. Pre-Crisis, Crisis and Post-Crisis Period Analysis
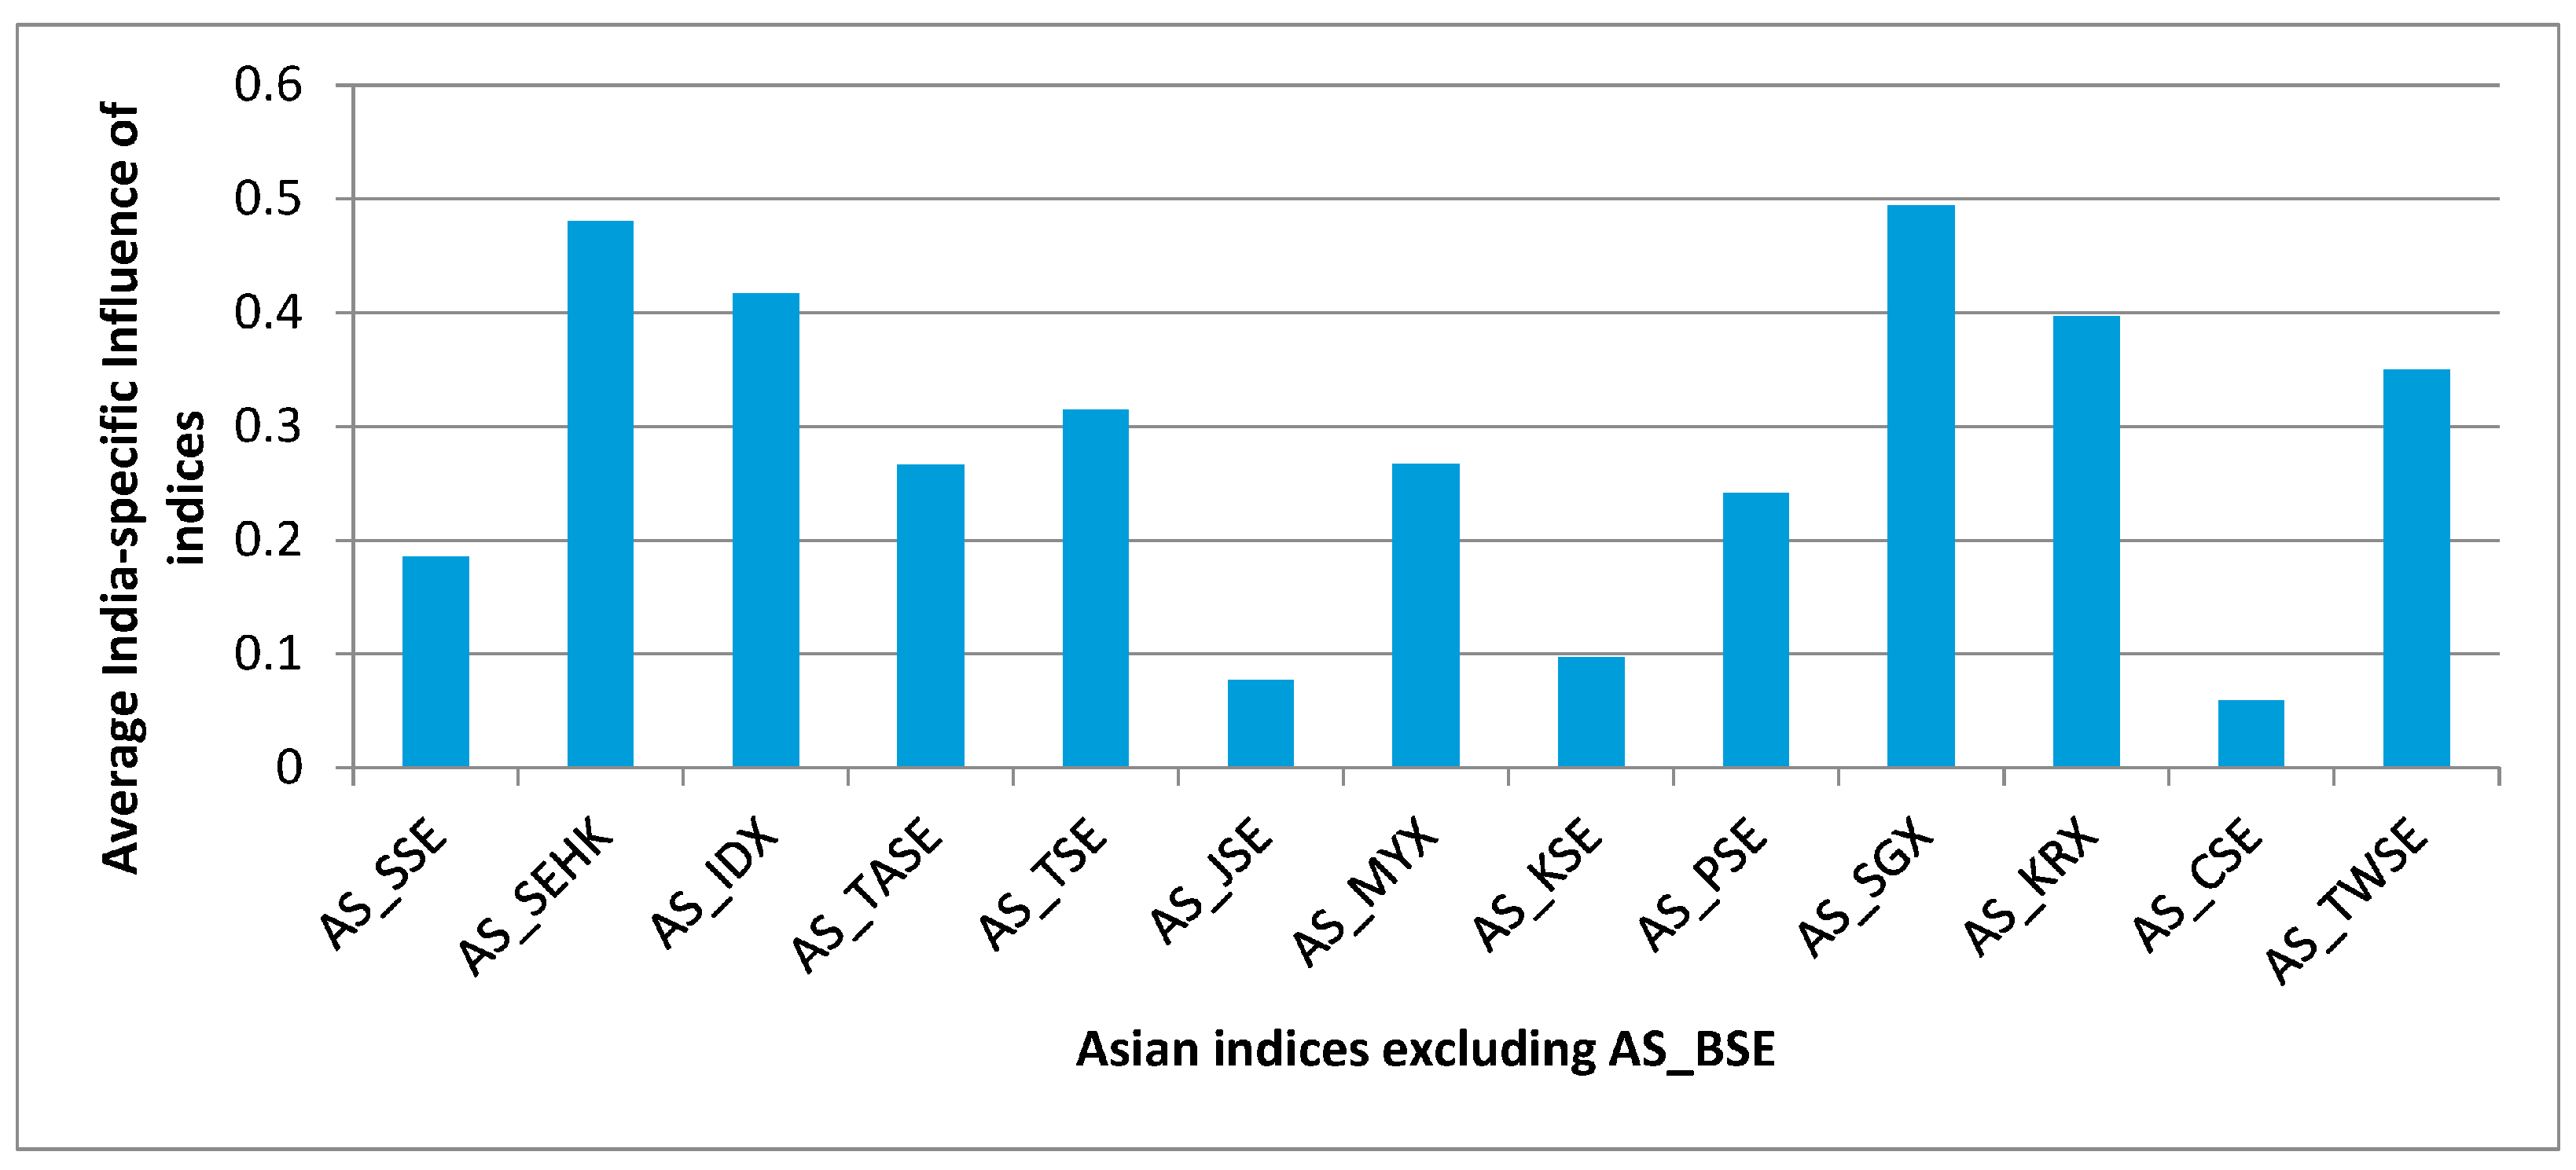
1. Pre-crisis period analysis
In the threshold filtered network belonging to the pre-crisis period (Figure 12), we can observe that the stock market indices of Israel (AS_TASE), Pakistan (AS_KSE), Jordan (AS_JSE), Sri Lanka (AS_CSE) and Malaysia (AS_MYX) are not connected to the major interconnected block of the markets of Singapore (AS_SGX), India (AS_BSE), Taiwan (AS_TWSE), China (AS_SSE), Hong Kong (AS_SEHK), The Philippines (AS_PSE), Indonesia (AS_IDX) and South Korea (AS_KRX). These indices do not have any existing linkage with any other member of the Asian indices network. In this period, the Indian market index (AS_BSE) is connected to those of South Korea (AS_KRX), Hong Kong (AS_SEHK), Singapore (AS_SGX), Taiwan (AS_TWSE) and Indonesia (AS_IDX). The disjointed indices that had no connectivity with major hub nodes in the network are ideal candidates for portfolio diversification as shocks directed at the hub nodes will not get transmitted to those segregated indices easily. The close connectivity structure of Hong Kong, Korea, Singapore and Taiwan with the Indian market index reflects that there exists a strong nature of the influence of these markets on the stock movements in the Indian capital market. Besides, any shocks originating or directed at these markets would be swiftly transmitted to the Indian markets, and this would affect the pricing of securities traded in the Indian capital market.
2. Crisis period analysis
In the threshold filtered network belonging to the crisis-period (Figure 12), we can observe that the stock market indices of Israel (AS_TASE), Pakistan (AS_KSE), Jordan (AS_JSE), Sri Lanka (AS_CSE) and Malaysia (AS_MYX) do not possess any linkage to the major block of Asian indices. Even though there has been a substantial increase in correlation among all the market indices of Asia during the crisis period, segmentation still exists. In this period, the Indian market index (AS_BSE) is connected to South Korea (AS_KRX), Hong Kong (AS_SEHK), Singapore (AS_SGX), Taiwan (AS_TWSE) and Indonesia (AS_IDX). In several past empirical studies [76], it is well documented that there has been a noticeable incline in correlation structures during the times of market stress. The same is noted in the case of the Asian market network. This issue of rising correlations is of particular significance in cases of portfolio constructions wherein the constituting securities belong to international asset classes, and such constructed portfolios should ideally possess the capability to withstand shocks during the times of market stress. A peculiar pattern is observed here that even though there is a rise in correlations amongst the market indices of Asia, disjointed indices, which were present in the pre-crisis period, still exist. Thus, investing in these peripheral markets during the pre-crisis period would have reduced the systemic risk spread to the investable portfolios in the crisis period.
3. Post-crisis period analysis
In the threshold filtered network belonging to the post-crisis period (Figure 12), we can observe that indices of Israel (AS_TASE), Pakistan (AS_KSE), Jordan (AS_JSE), Sri Lanka (AS_CSE) and Malaysia (AS_MYX) do not possess any linkage to the major block of Asian indices. In this period, the Indian market index (AS_BSE) is connected to the market indices of Hong Kong (AS_SEHK), Singapore (AS_SGX), Taiwan (AS_TWSE) and Indonesia (AS_IDX). In the post-crisis period, there is some amount of resemblance to the connectivity structure of pre-crisis periods. However, an observable transformation in the connectivity structure amongst indices in the form of realignment is evident. This realignment in the linkage structures is an outcome of shocks received during the 2008 financial crisis. Though there is a realignment of the linkage structures, the major Asian markets indices of Hong Kong (AS_SEHK) and Singapore (AS_SGX) are still the hub nodes, and the majority of the disjointed indices observed in pre-crisis and post-crisis time frames are still visible.
From the comparative analysis of the three plots, we can infer that the cross-market linkage structure in the post-crisis phase almost resembles that of the pre-crisis period. This resilience of the linkage structure is in line with the fact that Asia’s markets were quick to rebound from the 2008 financial crisis. This rebounding was because of three major reasons [77]. The first reason was that, Asia’s largest economy, China, at that point in time exhibited the fastest recovery rate, and its indicator for growth had a rate much higher than its own domestic long-term trend rate. The second reason for rebounding is that there was a quick rebounding of external factors impacting the Asian countries to the point of the pre-crisis stage. This happened much before the stabilization of overall economic activities had occurred in the Western economies. A steady recovery was observed in Asian countries since February 2009, and subsequently, a normalization of trading and financial activities was also visible. The third reason for the rebounding of the economy to the pre-crisis level was the aggressive level of the countercyclical responsive actions that were initiated by policymakers and regulatory authorities of Asian countries. This pushed the economic activities in those countries to a higher level [78]. Another factor that was also noticeable in the case of the 2008 financial crisis was that in comparison to the delayed rebounding during the Asian crisis, in this crisis, the rebounding was swifter. This was because of the gradual strengthening of the regional linkages among Asian countries in the past decades, which has subsequently resulted in a limited external dependence among the countries in the Asian region. Many past studies using different methodological approaches (econometrics techniques) have also agreed upon the point that the scale of market integration within the economies in the Asian region had inclined either during or after the crisis period. Any form of financial crisis hitting a country, region or globe significantly transforms the stock market relationships with the global markets and the regional markets. All these factors established that whatever events are occurring in the real economy, their subsequent impacts are automatically reflected in the cross-market linkage structures of the capital markets of the respective countries.
However, from the visual comprehension of the plots, we can still observe that pockets of segregated markets that were isolated prior to the crisis and were still in the state of isolation during and after the crisis. Accordingly, these sets of identified disjointed markets in Asia are open avenues for the materialization of international portfolio diversification objectives. Thus, making portfolio investments in these disjointed sets of markets can be a viable approach for protecting the overall portfolio from the systemic shocks of such crisis-like events.

5. Discussions

The current exploratory study begins with some intriguing queries concerning the levels of equity market integration existent among Asian equity markets. Here, we talk about some significant findings that we have discovered from our examination of the questions asked earlier. The first series of queries asked were related to the state of Asian market segmentation in the past 14 years. From our analysis, we could identify that there is a progressive incline in the integration amongst equity markets in Asia; however, some markets are still in a disjointed state. Asian capital markets are currently in the stage of partial integration. The second set of questions was about topological properties. Based on the network analysis, we could find that the centrality measures are varying with respect to the movements of the time windows and reflect changes in network structures over time. The Asian market indices of Singapore, Hong Kong and South Korea have consistently been dominating in the centrality measures; however, their scores kept varying throughout the 14-year study period. The third set of questions was about the observable segmentation in the Asian equity network, from whence diversification benefits may arise. From our analysis of the evolution of the 151 threshold filtered networks over the past 14-year period, it is distinctly clear that Jordanian, Pakistani and Sri Lankan equity markets are segmented from the rest of the markets in Asia, and this leaves an opportunity for regional diversification in Asia. The segmentation of these markets is quite stable across the 151 observations. The fourth set of question was about observable differences in linkage structure and segmentation patterns as a result of the financial crisis in 2008. On comparison of the threshold filtered networks of the pre-crisis period, the crisis-period and the post-crisis period, we could observe that segmentation is still evident. Even though the levels of correlation among Asian markets increased during the 2008 crisis, segmentation was persistent. The fifth set of questions was about the Asian indices that have a profound influence on the overall network and Indian equity market in particular. The overall influence strength analysis of the current study dataset revealed that the market indices of Hong Kong, Singapore, South Korea and Taiwan are the most influential indices in the network. Our analysis has also shown that the stock markets of Hong Kong have had the highest influence over the Indian capital market, followed by Singapore, Indonesia and South Korea. In general, in an integrated financial market, the central markets (as reflected by rankings in centrality measures) take part in vital functionalities and inflict a robust impact on other markets, while the correlations amongst the peripheral markets are feeble in nature and possess relatively higher levels of noise than central markets [79].

6. Conclusions

In short, five key findings emerge from this study: (i) the set of influential Asian indices and their time-variant nature over the 14-year period; (ii) the set of segmented markets and their time-variant nature over the study period; (iii) the set of central and peripheral markets in the Asian region; (iv) the set of influential Asian markets that have had continuous influence on the Indian market; and (v) segmentation patterns among Asian indices during the phases of the 2008 financial crisis.
In the context of integrated Asian equity markets, the indices identified in the current study with high degrees of centrality measures and node strength are susceptible critical positions for the spread of systemic risk. Any Asian index possessing a higher linkage with this set of influential nodes (identified in this study) will have a more prominent plausibility of getting affected by the systemic shocks hitting those markets. For international fund portfolio managers, handling a diverse volume of investible securities (such as international pension funds, international mutual funds, derivatives and Exchange-Traded Funds (ETFs)), it is a bigger challenge to manage the risk arising because of the impact of systemic risk originating in domestic, regional and international platforms on geographically-diversified cross-market funds. The issue is much amplified, especially in the case of regional investments funds management, because countries within the region have traditionally been much more economically interdependent than countries across the region. In this specific situation, the identification, characterization and quantifiable evaluation of regional cross-market relationships can reveal key actionable insights, which while supplementing the traditional risk models, can provide improved capabilities for systemic risk management. These network indicators can be supplemented with other measures of market integration for monitoring purposes. For instance, measures like cross-border holdings of financial assets and the size of capital flows can be used suitably [80].
The study has two major limitations. The first limitation is the asynchronous nature of the opening and closing times of the different Asian markets under consideration. Trading hours of an asynchronous nature constantly pose a hurdle when investigating comovements of market index prices of different countries. In this context, two approaches can be employed feasibly. The first approach is the utilization of leading and lagging terms for accommodating trading hours of the asynchronous type. The deployment of this approach is well demonstrated in the study by Bracker et al. [81]. The second tactic is using both opening and closing prices for cross-market linkage analysis as demonstrated in the work by Yang [82]. The current study can be extended by deploying these two approaches on the daily closing prices of the Asian market indices and further building the weighted networks.
The second limitation is that the current investigation has not considered the impact of intra-day high-frequency trading activities on cross-market integration patterns. The investigation is based on the data of closing prices on a daily basis. The linkage dynamics created as a result of high-frequency trading in the Asian markets have not been explored. The current study can be further extended by using a dataset of high-frequency market index prices for the Asian markets and deploying those in the weighted network methodologies. The integration patterns obtained from analysing the high-frequency dataset could be further compared with those of the findings obtained in the current study. This comparative analysis would provide insights into the scale of integration in daily and intraday frequencies.
Data-driven approaches like this methodology could be utilized in creating a systemic risk-tolerant international (regional or global) diversified portfolio. To fulfil such a desideratum, there should be additional research efforts in future phases. One such practical direction is to take the segmented securities (Asian indices) identified in this study and use them in a Markowitz optimization model to generate an optimal portfolio and test the risk-return measures in ex-ante and ex-post scenarios. The returns and risks of this optimal portfolio can be further compared with the post-optimization returns obtained from unfiltered correlation matrices to assess the benefits of network filtering, prior to optimization.
Another future direction of research may be in the cross-market portfolio selection step. The selection of a regionally-diversified cross-market portfolio can be attempted based on topological parameters such as centrality measures. The study by Ren et al. [79] has successfully demonstrated the use of network metrics for portfolio selection of stocks. An analogous approach can be employed for the selection of asset classes for regional or international diversified portfolios.

Supplementary Materials

The following are available online at https://www.mdpi.com/2306-5729/2/4/41/s1. Figure S1: Temporal plot of Eigen vector centrality.

Acknowledgments

The authors have not received any funds for covering open access publication fees. The authors acknowledge Minu Susan Koshy, Faculty, School of Management Studies, National Institute of Technology, Calicut, for her support in proof-reading the manuscript.

Author Contributions

B.B. and A.A. conceived of and designed the experiments. B.B. performed the experiments. B.B., A.A. and M.S. analysed the data. B.B. wrote the paper.

Conflicts of Interest

The authors declare no conflict of interest. The founding sponsors had no role in the design of the study; in the collection, analyses or interpretation of data; in the writing of the manuscript; nor in the decision to publish the results.

References

  1. Setiawan, K. An alternative perspective on the stock markets integration: Multilateral measure of the degree of integration. In Proceedings of the 3rd EMG Conference on Emerging Markets Finance, London, UK, 5–6 May 2011; CASS Business School—City University London: London, UK, 2011; pp. 1–33. [Google Scholar]
  2. Bekaert, G.; Harvey, C. Time-varying world market integration. J. Financ. 1995, 50, 403–444. [Google Scholar] [CrossRef]
  3. Chan, K.C.; Gup, B.E.; Pan, M.-S. An empirical analysis of stock prices in Major Asian markets and the United States. Financ. Rev. 1992, 27, 289–307. [Google Scholar] [CrossRef]
  4. Hung, B.W.-S.; Cheung, Y.-L. Interdependence of Asian emerging equity markets. J. Bus. Financ. Account. 1995, 22, 281–288. [Google Scholar] [CrossRef]
  5. Defusco, R.A.; Geppert, J.M.; Tsetsekos, G.P. Long-run diversification potential in emerging stock markets. Financ. Rev. 1996, 31, 343–363. [Google Scholar] [CrossRef]
  6. Masih, R.; Masih, A.M. Long and short term dynamic causal transmission amongst international stock markets. J. Int. Money Financ. 2001, 20, 563–587. [Google Scholar] [CrossRef]
  7. Chung, P.J.; Liu, D.J. Common stochastic trends in Pacific Rim stock markets. Q. Rev. Econ. Financ. 1994, 34, 241–259. [Google Scholar] [CrossRef]
  8. Arshanapalli, B.; Doukas, J.; Lang, L.H. Pre and post-October 1987 stock market linkages between U.S. and Asian markets. Pac. Basin Financ. J. 1995, 3, 57–73. [Google Scholar] [CrossRef]
  9. Cheung, D.W. Pacific rim stock market integration under different federal funds rate regimes. J. Bus. Financ. Account. 1997, 24, 1343–1351. [Google Scholar] [CrossRef]
  10. Janakiramanan, S.; Lamba, A.S. An empirical examination of linkages between Pacific-Basin stock markets. J. Int. Financ. Mark. Inst. Money 1998, 8, 155–173. [Google Scholar] [CrossRef]
  11. Dekker, A.; Sen, K.; Young, M.R. Equity market linkages in the Asia Pacific region. Glob. Financ. J. 2001, 12, 1–33. [Google Scholar] [CrossRef]
  12. Mantegna, R. Hierarchical structure in financial markets. Eur. Phys. J. B 1999, 11, 193–197. [Google Scholar] [CrossRef]
  13. Onnela, J.-P.; Chakraborti, A.; Kaski, K.; Kertész, J. Dynamic asset trees and Black Monday. Phys. A Stat. Mech. Appl. 2003, 324, 247–252. [Google Scholar] [CrossRef]
  14. Tumminello, M.; Lillo, F.; Mantegna, R.N. Correlation, hierarchies, and networks in financial markets. J. Econ. Behav. Organ. 2010, 75, 40–58. [Google Scholar] [CrossRef]
  15. Plerou, V.; Gopikrishnan, P.; Rosenow, B.; Amaral, L.A.N.; Guhr, T.; Stanley, H.E. Random matrix approach to cross correlations in financial data. Phys. Rev. E 2002, 65, 066126. [Google Scholar] [CrossRef] [PubMed]
  16. Boginski, V.; Butenko, S.; Pardalos, P.M. Statistical analysis of financial networks. Comput. Stat. Data Anal. 2005, 48, 431–443. [Google Scholar] [CrossRef]
  17. Huang, W.-Q.; Zhuang, X.-T.; Yao, S. A network analysis of the Chinese stock market. Phys. A Stat. Mech. Appl. 2009, 388, 2956–2964. [Google Scholar] [CrossRef]
  18. Sinha, S.; Pan, R.K. Uncovering the internal structure of the Indian financial market: Large Cross-correlation behavior in the NSE. In Econophysics of Markets and Business Networks: Proceedings of the Econophys-Kolkata III; Chatterjee, A., Chatterjee, B.K., Eds.; Springer: Berlin/Heidelberg, Germany, 2007; pp. 3–19. [Google Scholar]
  19. Namaki, A.; Shirazi, A.; Raei, R.; Jafari, G. Network analysis of a financial market based on genuine correlation and threshold method. Phys. A Stat. Mech. Appl. 2011, 390, 3835–3841. [Google Scholar] [CrossRef]
  20. Bonanno, G.; Caldarelli, G.; Lillo, F.; Miccichè, S.; Vandewalle, N.; Mantegna, R.N. Networks of equities in financial markets. Eur. Phys. J. B Condens. Matter 2004, 38, 363–371. [Google Scholar] [CrossRef]
  21. Tumminello, M.; Matteo, T.D.; Aste, T.; Mantegna, R.N. Correlation based networks of equity returns sampled at different time horizons. Eur. Phys. J. B 2007, 55, 209–217. [Google Scholar] [CrossRef]
  22. Tumminello, M.; Aste, T.; Matteo, T.D.; Mantegna, R.N. A tool for filtering information in complex systems. Proc. Natl. Acad. Sci. USA 2005, 102, 10421–10426. [Google Scholar] [CrossRef] [PubMed]
  23. Aste, T.; Shaw, W.; Matteo, T.D. Correlation structure and dynamics in volatile markets. New J. Phys. 2010, 12, 085009. [Google Scholar] [CrossRef]
  24. Aste, T.; Matteo, T.D. Dynamical networks from correlations. Phys. A Stat. Mech. Appl. 2006, 370, 156–161. [Google Scholar] [CrossRef]
  25. Matteo, T.D.; Pozzi, F.; Aste, T. The use of dynamical networks to detect the hierarchical organization of financial market sectors. Eur. Phys. J. B 2009, 73, 3–11. [Google Scholar] [CrossRef]
  26. Şensoy, A.; Tabak, B. Dynamic Spanning Tree Approach—The Case of Asia-Pacific Stock Markets; Working Paper Series No. 15; Research Department of Borsa İstanbul: İstanbul, Turkey, 2014. [Google Scholar]
  27. Pukthuanthong, K.; Roll, R. Global market integration: An alternative measure and its application. J. Financ. Econ. 2009, 94, 214–232. [Google Scholar] [CrossRef]
  28. Volosovych, V. Measuring financial market integration over the long run: Is there a U-Shape? J. Int. Money Financ. 2011, 30, 1535–1561. [Google Scholar] [CrossRef] [Green Version]
  29. Billio, M.; Donadelli, M.; Paradiso, A.; Riedel, M. Which market integration measure? J. Bank. Financ. 2017, 76, 150–174. [Google Scholar] [CrossRef]
  30. Bhattacharjee, B.; Shafi, M.; Acharjee, A. Investigating the influence relationship models for stocks in Indian Equity Market: A weighted network modelling study. PLoS ONE 2016, 11, e0166087. [Google Scholar] [CrossRef] [PubMed]
  31. Kim, H.-J.; Lee, Y.; Kahng, B.; Kim, I.-M. Weighted scale-free network in financial correlations. J. Phys. Soc. Jpn. 2002, 71, 2133–2136. [Google Scholar] [CrossRef]
  32. Kim, H.J.; Kim, I.M.; Lee, Y.; Kahng, B. Scale-free network in stock market. J. Korean Phys. Soc. 2002, 40, 1105–1108. [Google Scholar]
  33. Hsieh, D.A. Chaos and nonlinear dynamics: Application to financial markets. J. Financ. 1991, 46, 1839–1877. [Google Scholar] [CrossRef]
  34. Scheinkman, J.A.; Lebaron, B. Nonlinear dynamics and stock returns. J. Bus. 1989, 62, 311–337. [Google Scholar] [CrossRef]
  35. Campbell, J.Y.; Lo, A.W.; MacKinlay, A.C. The Econometrics of Financial Markets; New Age International (P) Ltd.: New Dehli, India, 2011. [Google Scholar]
  36. Bampinas, G.; Panagiotidis, T. On the relationship between oil and gold before and after financial crisis: Linear, nonlinear and time-varying causality testing. Stud. Nonlinear Dyn. Econom. 2015, 19, 657–668. [Google Scholar] [CrossRef]
  37. Bampinas, G.; Panagiotidis, T. Oil and stock markets before and after financial crises: A local Gaussian correlation approach. J. Futures Mark. 2017, 37, 1179–1204. [Google Scholar] [CrossRef]
  38. Goetzmann, W.; Li, L.; Rouwenhorst, K.G. Long-term global market correlations. J. Bus. 2005, 78, 1–38. [Google Scholar] [CrossRef]
  39. Quinn, D.P.; Voth, H.-J. A century of global equity market correlations. Am. Econ. Rev. 2008, 98, 535–540. [Google Scholar] [CrossRef]
  40. Yu, C. Evaluating international financial integration in a center-periphery economy. J. Int. Econ. 2015, 95, 129–144. [Google Scholar] [CrossRef]
  41. Volosovych, V. Learning about financial market integration from principal components analysis. CESifo Econ. Stud. 2012, 59, 360–391. [Google Scholar] [CrossRef]
  42. Ball, C.A.; Torous, W.N. Contagion in the presence of stochastic interdependence. SSRN Electron. J. 2006. [Google Scholar] [CrossRef]
  43. Chiang, T.C.; Jeon, B.N.; Li, H. Dynamic correlation analysis of financial contagion: Evidence from Asian markets. J. Int. Money Financ. 2007, 26, 1206–1228. [Google Scholar] [CrossRef]
  44. Wang, P.; Moore, T. Stock market integration for the transition economies: Time-varying conditional correlation approach. Manch. Sch. 2008, 76, 116–133. [Google Scholar] [CrossRef]
  45. Égert, B.C.A.; Kočenda, E. Time-varying synchronization of European stock markets. Empir. Econ. 2010, 40, 393–407. [Google Scholar] [CrossRef]
  46. Caporale, G.M.; Spagnolo, N. Stock market integration between three CEECs, Russia, and the UK. Rev. Int. Econ. 2011, 19, 158–169. [Google Scholar] [CrossRef]
  47. Bekiros, S.D. Contagion, decoupling and the spillover effects of the US financial crisis: Evidence from the BRIC markets. Int. Rev. Financ. Anal. 2014, 33, 58–69. [Google Scholar] [CrossRef]
  48. Choudhry, T.; Jayasekera, R. Level of efficiency in the UK equity market: empirical study of the effects of the global financial crisis. Rev. Quant. Financ. Account. 2013, 44, 213–242. [Google Scholar] [CrossRef]
  49. Jayasinghe, P.; Tsui, A.K.; Zhang, Z. New estimates of time-varying currency betas: A trivariate BEKK approach. Econ. Model. 2014, 42, 128–139. [Google Scholar] [CrossRef]
  50. Huyghebaert, N.; Wang, L. The co-movement of stock markets in East Asia Did the 1997–1998 Asian financial crisis really strengthen stock market integration? China Econ. Rev. 2010, 21, 98–112. [Google Scholar] [CrossRef]
  51. Chelley-Steeley, P. Equity market integration in the Asia-Pacific region: A smooth transition analysis. Int. Rev. Financ. Anal. 2004, 13, 621–632. [Google Scholar] [CrossRef]
  52. Donadelli, M.; Paradiso, A. Is there heterogeneity in financial integration dynamics? Evidence from country and industry emerging market equity indexes. J. Int. Financ. Mark. Inst. Money 2014, 32, 184–218. [Google Scholar] [CrossRef]
  53. Yu, I.-W.; Fung, K.-P.; Tam, C.-S. Assessing financial market integration in Asia—Equity markets. J. Bank. Financ. 2010, 34, 2874–2885. [Google Scholar] [CrossRef]
  54. Click, R.W.; Plummer, M.G. Stock market integration in ASEAN after the Asian financial crisis. J. Asian Econ. 2005, 16, 5–28. [Google Scholar] [CrossRef]
  55. Leong, S.C.; Felmingham, B. The interdependence of share markets in the developed economies of East Asia. Pac. Basin Financ. J. 2003, 11, 219–237. [Google Scholar] [CrossRef]
  56. Voronkova, S. Equity market integration in Central European emerging markets: A cointegration analysis with shifting regimes. Int. Rev. Financ. Anal. 2004, 13, 633–647. [Google Scholar] [CrossRef]
  57. Hassan, M.; Naka, A. Short-run and long-run dynamic linkages among international stock markets. Int. Rev. Econ. Financ. 1996, 5, 387–405. [Google Scholar] [CrossRef]
  58. Junior, L.S. Cluster formation and evolution in networks of financial market indices. Algorithmic Financ. 2013, 2, 3–43. [Google Scholar]
  59. Mantegna, R.N.; Bulsara, A. Degree of correlation inside a financial market. In Applied Nonlinear Dynamics and Stochastic Systems near the Millennium; Kadtke, J.B., Ed.; American Institute of Physics: New York, NY, USA, 1997; pp. 197–202. [Google Scholar]
  60. Csardi, G.; Nepusz, T. The igraph software package for complex network research. InterJournal Complex Syst. 2006, 1695, 1–9. [Google Scholar]
  61. Freeman, L.C. Centrality in social networks. Soc. Netw. 1978, 1, 215–239. [Google Scholar] [CrossRef]
  62. Freeman, L.C. The Development of Social Network Analysis a Study in the Sociology of Science; Empirical Press: Vancouver, BC, Canada, 2004. [Google Scholar]
  63. McPherson, J.M.; Smith-Lovin, L.; Cook, J.M. Birds of a feather: Homophily in social networks. Annu. Rev. Sociol. 2001, 27, 415–444. [Google Scholar] [CrossRef]
  64. Wasserman, S.; Faust, K. Social Network Analysis: Methods and Applications; Cambridge University Press: New York, NY, USA, 1994. [Google Scholar]
  65. Barrat, A.; Barthelemy, M.; Pastor-Satorras, R.; Vespignani, A. The architecture of complex weighted networks. Proc. Natl. Acad. Sci. USA 2004, 101, 3747–3752. [Google Scholar] [CrossRef] [PubMed]
  66. Opsahl, T.; Colizza, V.; Panzarasa, P.; Ramasco, J.J. Prominence and Control: The weighted rich-club effect. Phys. Rev. Lett. 2008, 101, 168702. [Google Scholar] [CrossRef] [PubMed]
  67. Sabidussi, G. The centrality index of a graph. Psychometrika 1966, 31, 581–603. [Google Scholar] [CrossRef] [PubMed]
  68. Newman, M. The mathematics of networks. New Palgrave Dict. Econ. 2008, 2, 465–470. [Google Scholar]
  69. Brin, S.; Page, L. The anatomy of a large-scale hypertextual Web search engine. Comput. Netw. ISDN Syst. 1998, 30, 107–117. [Google Scholar] [CrossRef]
  70. Soh, H.; Lim, S.; Zhang, T.; Fu, X.; Lee, G.K.K.; Hung, T.G.G.; Di, P.; Prakasam, S.; Wong, L. Weighted complex network analysis of travel routes on the Singapore public transportation system. Phys. A Stat. Mech. Appl. 2010, 389, 5852–5863. [Google Scholar] [CrossRef]
  71. Barthélemy, M.; Barrat, A.; Pastor-Satorras, R.; Vespignani, A. Characterization and modeling of weighted networks. Phys. A Stat. Mech. Appl. 2005, 346, 34–43. [Google Scholar] [CrossRef]
  72. Yang, C.; Chen, Y.; Niu, L.; Li, Q. Cointegration analysis and influence rank—A network approach to global stock markets. Phys. A Stat. Mech. Appl. 2014, 400, 168–185. [Google Scholar] [CrossRef]
  73. Qiao, H.; Xia, Y.; Li, Y. Can network linkage effects determine return? Evidence from Chinese stock market. PLoS ONE 2016, 11, e0156784. [Google Scholar] [CrossRef] [PubMed]
  74. Abdul-Khaliq, S. The impact of stock market liquidity on economic growth in Jordan. Eur. J. Bus. Manag. 2013, 5, 154–158. [Google Scholar]
  75. Petri, M.; Saadi-Sedik, T. The Jordanian stock market: Should you invest in it for risk diversification or performance? IMF Work. Pap. 2006, 6, 1. [Google Scholar] [CrossRef]
  76. Junior, L.S.; Franca, I.D.P. Correlation of financial markets in times of crisis. Phys. A Stat. Mech. Appl. 2012, 391, 187–208. [Google Scholar]
  77. International Monetary Fund. Regional Economic Outlook: Asia and Pacific Building a Sustained Recovery; IMF: Washington, DC, USA, 2009. [Google Scholar]
  78. Yoshida, Y. Is this time different for Asia? Evidence from stock Markets. Discuss. Pap. Kyushu Sangyo Univ. 2010, 4, 1–35. [Google Scholar]
  79. Ren, F.; Lu, Y.-N.; Li, S.-P.; Jiang, X.-F.; Zhong, L.-X.; Qiu, T. Dynamic portfolio strategy using clustering approach. PLoS ONE 2017, 12, e0169299. [Google Scholar] [CrossRef] [PubMed]
  80. Fung, L.K.; Tam, C.; Yu, I. Assessing the integration of Asia’s equity and bond markets. In Proceedings of the First Workshop of the Asian Research Network for Financial Markets and Institutions, Hong Kong, 21 January 2008; pp. 1–37. [Google Scholar]
  81. Bracker, K.; Docking, D.S.; Koch, P.D. Economic determinants of evolution in international stock market integration. J. Empir. Financ. 1999, 6, 1–27. [Google Scholar] [CrossRef]
  82. Yang, S.-Y. Inter-day return and volatility dynamics between Japanese ADRs and their underlying securities. Appl. Financ. Econ. 2007, 17, 837–853. [Google Scholar] [CrossRef]
Figure 1. Complete weighted network of 14 Asian indices. Source: Complete weighted graph generated by employing the igraph package in R [60] and based on the author’s calculation of the weighted correlation coefficient as the weight for each edge. The network exhibited here is representative of one of the 151 temporally-synchronous observations. Each of the temporal observations is a sample of 500 data points. The symbols used for representing the 14 Asian indices are provided in Table 1.
Data 02 00041 g001
Figure 2. Plot of the average number of edges vs. the threshold levels of the weighted network.
Data 02 00041 g002
Figure 3. Temporal variation plot of degree centrality for Asian indices for 14 years.
Data 02 00041 g003
Figure 4. Temporal variation plot of closeness centrality for Asian indices for 14 years.
Data 02 00041 g004
Figure 5. Temporal variation plot of average centrality for Asian indices for 14 years.
Data 02 00041 g005
Figure 6. Temporal variation plot of the overall influence strength for Asian indices for 14 years.
Data 02 00041 g006
Figure 7. Average India-specific influence strength of the other Asian market indices.
Data 02 00041 g007
Figure 8. Temporal plot of India-specific influence strength of Asian indices for the 14-year study period.
Data 02 00041 g008
Figure 9. Filtered connectivity structure of the Asian market indices network in Observation 1 (1 January 2002–23 December 2003).
Data 02 00041 g009
Figure 10. Filtered connectivity structure of the Asian market indices network in Observation 57 (14 June 2006–12 June 2008).
Data 02 00041 g010
Figure 11. Filtered connectivity structure of the Asian market indices network in Observation 149 (6 November 2013–17 November 2015).
Data 02 00041 g011
Figure 12. (a) Filtered network of Asian indices during the pre-crisis period; (b) filtered network of Asian indices during the crisis-period; (c) filtered network of Asian indices during the post-crisis period. All the networks are filtered at the pre-determined optimum threshold level of 0.4.
Data 02 00041 g012
Table 1. List of cross-market integration measures proposed by past studies.
Cross-Market Integration Measure(s)Method of ComputationStudies Using the Measure for Cross-Market Integration
Simple correlation
  • Correlation coefficient of the market index returns between two countries
Ref. [38,39]
R2
  • Measure based on the multi-factor linear model’s explanatory ability
  • Computed by averaging the R2 obtained from the regression model of cross-country data
Ref. [27,40]
1st Principal component
  • Expressed as the proportion of total variation of returns the cross-country market indices
Ref. [28,41]
ASI-adjusted Simple correlations
  • Expressed as the averaged value of the correlation between cross-country market indices
  • Population-based measure
  • Generated by the rolling window approach
Ref. [42]
Dynamic Cross-country Correlations -GARCH
  • Expressed as the averaged value of the dynamic cross-country correlations
Ref. [43,44,45]
Baba Engle Kraft Kroner -GARCH
  • Based on the multivariate Baba–Engle–Kraft–Kroner model
  • Estimated from the temporally-varying covariance and variance values of local market returns between country pairs
  • Derived from the conditional correlations
Ref. [46,47]
Conditional Beta
  • Expressed as the averaged value of the conditional beta of cross-country returns
  • Based on the conditional covariance amongst returns on the portfolio of the global market
Ref. [48,49]
ASI-adjusted R2
  • Expressed in terms of measured correlations from the sample and population
  • Generated by the rolling window approach
Ref. [29]
ASI-adjusted 1st Principal component
  • Expressed in terms of measured correlations from the sample and population
  • Generated by the rolling window approach
Ref. [29]
Forbes–Rigobon Correlation
  • Computed as a volatility-adjusted correlation coefficient
Ref. [29]
ASI: Accounting for Stochastic Interdependence.
Table 2. Findings from cross-market integration studies in the Asian region.
Author (s)Asian Indices StudiedStudy PeriodsMethodologiesFindings about Cross-Market Integration in Asia
Huyghebaert and Wang [50]China (Shanghai and Shenzhen), Hong Kong, Taiwan, Singapore, South Korea and Japan1 July 1992–30 June 2003Granger causality tests, multivariate Granger causality tests based on the VAR model and impulse response analysis
  • Strongest interaction: Singapore and Hong Kong stock markets
  • Comovement of stock markets in East Asia during the 1997–1998 Asian crisis: temporary in nature
  • American market strongly influences market movements in East Asia, Mainland China an exception
Chelley-Steeley [51]Korea, Thailand, Singapore and Taiwan3 January 1990–30 January 2002Smooth transition analysis
  • Thailand: pace of global integration is the fastest
  • Korea, Singapore and Thailand: moving towards progressively lesser segmentations (both in local and global terms)
  • Taiwan: not exhibiting integration of a local or global nature
  • Local integration amongst the Asia-Pacific markets: swifter pace relative to global integration
Donadelli and Paradiso [52] China, India, Malaysia, Pakistan, The Philippines, Sri Lanka and Thailand
Ten sector equity indexes of these countries
January 1994–July 2012Principal component analysis
  • The integration index: demonstrates a J-shaped trend
  • Pakistan: exception case, displays a comparatively lesser correlation over the entire sample period
  • Influence of the crises on market dynamics of Asia vanishes in the period soon after the crisis (both 1990s and early 2000s crises)
  • Sector-wise contribution in cross-market integration: financial sector highest contribution
Yu et al. [53]Japan, Mainland China, Hong Kong SAR, Taiwan, South Korea, Singapore, Malaysia, Thailand, Indonesia and The Philippines16 March 1994–19 December 2008Cross-market return dispersion, Haldane and Hall Kalman filter method, dynamic cointegration analysis, common component approach, market cycle synchronization, dynamic conditional correlation
  • After periods of dwindling returns, the indicators of differential and dispersion have shown increasing trends in the time periods of 2007–2008, indicating high levels of divergence in return
  • Asian markets: somewhat higher responsiveness to the impacts from the regional market indices, compared to American markets in the early period. Since late 2000, lesser impact by regional markets
  • Co-integration among Asian markets: lower in normal times, higher during Asian crises
  • Equity market cycles: have more synchronicity
  • Asian markets: correlate in a positive fashion, Mainland China is the exception case
Click and Plummer [54] Indonesia, Malaysia, The Philippines, Singapore and Thailand1 July 1998–31 December 2002Cointegration analysis
  • ASEAN-5 stock markets: exhibit co-integration, irrespective of weekly (or daily) data and local currencies (or international currencies such as U.S. $ and Japanese Yen)
  • ASEAN-5 stock markets: integrated economically, but integration is partial
  • Indonesian capital market: highly influenced by large markets such as Malaysia, Singapore and Thailand
  • Indonesian market: inverse relationship with markets in Malaysia and The Philippines
Table 3. List of symbols used for referring to the Asian indices.
Symbol UsedCountryStock ExchangeBenchmark Indices
AS_BSEIndiaBombay Stock ExchangeS&P BSE 500 Index
AS_SSEChinaShanghai Stock ExchangeSSE Composite Index
AS_SEHKHong KongStock Exchange of Hong KongHang Seng Index
AS_IDXIndonesiaJakarta Stock Exchange Jakarta Composite Index
AS_TASEIsraelTel Aviv Stock ExchangeTA 25 Index
AS_TSEJapanTokyo Stock ExchangeNIKKEI 255 Index
AS_JSEJordanAmman Stock ExchangeAmman SE AllShare Index
AS_MYXMalaysiaBursa MalaysiaFTSE KLCI Index
AS_KSEPakistanKarachi Stock ExchangeKSE 100 Index
AS_PSEPhilippinesPhilippine Stock ExchangePSEi Index
AS_SGXSingaporeSingapore Exchange limitedFTSE Singapore Index
AS_KRXSouth KoreaKorea ExchangeKOSPI Composite Index
AS_CSESri LankaColombo Stock ExchangeCOLOMBO IND ALL SHS Index
AS_TWSETaiwanTaiwan Stock Exchange Corporation TSEC weighted Index
Table 4. Summary of the average centrality, disparity and influence strength measures of Asian indices.
Asian IndexCountryAverage Closeness CentralityAverage Degree CentralityAverage Eigen Vector CentralityAverage Overall Influence Strength
AS_BSEIndia0.06263403.79968300.83674623.6467550
AS_SSEChina0.04662272.36566320.88032882.2372871
AS_SEHKHong Kong0.07436545.15854820.77053375.0086470
AS_IDXIndonesia0.06912884.41583730.81583314.2644586
AS_TASEIsrael0.05165572.63013780.87924982.4811778
AS_TSEJapan0.06629674.28501940.79934284.1356420
AS_JSEJordan0.02941191.09101450.92931381.0000833
AS_MYXMalaysia0.06236573.72898090.82761623.5344467
AS_KSEPakistan0.03307861.27142880.92347241.1284232
AS_PSEPhilippines0.05916363.34929580.86031583.1989751
AS_SGXSingapore0.07352445.00116710.78052344.8415159
AS_KRXSouth Korea0.07122484.86874340.78569464.7235433
AS_CSESri Lanka0.02814240.94880940.93771920.8151270
AS_TWSETaiwan0.06880794.55699320.79738694.4096110
Table 5. Average centrality scores.
CENTRAL NODESPERIPHERAL NODES
Market IndicesAverage CentralityMarket IndicesAverage Centrality
AS_SEHK (Hong Kong)1.91086705AS_JSE (Jordan)0.755388297
AS_SGX (Singapore)1.889665576AS_CSE (Sri Lanka)0.85636622
AS_TWSE (Taiwan)1.848760205AS_KSE (Pakistan)1.039834298
AS_KRX (Korea)1.772898169AS_SSE (China)1.179702772

