Plant Trait Dataset for Tree-Like Growth Forms Species of the Subtropical Atlantic Rain Forest in Brazil

 , , , and
Abstract
:Abstract
Dataset
Dataset License
1. Introduction
2. Data Description
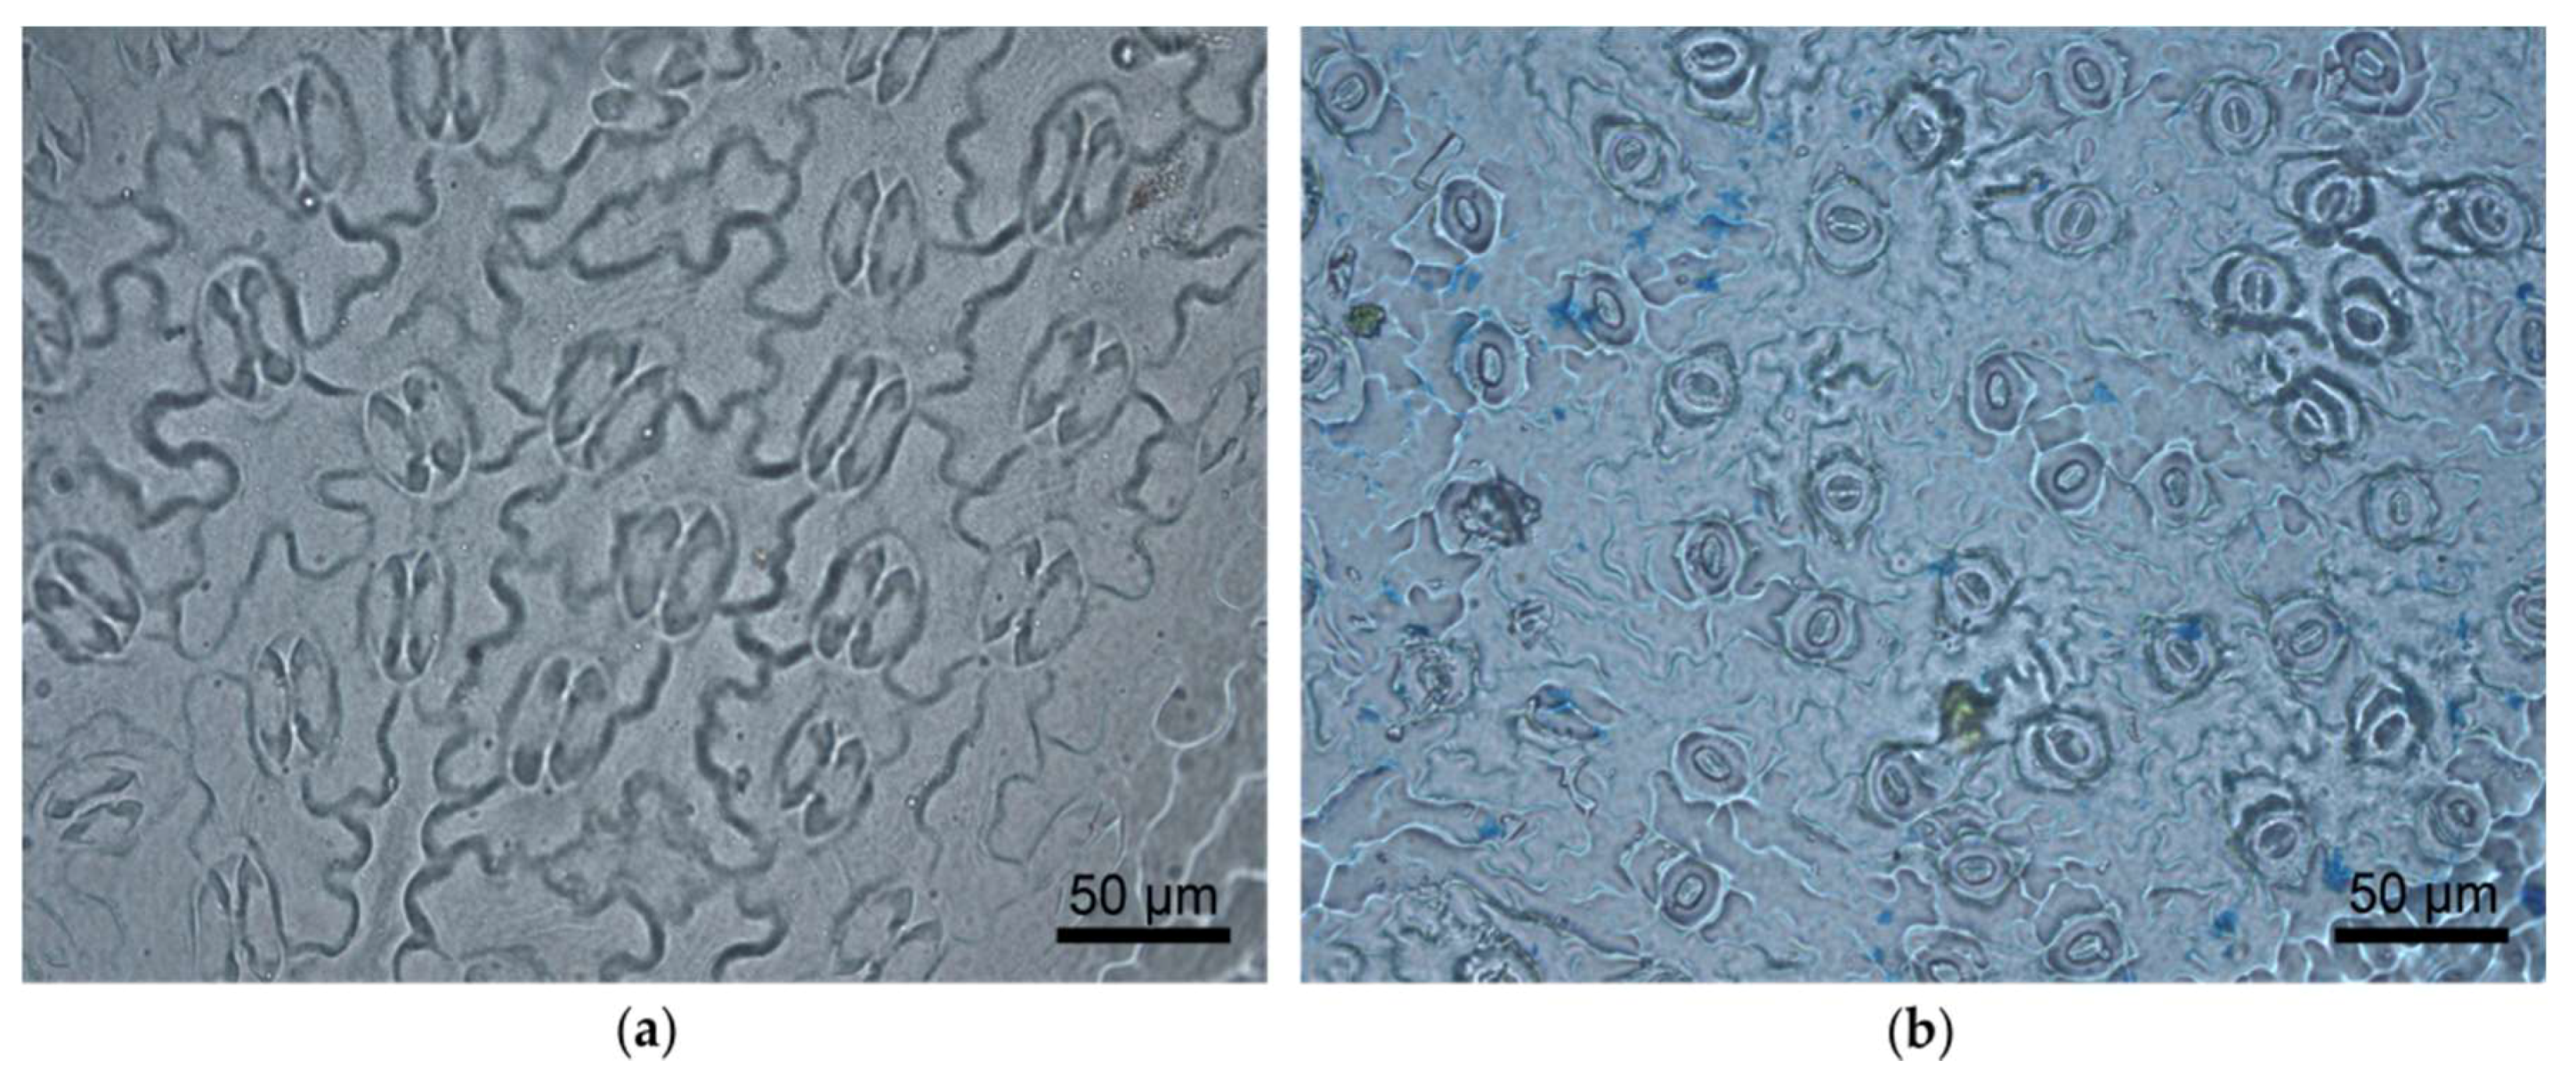
2.1. Images
2.2. Data Tables
3. Methods
3.1. Study Area and the Species Selection
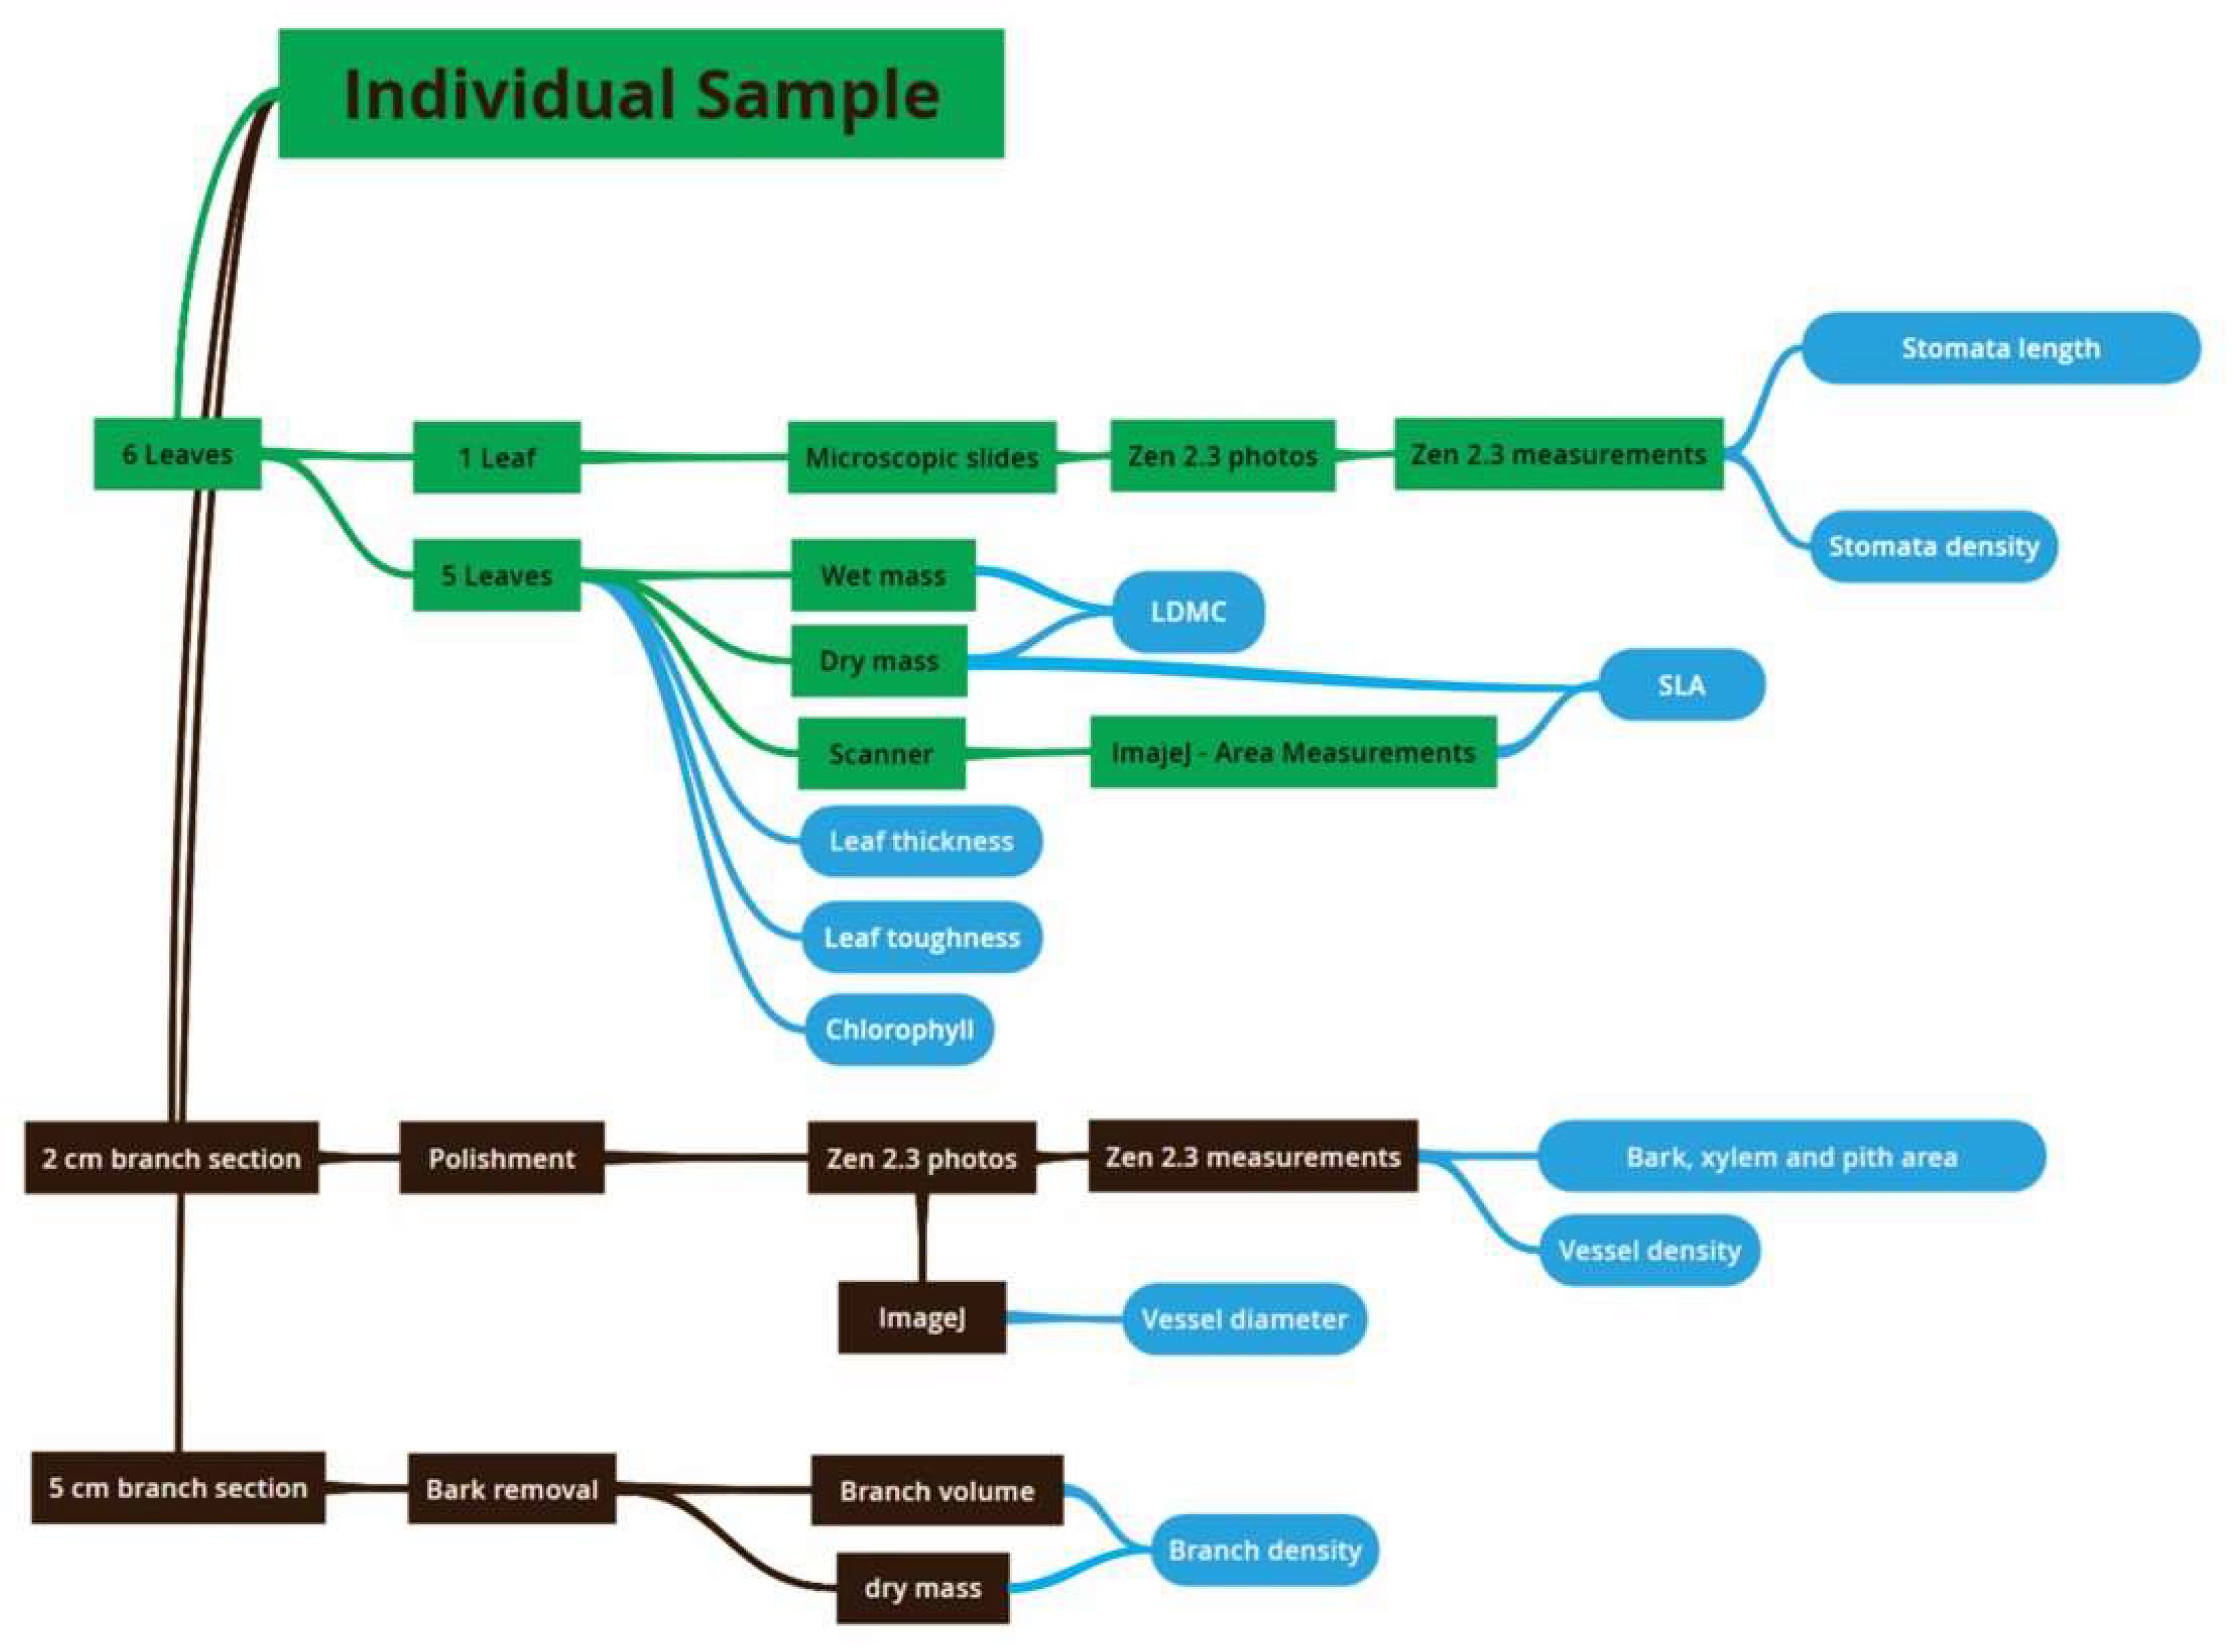
3.2. Trait Measurements at Individual Level
3.2.1. Leaf Measurements
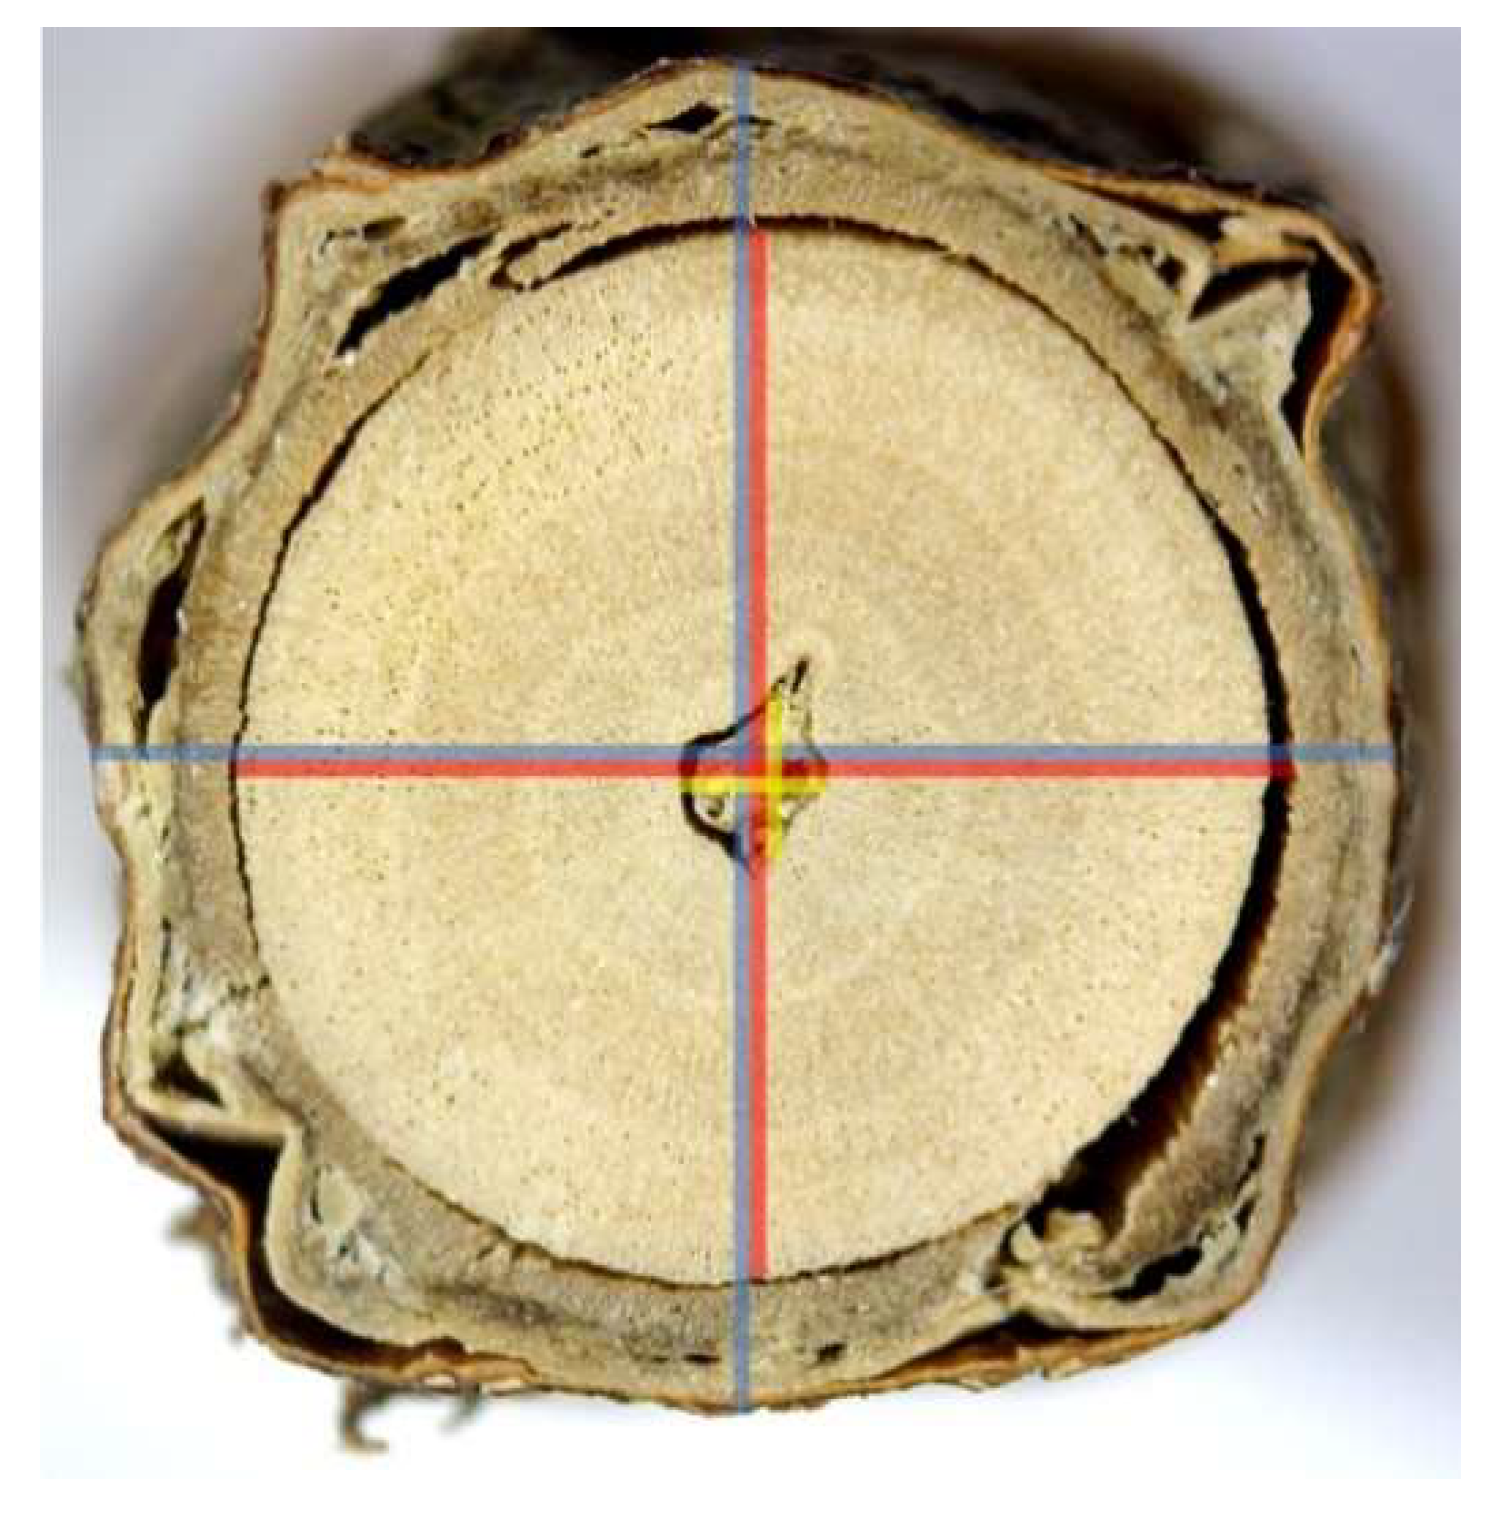
3.2.2. Branch Measurements
3.3. Trait Measurements at Species-Level
4. Conclusions
Author Contributions
Acknowledgments
Conflicts of Interest
References
- Diaz, S.; Cabido, M.; Casanoves, F. Plant functional traits and environmental filters at a regional scale. J. Veg. Sci. 1998, 9, 113–122. [Google Scholar] [CrossRef]
- Westoby, M.; Wright, I.J. Land-plant ecology on the basis of functional traits. Trends Ecol. Evol. 2006, 21, 261–268. [Google Scholar] [CrossRef] [PubMed]
- Poorter, L.; McDonald, I.; Alarcón, A.; Fichtler, E.; Licona, J.C.; Peña-Claros, M.; Sterck, F.; Villegas, Z.; Sass-Klaassen, U. The importance of wood traits and hydraulic conductance for the performance and life history strategies of 42 rainforest tree species. New Phytol. 2010, 185, 481–492. [Google Scholar] [CrossRef] [PubMed]
- Díaz, S.; Kattge, J.; Cornelissen, J.H.C.; Wright, I.J.; Lavorel, S.; Dray, S.; Reu, B.; Kleyer, M.; Wirth, C.; Prentice, I.C.; et al. The global spectrum of plant form and function. Nature 2016, 529, 1–17. [Google Scholar] [CrossRef] [PubMed]
- Violle, C.; Garnier, E.; Lecoeur, J.; Roumet, C.; Podeur, C.; Blanchard, A.; Navas, M.L. Competition, traits and resource depletion in plant communities. Oecologia 2009, 160, 747–755. [Google Scholar] [CrossRef] [PubMed]
- Götzenberger, L.; de Bello, F.; Bråthen, K.A.; Davison, J.; Dubuis, A.; Guisan, A.; Lepš, J.; Lindborg, R.; Moora, M.; Pärtel, M.; et al. Ecological assembly rules in plant communities-approaches, patterns and prospects. Biol. Rev. 2012, 87, 111–127. [Google Scholar] [CrossRef] [PubMed]
- Díaz, S.; Cabido, M. Vive la différence: Plant functional diversity matters to ecosystem processes. Trends Ecol. Evol. 2001, 16, 646–655. [Google Scholar] [CrossRef]
- Diaz, S.; Hodgson, J.G.; Thompson, K.; Cabido, M.; Cornelissen, J.H.C.; Jalili, A.; Montserrat-Martí, G.; Grime, J.P.; Zarrinkamar, F.; Asri, Y.; et al. The plant traits that drive ecosystems: Evidence from three continents. J. Veg. Sci. 2004, 15, 295–304. [Google Scholar] [CrossRef] [Green Version]
- Violle, C.; Navas, M.L.; Vile, D.; Kazakou, E.; Fortunel, C.; Hummel, I.; Garnier, E. Let the concept of trait be functional! Oikos 2007, 116, 882–892. [Google Scholar] [CrossRef]
- Pérez-Harguindeguy, N.; Díaz, S.; Garnier, E.; Lavorel, S.; Poorter, H.; Jaureguiberry, P.; Bret-Harte, M.S.; Cornwell, W.K.; Craine, J.M.; Gurvich, D.E.; et al. New handbook for standardised measurement of plant functional traits worldwide. Aust. J. Bot. 2013, 61, 167. [Google Scholar] [CrossRef]
- Westoby, M.; Falster, D.S.; Moles, A.T.; Vesk, P.A.; Wright, I.J. Plant Ecological Strategies: Some Leading Dimensions of Variation between Species. Annu. Rev. Ecol. Syst. 2002, 33, 125–159. [Google Scholar] [CrossRef]
- Carlucci, M.B.; Streit, H.; Duarte, L.D.S.; Pillar, V.D. Individual-based trait analyses reveal assembly patterns in tree sapling communities. J. Veg. Sci. 2012, 23, 176–186. [Google Scholar] [CrossRef]
- Van der Sande, M.T.; Poorter, L.; Kooistra, L.; Balvanera, P.; Thonicke, K.; Thompson, J.; Arets, E.J.M.M.; Garcia Alaniz, N.; Jones, L.; Mora, F.; et al. Biodiversity in species, traits, and structure determines carbon stocks and uptake in tropical forests. Biotropica 2017, 49, 593–603. [Google Scholar] [CrossRef]
- Kröber, W.; Li, Y.; Härdtle, W.; Ma, K.; Schmid, B.; Schmidt, K.; Scholten, T.; Seidler, G.; von Oheimb, G.; Welk, E.; et al. Early subtropical forest growth is driven by community mean trait values and functional diversity rather than the abiotic environment. Ecol. Evol. 2015, 5, 3541–3556. [Google Scholar] [CrossRef] [PubMed]
- Díaz, S.; Lavorel, S.; Chapin, F.S., III; Tecco, P.A.; Gurvich, D.E.; Grigulis, K. Functional diversity—At the crossroads between ecosystem functioning and environmental filters. In Terrestrial Ecosystems in a Changing World; Springer: Berlin, Germany, 2007. [Google Scholar]
- Kattge, J.; Díaz, S.; Lavorel, S.; Prentice, I.C.; Leadley, P.; Bönisch, G.; Garnier, E.; Westoby, M.; Reich, P.B.; Wright, I.J.; et al. TRY—A global database of plant traits. Glob. Chang. Biol. 2011, 17, 2905–2935. [Google Scholar] [CrossRef] [Green Version]
- Paine, C.E.T.; Baraloto, C.; Díaz, S. Optimal strategies for sampling functional traits in species-rich forests. Funct. Ecol. 2015, 29, 1325–1331. [Google Scholar] [CrossRef]
- Costa, F.; Schietti, J.; Emilio, T.; Poorter, L. Protocol for Screening Functional Traits of the Tree Community Using Understory Material. PPBio—Programa Pesqui. em Biodiversidade. Ministério da Ciência, Tecnol. e Inovação; 2015; pp. 1–6. Available online: https://ppbio.inpa.gov.br/sites/default/files/protocol_functional_traits.pdf (accessed on 10 April 2018).
- Oliveira-Filho, A.T. Um Sistema de Classificação Fisionômico-Ecológico da Vegetação Neotropical: segunda aproximação. In Fitossociologia No Brasil; UFV: Viçosa, Brazil, 2015; Volume 2, pp. 452–474. [Google Scholar]
- Vibrans, A.C.; Sevgnani, L.; Lingner, D.V.; De Gasper, A.L.; Sabbagh, S. Inventário florístico florestal de Santa Catarina (IFFSC): Aspectos metodológicos e operacionais. Pesqui. Florest. Bras. 2010, 30, 291–302. [Google Scholar] [CrossRef]
- Carl Zeiss Microscopy GmbH. Zen Blue. Available online: https://www.zeiss.com/microscopy/int/products/microscope-software/zen-lite.html (accessed on 7 May 2018).
- Schneider, C.A.; Rasband, W.S.; Eliceiri, K.W. NIH Image to ImageJ: 25 years of Image Analysis. Nat. Methods 2012, 9, 671–675. [Google Scholar] [CrossRef] [PubMed]
- De Gasper, A.; Christian Vibrans, A.; Funez, L.A.; Rigon, M.J., Jr.; Bittencourt, F.; Vieira, C., Dr. Roberto Miguel Klein Herbarium (FURB), Blumenau, Southern Brazil. PhytoKeys 2014, 42, 21–37. [Google Scholar] [CrossRef] [PubMed]
- Tyree, M.T.; Ewers, F.W. The Hydraulic Architecture of Trees and Other Woody Plants. New Phytol. 1991, 119, 345–360. [Google Scholar] [CrossRef]


| Column Names | Variable | Unit |
|---|---|---|
| Species | Scientific name | - |
| Sample | Number of samples related to an species | 1–6 |
| Long_W_decimal | Longitude coordinate | decimals |
| Lat_S_decimal | Latitude coordinate | decimals |
| Date_dd/mm/yyyy | Sample collection date | dd/mm/yyyy |
| Chlorophyll_FCI | Chlorophyll content per leaf area | FCI |
| LeafThick_mm | Leaf thickness | mm |
| LWM_g | Leaf wet mass | g |
| LeafArea_cm2 | Leaf area | cm2 |
| LeafTough_N/mm | Leaf toughness | N/mm |
| LDM_g | Leaf dry mass | g |
| BarkProp_% | Proportion of bark cross-sectional area | % |
| PithProp_% | Proportion of pith cross-sectional area | % |
| XylProp_% | Proportion of xylem cross-sectional area | % |
| BranchVol_g/cm3 | Branch volume | cm3 |
| BDM_g | Branch dry mass | g |
| VesselDens_n/mm2 | Vessel density | n/mm2 |
| VesselDiam_micom | Mean vessel diameter | µm |
| StomDens_n/mm2 | Stomata density | n/mm2 |
| StomLength_micom | Mean stomata length | µm |
| Column Names | Variable | Unit |
|---|---|---|
| Species | Scientific name | - |
| SLA_cm2/g | Specific leaf area | cm2/g |
| LDMC_mg/g | Leaf dry-matter content | mg/g |
| Chlorophyll_FCI | Chlorophyll content per leaf area | FCI |
| LeafTough_N/mm | Leaf toughness | N/mm |
| LeafThick_mm | Leaf thickness | mm |
| SSD_g/cm3 | Stem specific density (from branch) | g/cm3 |
| PithProp_% | Proportion of pith cross-sectional area | % |
| XylProp_% | Proportion of xylem cross-sectional area | % |
| BarkProp_% | Proportion of bark cross-sectional area | % |
| VesselDens_n/mm2 | Vessel density | n/mm2 |
| VesselDiam_micom | Vessel diameter | µm |
| StomDens_n/mm2 | Stomata density | n/mm2 |
| StomLength_micom | Stomata length | µm |
| Hpot95_m | Potential plant height (95% percentile) | m |
| DS_anemo-0_zoo-1 | Dispersal syndrome | 0—Anemochory; 1—Zoochory |
| SeedMass_g | Seed mass | g |
| Kpot_kg/m/s/Mpa | Potential hydraulic conductance | kg/m/s/Mpa |
| Column Names | Description |
|---|---|
| Species | Scientific name |
| Number of evaluated seeds | Number of seeds used to obtain the mean mass value or referred in the literature |
| Total dry seed mass (g) | Total seed dry mass measured or referred in the literature |
| Mean dry mass per seed (g) | Seed dry mass mean value |
| Herbarium code | Code of the specimen in the herbarium Dr. Roberto Miguel Klein (FURB); for seed dry mass obtained from our samples, the number of the sample is provided |
| Reference | Short reference (the full reference is in the Reference spreadsheet) |
© 2018 by the authors. Licensee MDPI, Basel, Switzerland. This article is an open access article distributed under the terms and conditions of the Creative Commons Attribution (CC BY) license (http://creativecommons.org/licenses/by/4.0/).
Share and Cite
Rodrigues, A.V.; Bones, F.L.V.; Schneiders, A.; Oliveira, L.Z.; Vibrans, A.C.; Gasper, A.L.d. Plant Trait Dataset for Tree-Like Growth Forms Species of the Subtropical Atlantic Rain Forest in Brazil. Data 2018, 3, 16. https://doi.org/10.3390/data3020016
Rodrigues AV, Bones FLV, Schneiders A, Oliveira LZ, Vibrans AC, Gasper ALd. Plant Trait Dataset for Tree-Like Growth Forms Species of the Subtropical Atlantic Rain Forest in Brazil. Data. 2018; 3(2):16. https://doi.org/10.3390/data3020016
Chicago/Turabian StyleRodrigues, Arthur Vinicius, Fábio Leal Viana Bones, Alisson Schneiders, Laio Zimermann Oliveira, Alexander Christian Vibrans, and André Luís de Gasper. 2018. "Plant Trait Dataset for Tree-Like Growth Forms Species of the Subtropical Atlantic Rain Forest in Brazil" Data 3, no. 2: 16. https://doi.org/10.3390/data3020016