1. Introduction
Advanced gas turbines operate at extremely high temperatures to achieve high engine performance. Cooling techniques are indispensable to ensure the durability of the turbine components by protecting them from the hot mainstream gases. Film cooling is a widely used cooling technique. However, while protecting the turbine blades, film cooling impacts the engine performance negatively, particularly when the coolant penetrates the mainstream. Over the past decades, research efforts have been dedicated to improving film-cooling efficiency. Film cooling is accomplished by injecting jets of colder air bled from the compressor over the turbine blade vanes which gives rise to a series of fluid mechanical phenomena, the counter-rotating vortex pair (CRVP or CVP) being the one affecting the film-cooling effectiveness (η) most significantly.
Sinha et al. [
1] proposed the momentum flux ratio (
I) as the key factor influencing
η. The coolant jet liftoff was also observed, and the film-cooling flow was classified into three flow types: attached, detached and reattached flow. The detachment-reattachment development was thought to be a function of the momentum flux ratio (
I). Goldstein et al. [
2] and Yu et al. [
3] attributed the high performance of the diffusing cooling holes to the decrease in the jet mean velocity. Consequently, research efforts of improving film-cooling efficiency focused on decreasing the jet velocity by expanding the exit of the cooling hole. Ghorab et al. [
4] and Zhang and Hassan [
5] proposed the louver scheme. It has a large exit, and provides a performance superior to other film-cooling schemes. Zhang and Hassan [
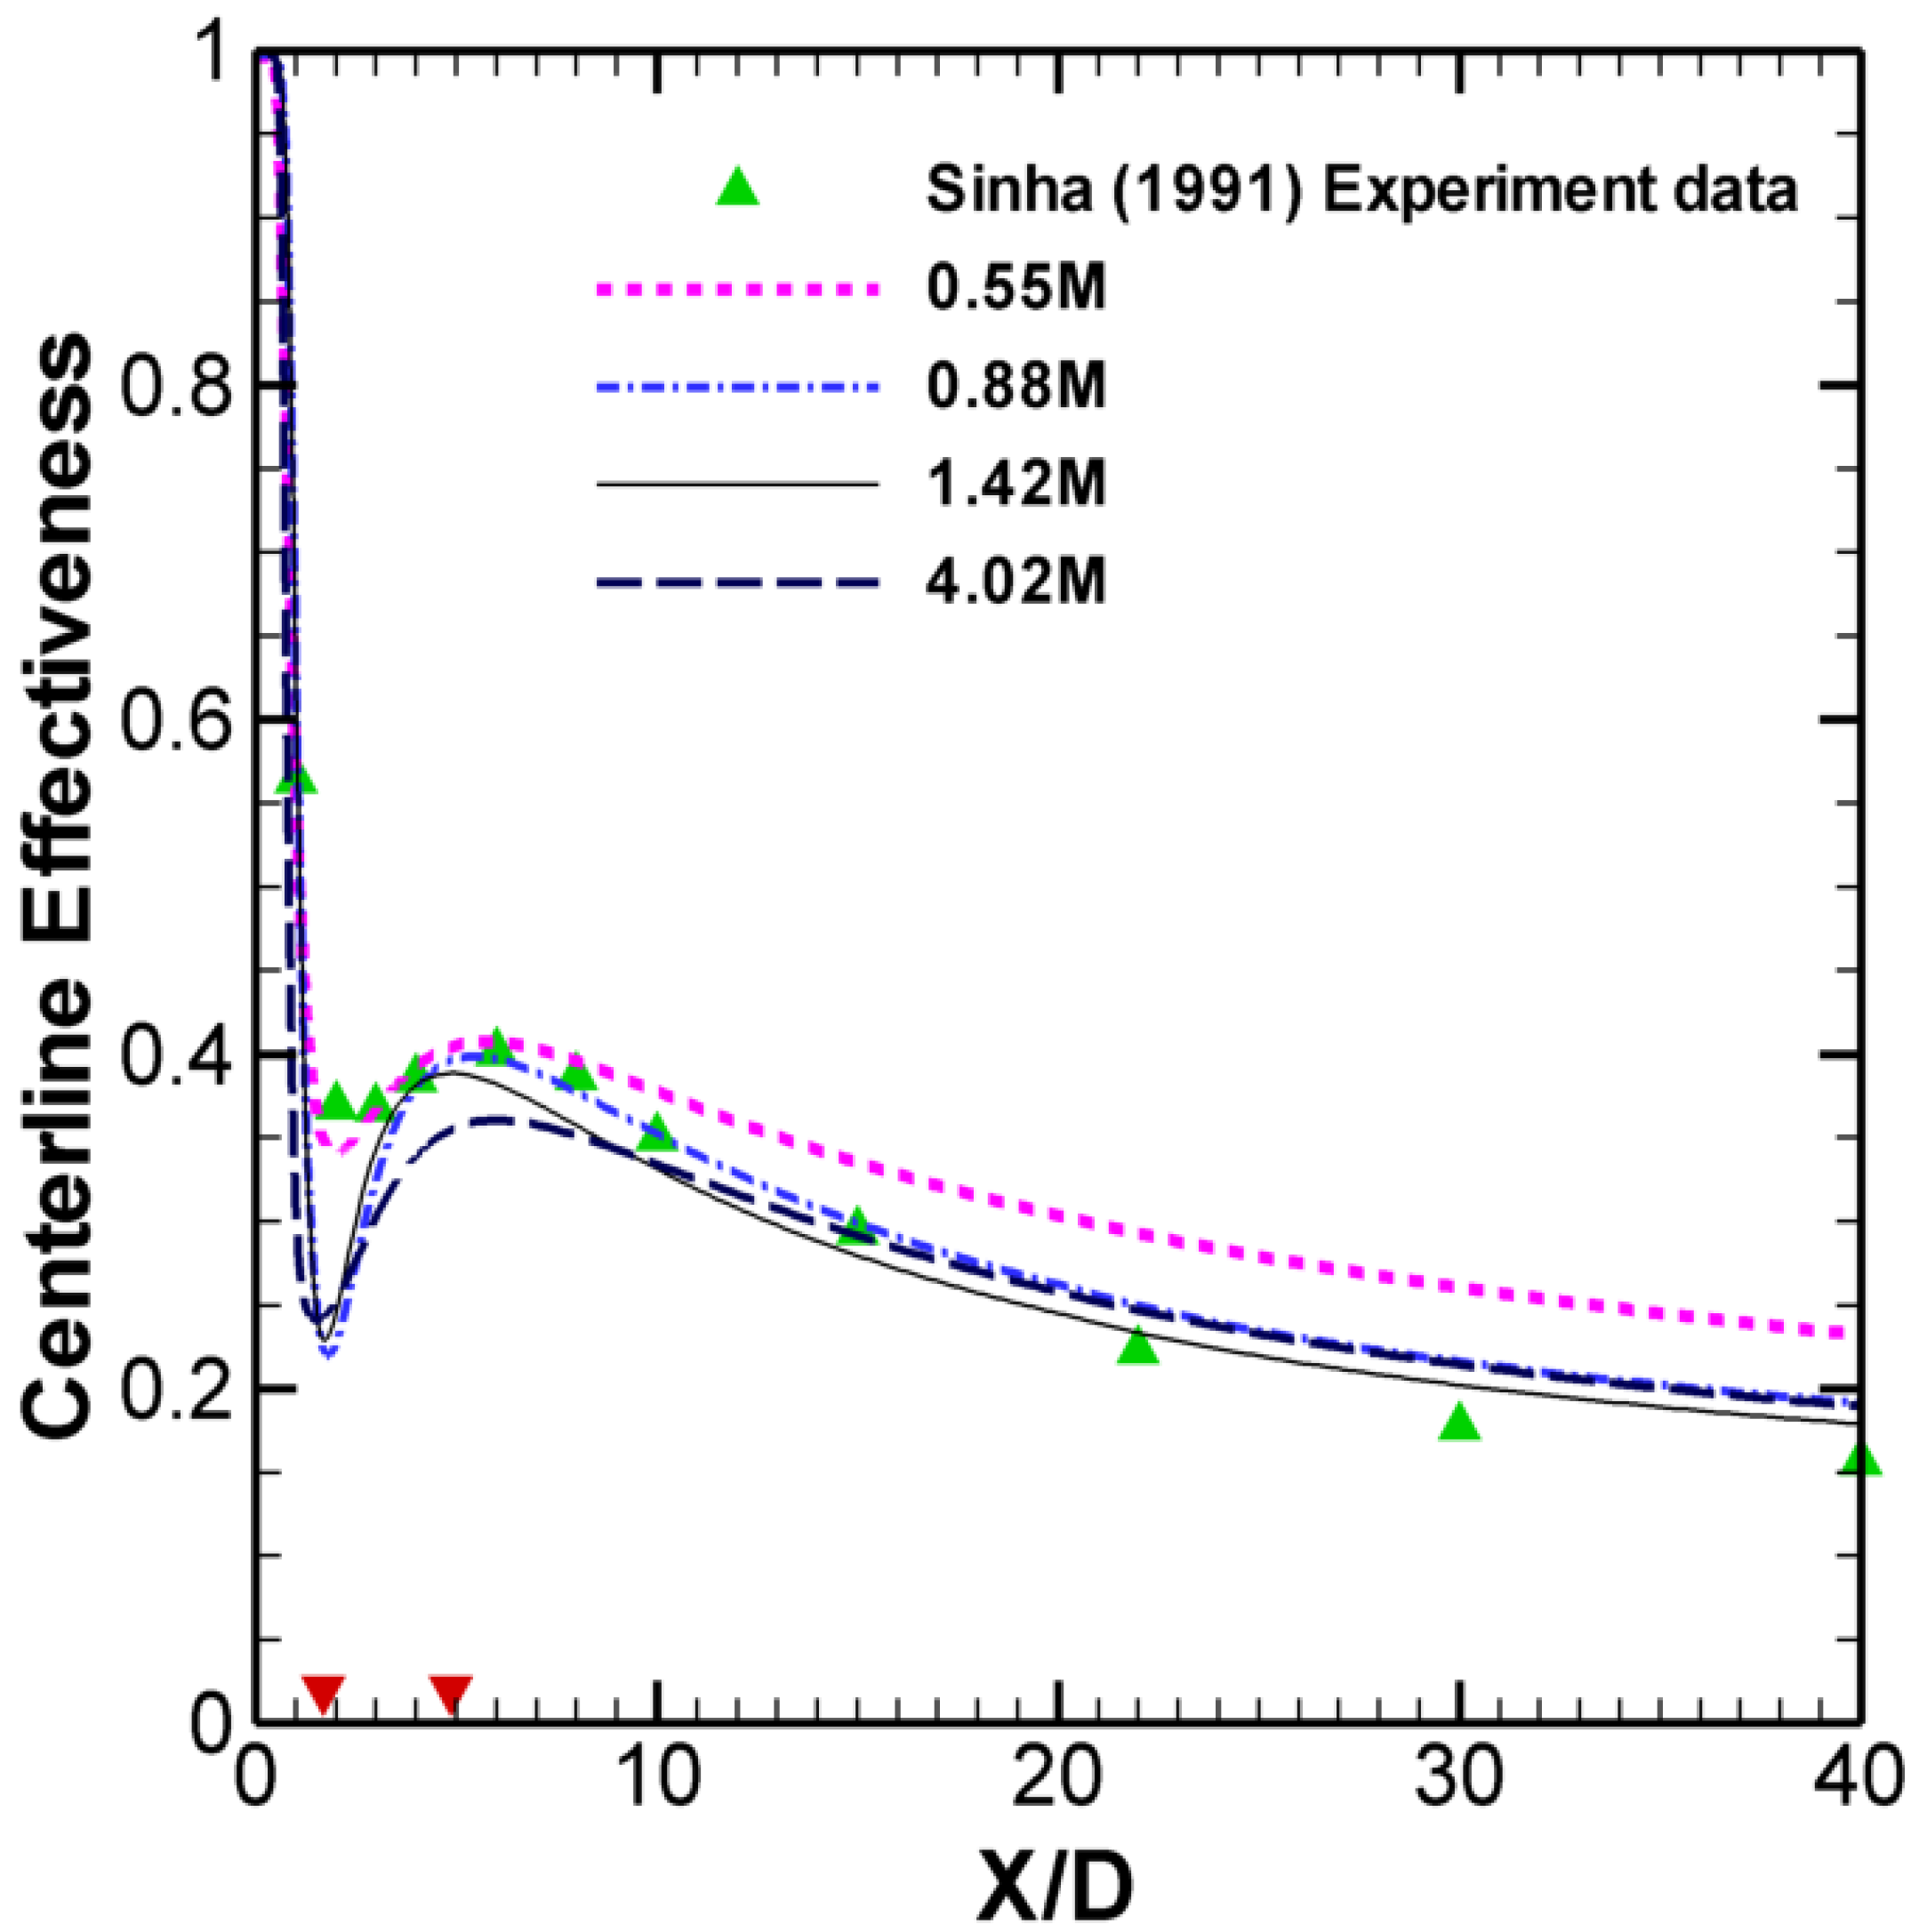
5] also compared the performance of four different RANS turbulence models: the
k-ε,
k-ω, Reynolds stress model (RSM) and Spalart-Allmaras model, coupled with different near-wall treatments. The realizable
k-ε (RKE) model coupled with the standard wall functions correctly predicted this flow and demonstrated good agreement with experimental data and was therefore used in this work in simulating cases 1 and 2.
The CRVP was thought to decrease the film-cooling performance significantly. Fric and Roshko [
6] presented, in
Figure 1 of their paper, an illustration to clarify the near-field vortical structures observed in their experimental investigation of a jet in crossflow (JICF). Their work was based on the assumption of circulation forming in the boundary layer. Accordingly, the CRVP was also thought to be formed from the in-hole boundary layer. Haven and Kurosaka [
7] described the mechanisms of two vortical structures observed in a JICF. They were named kidney and anti-kidney vortices (another name for CRVP). The former were supposed to form from the span-wise boundary layers of the cooling hole, while the latter from the leading edge and trailing edge boundary layers. The anti-kidney vortices were supposed to decrease the strength of the kidney vortices. Correspondingly, Haven et al. [
8] attributed the superior performance of the shaped hole to the anti-kidney vortices that could cancel out the negative effect of the kidney vortices.
Leylek and Zerkle [
9] visualized a pair of counter-rotating in-tube vortices and the CRVP. The authors deduced that the jet trajectory was an important indicator of
η. Walters and Leylek [
10] identified the CRVP and deduced that the main source of the CRVP was the vorticity generated in the in-hole boundary layer. Based on this assumption, Hyams and Leylek [
11] compared the performance of several hole shapes with the cylindrical hole, and proposed that the CRVP came from the X-component of the in-hole vorticity (X being the mainstream flow direction). Accordingly, the forward-diffused holes should have better performance than the laterally-diffused holes. However, their numerical study produced the opposite result which suggests that their argument is probably incomplete.
Kim and Hassan [
12] employed a RKE-based DES model to simulate the film-cooling flow. CRVP was captured in this simulation. Its origin was thought to be due to the vorticity generated in the jet boundary layer. It was the only pattern that could be observed in steady flow.
CRVP is also an important topic in JICF. Kelso et al. [
13] experimentally demonstrated that the in-hole boundary layer led to CRVP formation, and the in-hole flow separation at the cooling pipe entrance was an important factor affecting the CRVP formation. Yuan et al. [
14] introduced a mechanism named hanging vortex. It was suggested to lead to the formation of the CRVP. This mechanism was also proposed by Recker et al. [
15]. Guo et al. [
16] suggested that the jet-crossflow shear layer and the in-hole vorticity were the two main contributors to CRVP. Marzouk and Ghoniem [
17] performed an unsteady numerical simulation of the JICF. The shear layer was thought to be the source of CRVP and the ring-like vortex (RLV). The authors concluded that the shear layer rolled up and formed the RLV, which elongated axially on its lee side to form the CRVP. The authors also identified a crucial feature, namely that the CRVP was in the mean (steady) flow field, even though the roll-up of RLVs was periodic (unsteady). Their work was subsequently extended by Schlegel et al. [
18] who focused on the boundary layer effects on vortical structures. They proved that the wall boundary layer was not necessary for the initiation of CVP, but it enhanced the CRVP strength; however, its influence is at best a second-order effect on the large-scale structure of the jet flow field.
Several new film-cooling schemes related to CRVP have been proposed such as the double-jet proposed by Kusterer et al. [
19], the branch holes proposed by Heidmann and Ekkad [
20] and Dhungel et al. [
21], and the sister hole scheme proposed by Marc and Jubran [
22,
23]. The increased cooling performances were attributed to the decrease of the CRVP strength.
Li and Hassan [
24] clarified the effects of the momentum flux ratio
I and the CRVP on the film effectiveness
η. The authors proposed that the CRVP strength is the most critical factor governing the film-cooling performance. Additionally, the momentum flux ratio has no direct impact on the film-cooling effectiveness, though it takes effect through CRVP.
As CRVP was identified as the key factor affecting η, the research direction of a new film-cooling scheme should aim to decrease CRVP strength. Therefore, the investigation of CRVP physics has become urgently needed. The CRVP was suggested to originate from in-tube vortices entering from the pipe inlet, in-tube boundary layer and/or jet-mainstream shear layer. The present paper is intended to clarify the main source of CRVP. Furthermore, the detached-reattached flow phenomenon was thought to be evidence of the momentum effect. The present paper will endeavor to determine the fundamentals of this phenomenon in the context of film-cooling flow in gas turbines.
3. Results and Discussion
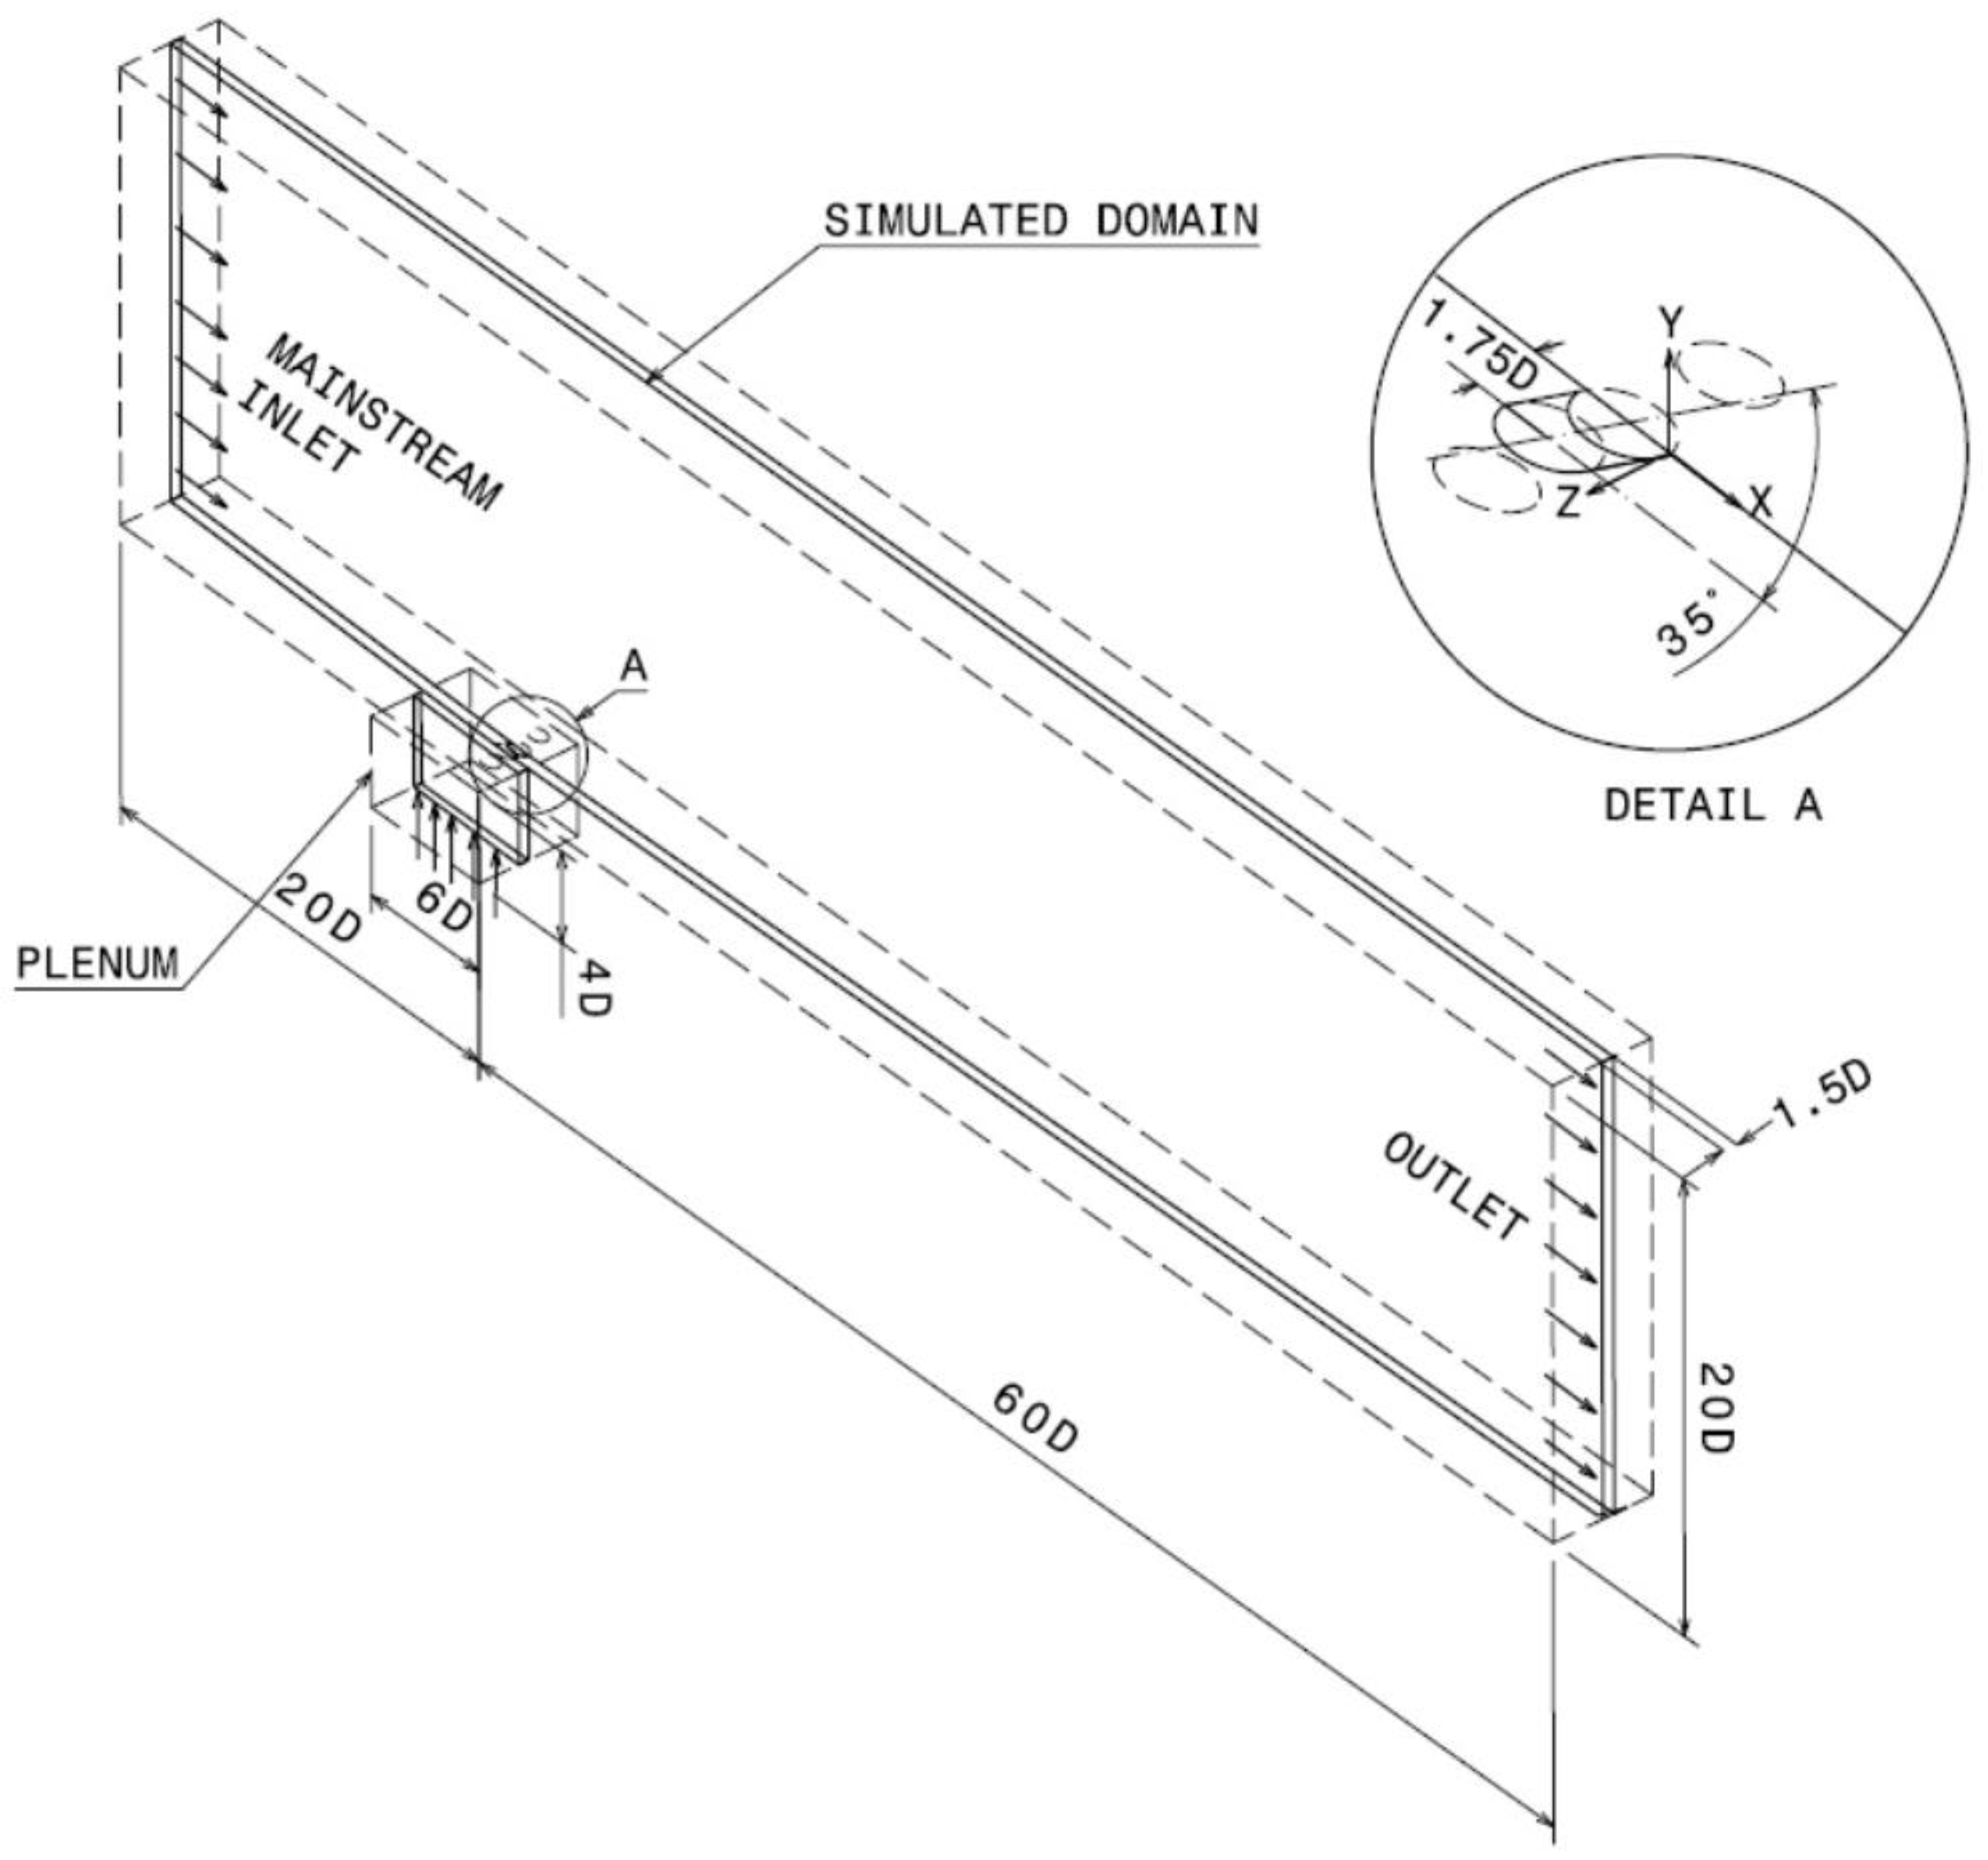
To assess the relative importance of each of the three sources that affect the formation and development of the CRVP, the flow fields for Cases 1–3 described in the previous section, are simulated numerically and used to visualize and analyze the CRVP formation and development in the main flow direction. These flow fields are also used to analyze the in-tube boundary layer effect. Finally, the mechanism of jet liftoff and reattachment is closely examined.
Before getting into presenting the results and discussing the flow physics, let us note that papers [
2,
17,
18] are the papers that elaborated most on the flow physics of a jet in a cross flow and that these papers focused on a jet entering at 90° to the main flow and at a blowing ratio between 6 and 10. Because in the present case the jet enters at 35° and at a blowing ratio of 1, these differences have a drastic impact on interpreting the flow physics as will be evident in what follows.
3.1. Formation of the Counter-Rotating Vortex Pair (CRVP)
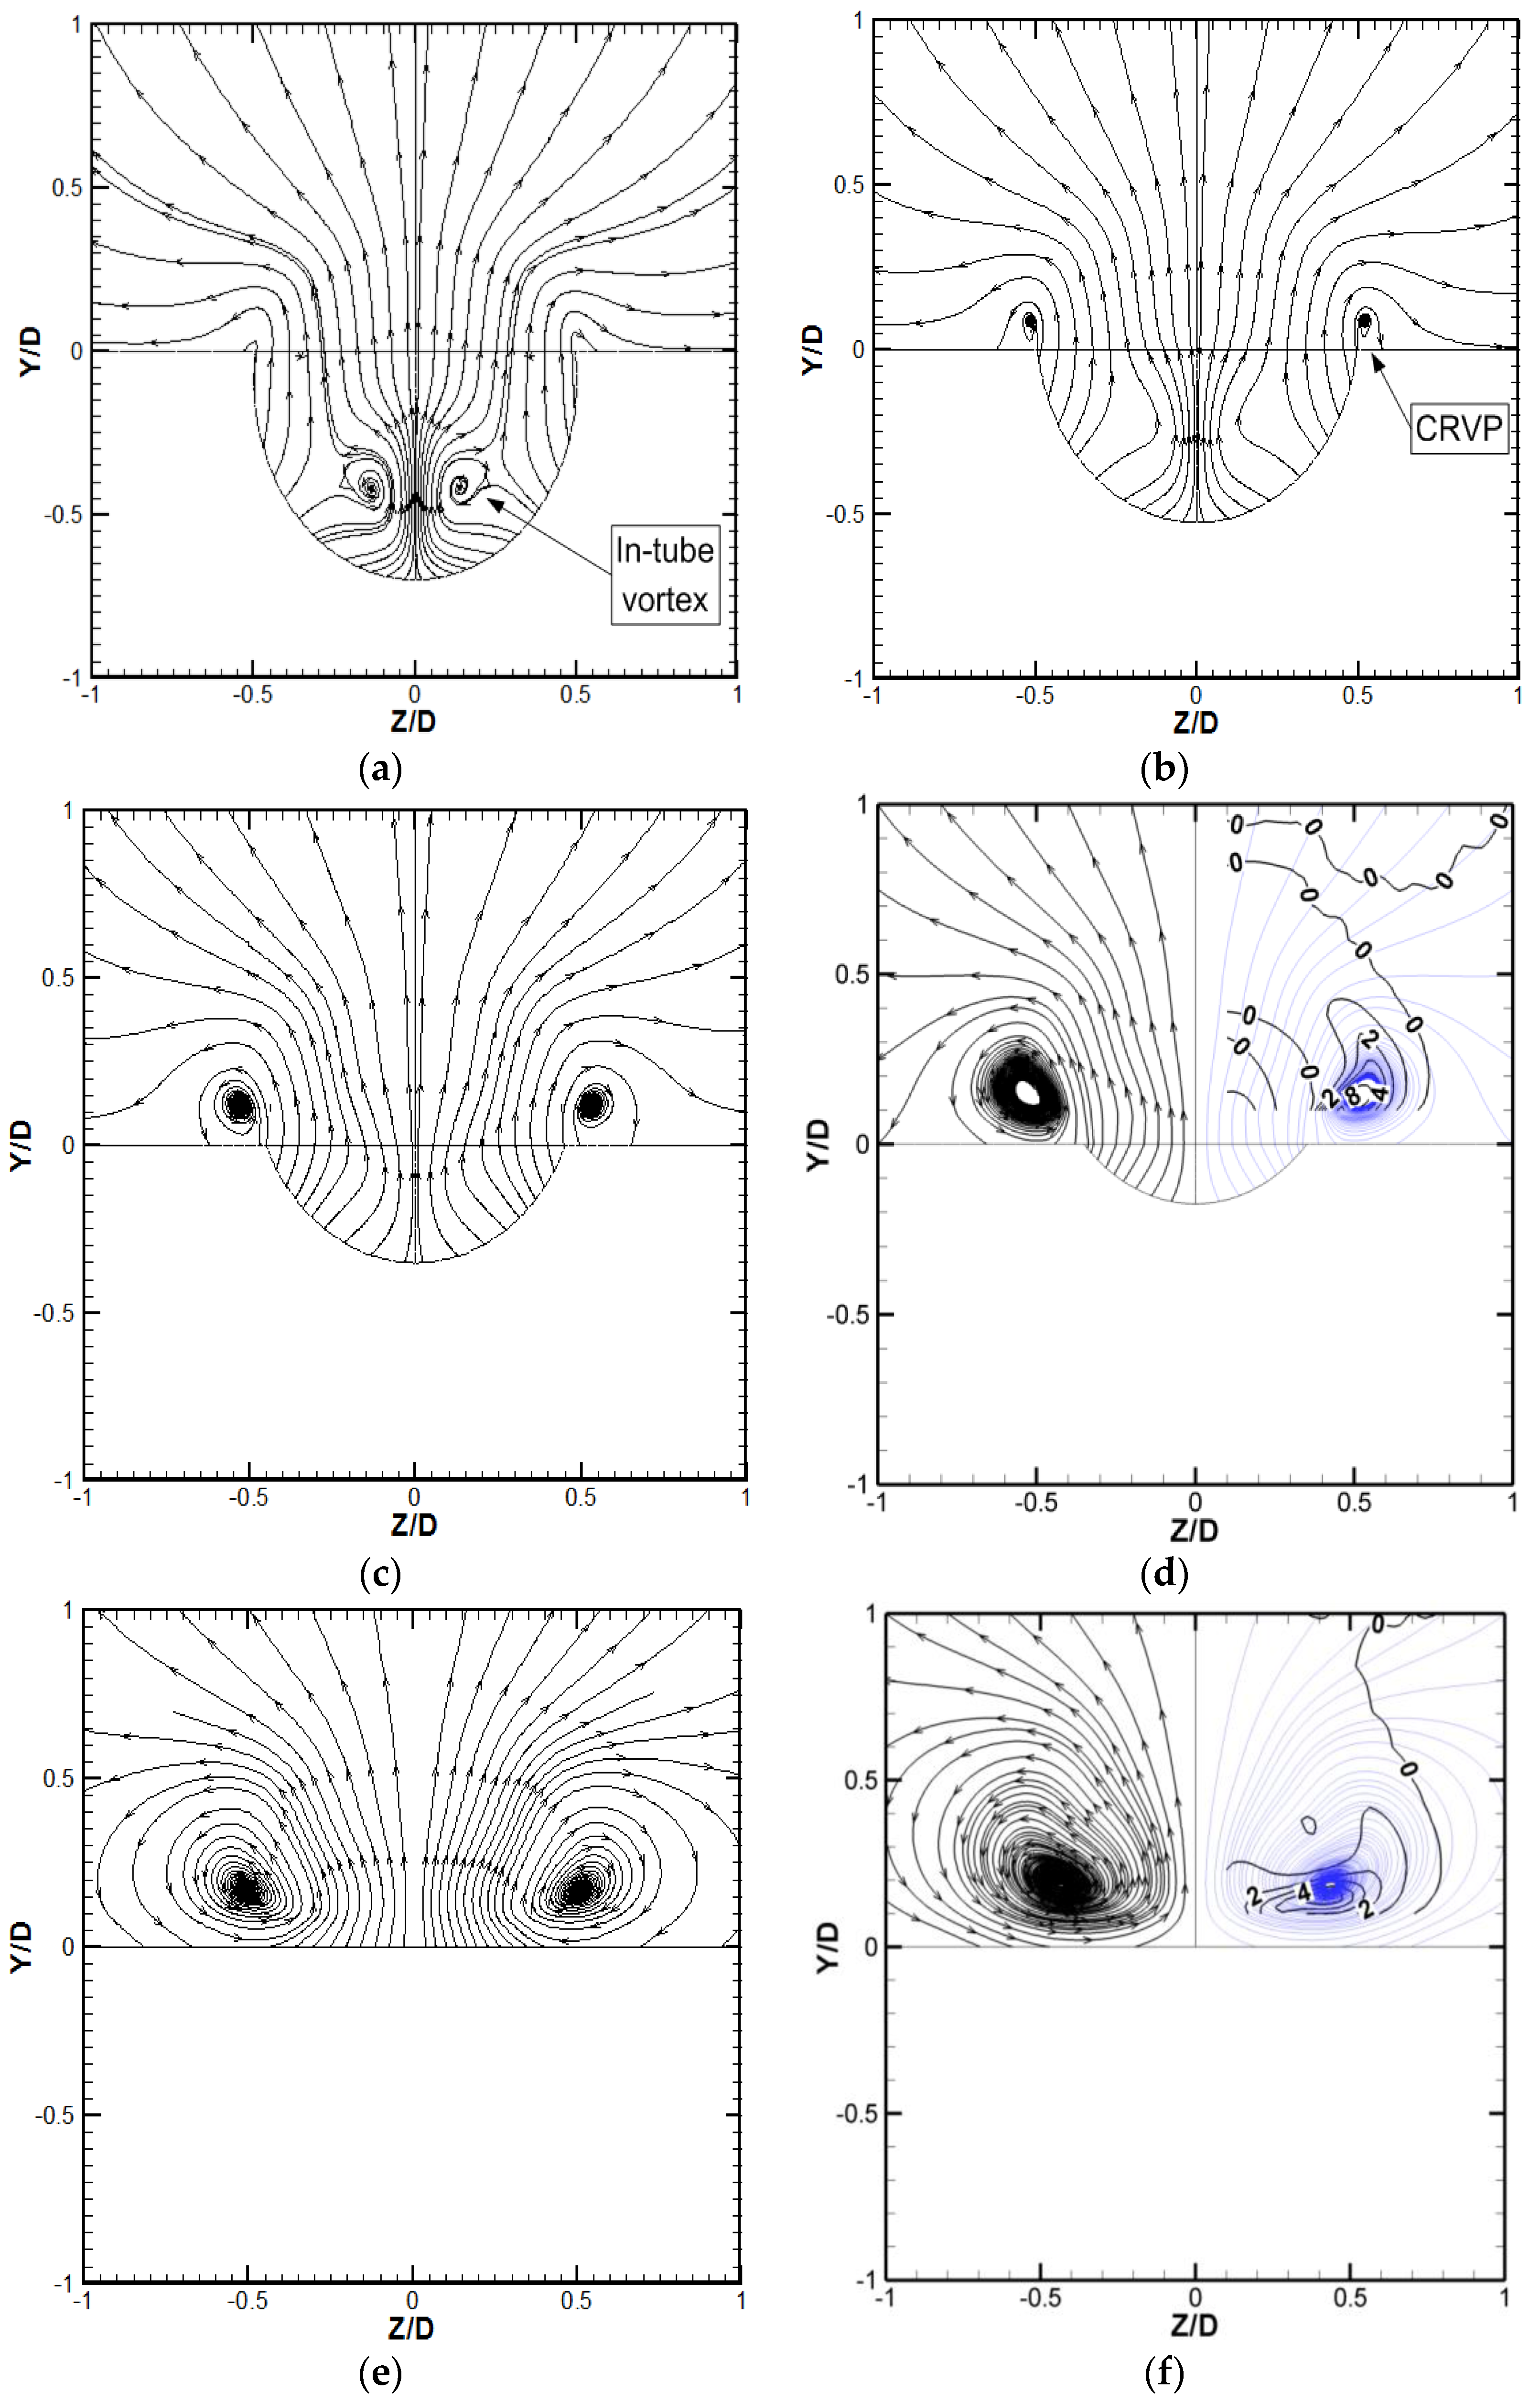
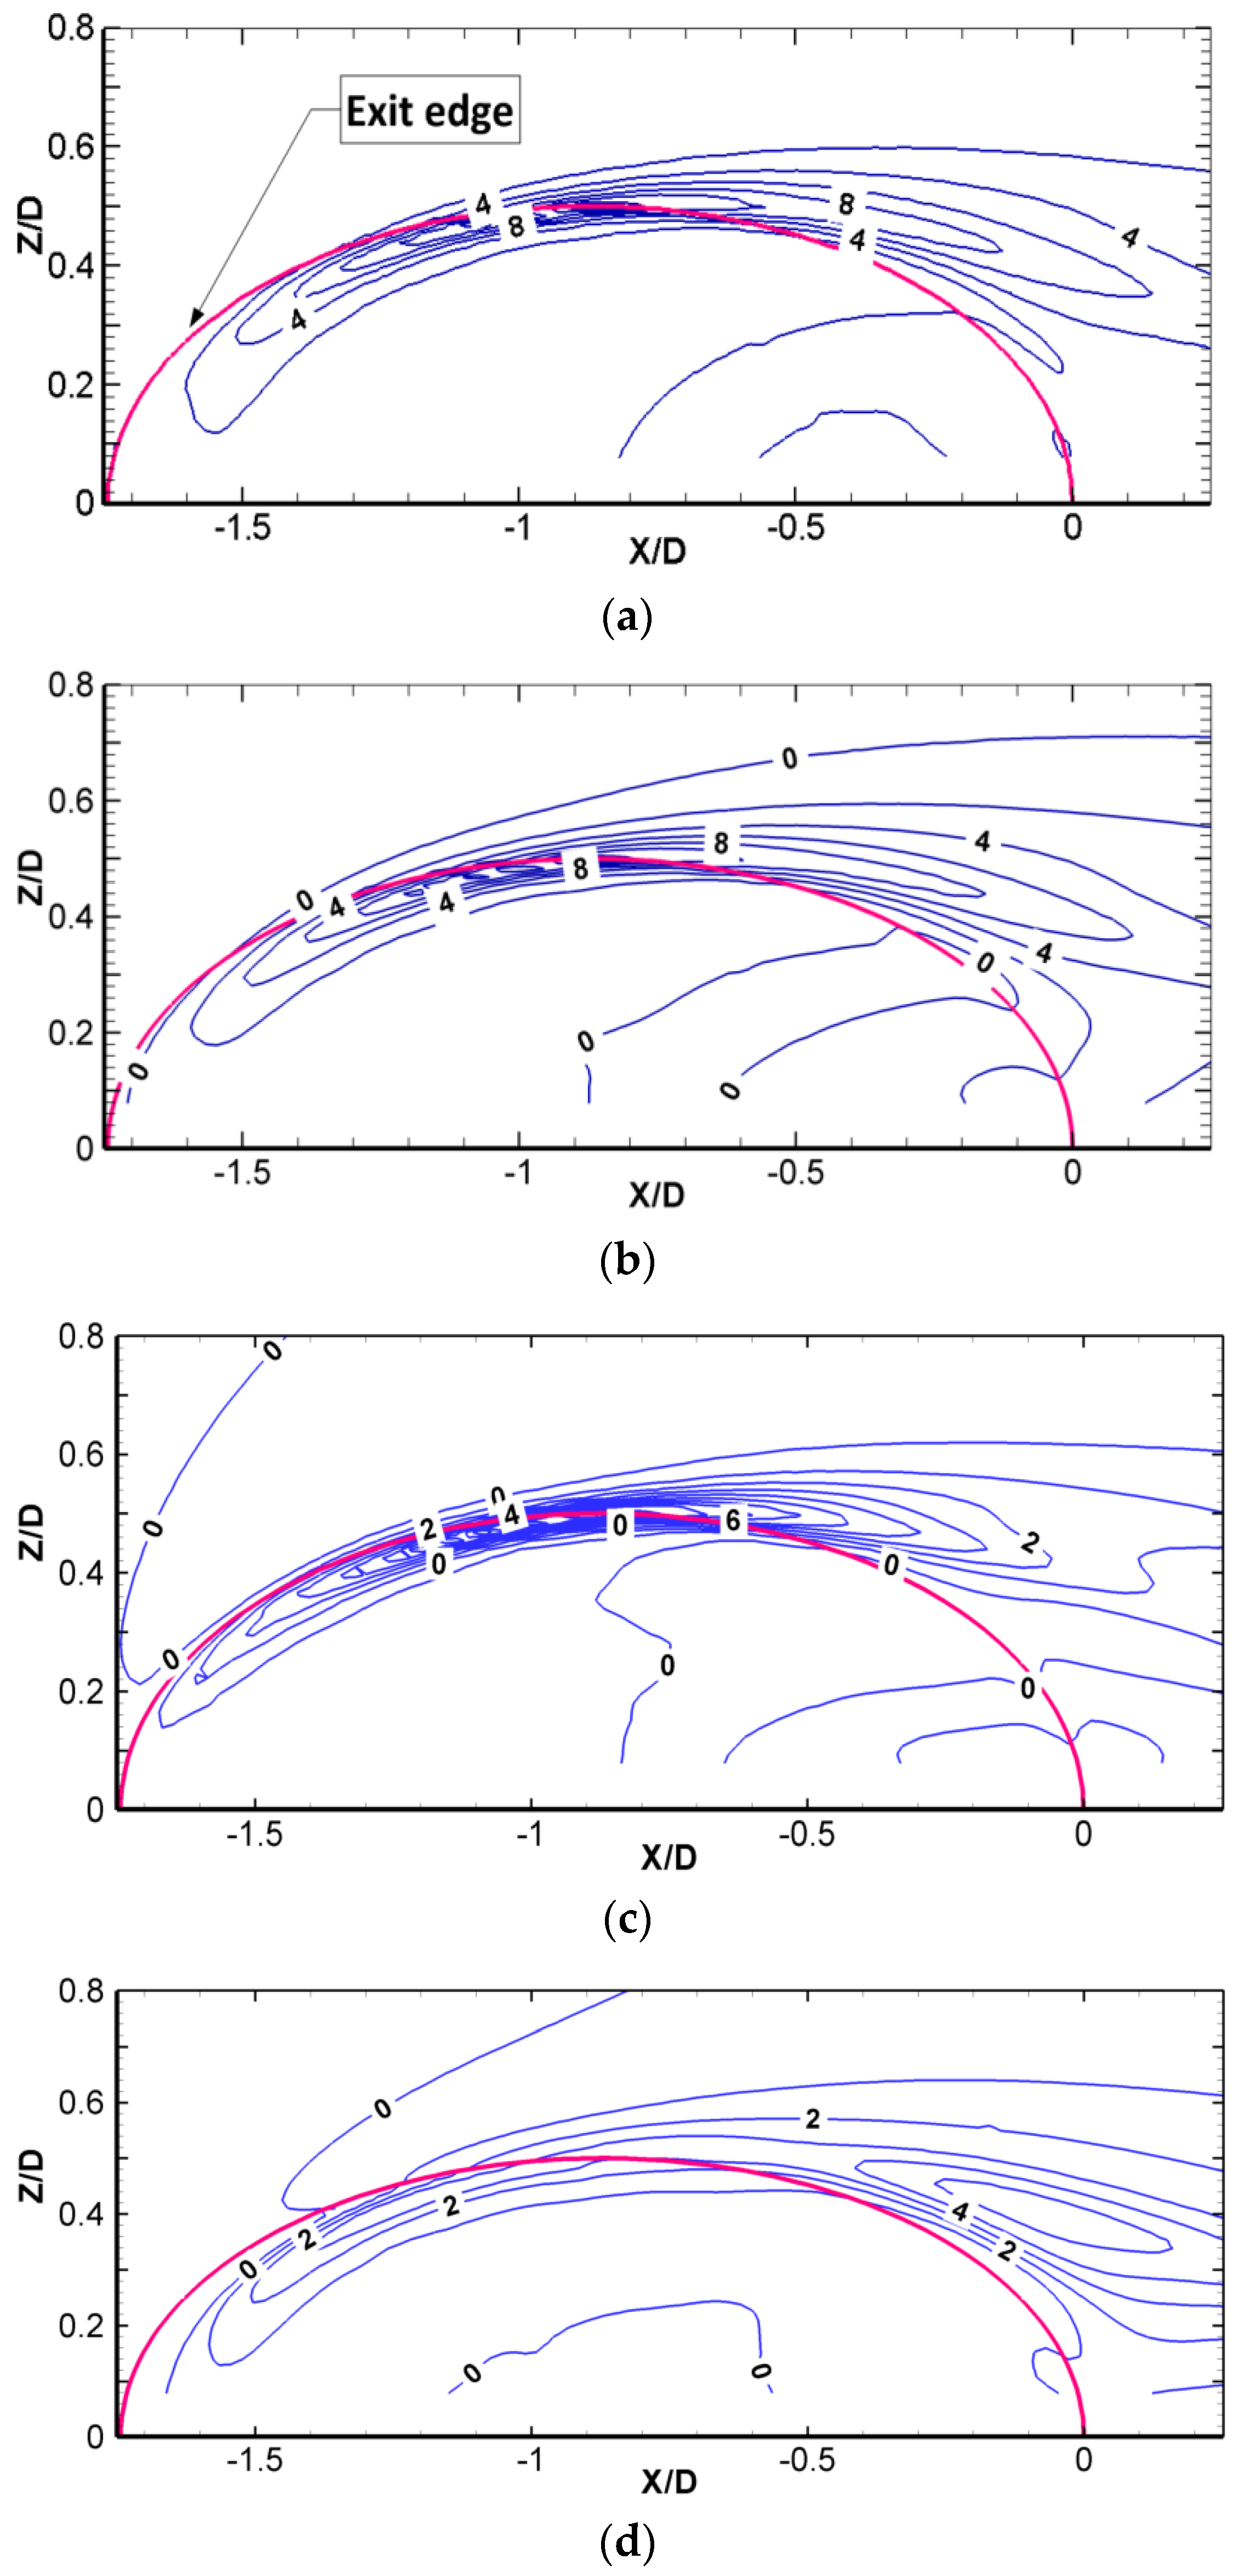
From the results of Case 1—the baseline case—the CRVP formation process was visualized with 2D streamlines projected on the Y-Z plane near the jet exit, as shown in
Figure 4. The computational domain is composed of half a cooling hole, while the figures are showing as a full hole domain by mirroring the data from the right side onto the left. At X/D = −1, shown in
Figure 4a, the nascent CRVP is emerging at the edge of the hole exit. At positions (±0.14, −0.42), the in-tube vortices can still be identified. No direct relation between the in-tube vortices and the CRVP can be detected in this figure.
In
Figure 4b, a small CRVP is formed at (±0.52, 0.09) and the in-tube vortices do not show as they do not pass by this axial location; however, its vestiges can still be recognized at (±0.2, −0.3). As the CRVP develops (
Figure 4c), it becomes more distinct, and the core positions are located at (±0.53, 0.12). The CRVP continues to develop in
Figure 4d,e, and the positions of the CRVP cores are located at (±0.53, 0.15) and (±0.51, 0.17), respectively. In
Figure 4f, the CRVP is fully developed, dominating the jet flow and extending downstream. The cores are located at (±0.43, 0.19).
Figure 4d,f show the
ωx contours (in blue) overlaid onto the streamlines so as to show the relation between the vortex core and the peak
ωx field. This relation will be described in the following subsection.
The previous investigations suggested three main sources contributing to the formation of CRVP. They are the jet-mainstream shear layer, the in-tube boundary layer and/or the in-tube vorticity. In
Figure 4, neither the direct relation of the in-tube vortex nor the turning up of the boundary layer vortex from the tube can be detected. Therefore, the jet-mainstream shear layer effect is identified as the major source of the CRVP. The following paragraph will present Case 3, the unsteady flow simulation case, to demonstrate further the development of the in-tube vortices. In the following subsection, a comparison of Cases 1 and 2, the baseline and the FSIT cases, will demonstrate further the in-tube boundary layer effect.
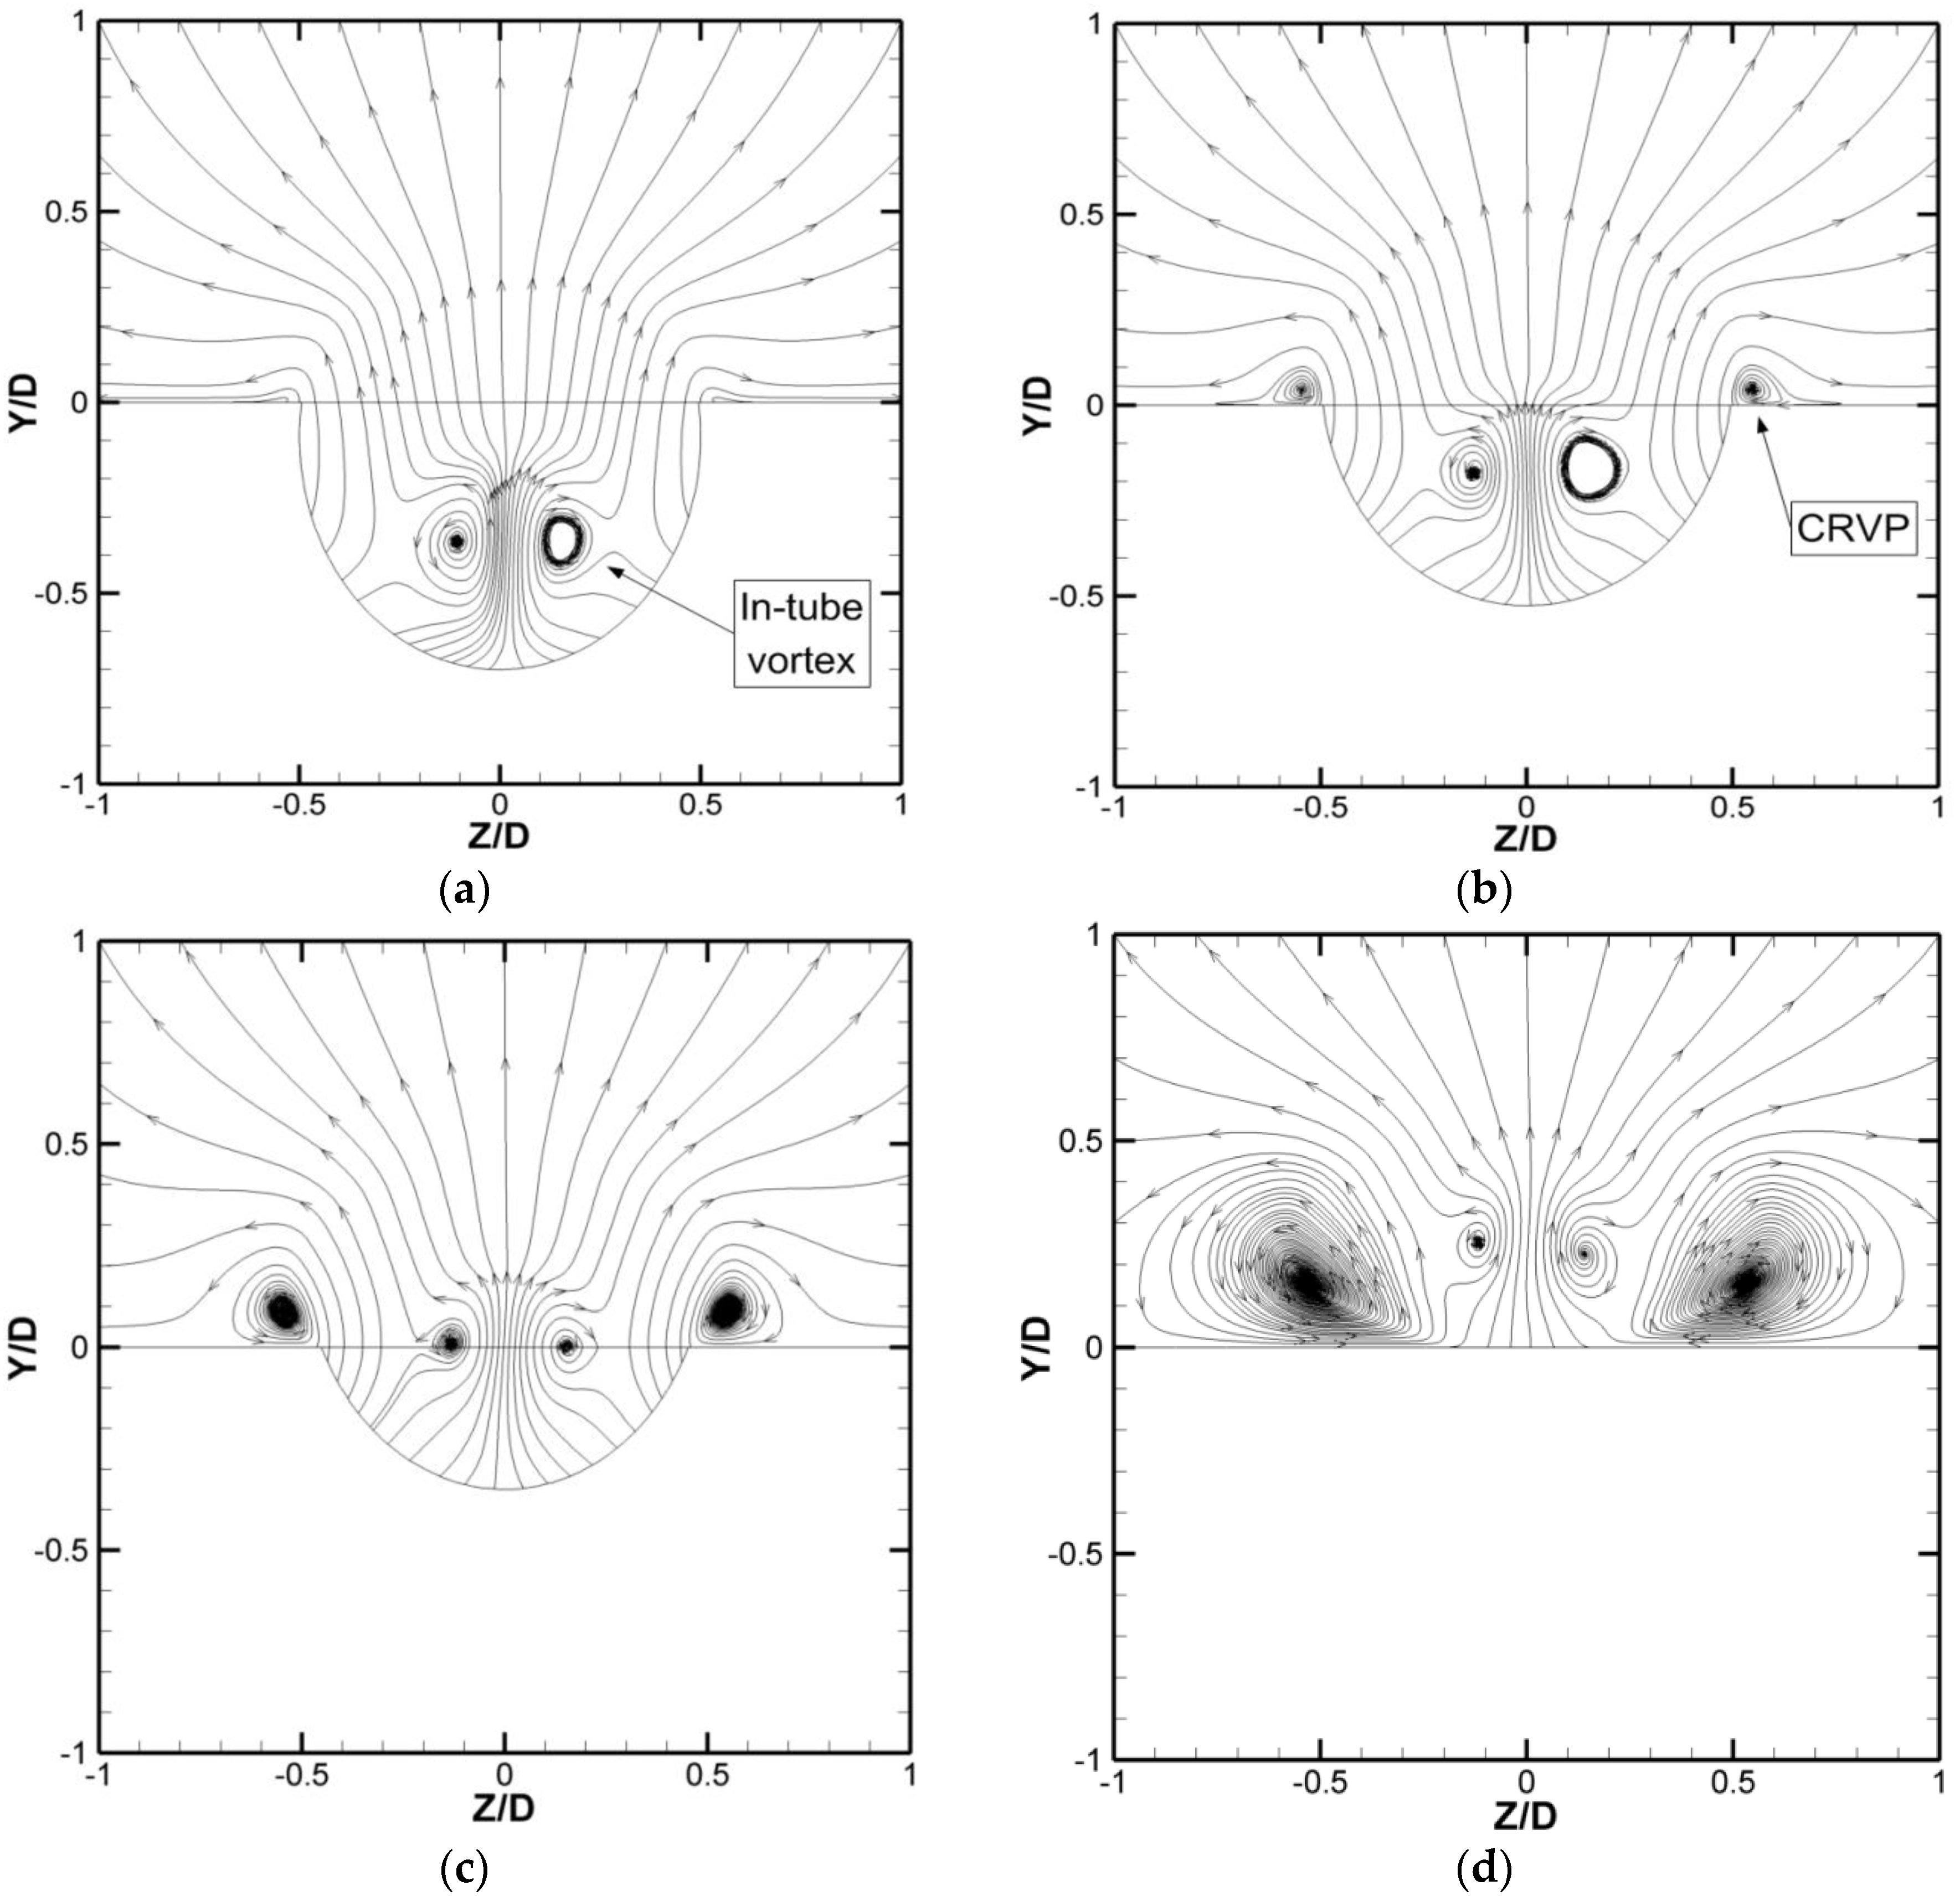
A similar CRVP formation process was observed in Case 3, the unsteady flow simulation case. In
Figure 5a, at X/D = −1, the budding CRVP is growing at the outer periphery of the hole exit. Additionally, a pair of in-tube vortices, referred to as “inner vortices” in Kim and Hassan [
12], are observed at (−0.1, −0.4) and (0.15, −0.35). Compared with
Figure 4a, the difference is negligible. In
Figure 5b–d, the CRVP variation from the corresponding plots in
Figure 4 is also negligible. However, the difference of the in-tube vortices cannot be neglected. They are still distinct in these three figures and stretch into the downstream direction, in contrast with the vanishing in-tube vortices in
Figure 4. Interestingly, the unsteady simulation demonstrates more clearly that the CRVP formation has no direct relation with the in-tube vortices. Moreover, no turning up of the in-tube boundary layer vortex from the tube can be observed either.
3.2. The Mechanism of CRVP Formation
A key factor controlling the CRVP formation and development is the vorticity dynamics developing in the shear layer that forms near the pipe exit and its convection further downstream.
Figure 4 demonstrated that the CRVP cores and the vorticity peak were located at around Y/D = 0.1. Therefore, vorticity contours as well as other relevant variables for Case 1, the baseline case, are plotted at a horizontal plane Y/D = 0.1 (right above the hole exit) and are presented in
Figure 6; the edge of the hole exit is shown as an ellipse.
Figure 6a gives the distribution of
ω, the peak value is approximately 15, and is located at (−0.9, 0.5) mainly along the edge of the hole exit, where the jet-mainstream interface is located. Note that this interface which is indicative of the shear layer (and the vortex sheet) convects with the jet flow into the mainstream direction, and gradually diffuses due to shear action.
The contours of
ωx, given in
Figure 6b, are almost identical to those shown in
Figure 6a. In fact, the maximum value of
ωx is about 14.7, and is located at the same position as that of
ω. In summary,
ωx is the main component of the vorticity while the other two components can be safely neglected.
Based on Equation (3),
−∂v/∂z and
∂w/∂y contribute to
ωx hence to
ω. They are presented in
Figure 6c,d, for completeness.
−∂v/∂z has distribution similar to that of
Figure 6a,b. Its maximum is approximately 11.6 and is located at (−0.9, 0.5), the same position in
Figure 6a,b. In this position,
∂w/∂y is much less than
−∂v/∂z, which is approximately 3. However, at X/D > −0.3,
∂w/∂y exceeds
−∂v/∂z, and becomes the main contributor in this region. Its maximum is approximately 5.5 and is located at (0, 0.4).
Figure 6c,d demonstrate that
−∂v/∂z is the main contributor of the CRVP in a cylindrical hole, and the main contributor switches to
∂w/∂y when the flow approaches the cooling hole exit.
As the CRVP strength influences, rather strongly, the film-cooling effectiveness,
Figure 6 can guide the design of new film-cooling schemes as well as explain the high performance of the shaped holes, e.g., diffusing conical pipes. For example, decreasing the Y component velocity
v decreases
−∂v/∂z, which explains why expanding the exit or reducing the inclination angle can improve the film-cooling effectiveness. This observation is consistent with the conclusions found in the literature about the effect of the momentum flux ratio,
I, on film-cooling effectiveness. Furthermore, increasing the
Z value of the exit hole also decreases
−∂v/∂z, which explains why the laterally expanded hole is better than the forward-expanded hole [
11]. This observation also explains the experimental results of Haven and Kurosaka [
7], where the CRVP of the stream-wise rectangular hole is much stronger than that in the span-wise rectangular hole, which results from the difference in
−∂v/∂z.
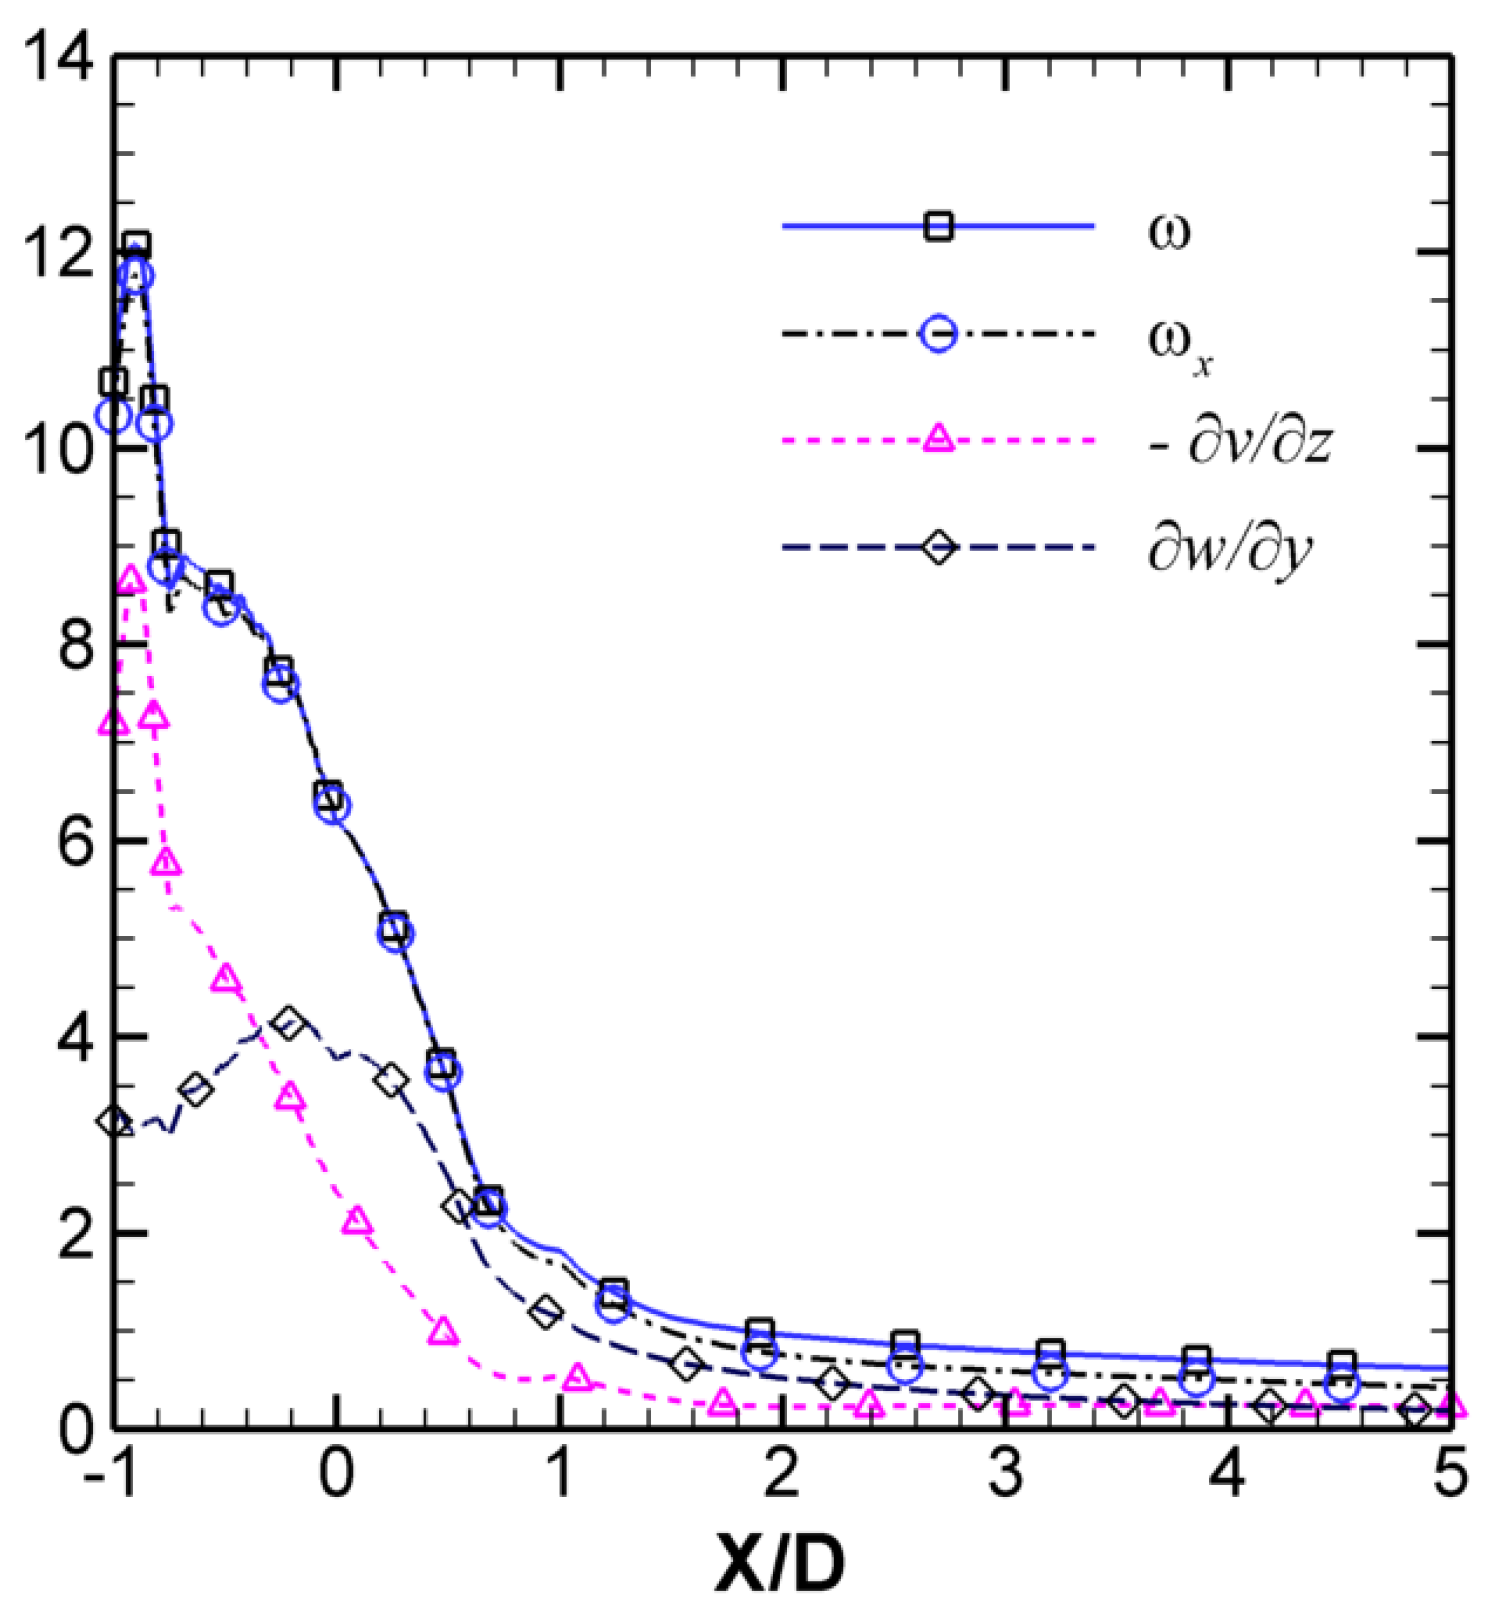
In
Figure 4d,f, the
ωx contours were overlaid onto the streamlines. In the region above the exit, e.g.,
Figure 4d, the CRVP cores coincide with the
ωx peak field. When moving downstream, these two positions branch out progressively, but remain very close in the near field, e.g.,
Figure 4f. The vorticity
ω and the relevant variables along the trajectory of the CRVP cores are plotted in
Figure 7. Compared with
Figure 6, which reflected the CRVP character just above the exit,
Figure 7 presents the character in the near field. Its
ωx distribution is coincident with that of
ω. After X/D = 0.7, their values begin to deviate from each other very slowly. Their maxima, approximately 12, are located at X/D = −0.9. Their values start decreasing continuously. At X/D = 0, they are still greater than 6.5. Then, they drop down quickly to 2.2 at X/D = 0.7. Subsequently, they begin to decline slowly until reaching an asymptotic value of approximate 0.5 in the far field.
3.3. The Effect of the In-Tube Boundary Layer
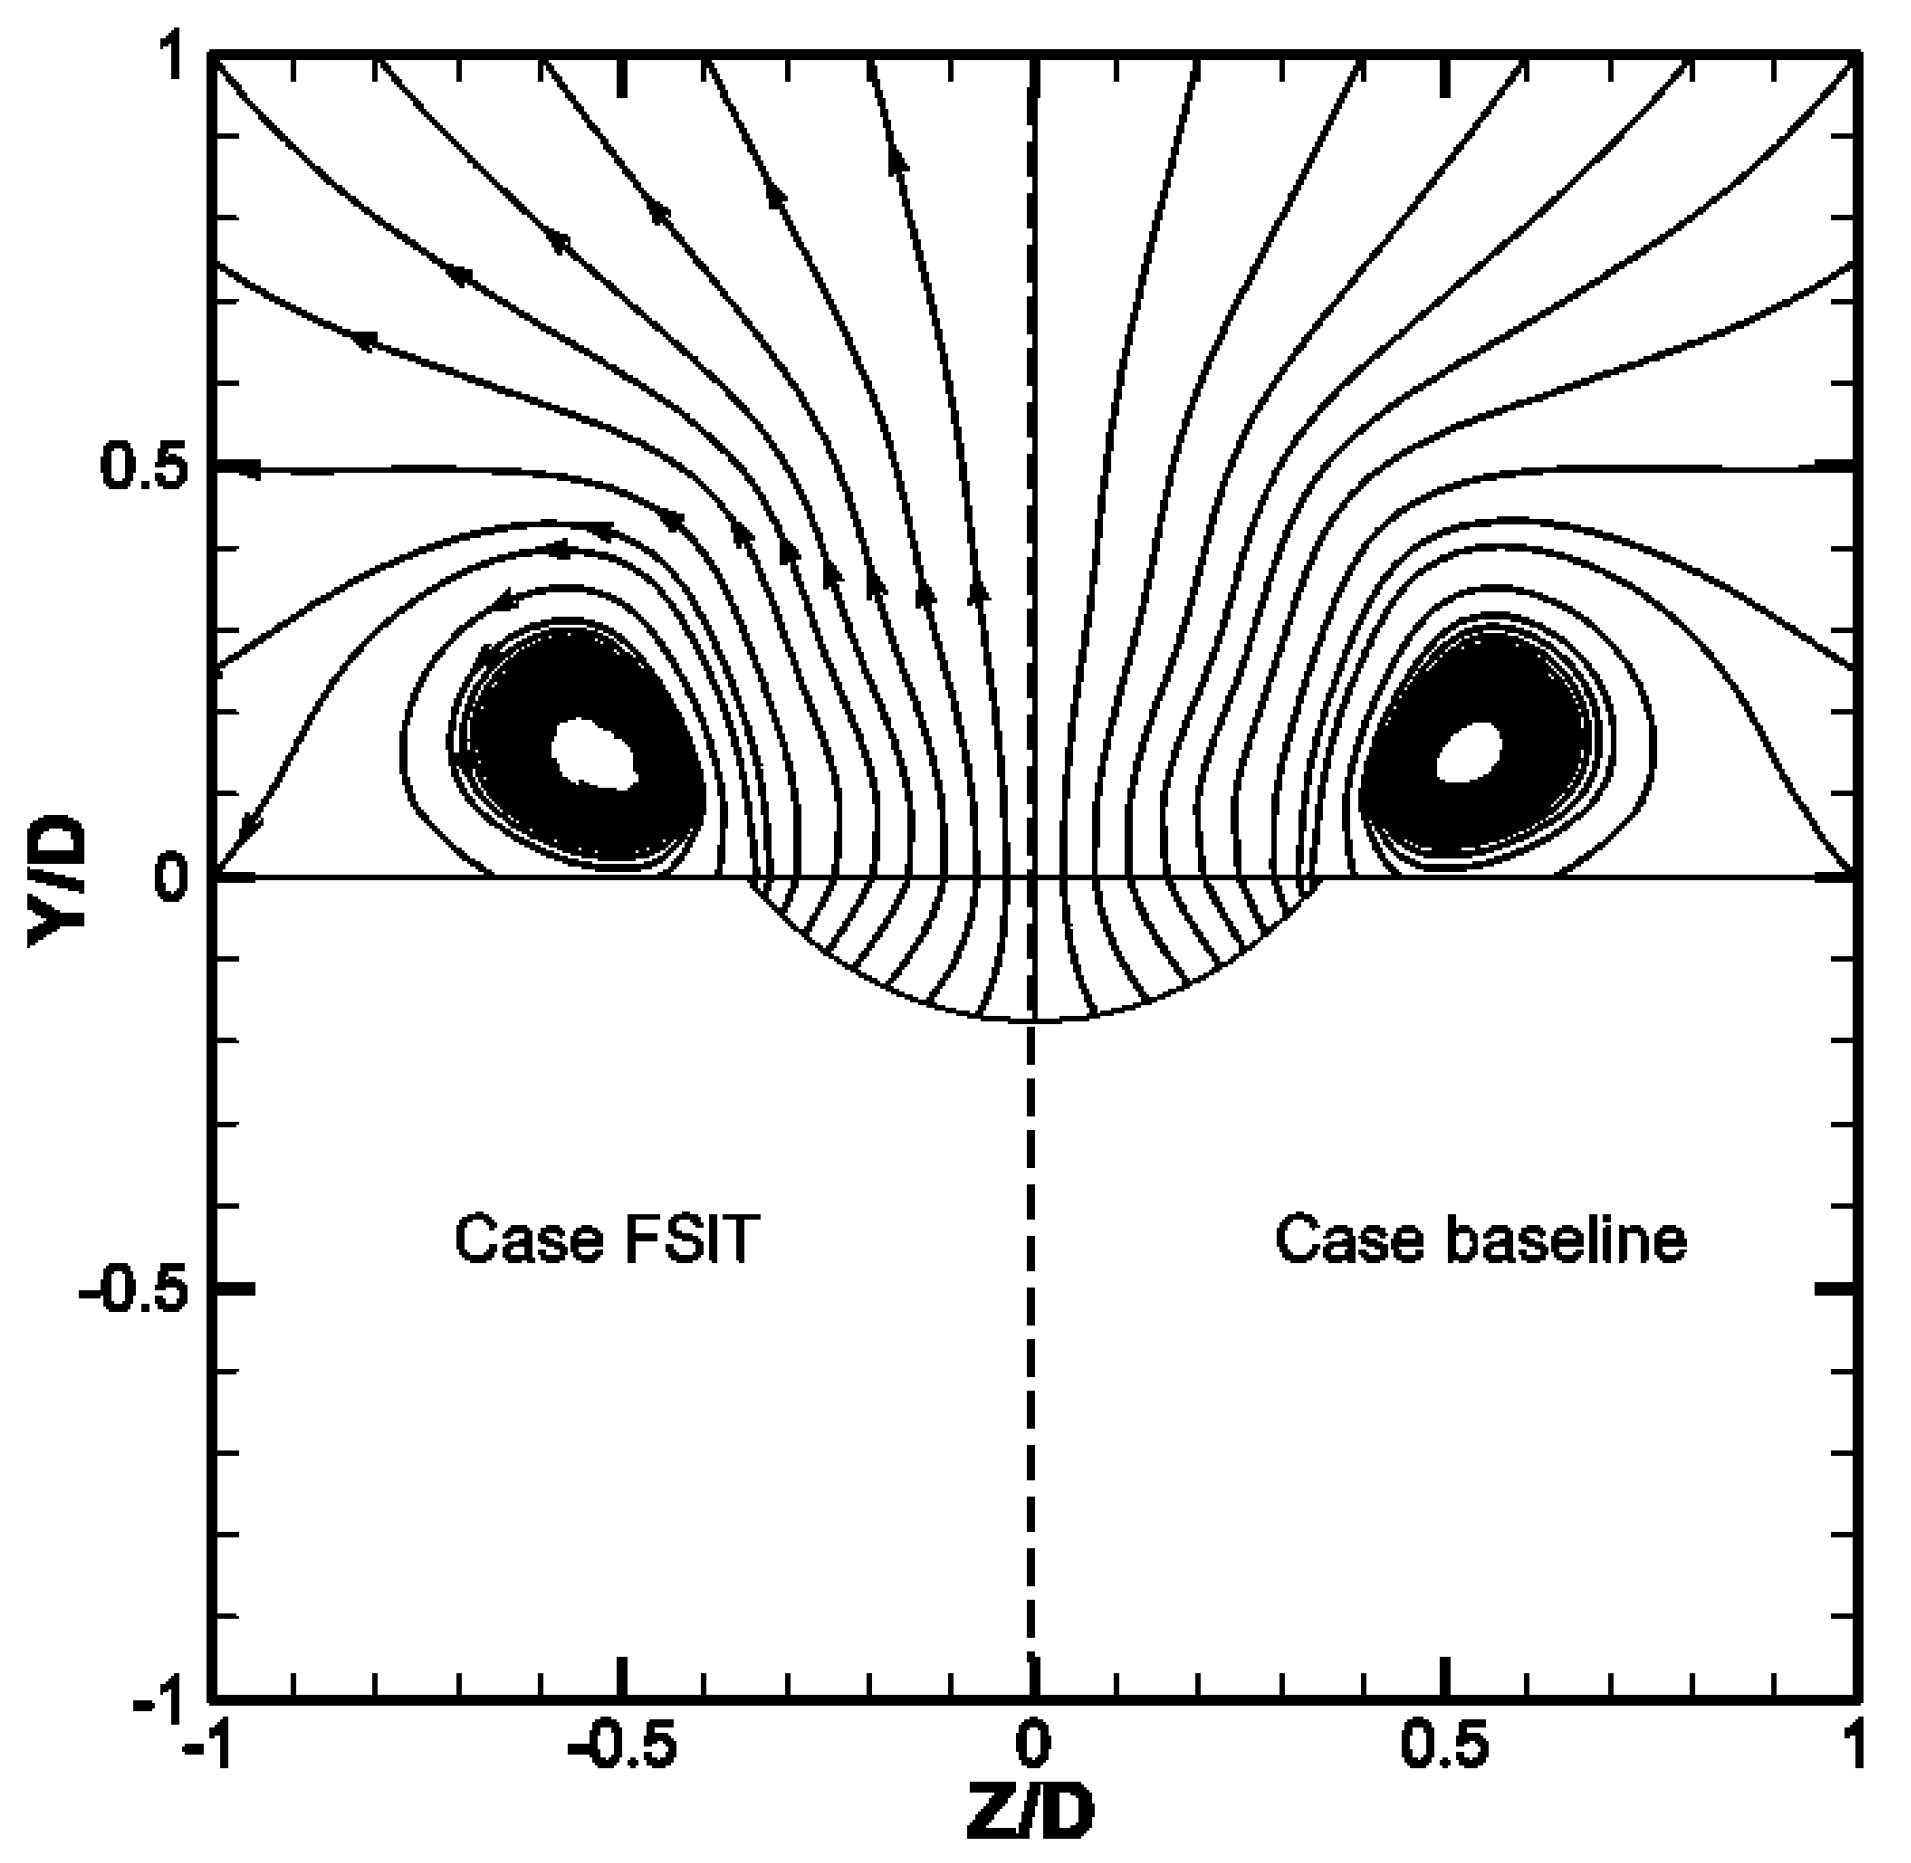
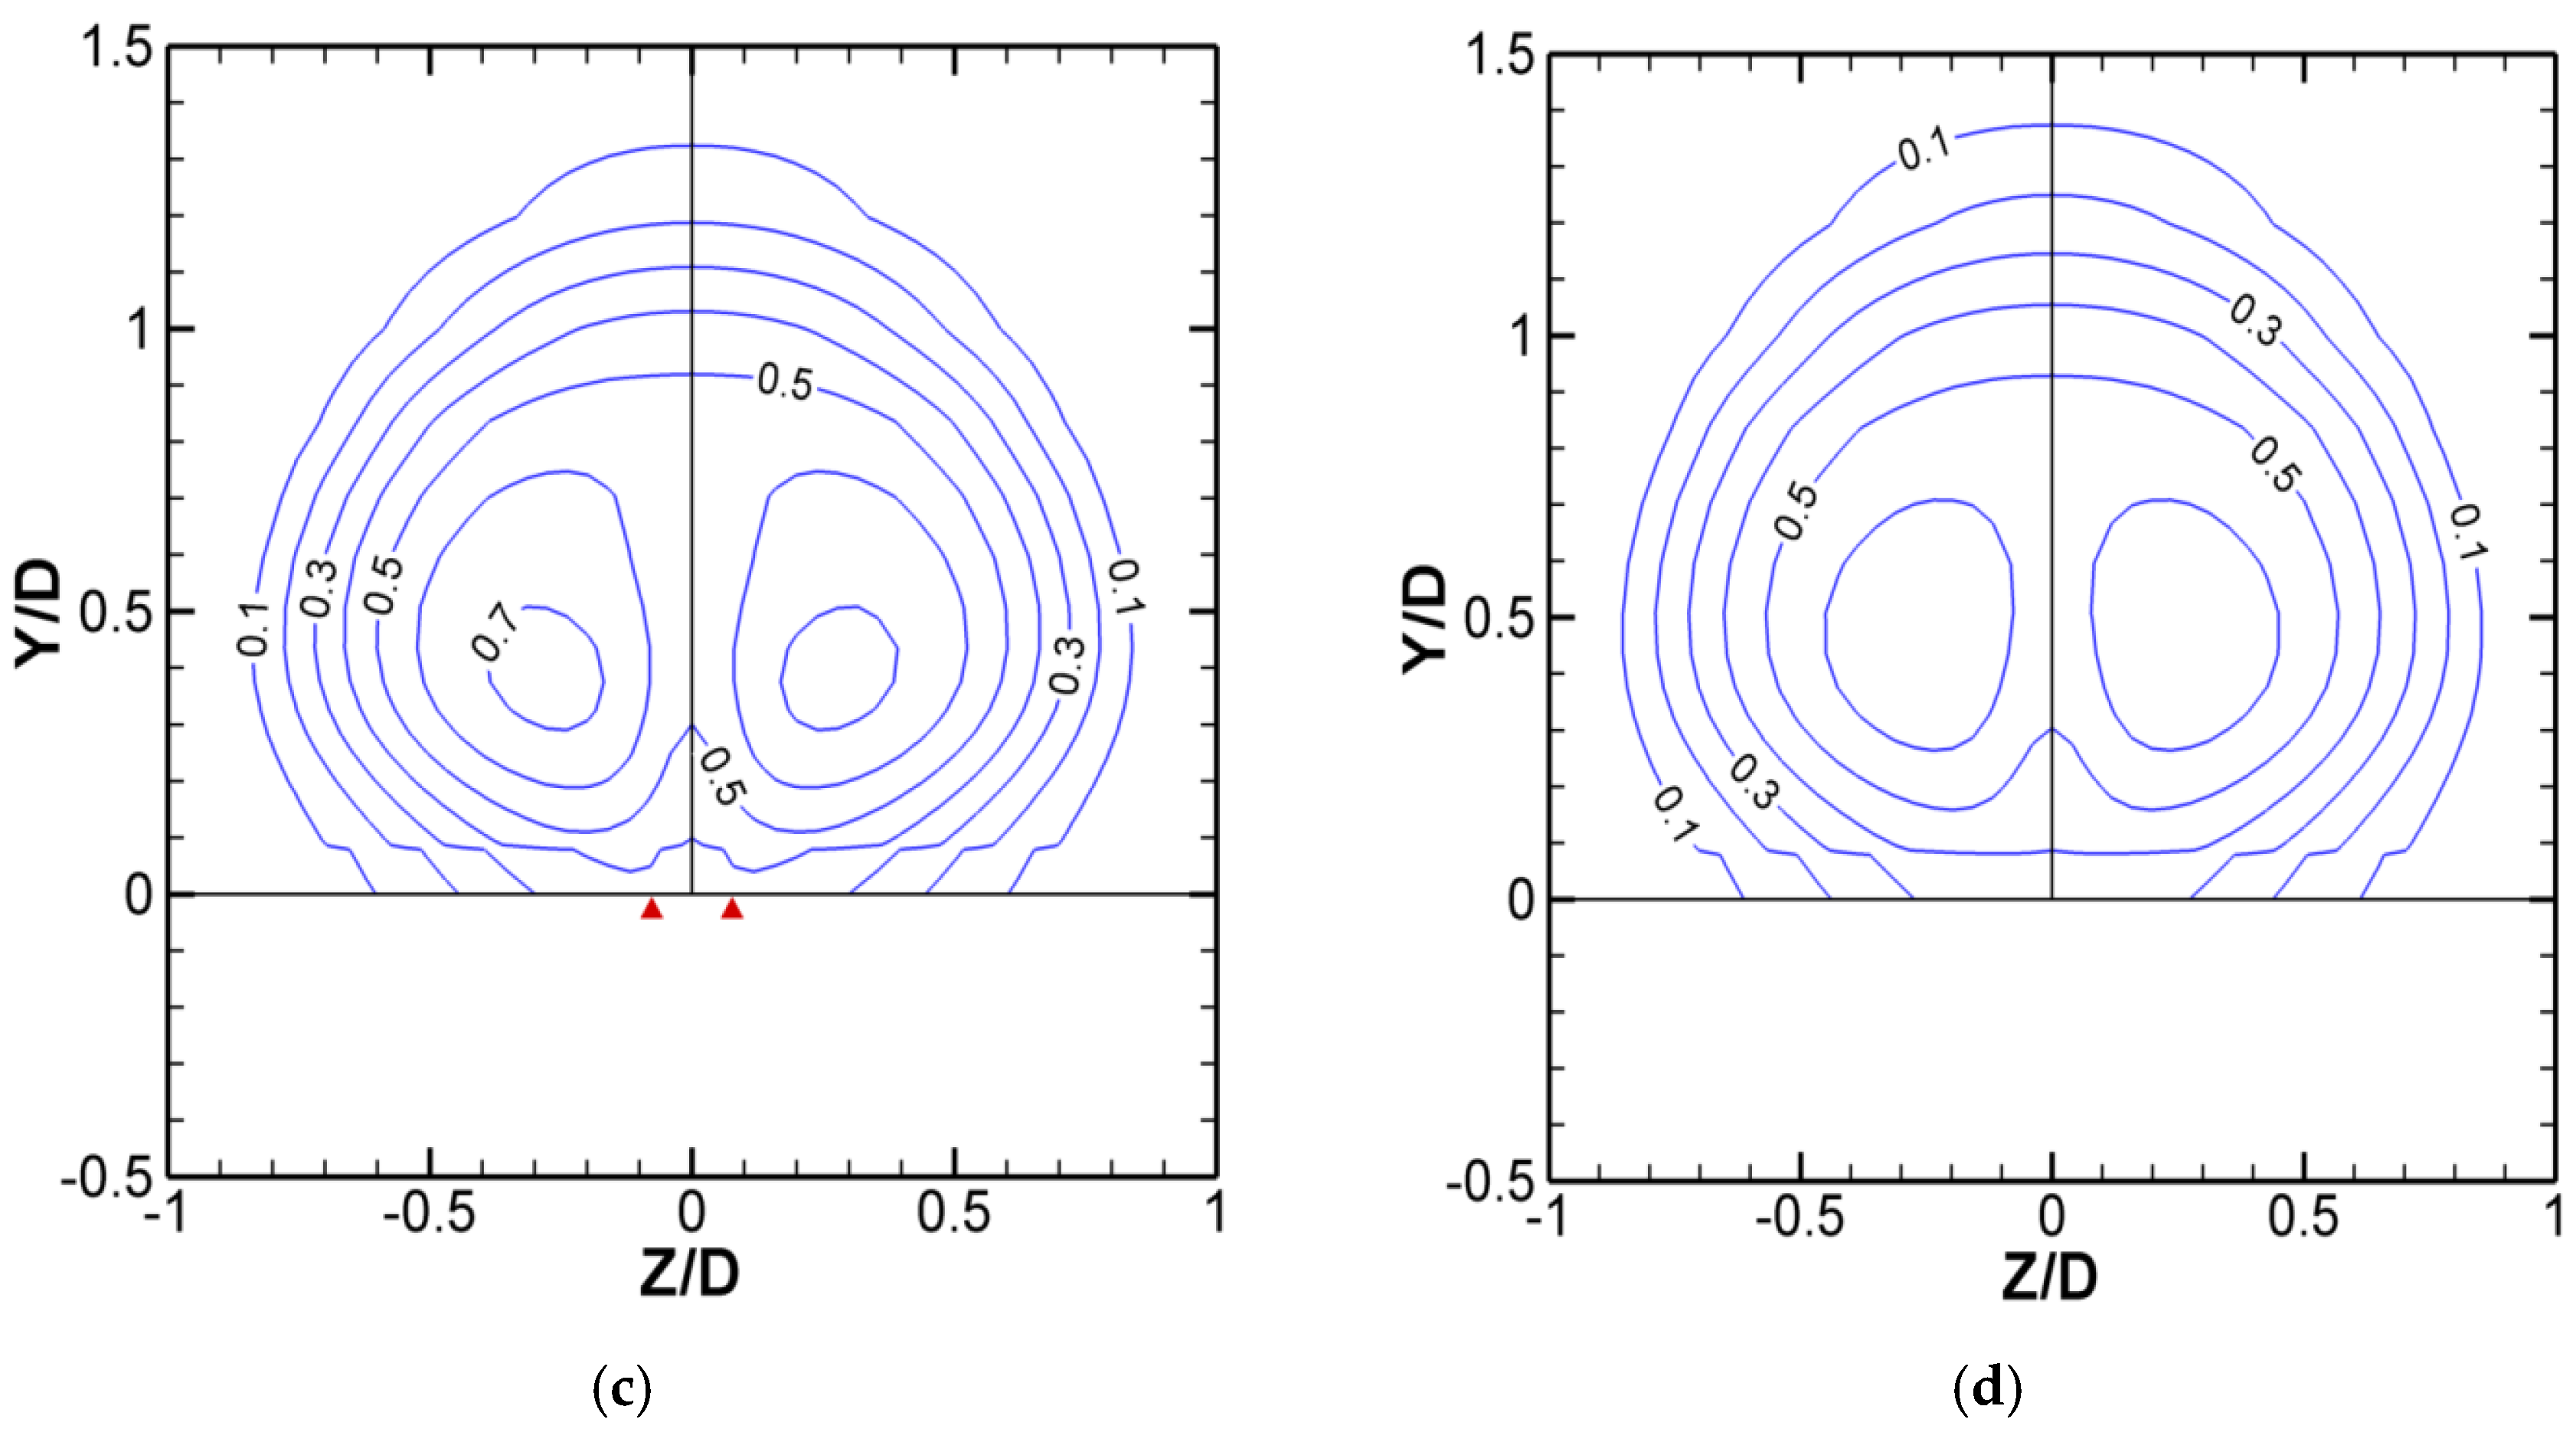
Figure 8 compares the CRVP of the FSIT case to that of the baseline at the Y-Z plane of X/D = 0.25. The left part (Z/D < 0) is the FSIT case and the right part (Z/D > 0) is the baseline. No distinction can be identified between the two cases. As the in-tube boundary layer effect was isolated in the FSIT case, the in-tube boundary layer also has no significant influence on the CRVP.
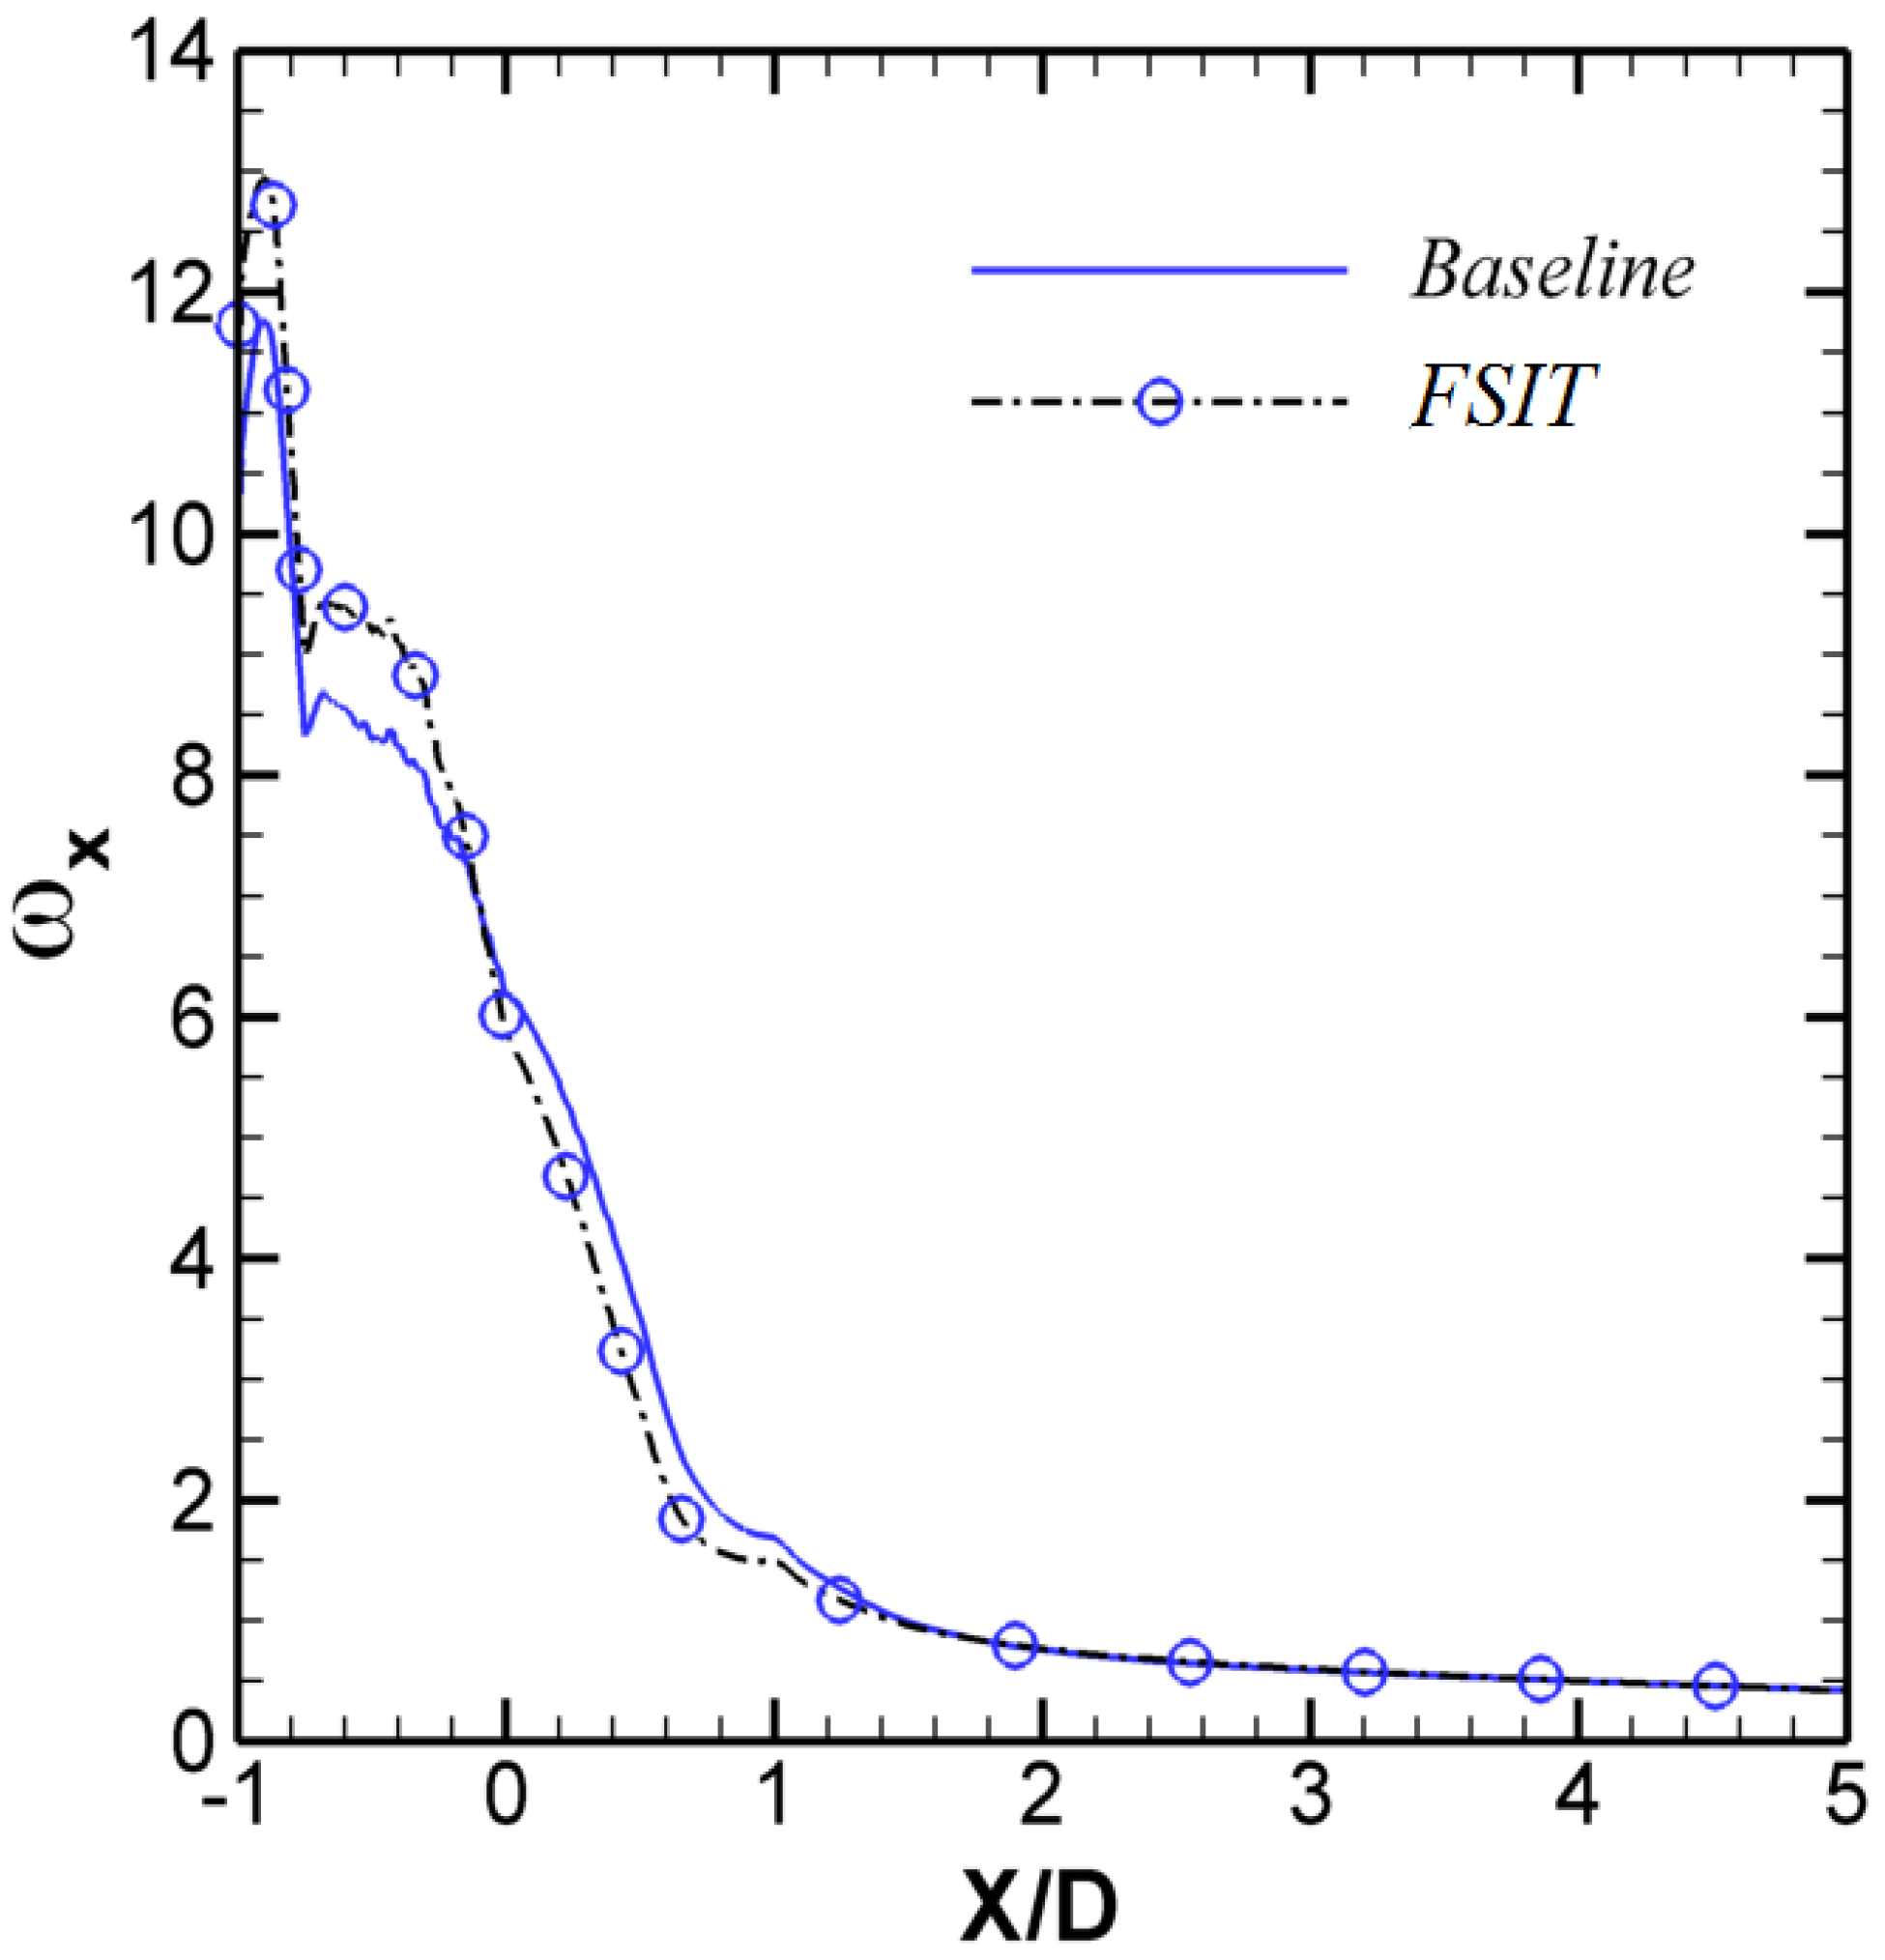
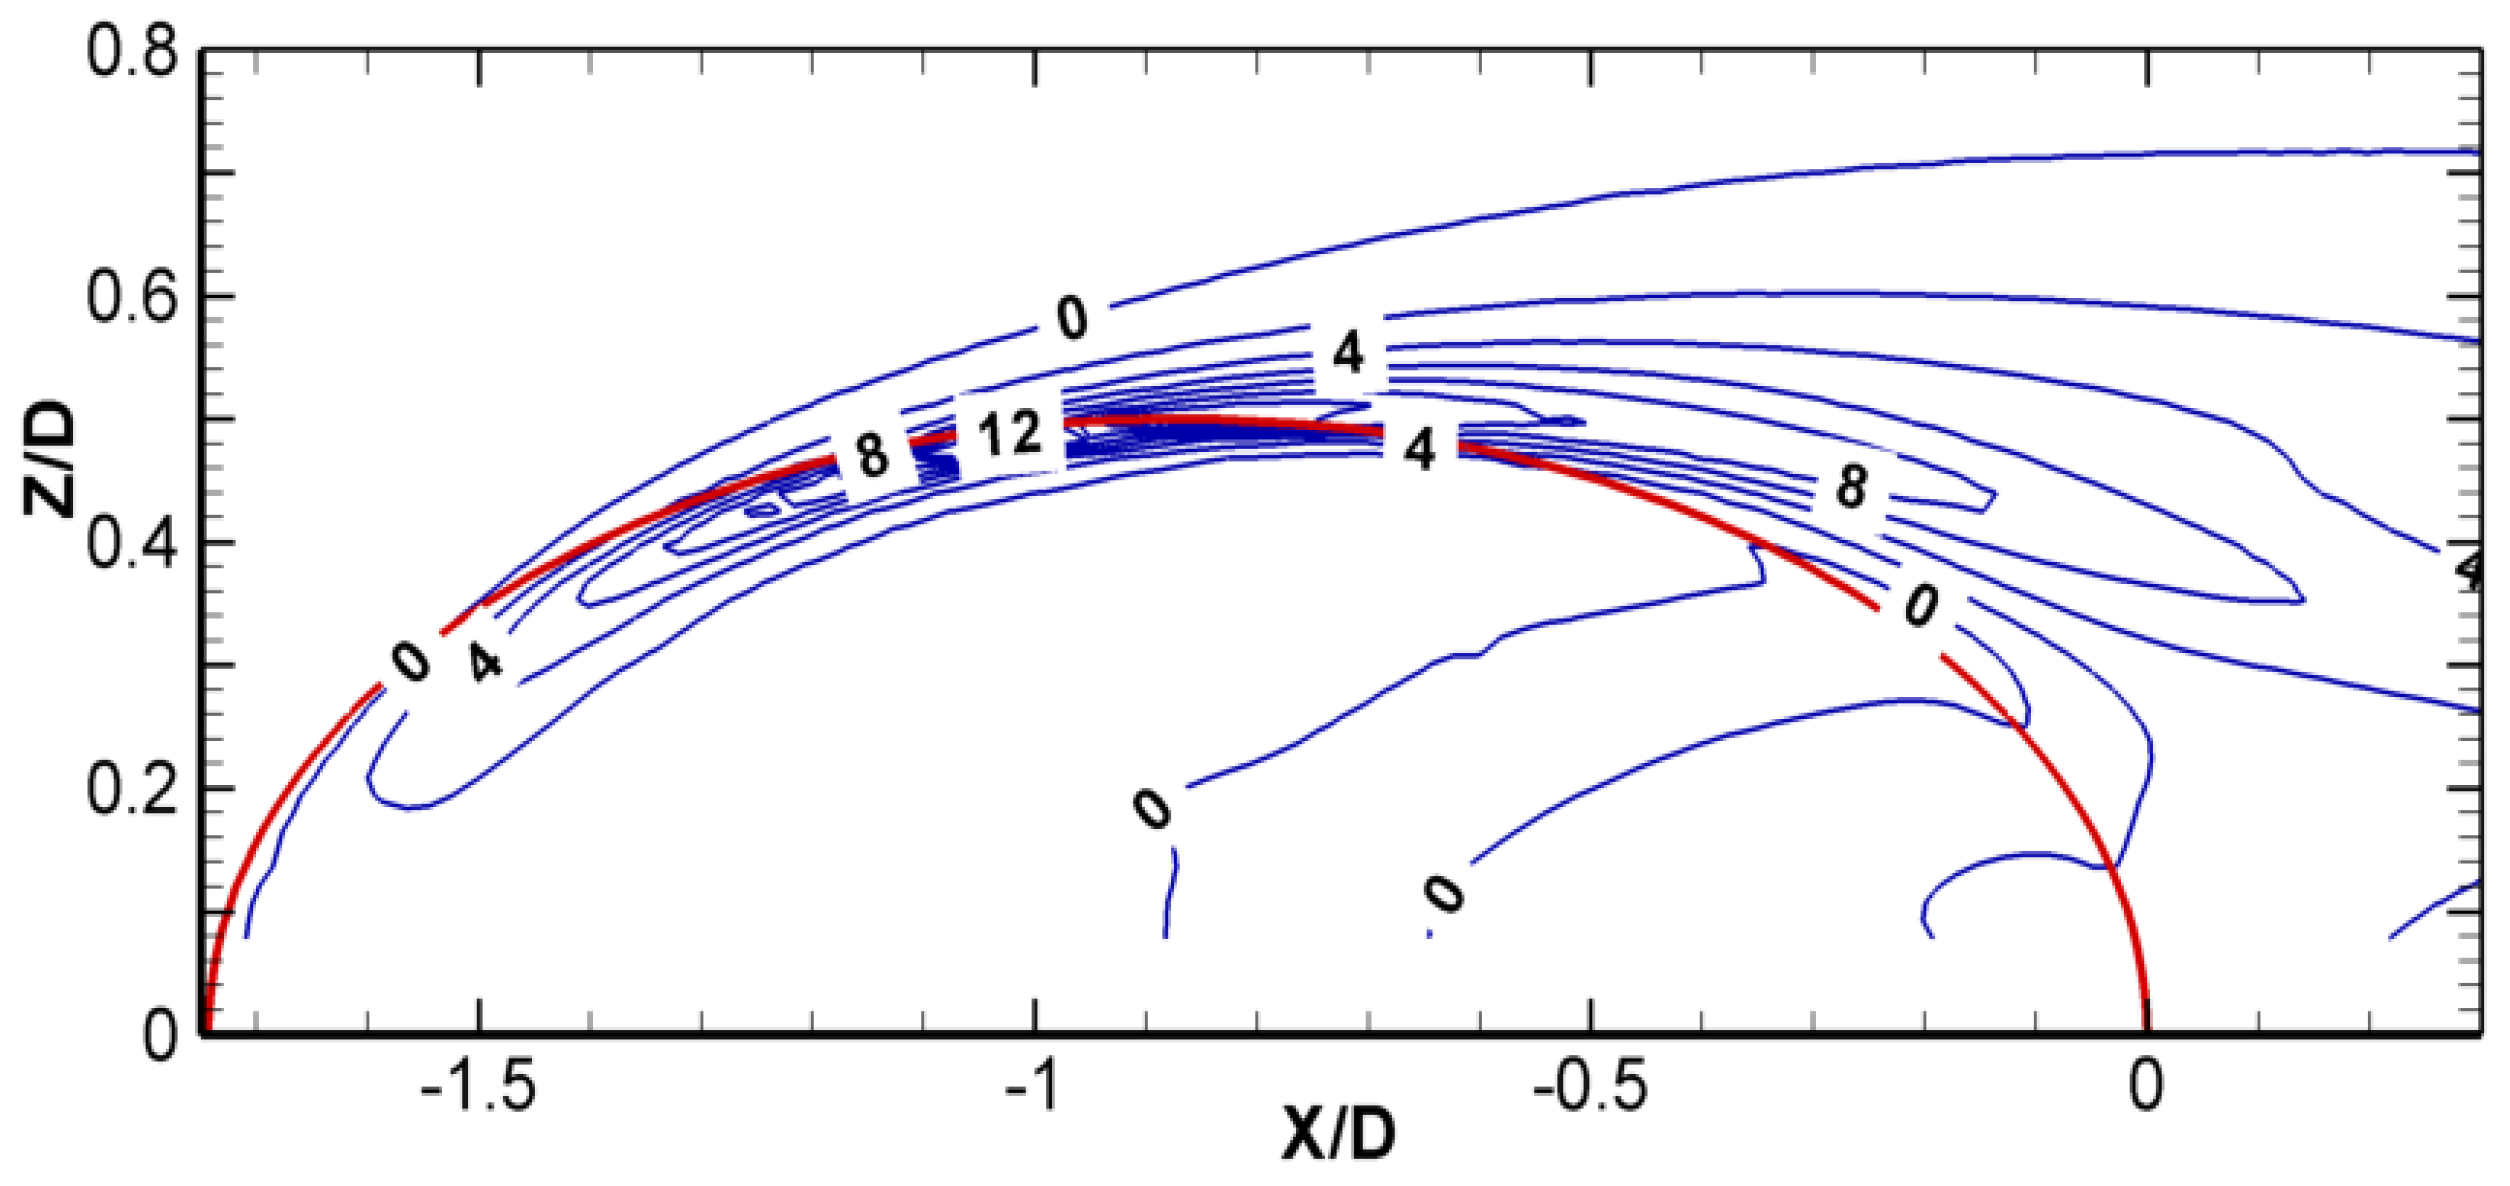
Figure 9 presents the
ωx contour of the FSIT case. In contrast with
Figure 6b, the difference can be neglected. In fact, the local maximum value in this case is approximately 15, and is slightly higher than that of the baseline. The comparison of the vorticity along the CRVP cores between Case 2, the FSIT case, and Case 1, the baseline case, is shown in
Figure 10. Minute differences can be observed for
ωx; in the near field
ωx for Case 2 is slightly higher than that of the baseline and is slightly smaller in the region from X/D = 0 to 1. These small differences in
ωx are a direct consequence of the elimination of the no-slip boundary condition on the in-pipe walls resulting in a higher vorticity strength in the near-wall region. These comparisons demonstrate that, compared with the shear layer effect on the CRVP, the in-tube boundary layer has a second-order effect. This conclusion is true at least for L/D = 1.75 which is used in this work.
It is worth noting that this reduction seems opposite to the conclusion of Schlegel et al. [
18], where the boundary layer effect was found to strengthen the CRVP significantly. These opposite effects are supposed to result from the difference of the CRVP mechanisms in these two types of flow. We speculate that the main component of the CRVP in JICF is
ωy, which is mainly driven by
∂u/∂z. In film-cooling flow,
v in the jet flow is higher than that in the mainstream. A sharp velocity profile in the in-tube boundary layer can raise the velocity gradient in the shear layer. On the other hand, in JICF, the jet axial velocity component is lower than that of the mainstream. A sharp velocity profile will reduce the velocity gradient. As this opposite effect is not the focus of the present investigation, it will not be considered here.
3.4. Concluding Argument on the CRVP
Experimental as well as numerical research on the topic of jet in a crossflow agree that the CRVP is generated from the shear layer, after this layer breaks down into vortex rings due to Kelvin-Helmholtz instability. Lots of valuable flow details are given in the literature, some of which are stated in the “Introduction” section. In the context of film cooling, other than the shear layer, there are at least two factors that are examined in this paper: the in-tube boundary layer and the in-tube vorticity which is convected with the flow entering the pipe. The following argument is an attempt to sort out these factors by importance.
In the limit of infinite Reynolds number (inviscid flow), the shear layer can be ideally represented by a vortex sheet whose strength is proportional to the velocity jump across that sheet, i.e., the difference between the jet velocity and the mainstream velocity projected onto the jet direction. Therefore, in essence, the velocity jump across the shear layer, which is related to the blowing ratio Br, is the controlling factor in generating the CRVP. This is confirmed in
Figure 4,
Figure 5 and
Figure 8 where the location and strength of the vortex pair is almost the same for Cases 1–3. As for the impact of the boundary layer thickness,
ωx for Case 1 is very similar to that of Case 2 where the boundary layer thickness is set to zero. The effect of the boundary layer development on the CRVP is expressed as the aerodynamic blockage which is of the order of a few percent (e.g., less than 10%). Note also that the in-tube vorticity which is clearly depicted in
Figure 5 has no impact on the CRVP formation or development.
3.5. The Nature of Liftoff and Reattachment
The behavior of the film-cooling flow was classified into three types: attached flow, liftoff then reattached flow, and complete liftoff with no reattached flow. The phenomenon of liftoff-reattachment was captured in the present simulation and can be seen in
Figure 2, where the positions of liftoff and reattachment are marked with inverted red triangles. In the present paper, we still use terminology such as liftoff, detached and reattached flow. It will be shown in this subsection that the phenomenon of liftoff-reattachment is not as simple as the jet flow leaving the test plate and then flowing back along it.
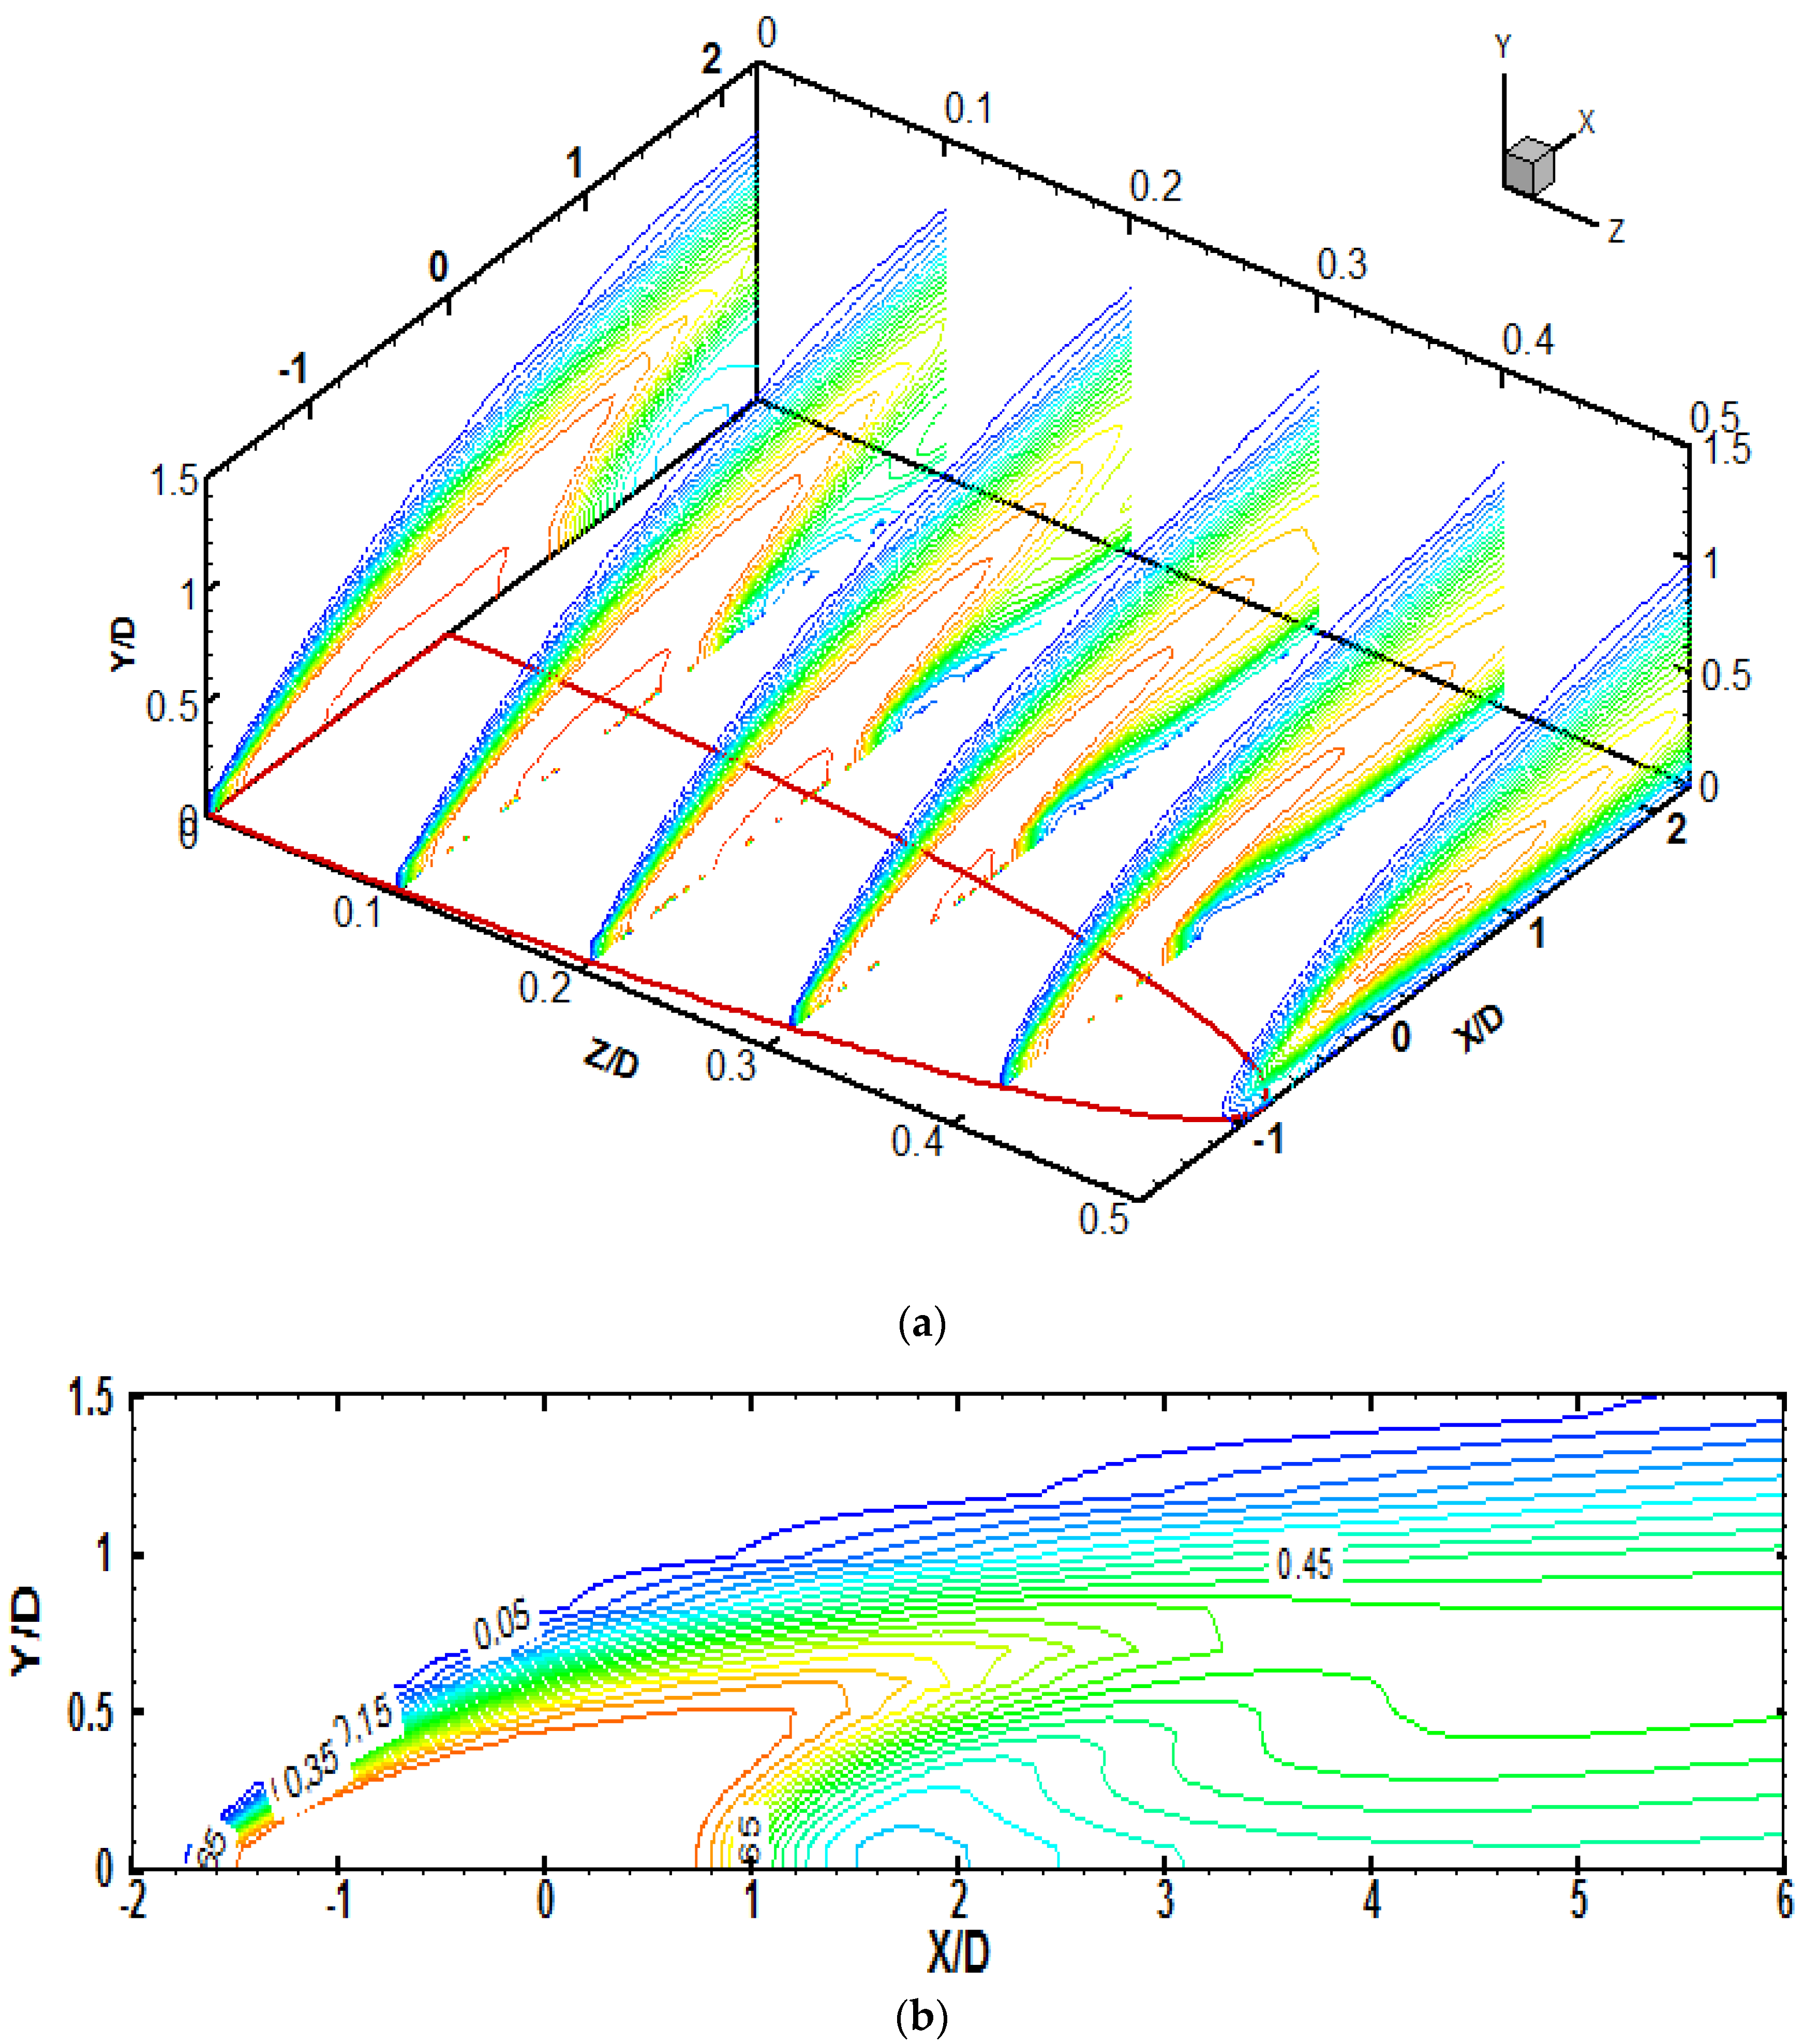
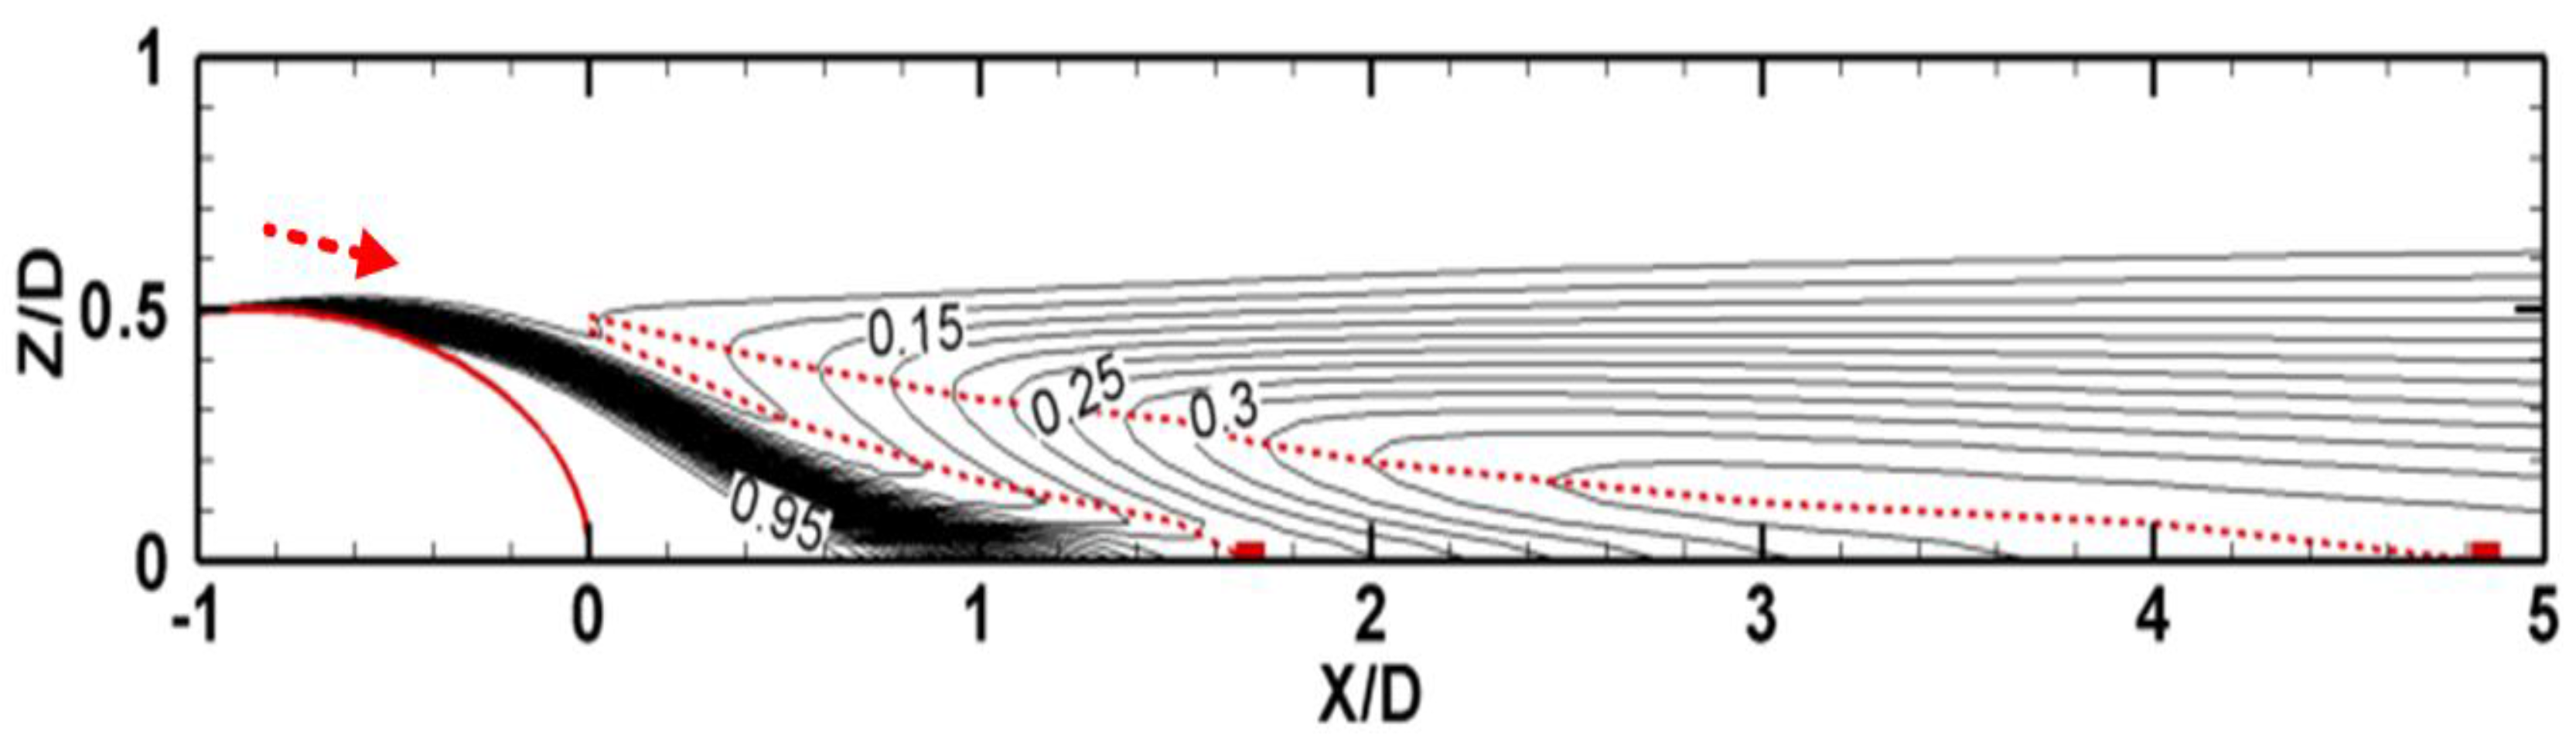
Figure 11 presents the near-field
η contours, where the value of the outer contour line is 0.1. The region outside the outer line is considered as dominated by the hot mainstream. The positions of liftoff and reattachment at the jet centerline are marked with square symbols. A local minimum field, which is traceable from (0, 0.46) and ends at the liftoff position, is marked with a dashed line. Another dashed line, originating from (0, 0.49) and ending at the reattachment position, marks a local maximum field. To understand the implication of this figure, the relevant characteristics of CRVP are worth summarizing:
The CRVP is formed mainly above the exit. CRVP vorticity is very high in the region above the exit and decreases steeply when moving away from this region, as shown in
Figure 6 and
Figure 7.
The core of the CRVP is located at the interface in the region above the exit, then it moves gradually into the jet flow. At X/D = 1.69, where liftoff occurs, the core is completely inside the coolant.
In contrast to some strong vortices rotating in situ, CRVP has a high advecting velocity, u, when rotating. The maximum ratio of the rotating velocity to the advecting velocity is approximately 0.3 in Case 1, the baseline case.
For the convection at the jet-mainstream interface, in the case of diffusion, the coolant temperature increases smoothly and slowly; in the case of advection, the temperature can change drastically.
Considering these flow characteristics and
Figure 11, we can conclude that a stream of hot gas is strongly entrained into and around the coolant stream. The strong CRVP leads to the entrainment indicated by a red arrow in
Figure 11. The footprint of the main body of this entrainment is the first dashed line, which extends to the liftoff position. The inner edge of the entrainment is very close to the first dashed line, and the outer edge is the second dashed line, which extends to the reattachment position. When the main body of the entrainment reaches the liftoff position, its moving distance in the Z direction is approximately 0.5D and approximately 1.7D in the X direction. Their ratio is approximately 0.29, and corresponds to the aforementioned ratio of 0.3 of the rotating velocity to the advection velocity of the CRVP.
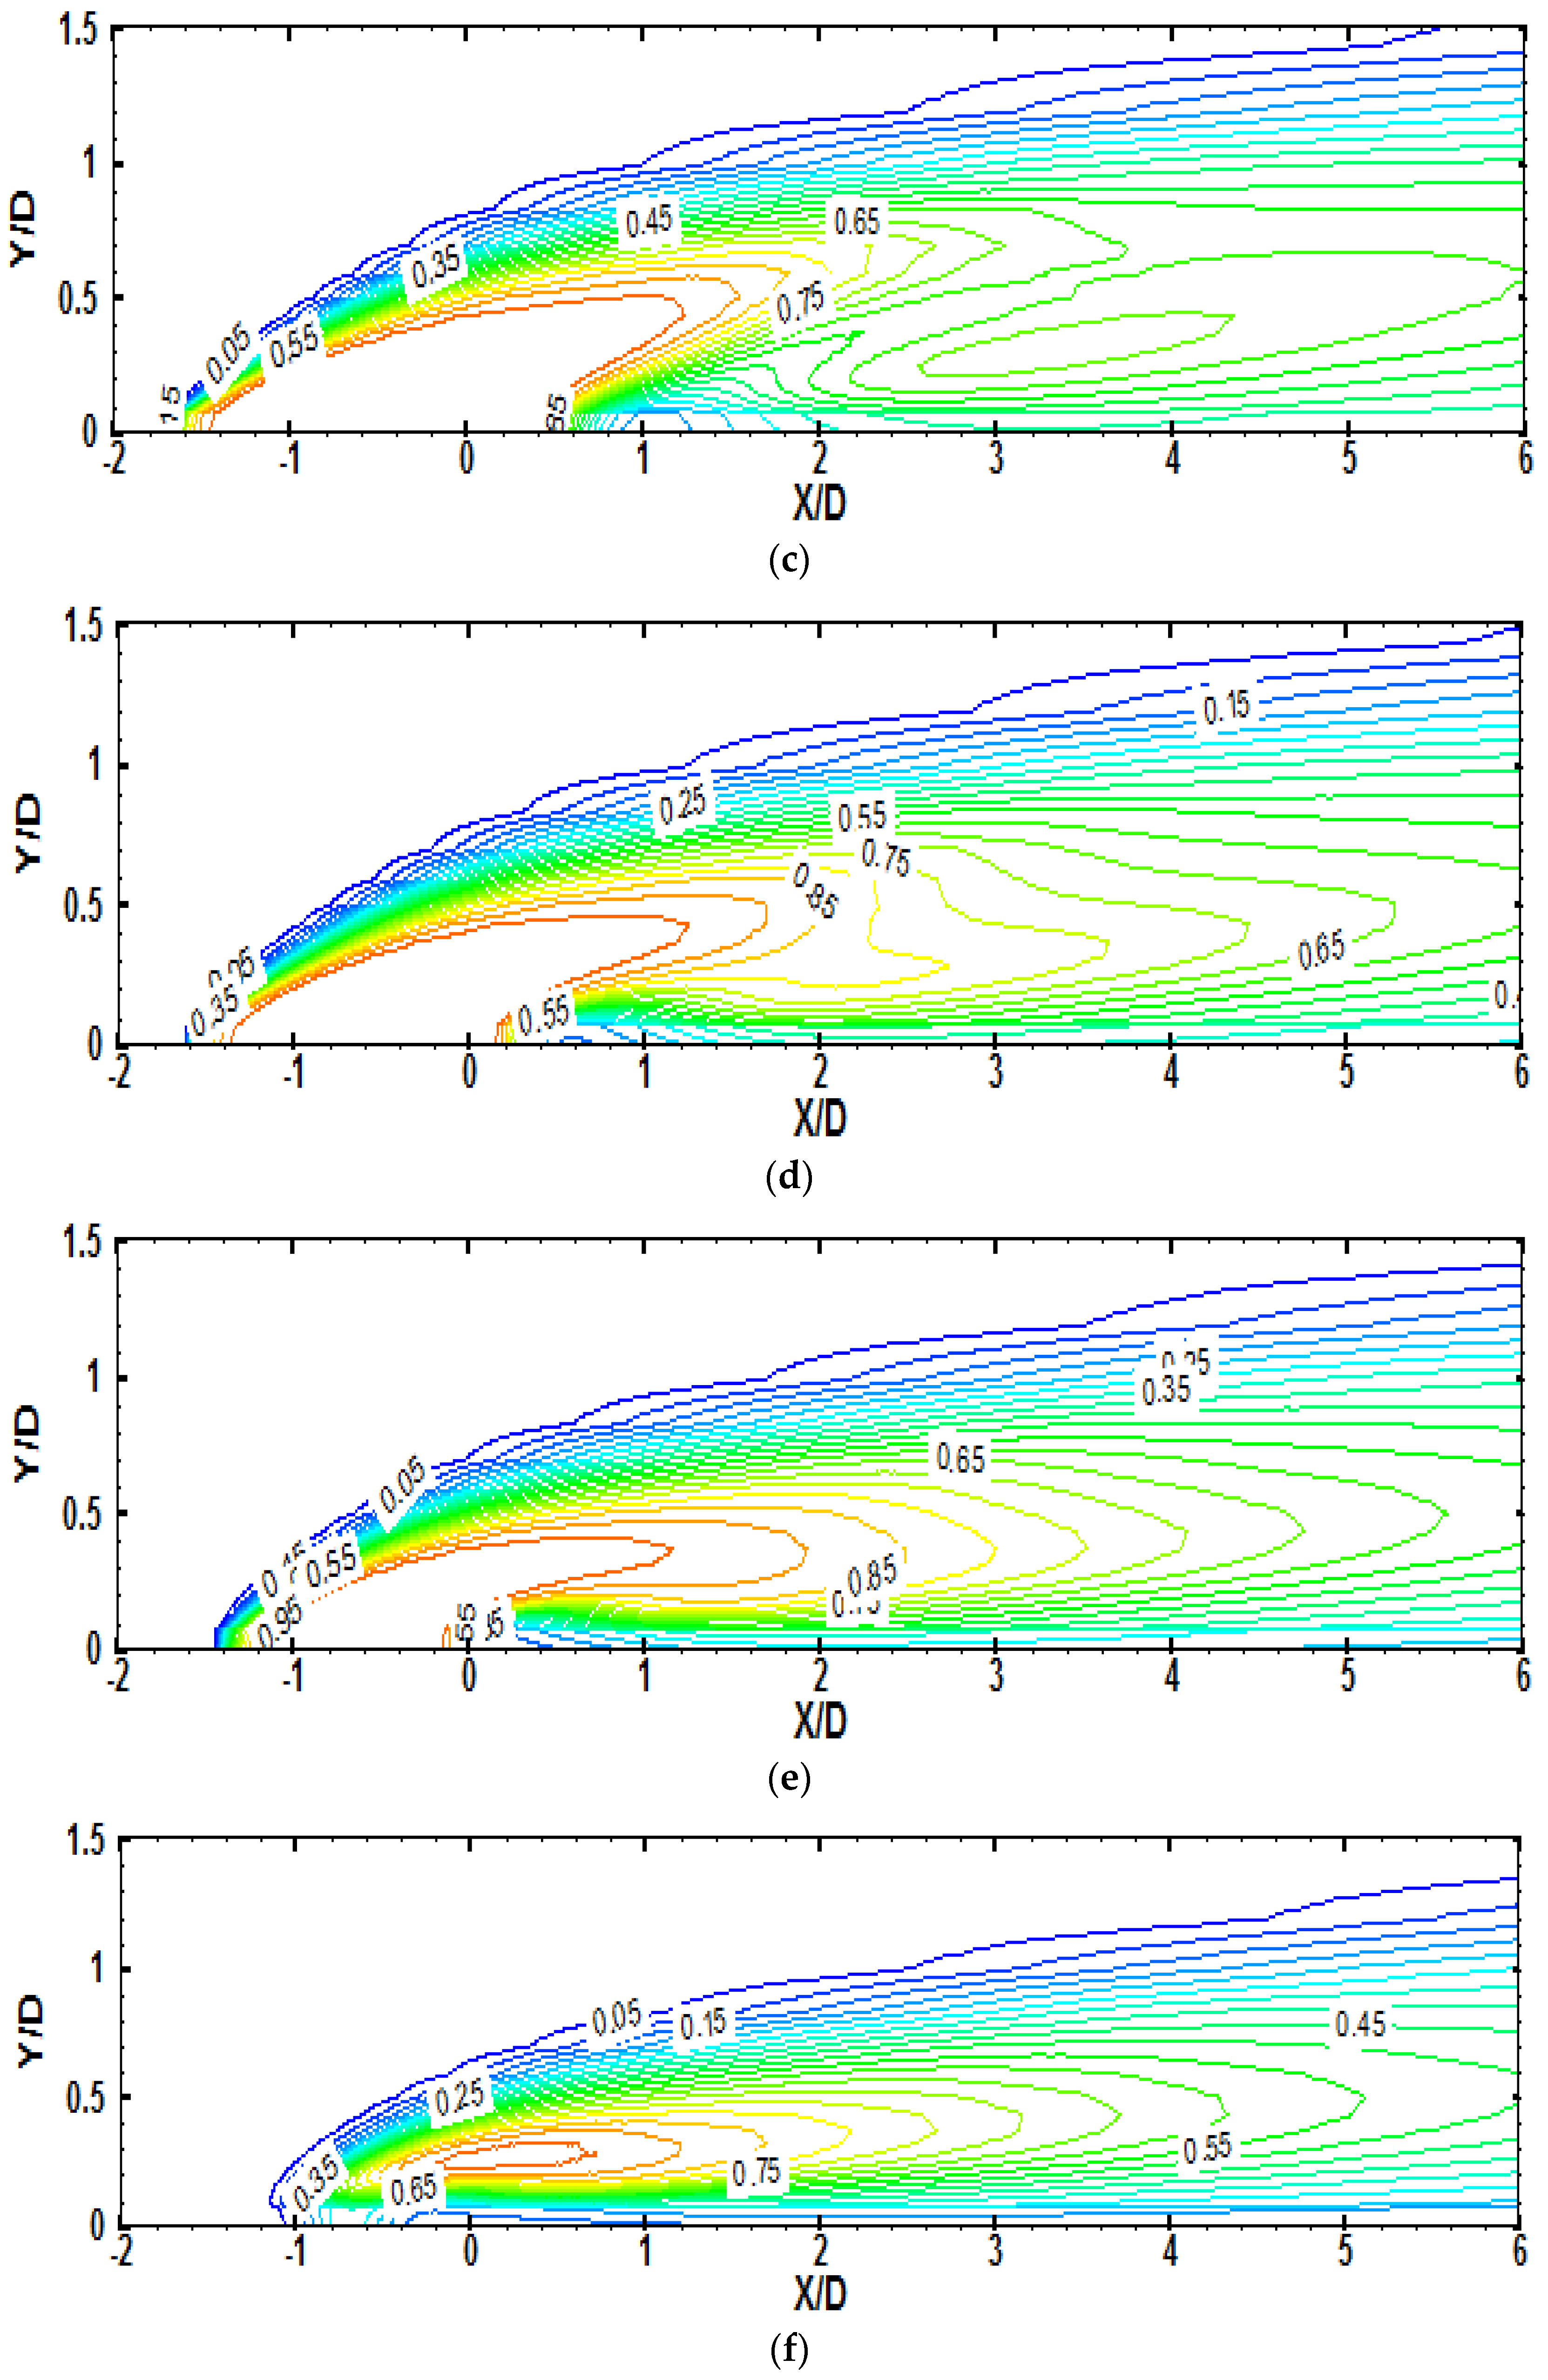
To make the argument more evident, the flow in the jet-mainstream region is viewed from a different angle in
Figure 12. Contours of the dimensionless temperature
θ are plotted in
Figure 12a at different Y-Z planes covering the full extent of the cooling hole. The
θ-contours at each Z/D plane between 0 and 0.5 are then reproduced individually for more clarity in
Figure 12b–f. At the hole centerline, Z/D = 0, there is a hot spot between X/D = 1.5 and 2—this is mainstream hot gases. As one moves away from the centerline, this hotspot becomes thinner and spreads over a longer extent downstream of the hole. This is a direct consequence of the CRVP which rotates the flow from above the wall, where the hot gases are flowing, into the-near wall region. This results in raising the wall temperature downstream of the hole hence lowering the cooling effectiveness. As one moves further away from the hole centerline (i.e., for larger values of Z/D) this region becomes thinner and assumes a longer extent which is also reflected in the decrease in the cooling effectiveness.
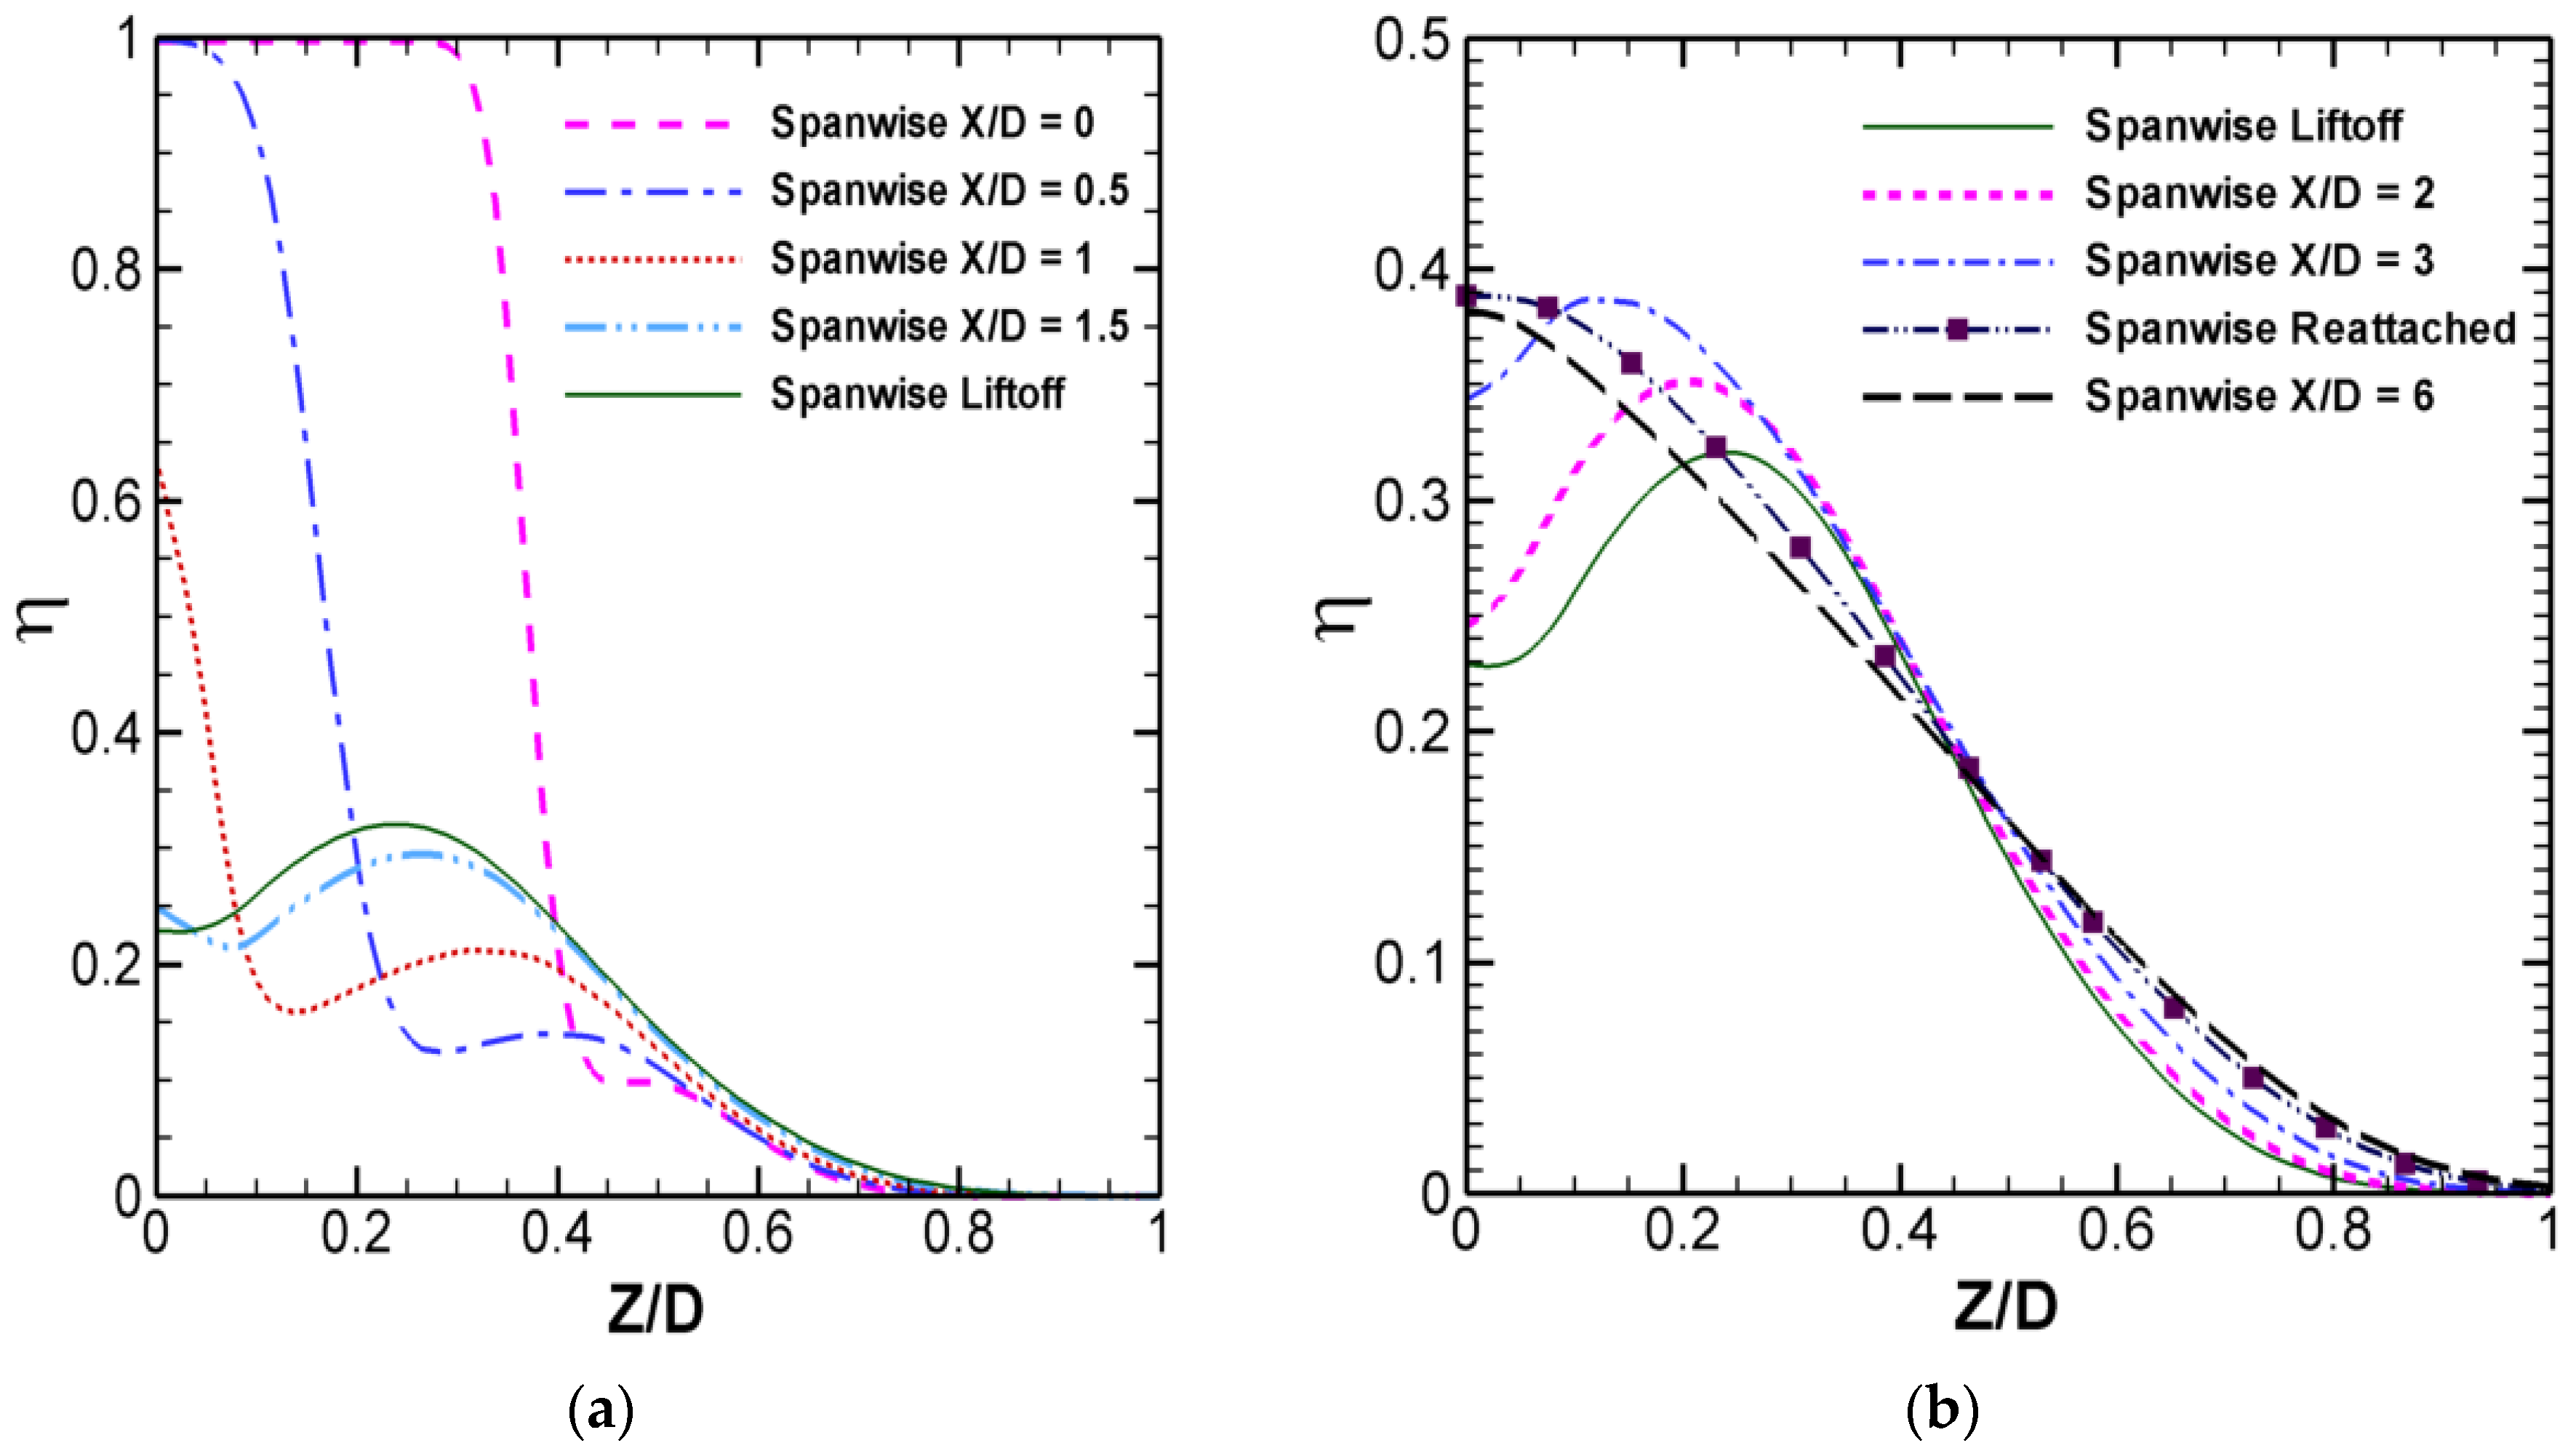
The near-field span-wise effectiveness (
ηsp) is presented in
Figure 13.
Figure 13a is the
ηsp before liftoff. Each curve has a “step,” which results from the entrained hot gas. The width of the step corresponds to the Z direction distance between the main body and the outer edge of the entrainment. At X/D = 0, this width is 0.03D; the widths are 0.11D, 0.16D and 0.2D at X/D = 0.5, 1 and 1.5, respectively. At liftoff position, the width increases to 0.24D. When the entrained gases expand, their thermal effectiveness
η also increases from approximately 0.1 to 0.23. The expanding and increasing trend implies that the entrainment is mixing with the coolant. At the liftoff position, the main body of the entrained gases leave the test plate.
Figure 13b presents
ηsp after liftoff. The
η value continues to increase until it reaches the reattachment position, where the entrained gas leaves the test plate completely.
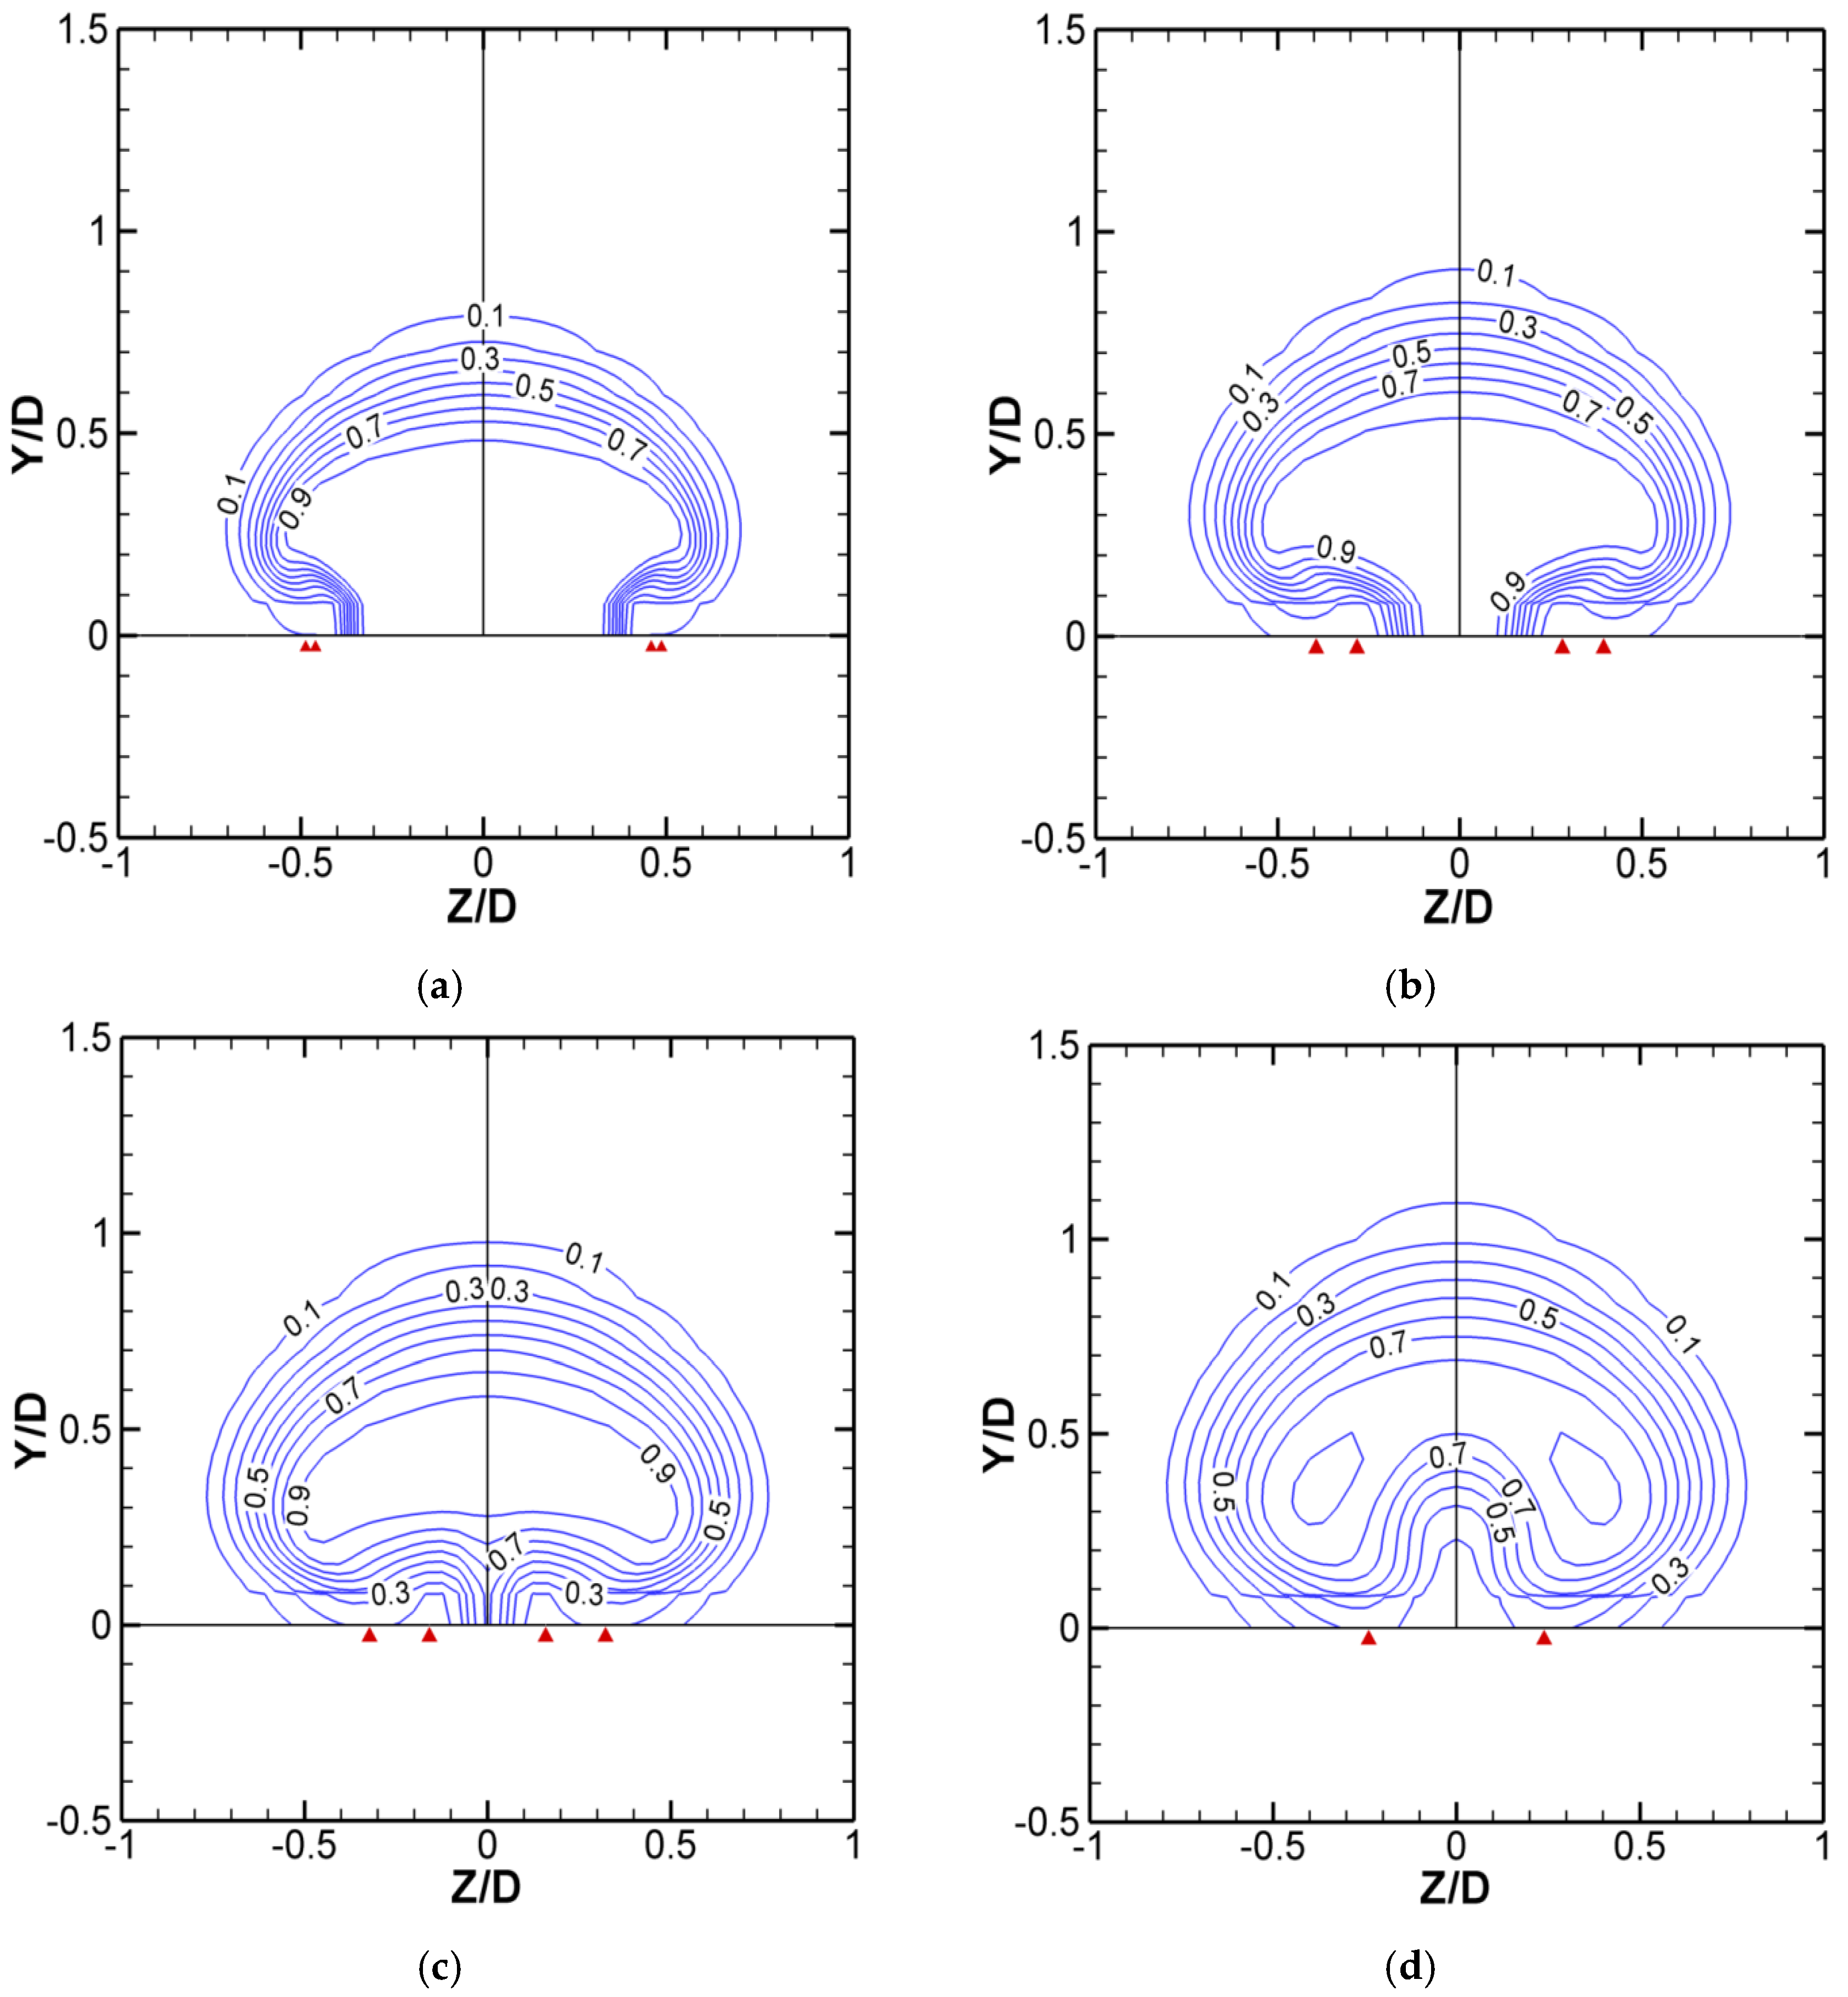
As the CRVP is a complicated 3D phenomenon,
θ contours in the near field on Y-Z planes are shown in
Figure 14 and
Figure 15, to clarify the process of liftoff and reattachment. The contours before liftoff are presented in
Figure 14. Triangles showing on the X axis are used to mark the footprints of the main body and outer edge of the entrainment region. At X/D = 0, hot gases are entrained at the bottom around Z/D = ±0.5; then at X/D = 0.5 and 1, they advect inwards and expand while their temperature
θ increases. At liftoff position, the entrained gases turn up and thrust into the coolant jet, resulting in the hot gases/coolant jet mixing. The turning up cuts the coolant into two parts. The CRVP is also named kidney vortices because of its shape.
Figure 14d shows that the formation of the kidney shape, particularly the formation of the kidney hilum, is the result of the entrained gases turning up.
The
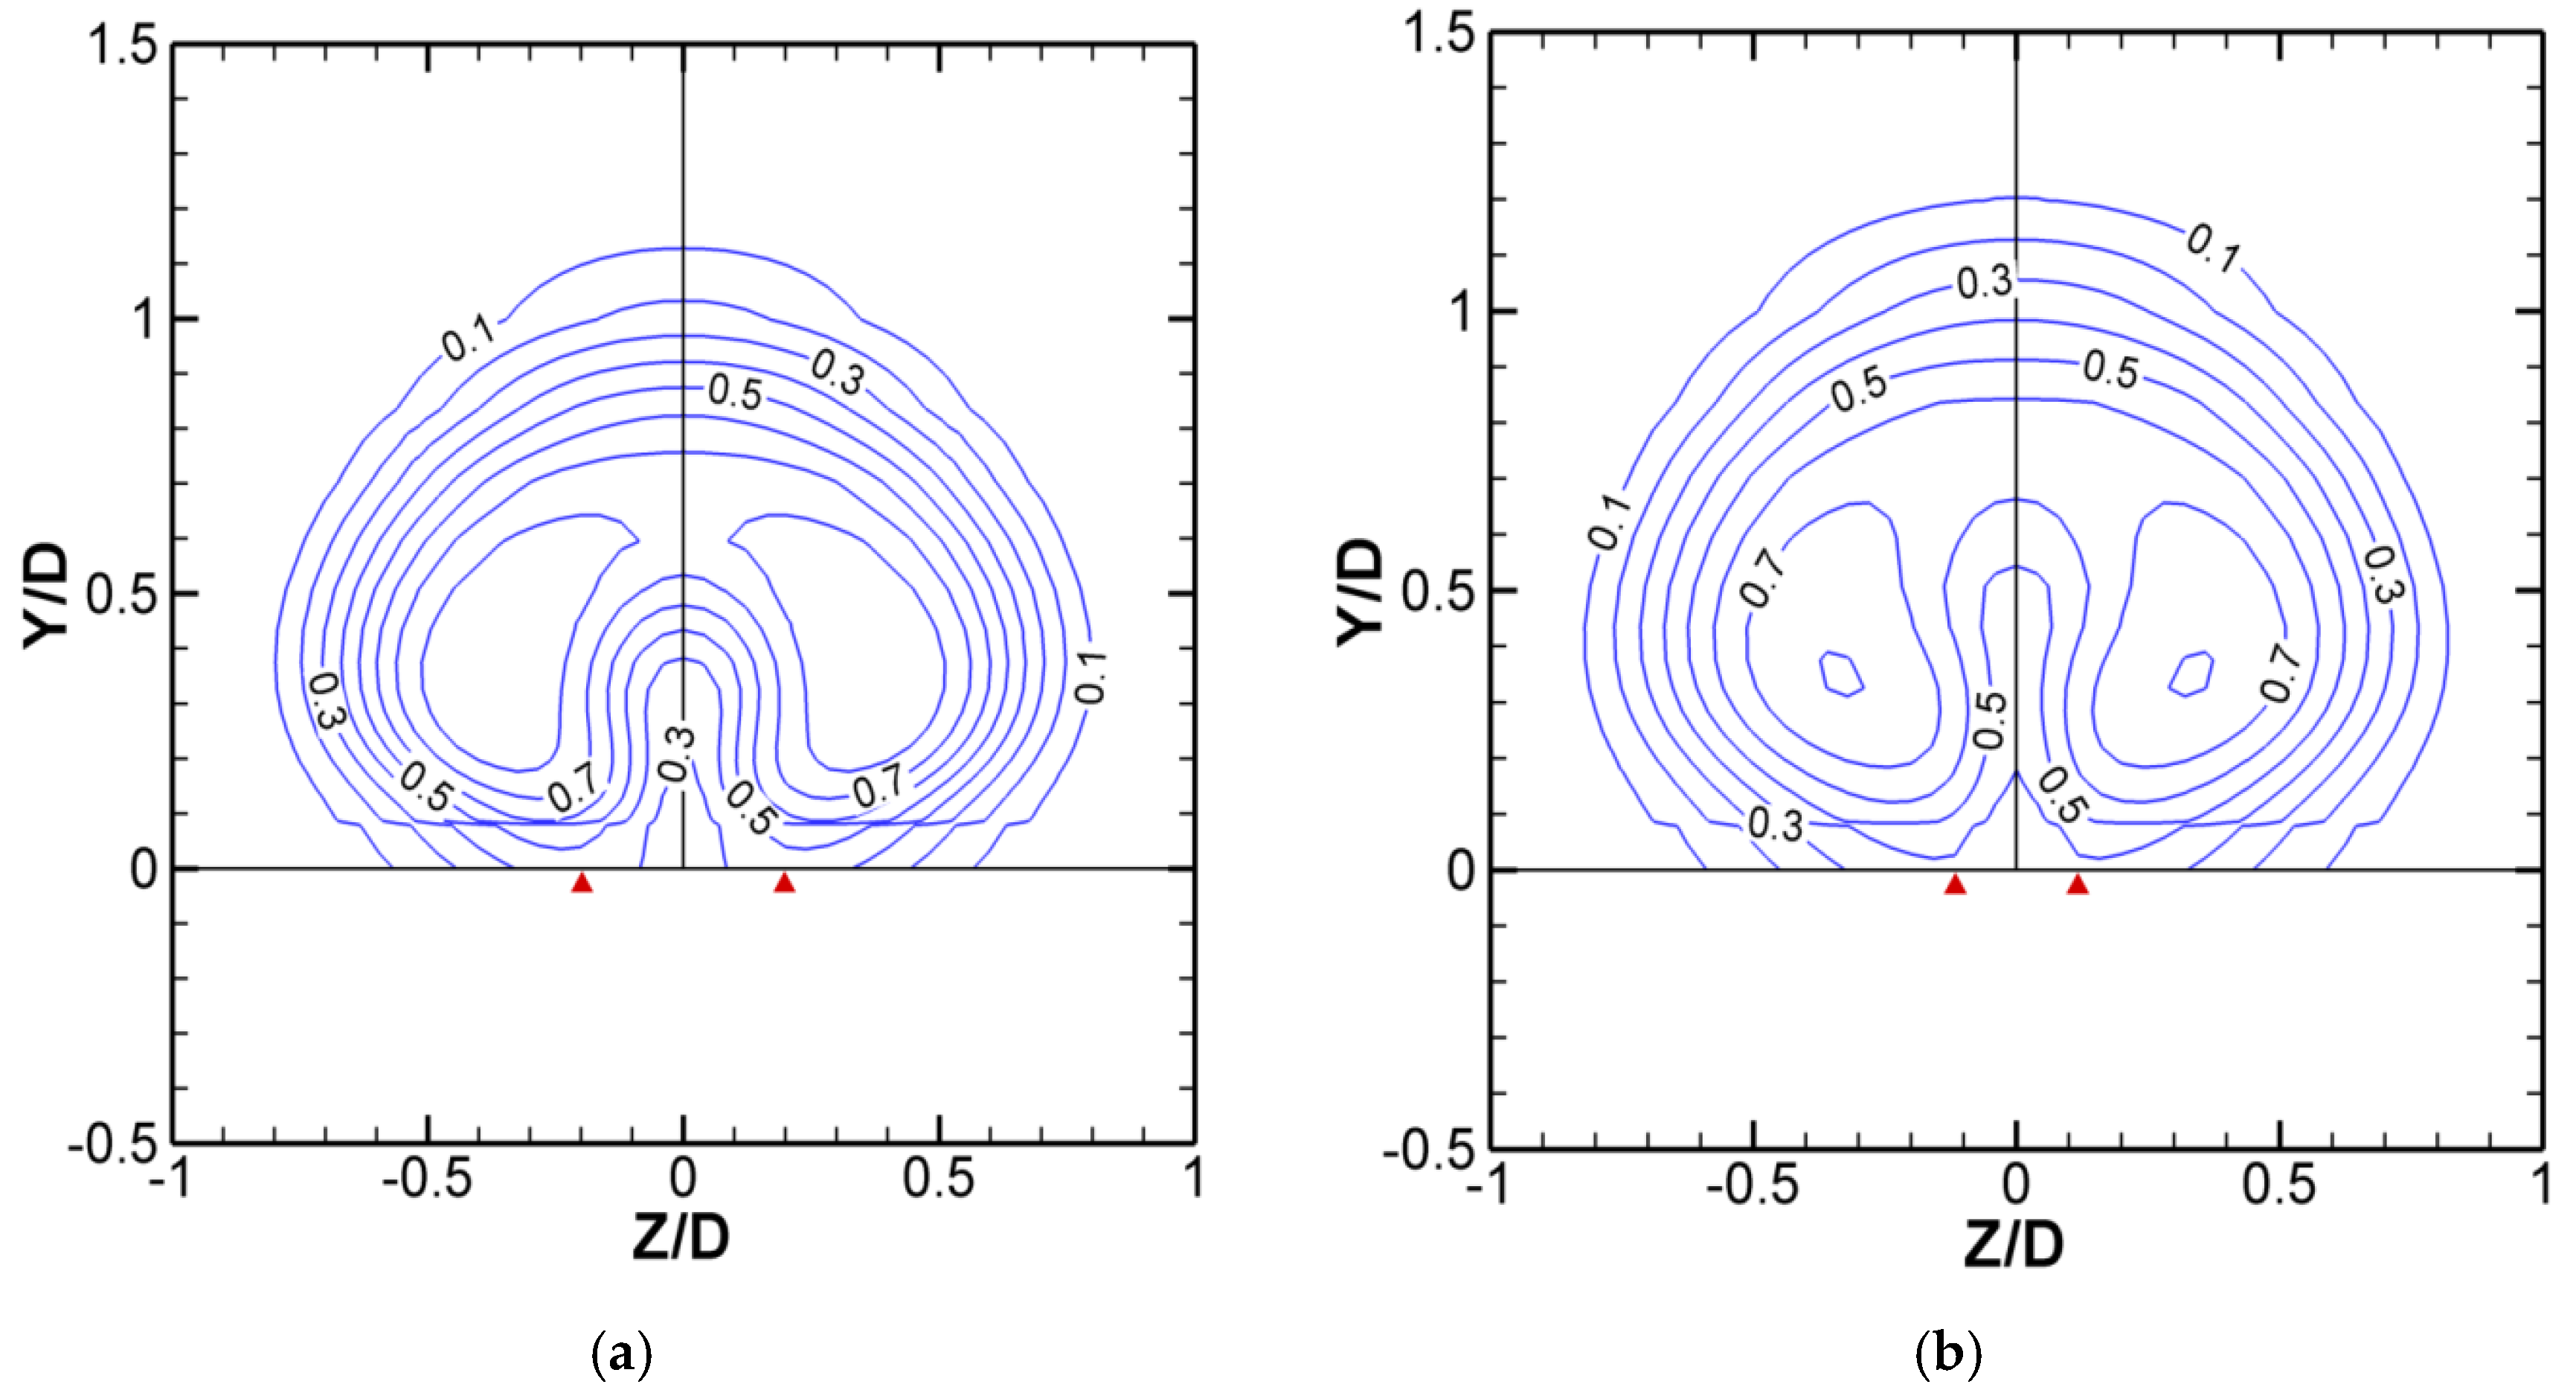
θ contours before the reattachment are presented in
Figure 15. The entrained gases keep advecting upwards and mixing with the coolant. Its outer edge keeps advecting inwards until reaching the reattachment position, where the entrained gases leave the test plate completely and mix with the coolant.
The Y/D values of each
θ peak and top edges of
θ = 0.1 are extracted from
Figure 13 and
Figure 15, and listed in
Table 1 to present the jet trajectory. The values at both the center and the top edge increase with increasing X/D. The phenomenon of the jet flow leaving the surface at the liftoff position then returning to the surface at the reattachment position, as proposed in literature, cannot be detected.
Combining
Figure 11,
Figure 12,
Figure 13,
Figure 14 and
Figure 15, the phenomenon of liftoff and reattachment can be considered as the vestige of a strong entrainment, which is caused by the CRVP. At the region above the exit, where CRVP vorticity is strong and its cores are located at the mainstream-coolant interface, a significant amount of hot gas is entrained into the coolant and becomes a small part of the CRVP. Then, it advects leeward and inward, mixing with the coolant. At the centerline, it turns up, leaves the test plate, and finally mixes with the coolant. At the same time, it forms the kidney shapes.
4. Conclusions
The present study simulated numerically the flow field for three film-cooling cases, namely Case 1—a baseline case; Case 2—the FSIT case; and Case 3—the unsteady flow case. The comparison of Cases 1 and 2 and Cases 1 and 3 demonstrated that the Counter-Rotating Vortex Pair (CRVP) formation process is the main source of CRVP formation, while the effect of the in-tube boundary layer and the in-tube vorticity on the CRVP formation are at best of a secondary nature.
This investigation has proved that the CRVP in film-cooling flow is due to a vortical structure in the mainstream flow direction. Therefore, its main promoter is the velocity jump across the shear layer which determines the strength of the vortex rings forming at the pipe exit. This mechanism explained the effects of Br on η. It is also the fundamental mechanism respo
The liftoff-reattachment phenomenon in film-cooling flow was also investiga nsible for the high cooling performance of diverging holes. Therefore, the guideline for creating new high performance film-cooling schemes ought to be decreasing the strength of these vortex rings.ted. It was shown that this phenomenon did not result from the jet flow leaving the test plate and then returning to it. In fact, it resulted from the entrainment effect of the CRVP. When a strong CRVP above the cooling holes exit entrains hot gases into its path, the footprints of the entrained gases, advecting and mixing with the coolant, led to liftoff and reattachment. The main body of the entrainment corresponded to the liftoff, and its outer edge corresponded to the reattachment. In other words, an attached jet flow is due to a CRVP that is not strong enough to entrain much hot gas, or to the fact that the entrained gases mix with the coolant before it reaches the pipe centerline. The phenomenon of attachment, liftoff and then reattachment strongly depends on the CRVP strength, rather than the jet flow trajectory.


