
Effects of Loading Rate on the Relaxation and Recovery Ability of an Epoxy-Based Shape Memory Polymer

1
Department of Engineering, St. Mary’s University, San Antonio, TX 78228, USA
2
Materials and Manufacturing Directorate, Air Force Research Laboratory, Wright-Patterson Air Force Base (WPAFB), Dayton, OH 45433, USA
3
Multi-Scale Composite and Polymers Division, University of Dayton Research Institute, Dayton, OH, 45469, USA
*
Author to whom correspondence should be addressed.
Fluids 2017, 2(2), 13; https://doi.org/10.3390/fluids2020013
Submission received: 29 December 2016
/
Revised: 17 March 2017
/
Accepted: 23 March 2017
/
Published: 29 March 2017
Abstract
:The majority of aerospace structural composites use thermoset resins for their processing flexibility, temperature capability, and environmental durability. In this study, the recovery behavior of Veriflex-E, an epoxy-based, thermosetting, thermally-triggered shape memory polymer (SMP) resin, is investigated in glassy (25 °C) and rubbery (130 °C) states, as a function of shape memory cycles, and as a means to evaluate its potential as a resin for a shape memory composite. At 25 °C, Veriflex-E exhibits a promising high elastic modulus and a positive, nonlinear strain rate sensitivity in monotonic loading. At 130 °C, the strain rate sensitivity in monotonic loading decreases. Stress relaxation after storage in the deformed temporary state and subsequent shape recovery is of particular interest, a challenge to measure, and has not been widely reported for SMPs. The current experimental program measures the influence of strain rate changes in the 10−4–10−2 s−1 range on the stress relaxation response of the material, as well as on the strain recovery behavior at both 25 °C and 130 °C. As expected, the post-relaxation strain is larger with faster loading. Unexpectedly, the total strain recovered after shape memory cycling is more similar to the low temperature deformation. Overall, the results suggest that, while being influenced by both the loading rate and the test temperature, Veriflex-E is a promising candidate for a shape memory composite which could enable adaptive structures.
1. Introduction
The field of shape memory polymers (SMPs) is rapidly developing for applications in a variety of disciplines, including the recent development in the aerospace industry for use in adaptive vehicles [1,2] and in the manufacturing industry for collapsible/removable tooling [3]. However, before such applications can be attempted, the 3-D mechanical behavior of SMPs must be thoroughly understood. By understanding their critical mechanical performance at temperatures below, above, and through the glass transition temperature (Tg), the “memory” capabilities of SMPs can enable reconfigurable structures such as micro air vehicles, morphing aircraft, and deployable space structures.
It has been established that polymers exhibit a strain rate dependence at room temperatures [4,5,6]. Additionally, it has been demonstrated that strain rate dependencies become more apparent as polymers approach their Tg [7,8]. Elastomers can also exhibit a deformation rate dependence [9,10]. Therefore, it is predictable that SMPs will exhibit mechanical behavior dependencies on the rate of deformation at temperatures below, at, and above their Tg. The aim of the current investigation is to quantify the specific influence of strain rate on the stress relaxation behavior of an epoxy-based SMP; these measured differences are needed for the development of a comprehensive model for structural SMPs [2]. The end goal of the authors’ overall SMP efforts is to measure the potential of the various shape memory polymers for use in adaptive (morphing) aerospace vehicles. Of particular interest is the understanding of the complex, path-dependent kinematics/mechanical properties of epoxy-based SMPs. Specific experiments that should be conducted need to be designed to evaluate the key performance parameters of repeatability, response time, recovery force, and the actuation force required to achieve the desired shape change. In addition, the rate-dependent mechanical response of the polymers in both the un-deformed and deformed state needs to be evaluated. The results of the mechanical investigation of the polymers should aim to provide insight into the best candidate material for use in aerospace structures, as well as toward the appropriate class of material models to employ in the design and analysis of structures made of this candidate material. The goal of this paper is to specifically elucidate the critical material response to stress relaxation and recovery at various strains, deformation rates, and temperatures.
The key technical challenge in characterizing the mechanical performance of SMPs is that traditional contact methods of measuring deformation are not practical for the low modulus and high strain capability above their Tg. A “low contact force” high-temperature extensometer can measure engineering strains of +20% and applies a force of 2.9 N to the sample [11]. SMPs can deform over 100% engineering axial strain before failure and will distort under the 2.9 N of contact force when in the high temperature “rubbery” regime. Due to this extreme behavior, optical methods have been demonstrated as reliable measurements of the axial deformation of SMPs [12,13,14,15,16]. The transverse strains during axial loading have also been measured using optical methods [17,18]. In order to develop a method to accurately measure the axial and transverse stress-strain behavior of SMPs in both their low temperature “glassy” regime and their high temperature “rubbery” regime, great attention to detail was paid in [17] in setting up the experimental techniques used in the current study. In particular, the use of Digital Image Correlation (DIC) as a non-contact method of measuring both axial and transverse strains was established.
DIC is a non-contact deformation measurement technique that tracks the distortion of surface patterns on an object during deformation and/or rigid body motion. The images are then post processed to extract full-field deformations. A random array pattern on the face of a sample is tracked during axial tension using a stereo view produced from two angularly offset cameras. During the processing of the stored images, the DIC system tracks the sub-regions of the random array in each image set. By tracking these sub regions in both cameras, the system calculates a full-field measurement of the local deformations in the x-, y-, and z-axis on the face of the sample. These local deformations are then used to determine the 2-D strains on the face of the sample. Great detail is given by Sutton et al. [19] on the methods used in the DIC system to track and calculate the full-field deformation. In addition, strain control testing has been achieved on these thermally triggered SMPs above their Tg [17,18] using a laser extensometer. The use of the extensometer overcomes the deficiencies of the traditional crosshead displacement control method, which does not account for localized deformations or the grip thermal expansion/contraction.
Past work by McClung et al. [18,20] provided a detailed study on the thermal properties of the Veriflex-E through dynamic mechanical analysis and differential scanning calorimetry. McClung et al. [18] also examined the strain rate effects under the monotonic loading of Veriflex-E as a benchmark epoxy-based SMP. Based on the Veriflex-E response, two envelopes of material behavior ranging from 25 °C to 90 °C, and from 90 °C to 130 °C, were identified. In the lower temperature interval, the material is relatively stiffer and exhibits necking. Depending on the combination of the temperature level and strain rate, the Veriflex-E displays a flow region before failure and a yield stress value that increases as the deformation rate is increased. In the higher temperature interval, especially at elevated temperatures of 100 °C, 110 °C and 130 °C, the material does not yield, but exhibits strain hardening until failure. The Young’s modulus of the resin is most sensitive to the strain rate value near Tg, and shows a lower sensitivity at the other temperatures considered, although some slight increases have been measured in the glassy and rubbery regions.
It was seen that the strain at the fracture can be maximized at a temperature which is close to the completion of transition to the “rubbery” state. The fracture stress of the resin demonstrates a maximum value at room temperature and exhibits a local maximum near the Tg. For temperatures at least 10 °C above Tg (110 °C and above), the mechanical properties were found to be largely equivalent. The use of DIC enabled the measurement of the transverse strains (in addition to the axial strain) and therefore the Poisson’s ratio could also be measured [18]. The Poisson’s ratio does not show a dependence upon the strain rate, but the value is sensitive to the combination of the axial strain magnitude and test temperature. The material asymptotically approaches an incompressible behavior (νH = 0.5).
The results presented in that work clearly show that the monotonic tensile behavior of the material is a strong function of both the loading rate and the test temperature. Viscoelasticty-based models for thermally activated systems are limited [2]. The creep behavior of SMPs has been examined, for example, by using a Polyurethane-based SMP [21]. Recovery following shape memory cycles has been examined by numerous groups [20,21,22,23,24]. However, stress relaxation (holding at constant strain and measuring stress) is a more challenging experiment to accomplish and therefore has not been explored for SMPs. In particular, deployable SMP structures are likely to be kept in their fixed deformation state for extended periods of time, prior to recovery. This article aims at filling this gap in the understanding of SMPs.
The current experimental program utilizes the experimental setup already established by McClung et al. [7,17,20,22], and is designed to explore the influence of the strain rate during deformation, and of the temperature and strain level on the relaxation response of the material. In addition, the influence of the strain rate during deformation and the strain level during relaxation on the strain recovery behavior at both 25 °C and at 130 °C is evaluated. These influences are explored through a stress relaxation test, followed by recovery.
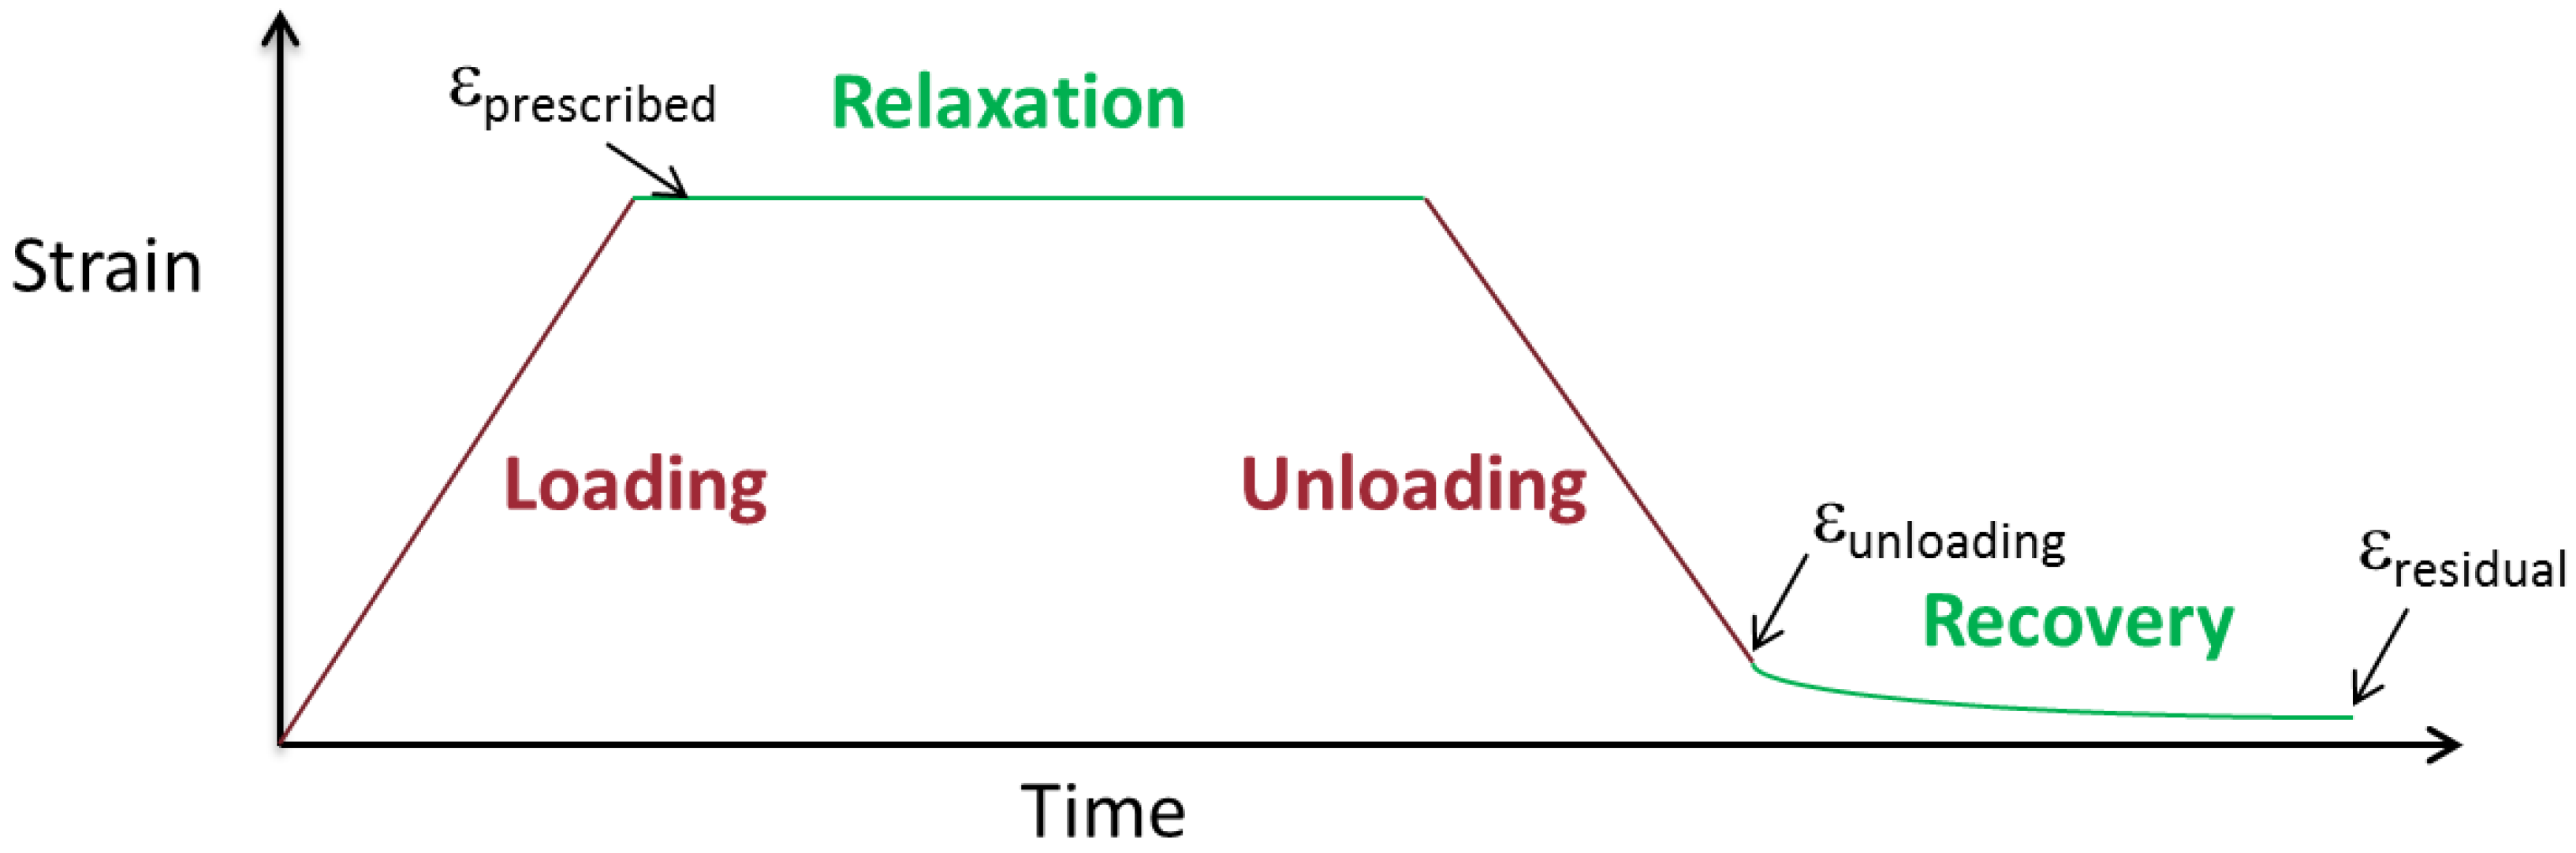
A schematic of a general stress relaxation test is presented in Figure 1. The general test begins with a period of strain controlled loading to a prescribed engineering strain, where a period of stress relaxation is conducted (the strain is held constant for a set period of time and the required stress levels are monitored). Following this stress relaxation, the material is unloaded at the same rate of strain control that it was loaded, until zero stress is reached. At the zero stress point, the strain is recorded (εunloading) and the sample is then held at zero stress for a given period of time, while the strain is continuously monitored. During that period, the strain in the sample exhibits some movement back toward zero strain, which is termed the “recovery” of strain.
The results of these stress relaxation and recovery tests are presented in the current study. These results address the broader community goal of being able to model the time, temperature, and rate dependent constitutive response of SMPs, in order to correctly predict their performance under realistic service conditions. These broader constitutive framework efforts include models that are 3D and thermomechanical [23,24,25], models based on a phase evolution law [26,27], and models separating out creep in a time-temperature dependency [21]. The end goal of the authors’ overall SMP efforts is to measure the potential of the various shape memory polymers for use as structural elements. Of particular interest is the understanding of the complex, path-dependent kinematics/mechanical properties of epoxy-based SMPs. The current results provide the measured influence of the strain rate on the specific stress relaxation behavior of an epoxy-based SMP; these measured differences are essential for model development and validation for structural SMPs [2].
2. Material and Testing Methods
This study focuses on Veriflex-E, a two-part epoxy-based shape memory polymer (SMP) resin system manufactured by Cornerstone Research Group, Inc. (CRG, Dayton, OH, USA). This material is chosen due to its relevance to aerospace applications. The material was purchased from CRG, designed with a glass transition temperature (Tg) of 105 °C. The panel fabrication, cure, and post-cure were conducted following the details discussed by the authors in [17].
The uniaxial tensile tests reported here were carried out on an MTS machine, surrounded by an MTS 651 environmental chamber with an optical window for making observations inside the chamber. An 890 N water-cooled load cell and MTS Advantage 200 N pneumatic grips were used. An MTS FlexTest 40 digital controller was employed for input signal generation and data acquisition. Strain control was accomplished using an MTS laser extensometer with a 25.4-mm gauge length to the retro-reflective tape applied to each sample. A temperature ramp rate of 2.5 °C/min was used for heating/cooling the chamber to the desired temperature, followed by a 60 min soak time to ensure thermal equilibrium.
3. Quantification of Shape Memory Behavior
The objective of this study is to quantify the stress during periods of constant strain at a constant temperature (stress relaxation), and the strain during the subsequent recovery. The recovery following the stress relaxation at constant temperatures is then compared to the period of stress relaxation that occurs while the temperature is lowered from the “rubbery” state to the “glassy” state (the middle of a shape memory cycle). In order to quantify the recovery in all temperature profiles, this study will use the established “total strain recovery” parameter, which is often used for evaluating the performance of SMPs. To understand the background, a brief description of polymer shape memory ability and the shape memory cycle is warranted.
The mechanisms that drive SMPs have been covered in great detail in the open literature [2,28,29,30,31]. A brief recap of these mechanisms is warranted here for completeness. SMPs are polymers optimized to be easily fixed into a deformed state, which then return to their original shape when triggered through the release of stored strain energy. The polymer’s original, or native, shape is typically defined by a primary network of polymer chains that is set by initial processing and persist while a secondary network is modulated in the degree of cross-linking. Upon deformation from the native shape, strain energy is introduced into the primary network and stored by an increase in the number of cross-links in the secondary network. Strain energy is released when cross-links of the secondary network are removed and the polymer attempts to return to, or “remember”, the original shape. Cross-links occur from interactions such as chain entanglement, crystallite formation, secondary interactions, or covalent bonding, and can be modulated by a thermal, radiative, or chemical means [28]. For thermally activated SMPs with a secondary network of entangled amorphous polymers, the physically cross-linked chains are overcome at the glass transition temperature (Tg). The Tg of amorphous polymers is typically increased with an increase in the relative amount of cross-linking [2,28]. Shape recoverability is achieved when the strain energy from the deformation of the “fixing” process is released during the transition from the glassy to rubbery polymer, as the Tg is crossed.
These materials show two phases. At temperatures above Tg, the relatively low “rubbery” elastic modulus is observed and can be used to deform the material into a temporary shape. This temporary shape can be fixed by cooling the material below the Tg. Once below the Tg, the material exhibits a higher “glassy” elastic modulus (several orders of magnitude higher than the “rubbery” modulus). Reheating (above Tg) causes the material to revert back to its original shape. Thus, the SMP twice undergoes a temperature change across its Tg. These materials display orders of magnitude change in stiffness as they approach and traverse the Tg.
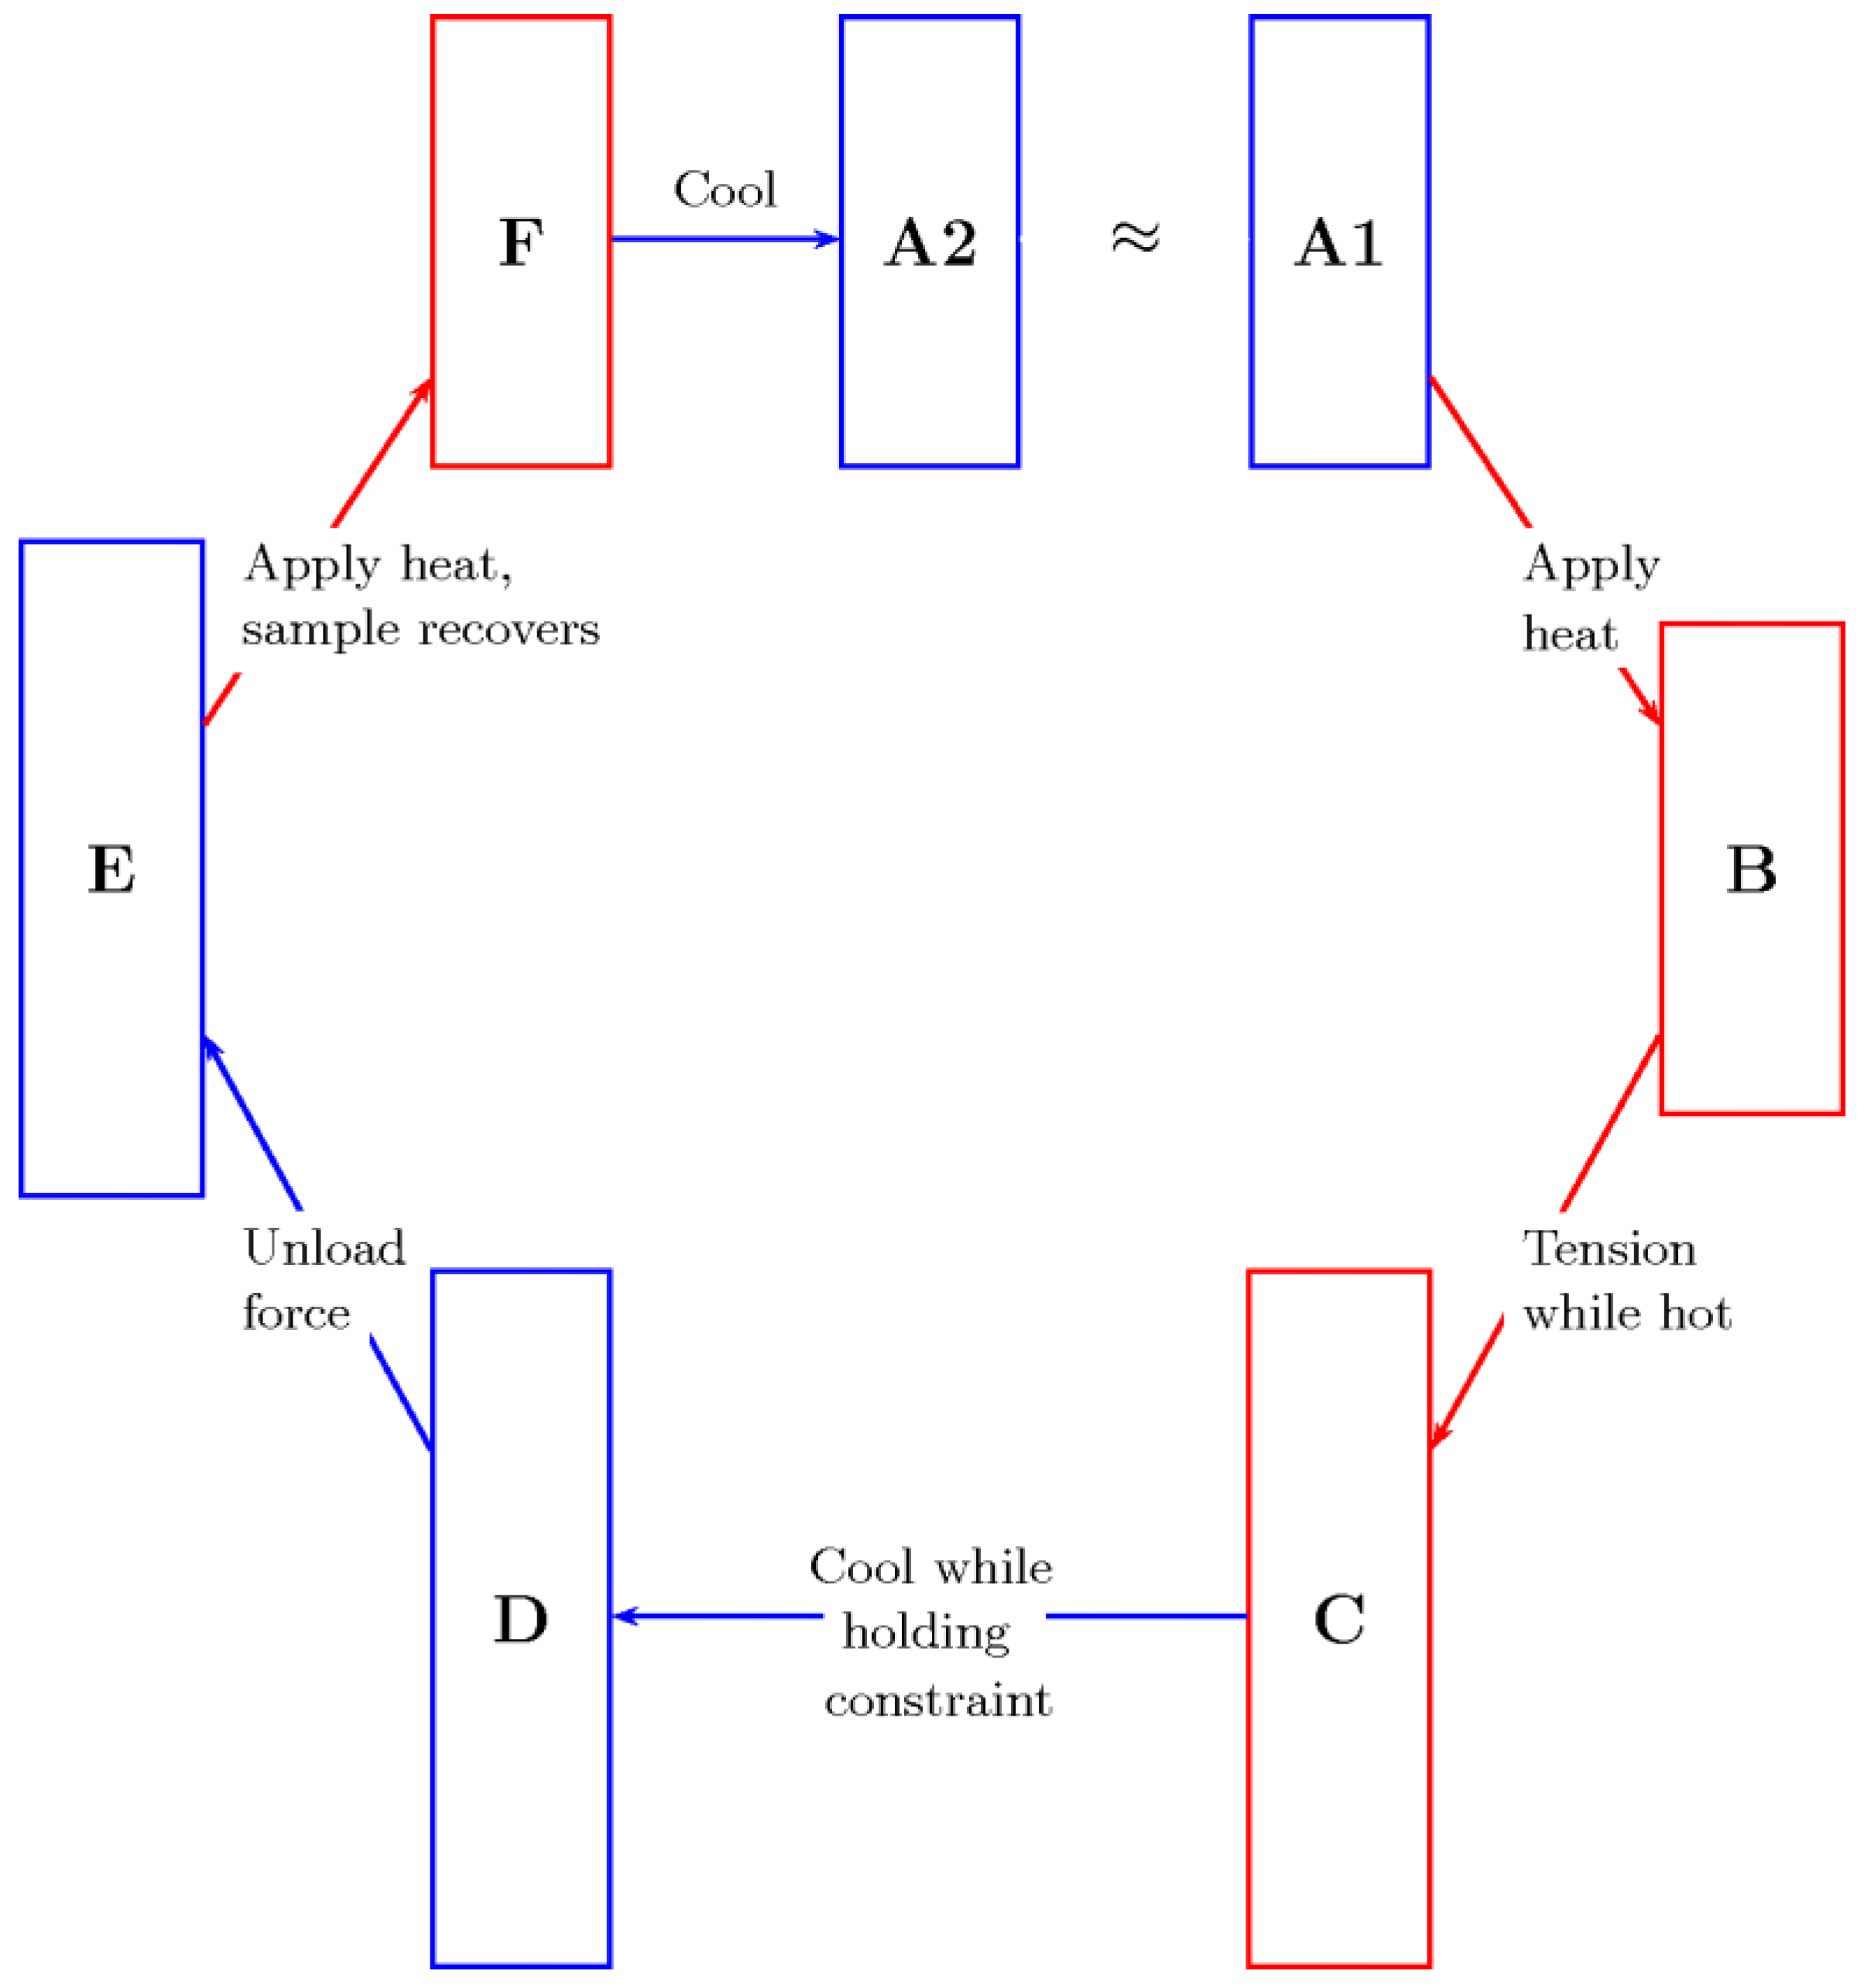
By optimizing the polymer structure, SMPs can capitalize on the memory abilities described in the previous paragraph, to change their shape in a predefined way from a locked-in (deformed) shape to their original shape, when exposed to an appropriate stimulus such as heat, as illustrated in Figure 2. The material begins at state A1 with a relatively high “glassy” modulus. Heat is applied to the sample, which causes the modulus to drop, by several orders of magnitude, to its “rubbery” modulus. While in this high temperature state (B in the figure), the sample is deformed into its new shape (in the present study it is deformed in axial tension as signified in C). The deformed shape is held in place while the sample is cooled back to its “glassy” modulus. Once it is cooled, the sample is at state D. The force is removed and the sample is at the locked-in state E. When heat is reapplied to the locked-in sample, the material reaches its “rubbery” modulus again and the unconstrained sample returns to its original “memorized” shape, at state F. Finally, the sample is cooled to state A2, which is close to state A1. The better the “memory” properties of the SMP, the closer state A2 is to state A1. In the current work, the path-dependent behavior of Veriflex-E is evaluated by means of a shape memory cycle similar to the schematic in Figure 2.
For an ideal shape memory material, the exact original state is achieved. However, in reality, shape memory materials achieve a state close to their original shape. The shape (or strain) recovery parameter is a measure of how closely the material returns to that original shape in the shape memory cycle (A2 comparison to A1 in Figure 2). The shape (or strain) fixing parameter is a measure of how well the material locks in the intended deformed shape (E in Figure 2). Various researchers have established different performance parameters to compare the “fixing” and “recovery” of SMP materials [28,29,32,33,34,35]. The focus of this study is a comparison of the “recovery” after the shape memory cycle and the recovery following stress relaxation tests.
Lendlein and Kelch [28] defined a “total strain recovery” parameter, Rr,tot, which is adopted in the current study, as follows:
where εp is the prescribed axial strain (at point C in Figure 2) and εf is the final axial strain at the end of the shape memory cycle (at point A2 in Figure 2).
The recovery definition in Equation (1) uses the original pre-deformed configuration as the reference value, and therefore provides a measure of the performance of the material in reference to its original state when cycled multiple times. This parameter has been adopted by many researchers, including [28,36,37]. The current study uses this same parameter.
Schmidt, et al. [37] examined the functional fatigue of Veriflex (a styrene-based thermally triggered SMP) and found that the styrene-based resin exhibited recovery values between 65% and 85%, revealing a large decay from the first cycle to the eighteenth. This decay in recovery demonstrates that the recovery behavior of the material continues to degrade with repeated cycling. In that study, it is not clear whether the time variant viscous properties contributed to the change in the shape memory properties. Castro et al. [38] investigated the temperature dependent recovery behavior of a one-part epoxy-based SMP with a lower glass-transition temperature compared to Veriflex-E studied in the current paper. The one-part epoxy exhibited a faster recovery when deformed at a lower temperature and recovered at a higher temperature. Castro et al. concluded that stress relaxation modes may be active during the shape memory cycle, stating the need for further studies to investigate these viscous mechanisms. McClung et al. [22] investigated the shape memory fatigue effects on Veriflex-E and found that repeated shape memory cycles have a minimal effect on the shape fixity ability of the SMP (with fixity values of 99% for ten consecutive cycles). However, those repeated cycles did degrade the total recovery ability of the SMP (with recovery values dropping from 98% in the first cycle, to 92% in the tenth cycle).
In this study the experimental program is designed to explore the influence of loading rate effects, strain levels during relaxation, and temperatures during periods of stress relaxation, on the subsequent recovery behavior of the SMP. The loading, stress relaxation, unloading, and recovery is quantified using DIC.
4. Experimental Observations
4.1. “Rubbery” Loading and Unloading with Periods of Relaxation
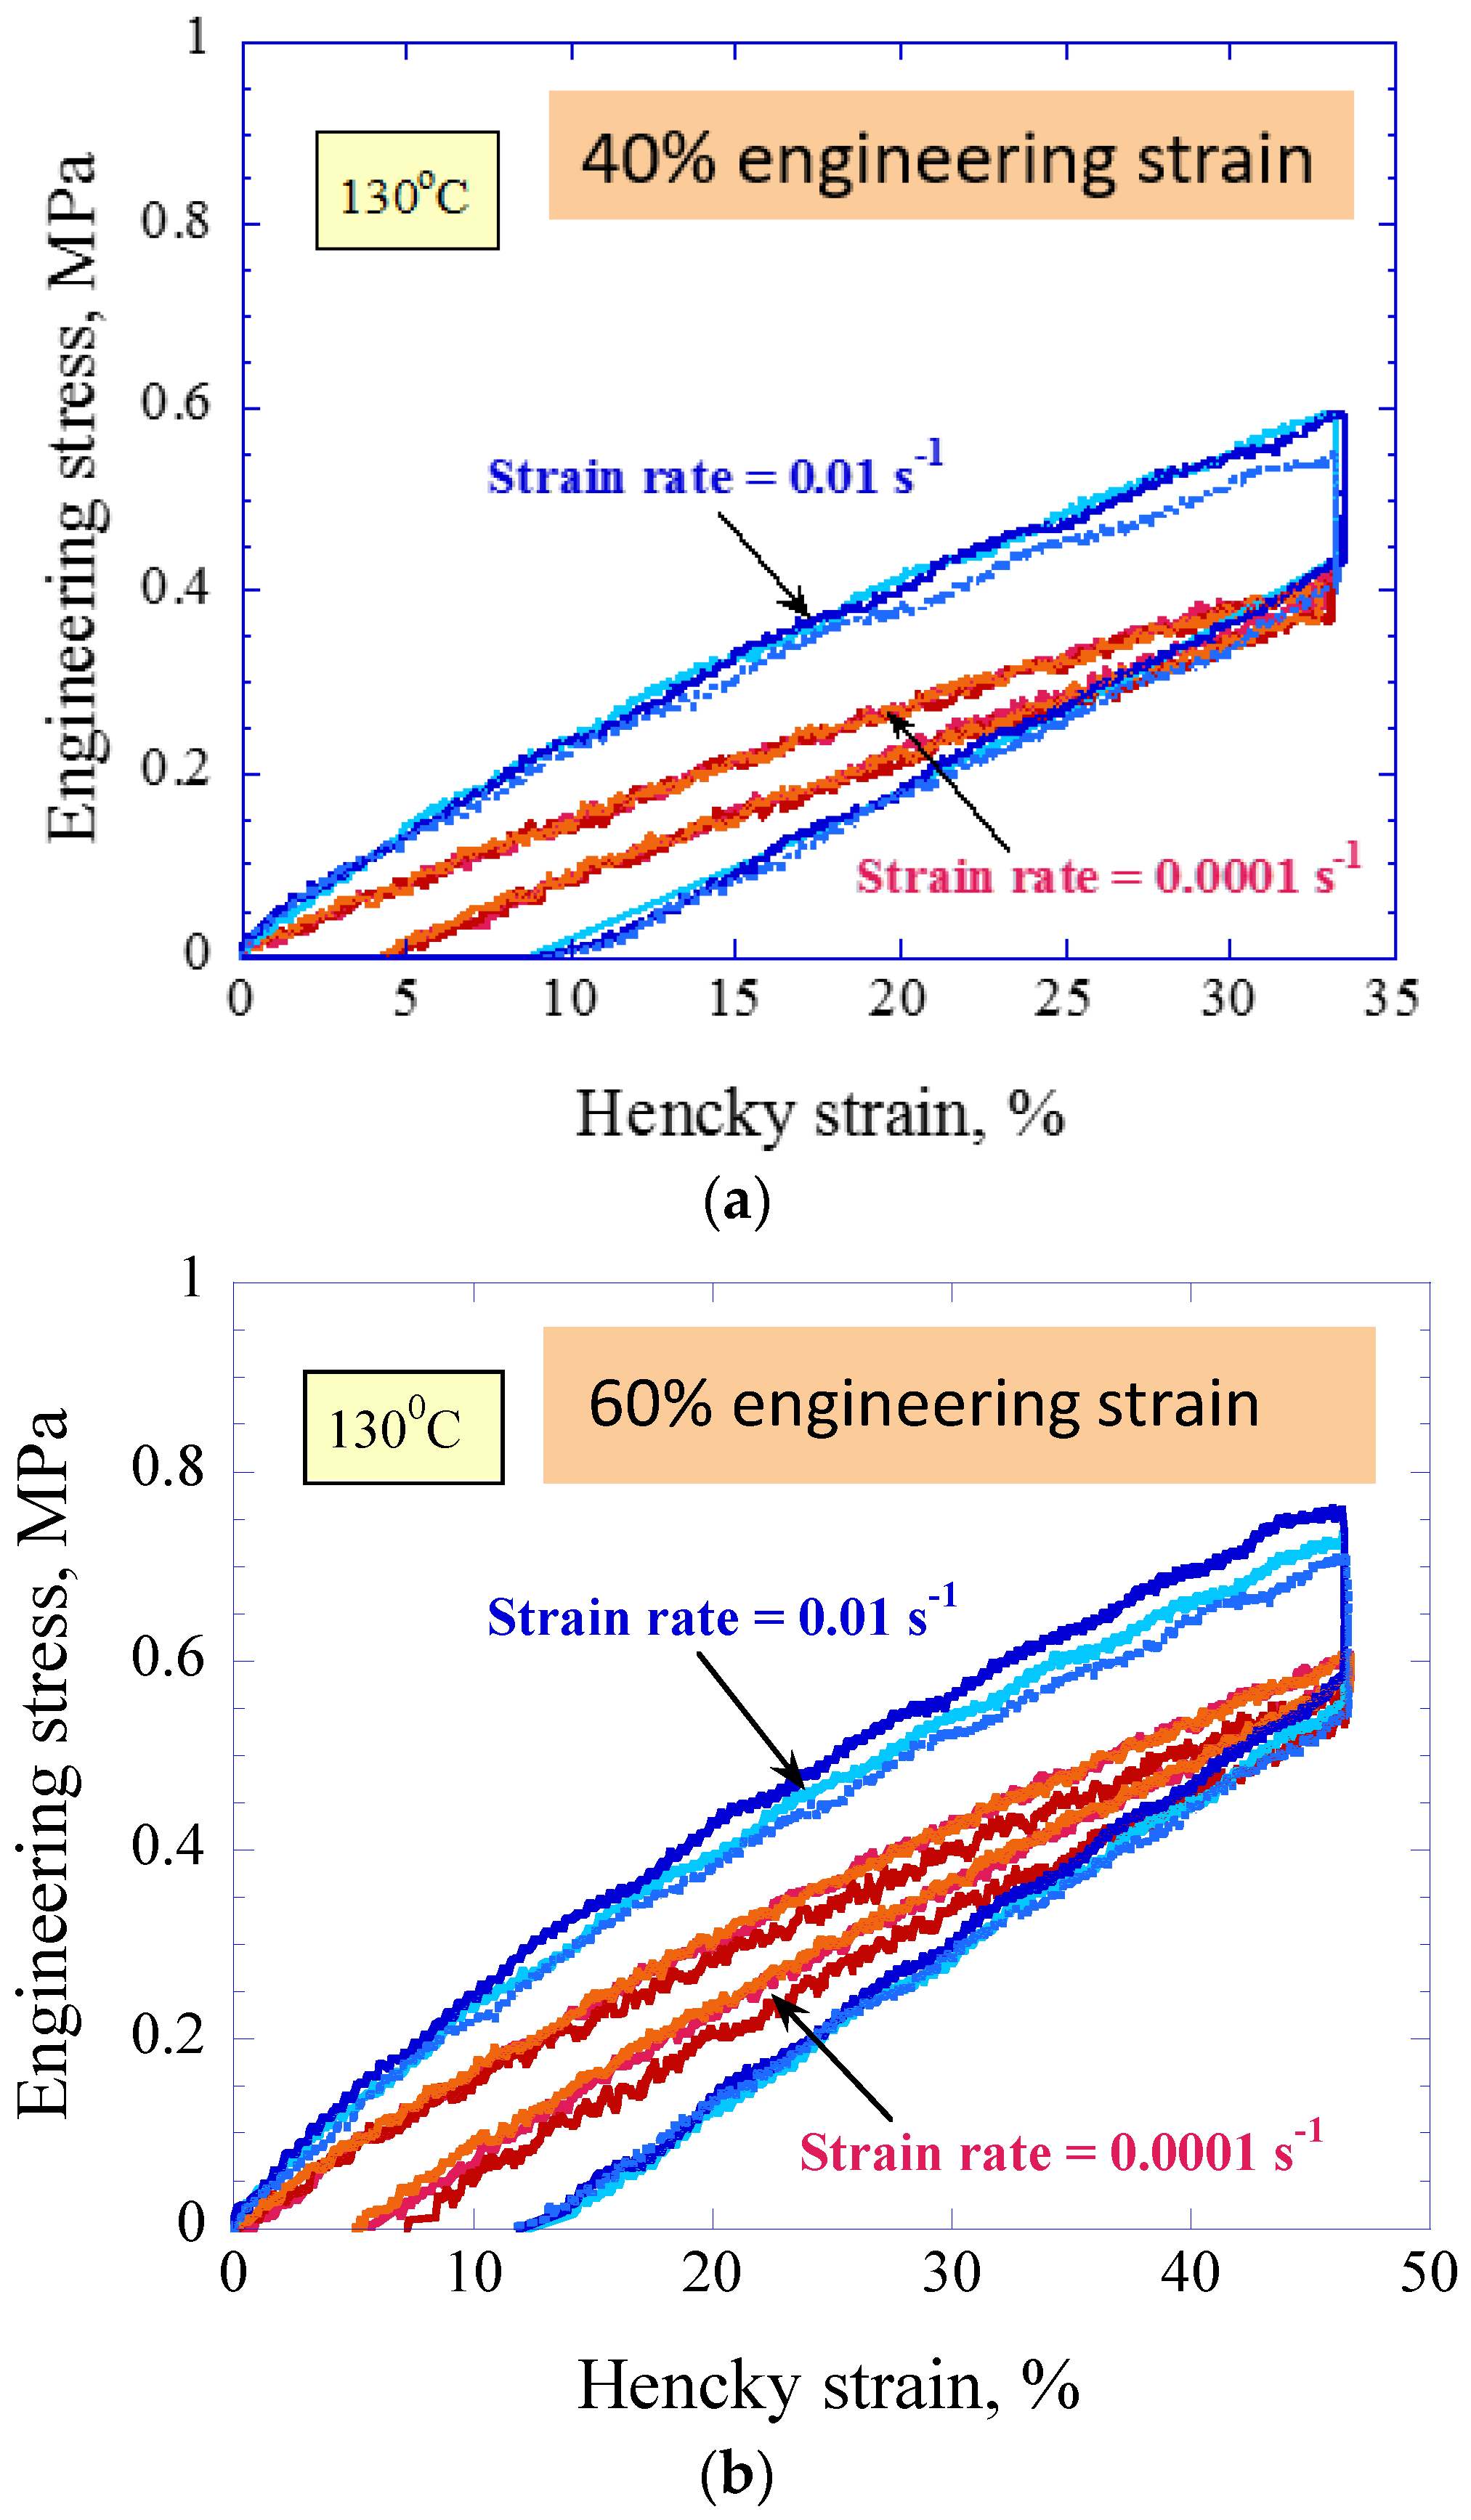
Veriflex-E was subjected to loading at a constant strain rate to a maximum strain (either 40% or 60%), was held at that strain for 1 h of relaxation, and was then unloaded at the same rate as loading. The stress-strain results at 130 °C are shown in Figure 3, at strain rates of 10−4 and 10−2 s−1 for three tests at both rates. The axial stress-strain curves exhibit an overall average quasi-elastic slope upon leaving the origin. The strain rate slightly affects the measured slope, with the average values being given in Table 1 (measured from 0 to 10% strain). The initial elastic modulus (or Young’s modulus) increases by 50%, with a 100-fold increase in strain rate. Consequently, the maximum stress attained at the end of the prescribed strain level is higher for the faster loading rate, for both strain levels. An elastic modulus was also calculated upon unloading after relaxation and is listed in Table 1. This modulus (measured from 40% to 30% strain following relaxation at 40% strain and from 60% to 50% strain following relaxation at 60% strain), is also observed to increase by ~40% with strain rate. In addition, these unloading moduli are smaller than the corresponding loading moduli at both rates. It is further noted that the accumulated inelastic strain is larger when unloading at a faster deformation rate, for both strain levels.
The plots of the stress drop during relaxation vs. relaxation time (Figure 4), at both 40% and 60% engineering strains, show that stress during relaxation is influenced by the prior strain rate. A larger decrease in stress is observed during relaxation following loading at 10−2 s−1, than during relaxation following loading at 10−4 s−1. However, the stress values attained at the end of the relaxation test are relatively independent of the deformation rate during loading. The majority of the stress decrease is observed to take place in the initial few minutes of holding. This change in stress during relaxation is quantified in Table 2. In contrast, the strain level at which the relaxation takes place does not create a significant difference in the change in stress during relaxation at 130 °C.
4.2. “Rubbery” Recovery Following Relaxation and Unloading
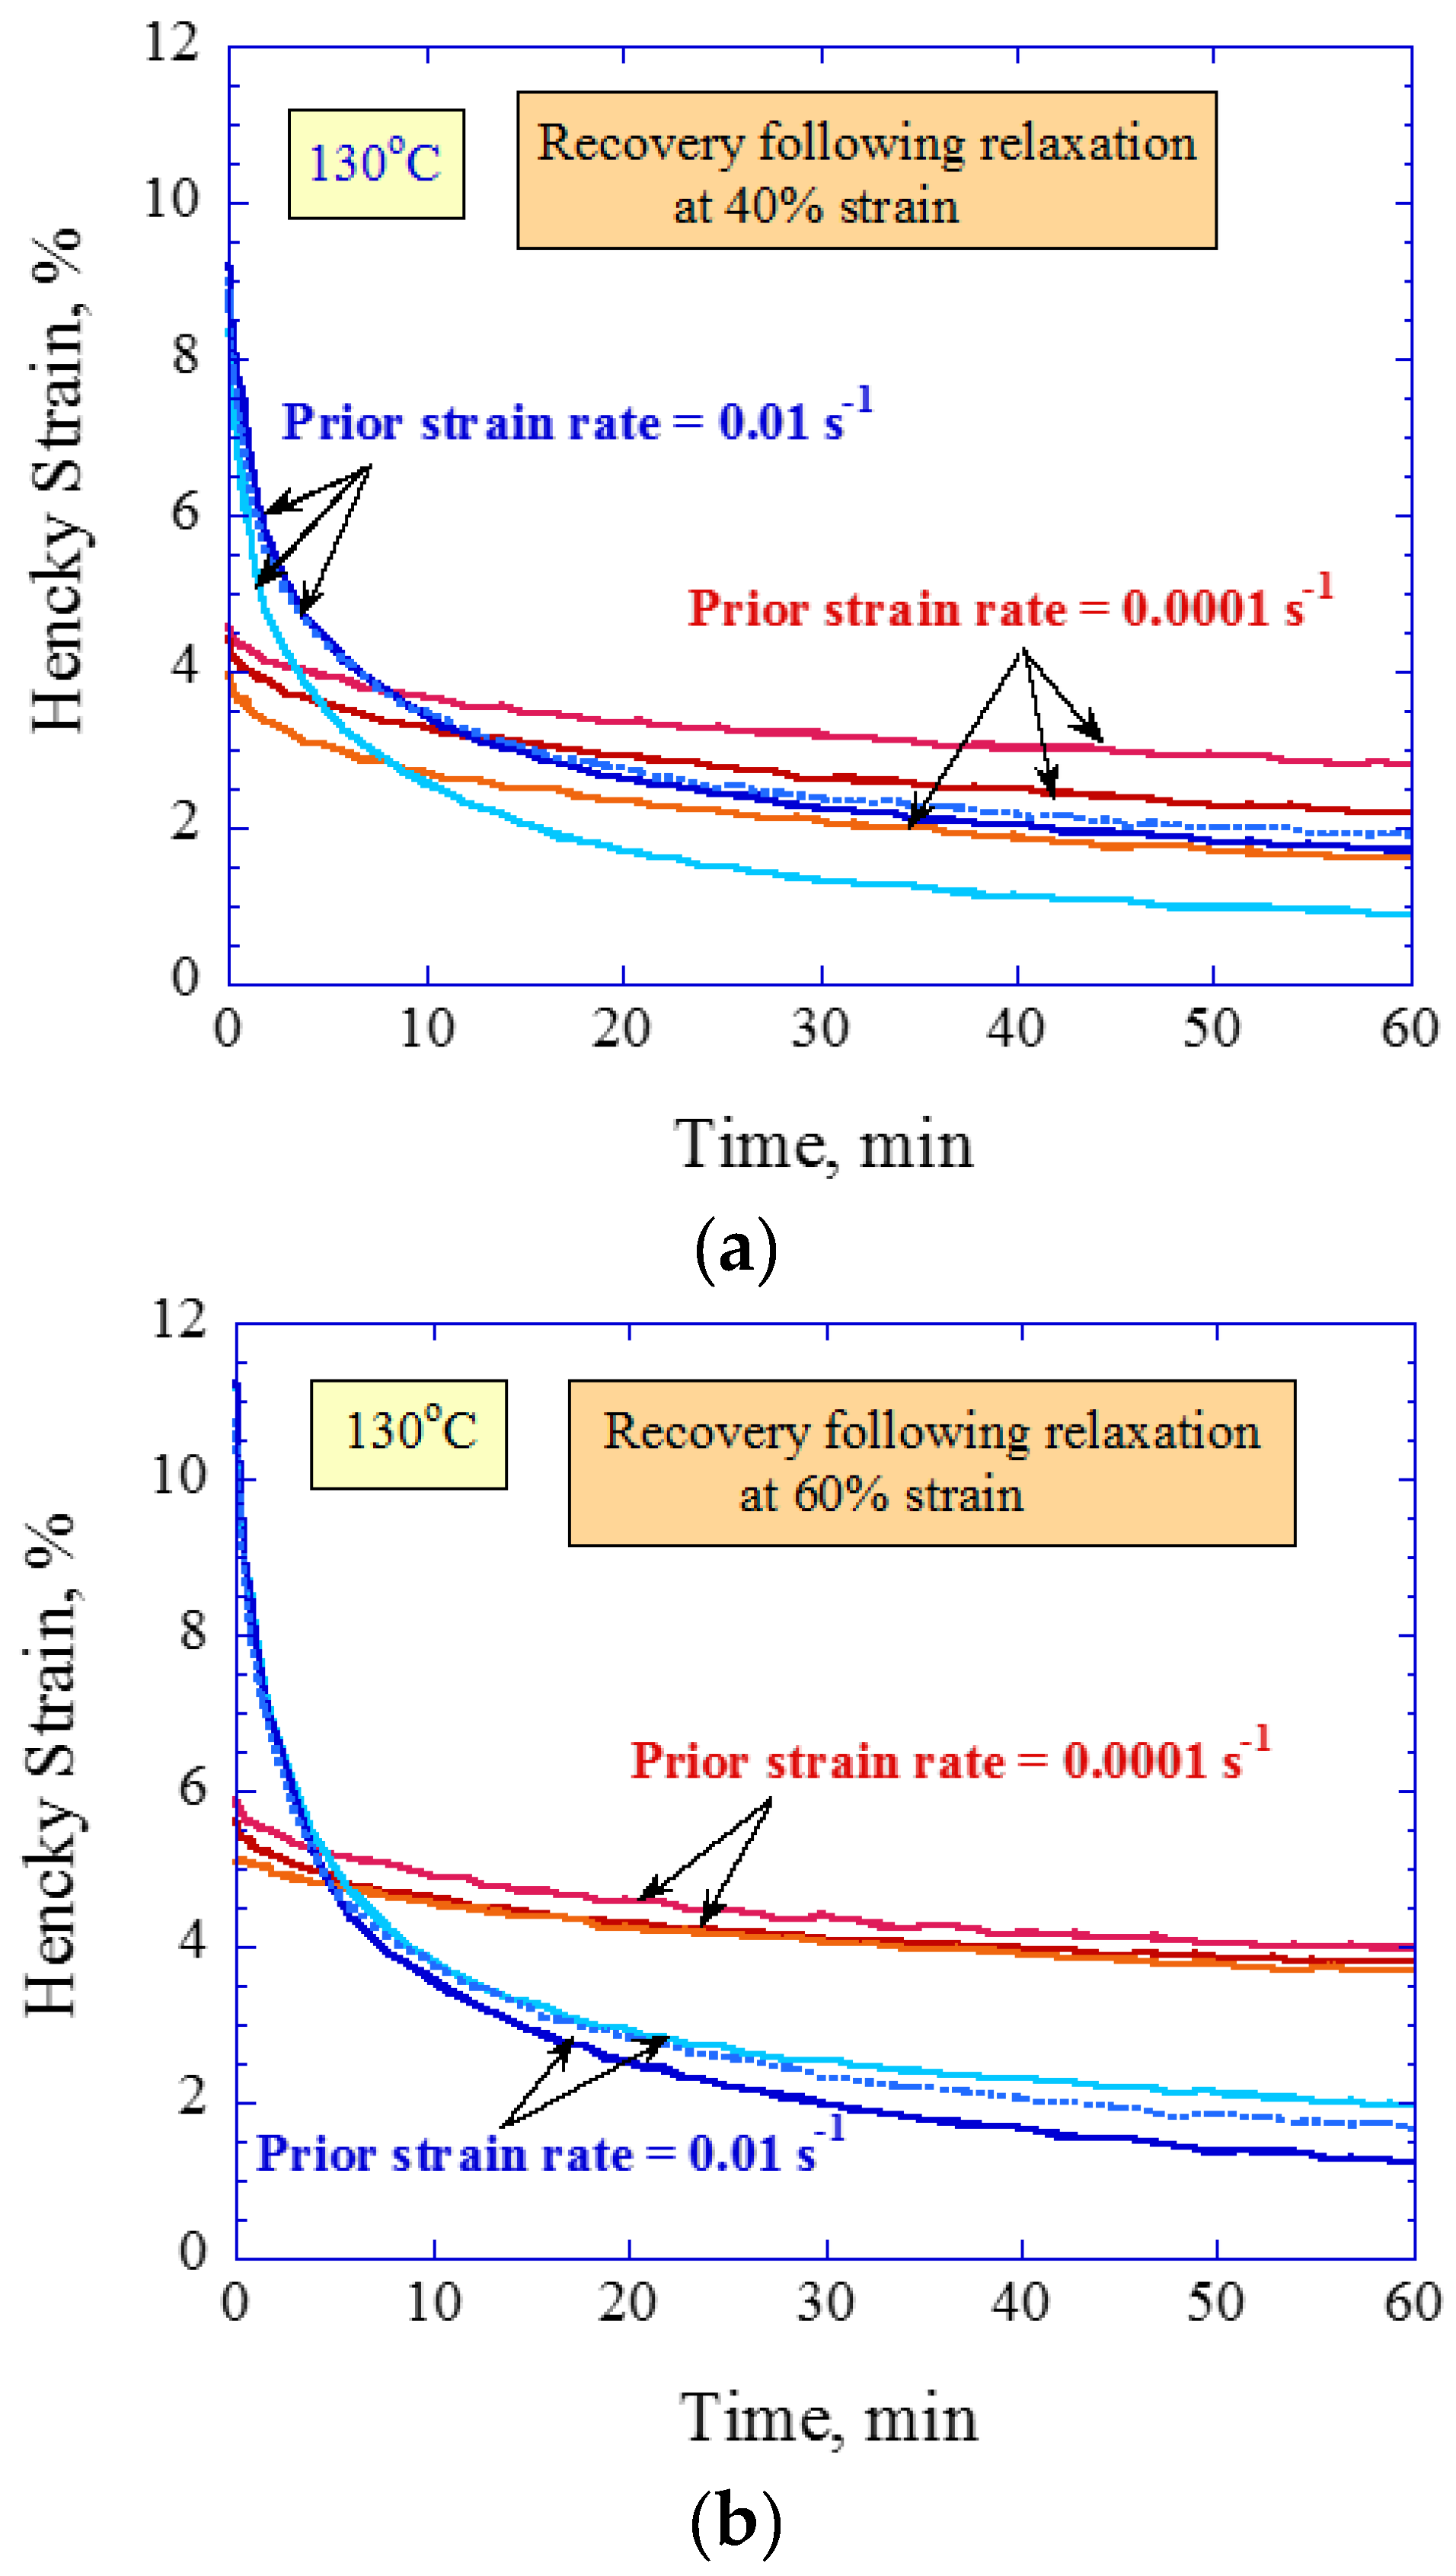
The results in Figure 3 show a positive inelastic strain immediately upon unloading to zero stress, which is quantified in Table 3. Following this unloading, the samples were held at zero stress and allowed to recover for 1 h, whilst the strain was continuously measured (with the laser extensometer). Results of the recovery tests are given in Figure 5. The accumulated strain during the recovery period decreases rapidly and most of the strain is recovered after ~10 min, for both prior strain rates. A significant influence of the prior strain rate on the recovery of strain is evident. Regardless of the relaxation level (40% vs. 60% strain), parts a and b of Figure 5 show the two prior strain rates create not only different magnitudes of inelastic strain upon unloading, but also a different shape in the inelastic strain during recovery. In the tests conducted with the strain rate magnitude of 10−2 s−1, the inelastic strain recovers rapidly, immediately following unloading, and then the recovery rate tapers toward zero after ~10 min of recovery. Conversely, in the tests conducted with slower strain rates, the inelastic strain recovers at a slow rate that decreases slightly with time.
Considering the near zero recovery rate for both cases, the full recovery of strain is unlikely in these tests. For the recovery following relaxation at a 60% strain (part b of Figure 5), the strain at the end of the recovery is noticeably smaller for the tests conducted at the faster prior strain rate. This is noteworthy when considering the higher level of inelastic strain that is present immediately upon unloading for that faster prior strain rate.
Table 3 provides a summary of the inelastic strains at the beginning and end of unloading recovery. As stated before, the recovery is not complete even after 60 min following the unloading and approximately 2%–6% of the imposed strain remains as residual strain.
4.3. “Glassy” Loading and Unloading with Periods of Relaxation
The stress-strain results at 25 °C are shown in Figure 6 at strain rates of 10−4 and 10−2 s−1 for three tests at both rates. In these tests, the Veriflex-E was loaded to 2% strain, held for 1 h of relaxation at that strain, and then unloaded at the same rate as loading. The axial stress-strain curves exhibit an overall average quasi-elastic slope upon leaving the origin. The strain rate slightly affects the measured slope (measured from 0 to 1% strain), with the average values being given in Table 1. The measured slope increases by ~17%, with a 100-fold increase in strain rate. An elastic modulus was also calculated upon unloading after relaxation and is listed in Table 1. This modulus (measured from 2% to 1% strain following relaxation at 2% strain) is also observed to increase by ~7% with strain rate. In addition, these moduli are smaller than the corresponding loading moduli at both rates.
The plots of the stress drop during relaxation vs. relaxation time (Figure 7) at a 2% engineering strain show that stress during relaxation is influenced by the prior strain rate. Similar to the rubbery case, a larger decrease in stress is observed in relaxation following loading at 10−2 s−1, than in relaxation following loading at 10−4 s−1. This change in stress during relaxation is also quantified in Table 2.
4.4. “Glassy” Recovery Following Relaxation and Unloading
The results in Figure 6 also show positive inelastic strain immediately upon unloading to zero stress. Following this unloading, the samples were held at zero stress and allowed to recover for 1 h, whilst the strain was continuously measured (with the laser extensometer). Results of the recovery tests are given in Figure 8. The strain rate during the recovery period decreases rapidly and most of the strain is recovered after ~10 min, for both prior strain rates. Only a slight influence of the prior strain rate on the recovery of strain is evident. Figure 8 shows that a larger percentage of inelastic strain is recovered in tests conducted with a higher prior strain rate magnitude. In the test conducted with the strain rate magnitude of 10−2 s−1, the inelastic strain measured upon unloading is almost fully recovered after 1 h. Conversely, in the tests conducted with slower strain rates, the inelastic strain was only partially recovered. Considering the near zero recovery rate, the full recovery of strain is unlikely in this test. Table 3 also lists the residual strain following unloading recovery for the room temperature tests.
4.5. Loading and Unloading with Periods of Cooling during Relaxation (Shape Memory Cycles)
When reporting shape memory cycle results, painstaking detail is always required in stating the experimental details used in that specific study. In this paper, the details are given from the results reported in [22], using the SMP resin Veriflex-E.
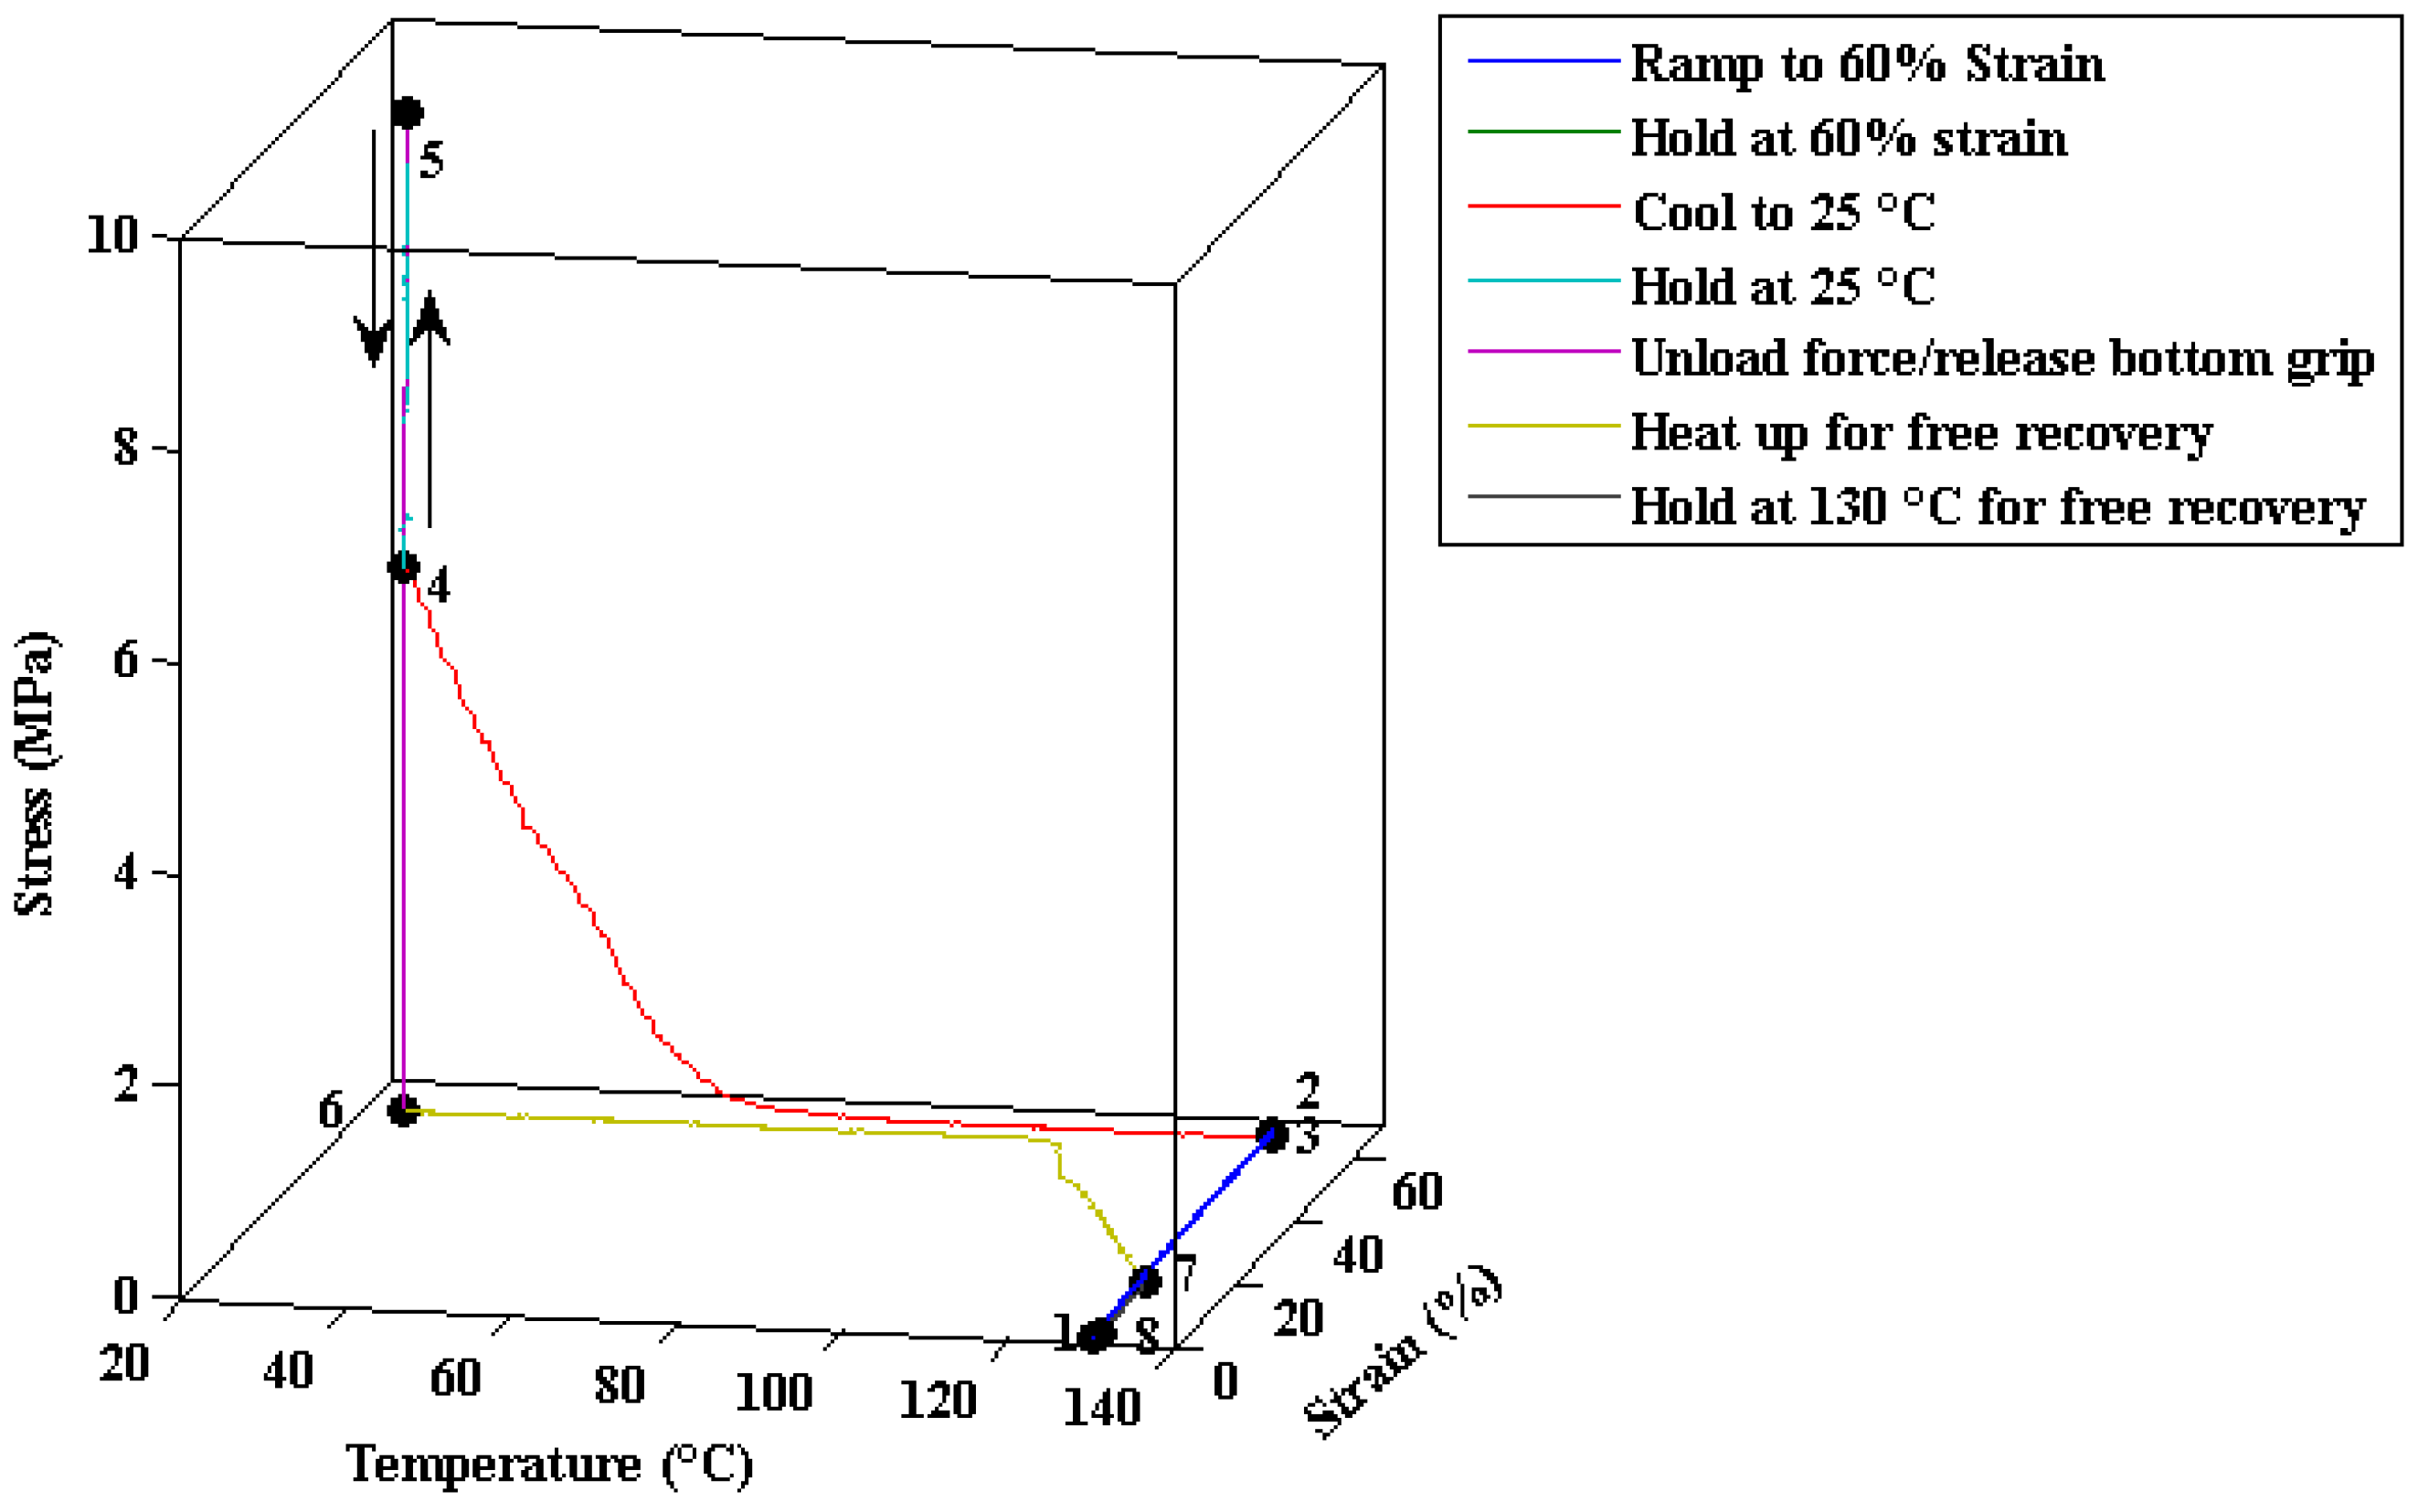
The shape memory cycle used in this study is illustrated in Figure 2 and is conducted in the MTS tensile load frame. The shape memory cycle begins with heating the sample from 25 °C to 130 °C (from A1 to B) at 2.5 °C/min, followed by a 60 min soak time at 130 °C. The sample is then deformed in actuator displacement control (from B to C), at a rate of 0.5 mm/min, until the sample is strained to 60% (measured by the laser extensometer). At this point, the control mode is instantaneously switched to laser displacement control, and the sample is held at a constant 60% strain for a hold time of 60 min. Next, the sample is cooled at 2.5 °C/min to 25 °C (from C to D), while the strain is still held constant at 60%, after which the sample is held (at constant temperature and strain) for 60 min to ensure thermal equilibrium in the sample. After this thermal hold, the mechanical load is removed from the sample at a ramp rate of 50 mm/min (from D to E). (The rate of unloading is kept the same in all tests in order to keep the total cycle time within experimental feasibility.) Once the force on the sample is released, the bottom grip is released from the sample, and free recovery is conducted on the sample while it is still mechanically held in the top grip, to enable continued strain measurements with the laser extensometer. The free recovery consists of heating the sample (again at 2.5 °C/min) to 130 °C (from E to F), holding the temperature for 60 min, cooling the sample to 25 °C (at 2.5 °C/min from F to A2), and finally holding the sample at 25 °C for 60 min to ensure thermal equilibrium. This procedure is also laid out step-by-step in Table 4.
The baseline shape memory cycle was conducted at a displacement rate of 0.5 mm/min, with a hold time of 60 min to closely match the relaxation recovery results in the previous section. The temperature, strain, and stress are plotted in Figure 9. For more detail on the baseline shape memory behavior see [22].
4.6. Recovery During Shape Memory Cycle
To compare the shape memory cycle recovery to the relaxation/recovery without a shape fixing in the cycle, the strain at the end of a 60 min recovery period was evaluated in Table 5.
This strain serves as a measure of the recovery ability of the material. The recovery following a shape memory cycle falls nearer to the low temperature recovery following stress relaxation, than the high temperature. It is interesting that the high temperature recovery following relaxation is not as complete as its low temperature counterpart. If we measure this recovery ability using the established Total Strain Recovery, Rr,tot, we see a similar conclusion. The recovery behavior following a shape memory cycle is near that of stress relaxation at a low temperature. The more complete recovery in the shape memory cycle is surprising.
5. Discussion
This work has focused on quantifying the dependence of the SMP response to varying temperatures, deformation rates, and relaxation strains, during periods of stress relation and subsequent recovery. This quantification is needed for accurate constitutive model development. The strain at the end of the relaxation period is larger at the faster rate of loading. Further, larger strain recovery is observed in specimens that are loaded and subsequently unloaded at the faster strain rate. Thus, the less time the material is given for configurational changes to take place at an elevated temperature (a faster rate deformation takes less time), the less resistance the material produces against locking in the strain and the better the subsequent total strain recovery.
Unexpectedly, the total strain recovery at the end of a shape memory cycle more closely emulates the recovery following deformation at a low temperature than at a high temperature. Our hypothesis is that the recovery of this SMP is more complete when the deformation rates at high temperatures are faster, since the shape memory cycle was conducted with a slightly higher deformation rate than the stress relaxation utilized. Future work will endeavor to test this hypothesis.
In this paper, the authors have successfully quantified the dependence of the SMP on the loading rate, hold strain, and temperature using DIC. The results presented in this work clearly show that the SMP material behavior is a strong function of both the test temperature and the deformation rate. The dependence on deformation rate highlights the weakness in the common practice of quantifying SMP performance using only shape fixity and shape recovery ratios. Those ratios can vary greatly for a single SMP, simply by varying the deformation rate. The results presented in this work clearly show that the material behavior is a strong function of both the loading rate and the test temperature. This information and further scientific investigation into the loading rate effect vs temperature effects is required, in order to establish the design space for the SMP resin, and to optimize its properties and performance for a given application. Future modeling plans that will directly benefit from the experimental quantification presented here include thermoviscoelastic solids approaches, phase evolution models, and the borrowing of non-Newtonian fluid flow models.
Acknowledgments
The experimental work reported and analyzed in this publication was performed while the primary author held a National Research Council Research Associateship Award at the Air Force Research Laboratory.
Author Contributions
Amber J.W. McClung, Gyaneshwar P. Tandon and Jeffery W. Baur conceived the experiments; Amber J.W. McClung and Gyaneshwar P. Tandon designed the experiments; Amber J.W. McClung performed the experiments; Amber J.W. McClung, Gyaneshwar P. Tandon and Jeffery W. Baur analyzed the data; Amber J.W. McClung, Gyaneshwar P. Tandon and Jeffery W. Baur contributed reagents/materials/analysis tools; Amber J.W. McClung, Gyaneshwar P. Tandon and Jeffery W. Baur wrote the paper.
Conflicts of Interest
Declare conflicts of interest or state “The authors declare no conflict of interest.” “The founding sponsors had no role in the design of the study; in the collection, analyses, or interpretation of data; in the writing of the manuscript, and in the decision to publish the results”.
References
- Shakinpoor, M.; Schneider, H.J. (Eds.) Intelligent Materials; RSC Publishing: Cambridge, UK, 2008. [Google Scholar]
- Tandon, G.P.; McClung, A.J.W.; Baur, J.W. Shape-Memory Polymers for Aerospace Applications: Novel Synthesis, Modeling, Characterization and Design; DEStech: Lancaster, PA, USA, 2016. [Google Scholar]
- Everhart, J.J.; Havens, D.E.; Hanson, S.F.; Priest, J.W.; Fiegenbaum, C.R.; Barnell, T.J. Reconfigurable Shape Memory Polymer Tooling Supports. U.S. Patent US8608890 B2, 17 December 2013. [Google Scholar]
- Bordonaro, C.M.; Krempl, E. Effects of strain rate on the deformation and relaxation behavior of 6/6 nylon at room temperature. Polym. Eng. Sci. 1992, 32, 1066–1072. [Google Scholar] [CrossRef]
- Kitagawa, M.; Matsutani, T. Effect of time and temperature on nonlinear constitutive equation in polypropylene. J. Mater. Sci. 1988, 23, 4085–4090. [Google Scholar] [CrossRef]
- Zhang, C.; Morre, I.D. Nonlinear mechanical response of high density polyethylene. Part I. Experimental investigation and model evaluation. Polym. Eng. Sci. 1997, 37, 404–413. [Google Scholar] [CrossRef]
- McClung, A.J.W.; Ruggles-Wrenn, M.B. The Rate (Time)-Dependent Mechanical Behavior of the PMR-15 Thermoset Polymer at Elevated Temperature. Polym. Test. 2008, 27, 908–914. [Google Scholar] [CrossRef]
- Ruggles-Wrenn, M.; Balaconis, J. Some aspects of the mechanical response of BMI 5250-4 neat resin at 191 °C: Experiement and modeling. J. Appl. Polym. Sci. 2008, 107, 1378–1386. [Google Scholar] [CrossRef]
- Song, B.; Chen, W.; Chen, M. Novel model for unaxial strain-rate-dependent stress-strain behavior of ethylene-propylene-diene monomer rubber in compression or tension. J. Appl. Polym Sci. 2004, 92, 1553–1558. [Google Scholar] [CrossRef]
- Yi, J.; Boyce, M.; Lee, G.; Balizer, E. Large deformation rate-dependent stress-strain behavior of polyurea and polyurethanes. Polymer 2006, 47, 319–329. [Google Scholar]
- MTS Systems Corporation. 632.53 High-Temperature Axial Extensometer Data Sheet. 2013. Available online: http://www.mts.com/ucm/groups/public/documents/library/dev_003704.pdf (accessed on 9 September 2013).
- Atli, B.; Gandhi, G.; Karst, G. Thermomechanical characterization of shape memory polymers. J. Intell. Mater. Syst. Struct. 2009, 20, 87–95. [Google Scholar]
- Volk, B.L.; Lagoudas, D.C.; Chen, Y.C. Thermomechanical characterization of the nonlinear, rate dependent response of shape memory polymers. SPIE Proc. 2008, 6929. [Google Scholar] [CrossRef]
- Abrahamson, E.R.; Lake, M.S.; Munshi, N.A.; Gall, K. Shape memory mechanics of an elastic memory composite resin. J. Intell. Mater. Syst. Struct. 2003, 14, 623–632. [Google Scholar] [CrossRef]
- McKnight, G.; Doty, R.; Herrera, G.; Henry, C. Elastic Modulus and Strain recovery testing of variable stiffness composites for structural reconfiguration applications. SPIE Proc. 2007. [Google Scholar] [CrossRef]
- Beblo, R.; Gross, K.; Weiland, L.M. Mechanical and curing properties of a styrene-based shape memory polymer. J. Intell. Mater. Syst. Struct. 2010, 21, 677–683. [Google Scholar] [CrossRef]
- McClung, A.J.W.; Tandon, G.P.; Baur, J.B. Non-Contact Technique for Characterizing Full-Field Surface Deformation of Shape Memory Polymers at Elevated and Room Temperatures. Polym. Test. 2011, 30, 140–149. [Google Scholar] [CrossRef]
- McClung, A.J.W.; Tandon, G.P.; Baur, J.W. Strain Rate- and Temperature-Dependent Tensile Properties of an Epoxy-Based, Thermosetting, Shape Memory Polymer (Veriflex-E). Mech. Time-Depend. Mater. 2012, 16, 205–221. [Google Scholar] [CrossRef]
- Sutton, M.A.; Orteu, J.J.; Schreier, H.W. Image Correlation for Shape, Motion and Deformation Measurements; Springer: Berlin, Germany, 2009. [Google Scholar]
- McClung, A.; Tandon, G.P.; Foster, D.C.; Baur, J. Influence of Post-cure and Repeated Cycling on Thermomechanical Characterization of Shape Memory Polymers and Composites. In Proceedings of the Society for the Advancement of Material and Process Engineering, Seattle, WA, USA, 17–20 May 2010. [Google Scholar]
- Sakai, T.; Tao, T.; Somiya, S. Estimation of creep and recovery behavior of a shape memory polymer. Mech. Time-Depend. Mater. 2015, 19, 569–5779. [Google Scholar] [CrossRef]
- McClung, A.J.W.; Tandon, G.P.; Baur, J.W. Deformation Rate-, Hold Time-, and Cycle-Dependent Shape Memory Performance of Veriflex-E Resin. Mech. Time-Depend. Mater. 2013, 17, 39–52. [Google Scholar]
- Lei, M.; Yu, K.; Lu, H.; Qi, H.J. Influence of structural relaxation on thermomechanical and shape memory performances of amorphous polymers. Polymer 2017, 109, 216–228. [Google Scholar] [CrossRef]
- Park, H.; Harrison, P.; Guo, Z.; Lee, M.G.; Yu, W.R. Three-dimensional constitutive model for shape memory polymers using multiplicative decomposition of the deformation gradient and shape memory strians. Mech. Mater. 2016, 93, 43–62. [Google Scholar] [CrossRef]
- Yu, K.; McClung, A.J.W.; Tandon, G.P.; Baur, J.W.; Qi, H.J. A thermomechanical constitutive model for an epoxy based shape memory polymer and its parameter identification. Mech. Time-Depend. Mater. 2014, 18, 453–474. [Google Scholar] [CrossRef]
- Yang, Q.; Li, G. Temperature and rate dependent thermomechanical modeling os shape memory polymers with physics based evolution law. Int. J. Plast. 2016, 80, 168–186. [Google Scholar] [CrossRef]
- Rogovoi, A.A.; Stolbova, O.S. Modeling Thermomechanical Processes in Shape Memory Polymers under Finite Deformations. J. Appl. Mech. Tech. Phys. 2015, 56, 1059–1070. [Google Scholar] [CrossRef]
- Lendlein, A.; Kelch, S. Shape-Memory Polymers. Angew. Chem. Int. Ed. 2002, 41, 2035–2057. [Google Scholar] [CrossRef]
- Liu, C.; Qin, H.; Mather, P.T. Review of Progress in Shape-Memory Polymers. J. Mater. Chem. 2007, 17, 1543–1558. [Google Scholar] [CrossRef]
- Meng, H.; Li, G. A review of stimuli-responsive shape memory polymer composites. Polymer 2013, 54, 2199–2221. [Google Scholar] [CrossRef]
- Zhao, Q.; Qi, H.J.; Xie, T. Recent progress in shape memory polymer: New behavior, enabling materials, and mechanistic understanding. Prog. Polym. Sci. 2015, 49–50, 79. [Google Scholar] [CrossRef]
- Tobushi, H.; Hara, H.; Yamada, E.; Hayashi, S. Thermomechanical Properties in a Thin Film of Shape Memory Polymer of Polyurethane Series. Smart Mater. Struct. 1996, 5, 483–491. [Google Scholar] [CrossRef]
- Ohki, T.; Ni, Q.Q.; Ohsako, N.; Iwamoto, M. Mechanical and Shape Memory Behavior of Composites with Shape Memory Polymer. Compos. Part A 2004, 35, 1065–1073. [Google Scholar] [CrossRef]
- Feldkamp, D.M.; Rousseau, I.A. Effect of the Deformation Temperature on the Shape-Memory Behavior of Epoxy Networks. Macromol. Mater. Eng. 2010, 295, 726–734. [Google Scholar] [CrossRef]
- Rousseau, I.A.; Xie, T. Shape Memory Epoxy: Composition, Structure, Properties and Shape Memory Performances. J. Mater. Chem. 2010, 20, 3431–3441. [Google Scholar]
- Baer, G.; Wilson, T.S.; Matthews, D.L.; Maitland, D.J. Shape-Memory Behavior of Thermally Stimulated Polyurethane for Medical Applications. J. Appl. Polym. Sci. 2007, 103, 3882–3892. [Google Scholar] [CrossRef]
- Schmidt, C.; Neuking, K.; Eggeler, G. Functional Fatigue of Shape Memory Polymers. Adv. Eng. Mater. 2008, 10, 922–927. [Google Scholar] [CrossRef]
- Castro, F.; Westbrook, K.F.; Hermiller, J.; Ahn, D.U.; Ding, Y.; Qi, H.J. Time and Temperature Dependent Recovery of Epoxy-Based Shape Memory Polymers. J. Eng. Mater. Technol. 2011, 133, 2. [Google Scholar] [CrossRef]
- McClung, A.J.W.; Tandon, G.P.; Baur, J.W. Relaxation and Recovery Behavior of an Epoxy Based Shape Memory Polymer Resin; Society for Experimental Mechanics ( SEM ) Proceedings: Costa Mesa, CA, USA, 2012. [Google Scholar]
Figure 1.
Schematic of a stress relaxation test, followed by a period of recovery.

Figure 2.
Schematic of shape memory cycle with free recovery for heat activated SMPs.

Figure 3.
SMP stress vs. strain in "rubbery" state during periods of loading, relaxation at (a) 40% and (b) 60% engineering strain, and unloading to zero stress [39].
Figure 3.
SMP stress vs. strain in "rubbery" state during periods of loading, relaxation at (a) 40% and (b) 60% engineering strain, and unloading to zero stress [39].

Figure 4.
SMP change in engineering stress vs. relaxation time at (a) 40% and (b) 60% engineering strain in the “rubbery” state.
Figure 4.
SMP change in engineering stress vs. relaxation time at (a) 40% and (b) 60% engineering strain in the “rubbery” state.
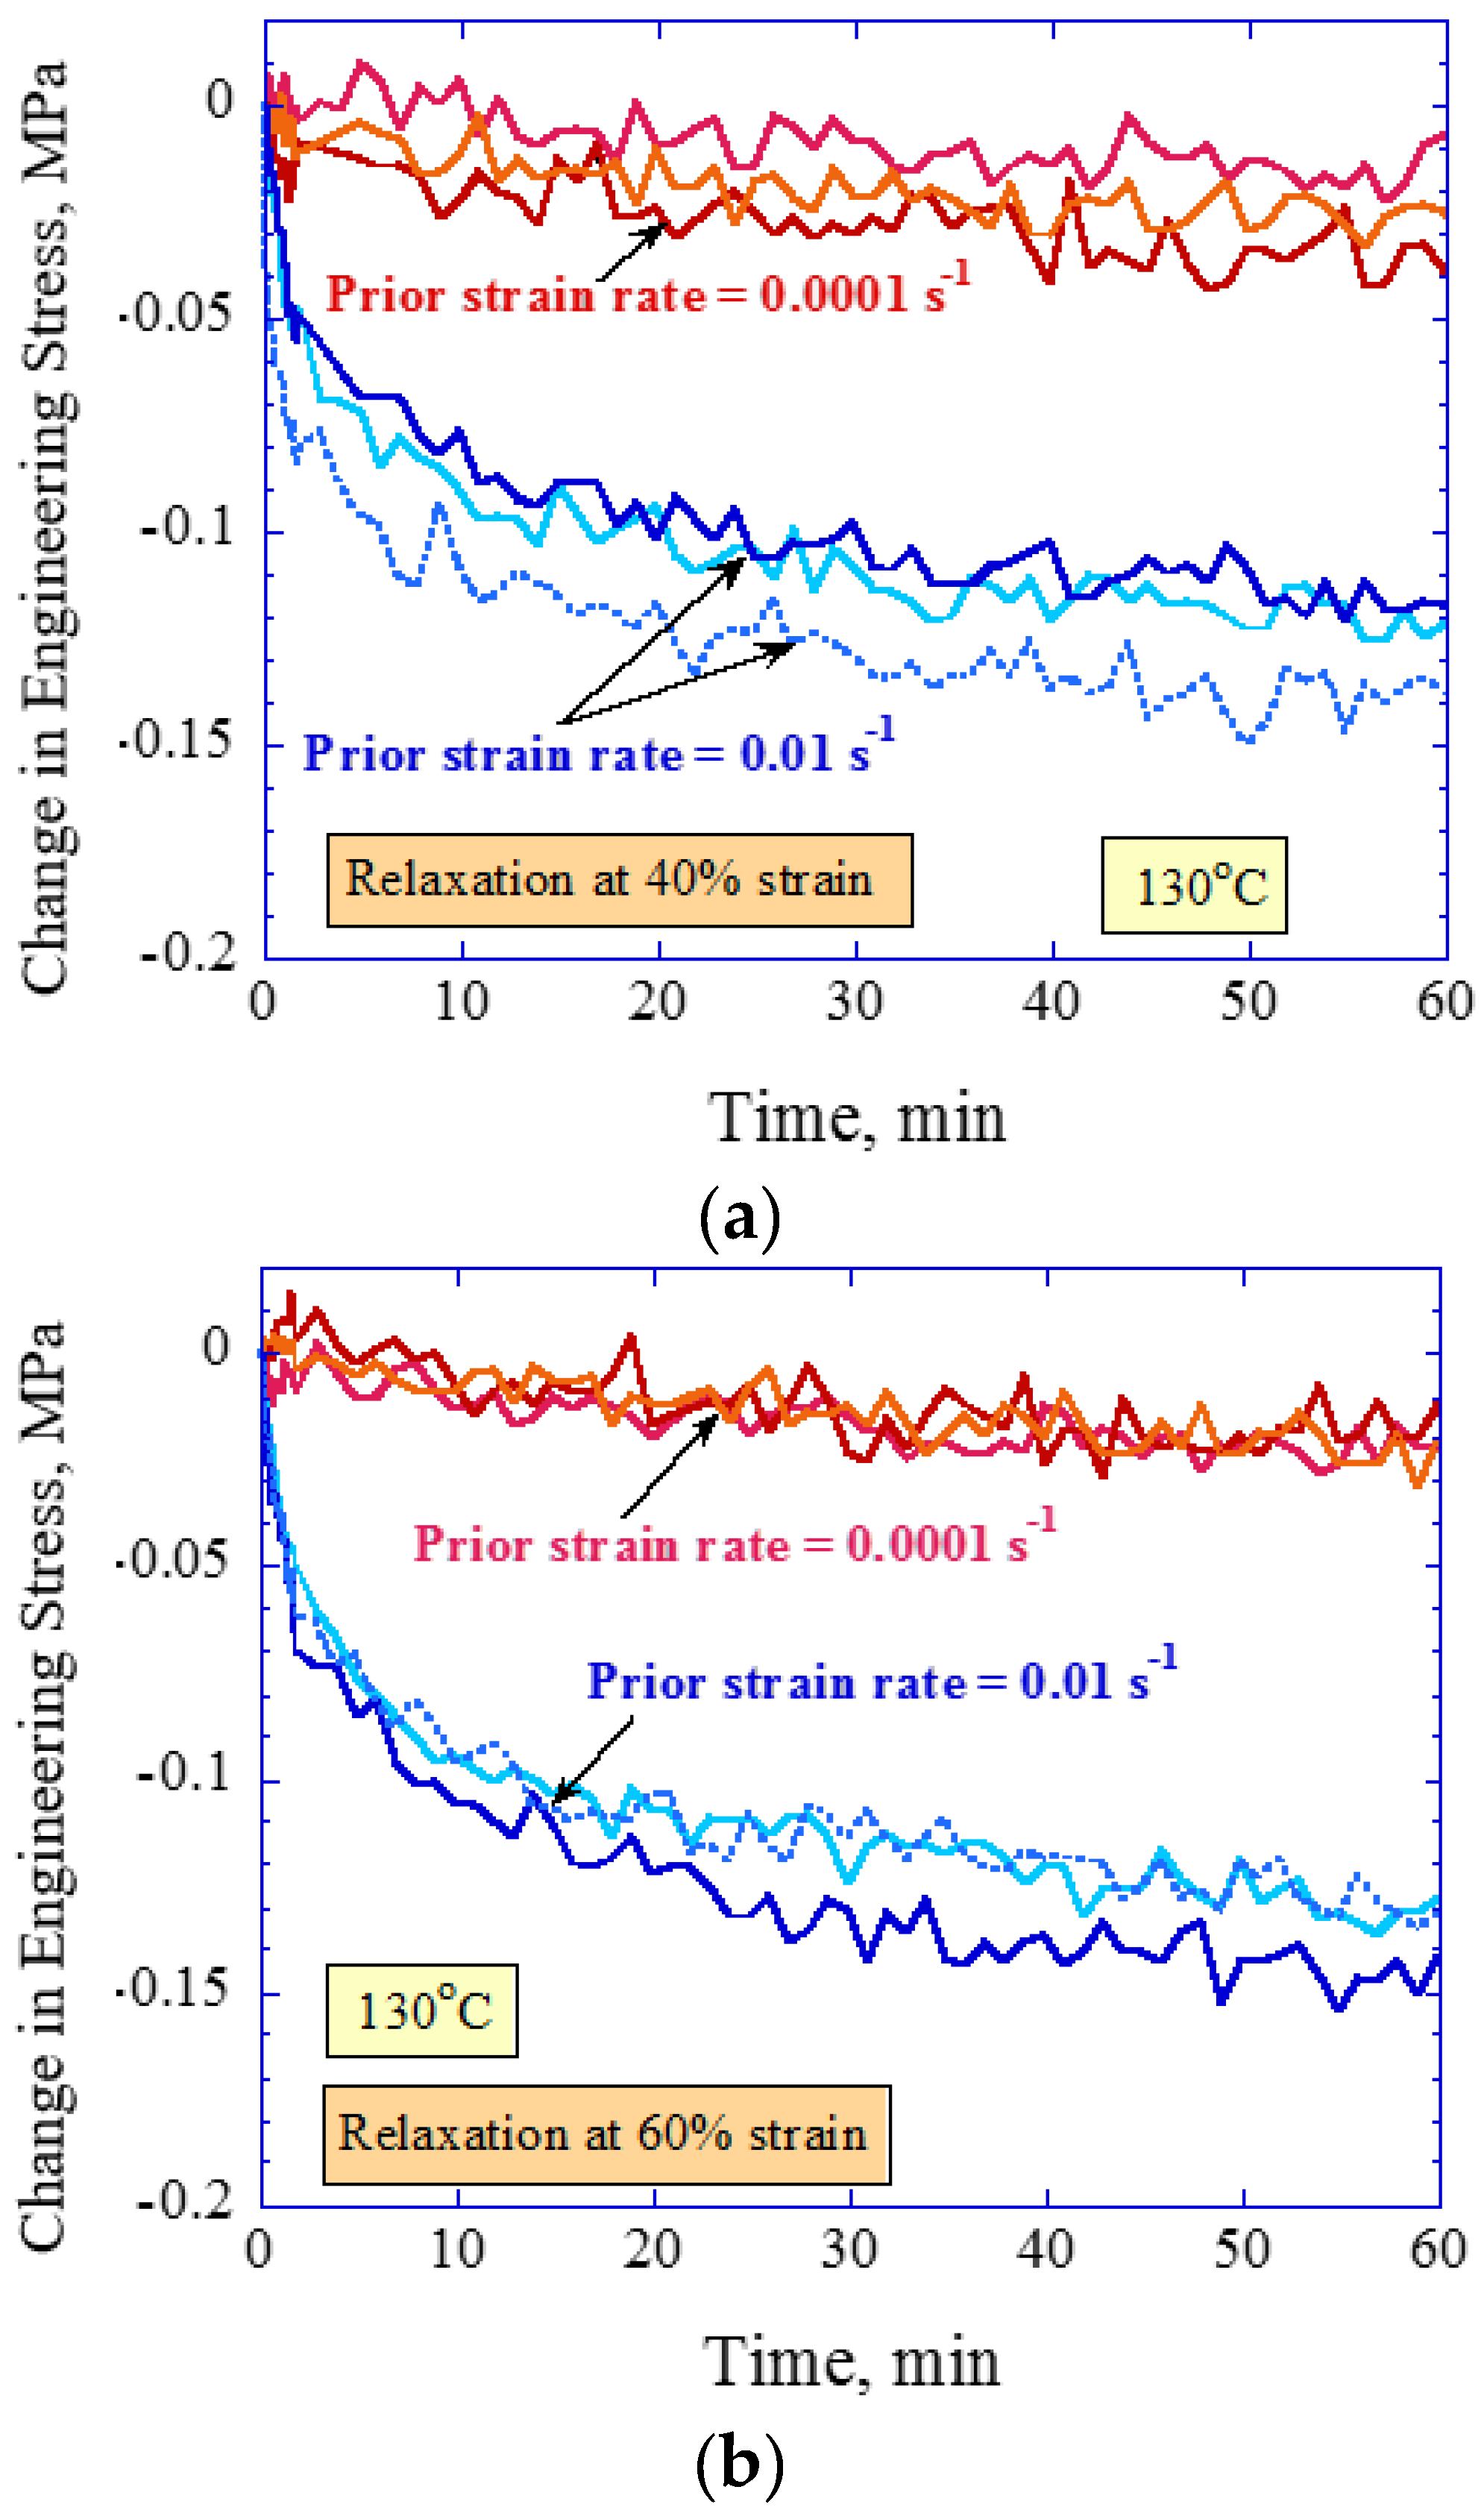
Figure 5.
SMP recovery of strain following load, relaxation at (a) 60% strain and (b) 40% strain and unload in “rubbery” state.
Figure 5.
SMP recovery of strain following load, relaxation at (a) 60% strain and (b) 40% strain and unload in “rubbery” state.

Figure 6.
SMP stress vs. strain in “glassy” state during periods of loading, relaxation at 2% engineering strain, and unloading to zero stress.
Figure 6.
SMP stress vs. strain in “glassy” state during periods of loading, relaxation at 2% engineering strain, and unloading to zero stress.
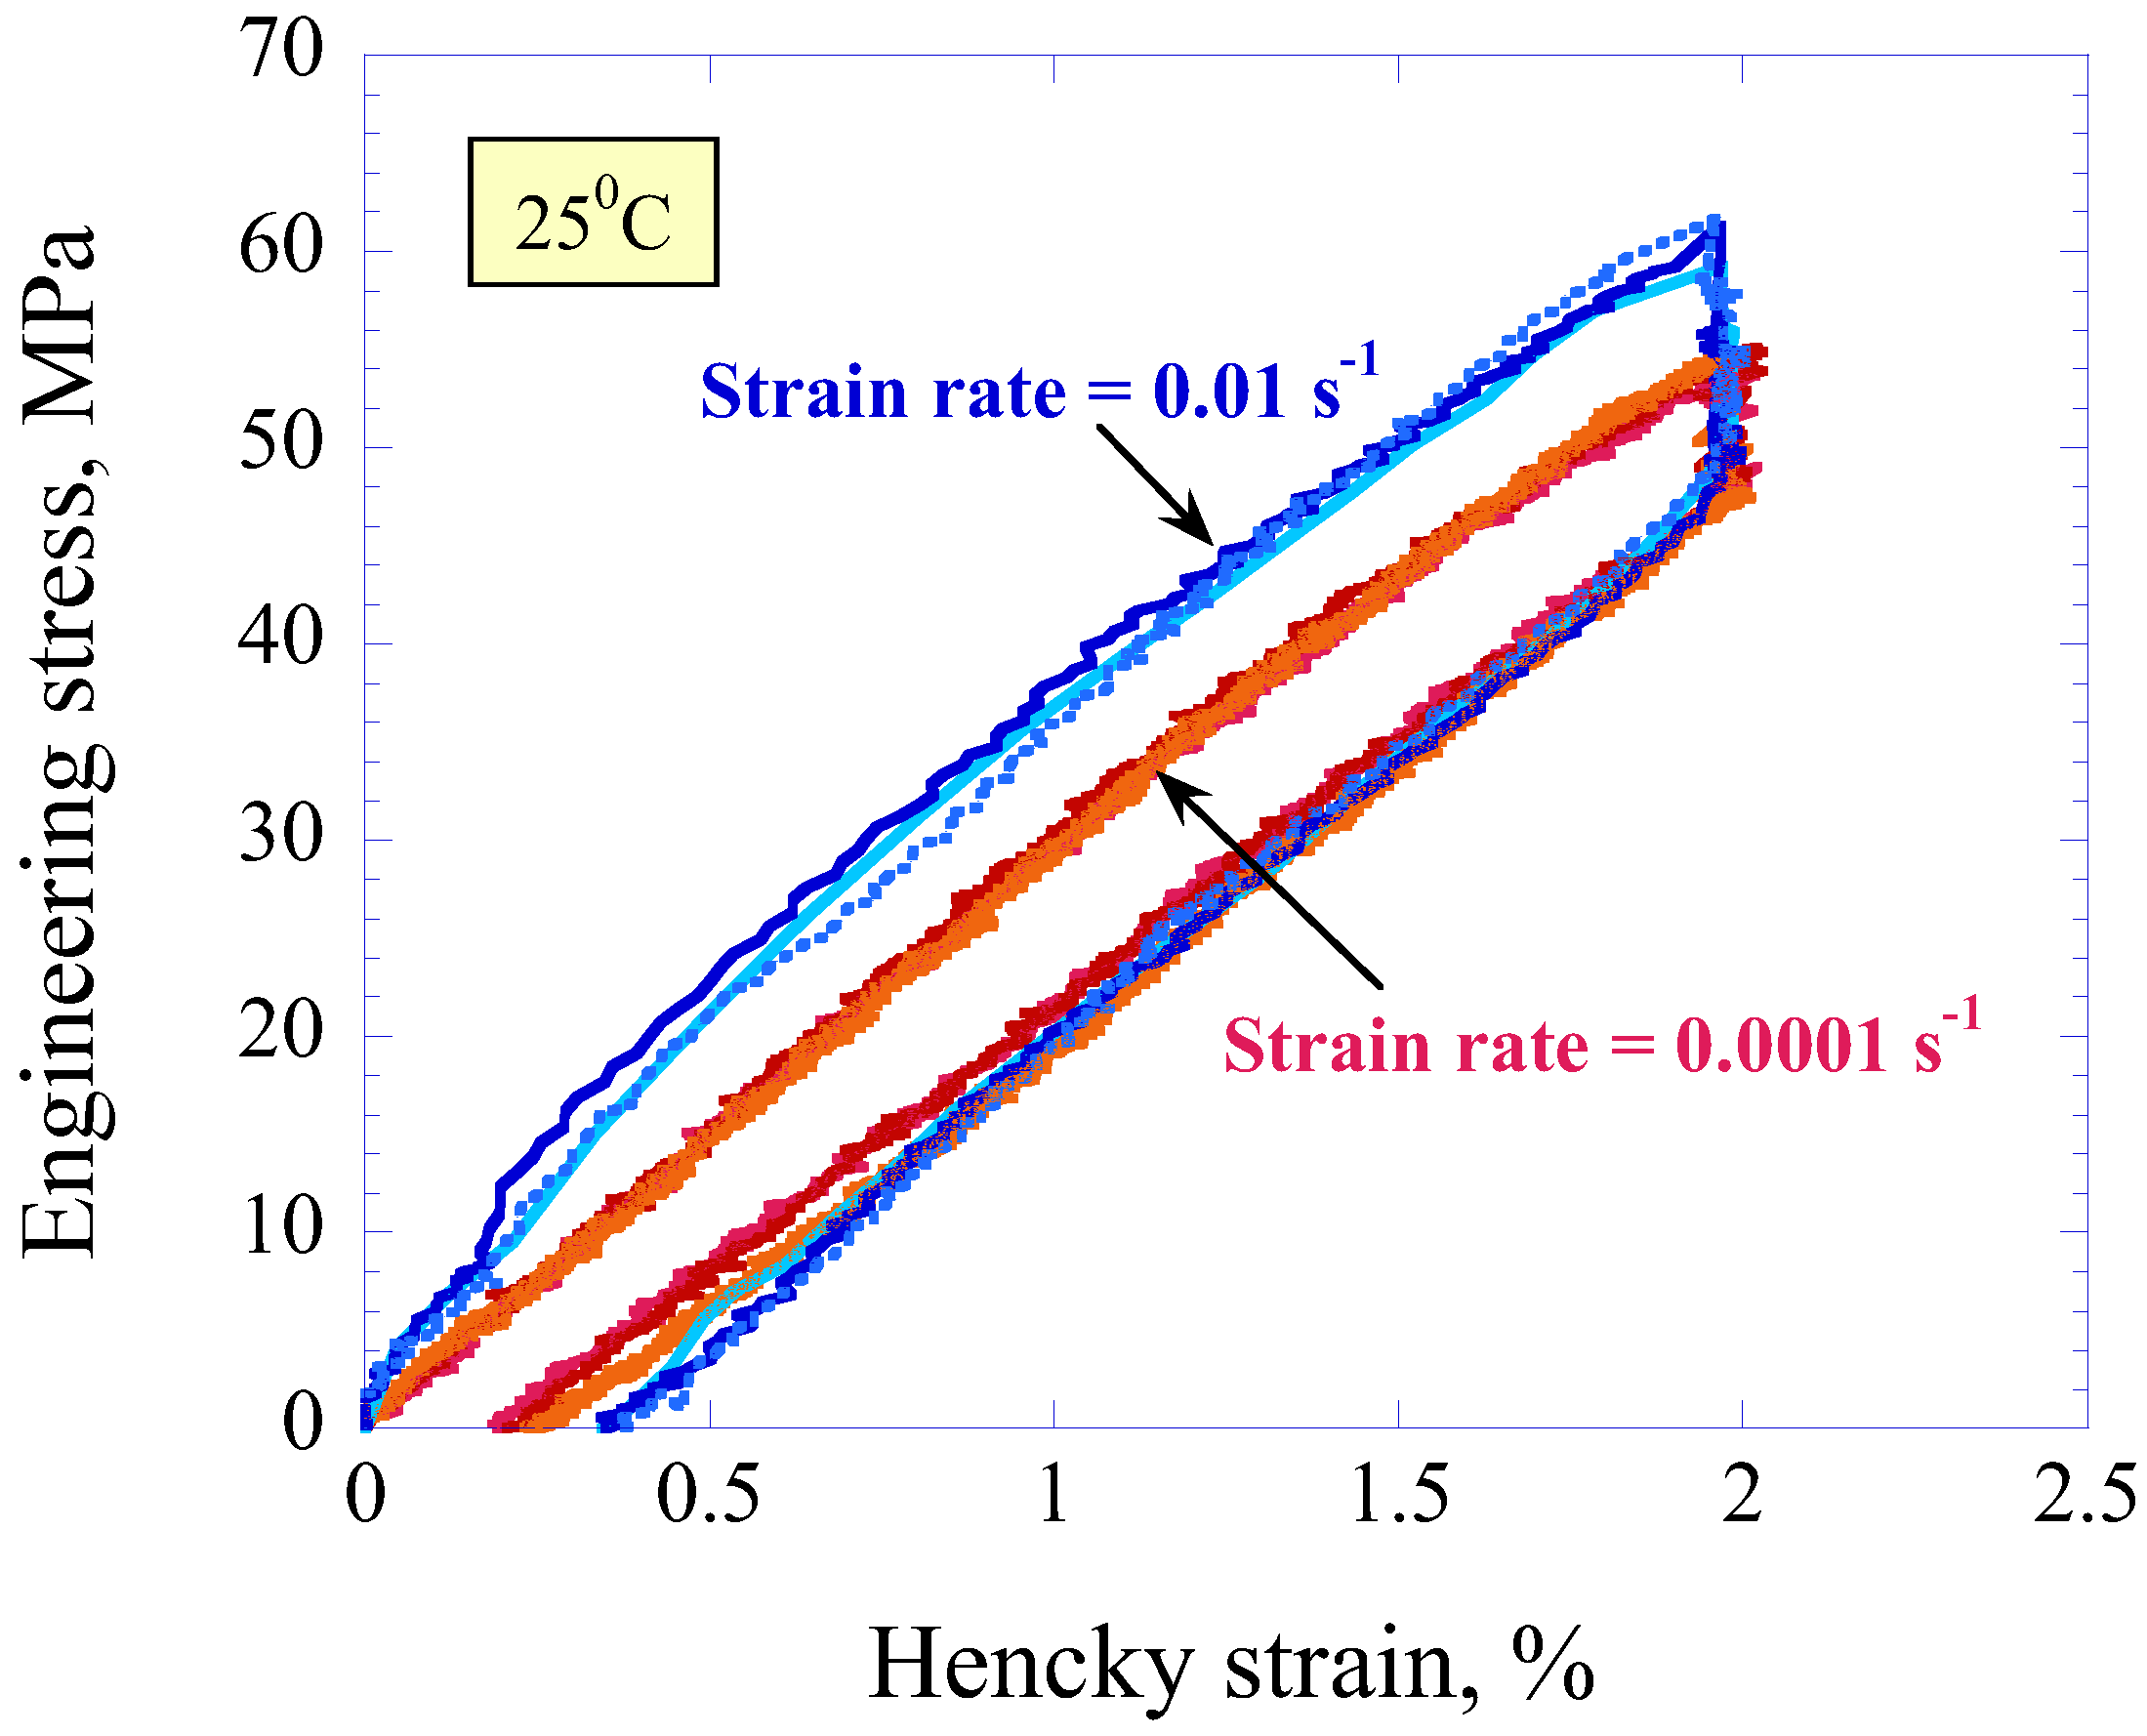
Figure 7.
SMP change in engineering stress vs. relaxation time at 2% engineering strain in the “glassy” state.
Figure 7.
SMP change in engineering stress vs. relaxation time at 2% engineering strain in the “glassy” state.
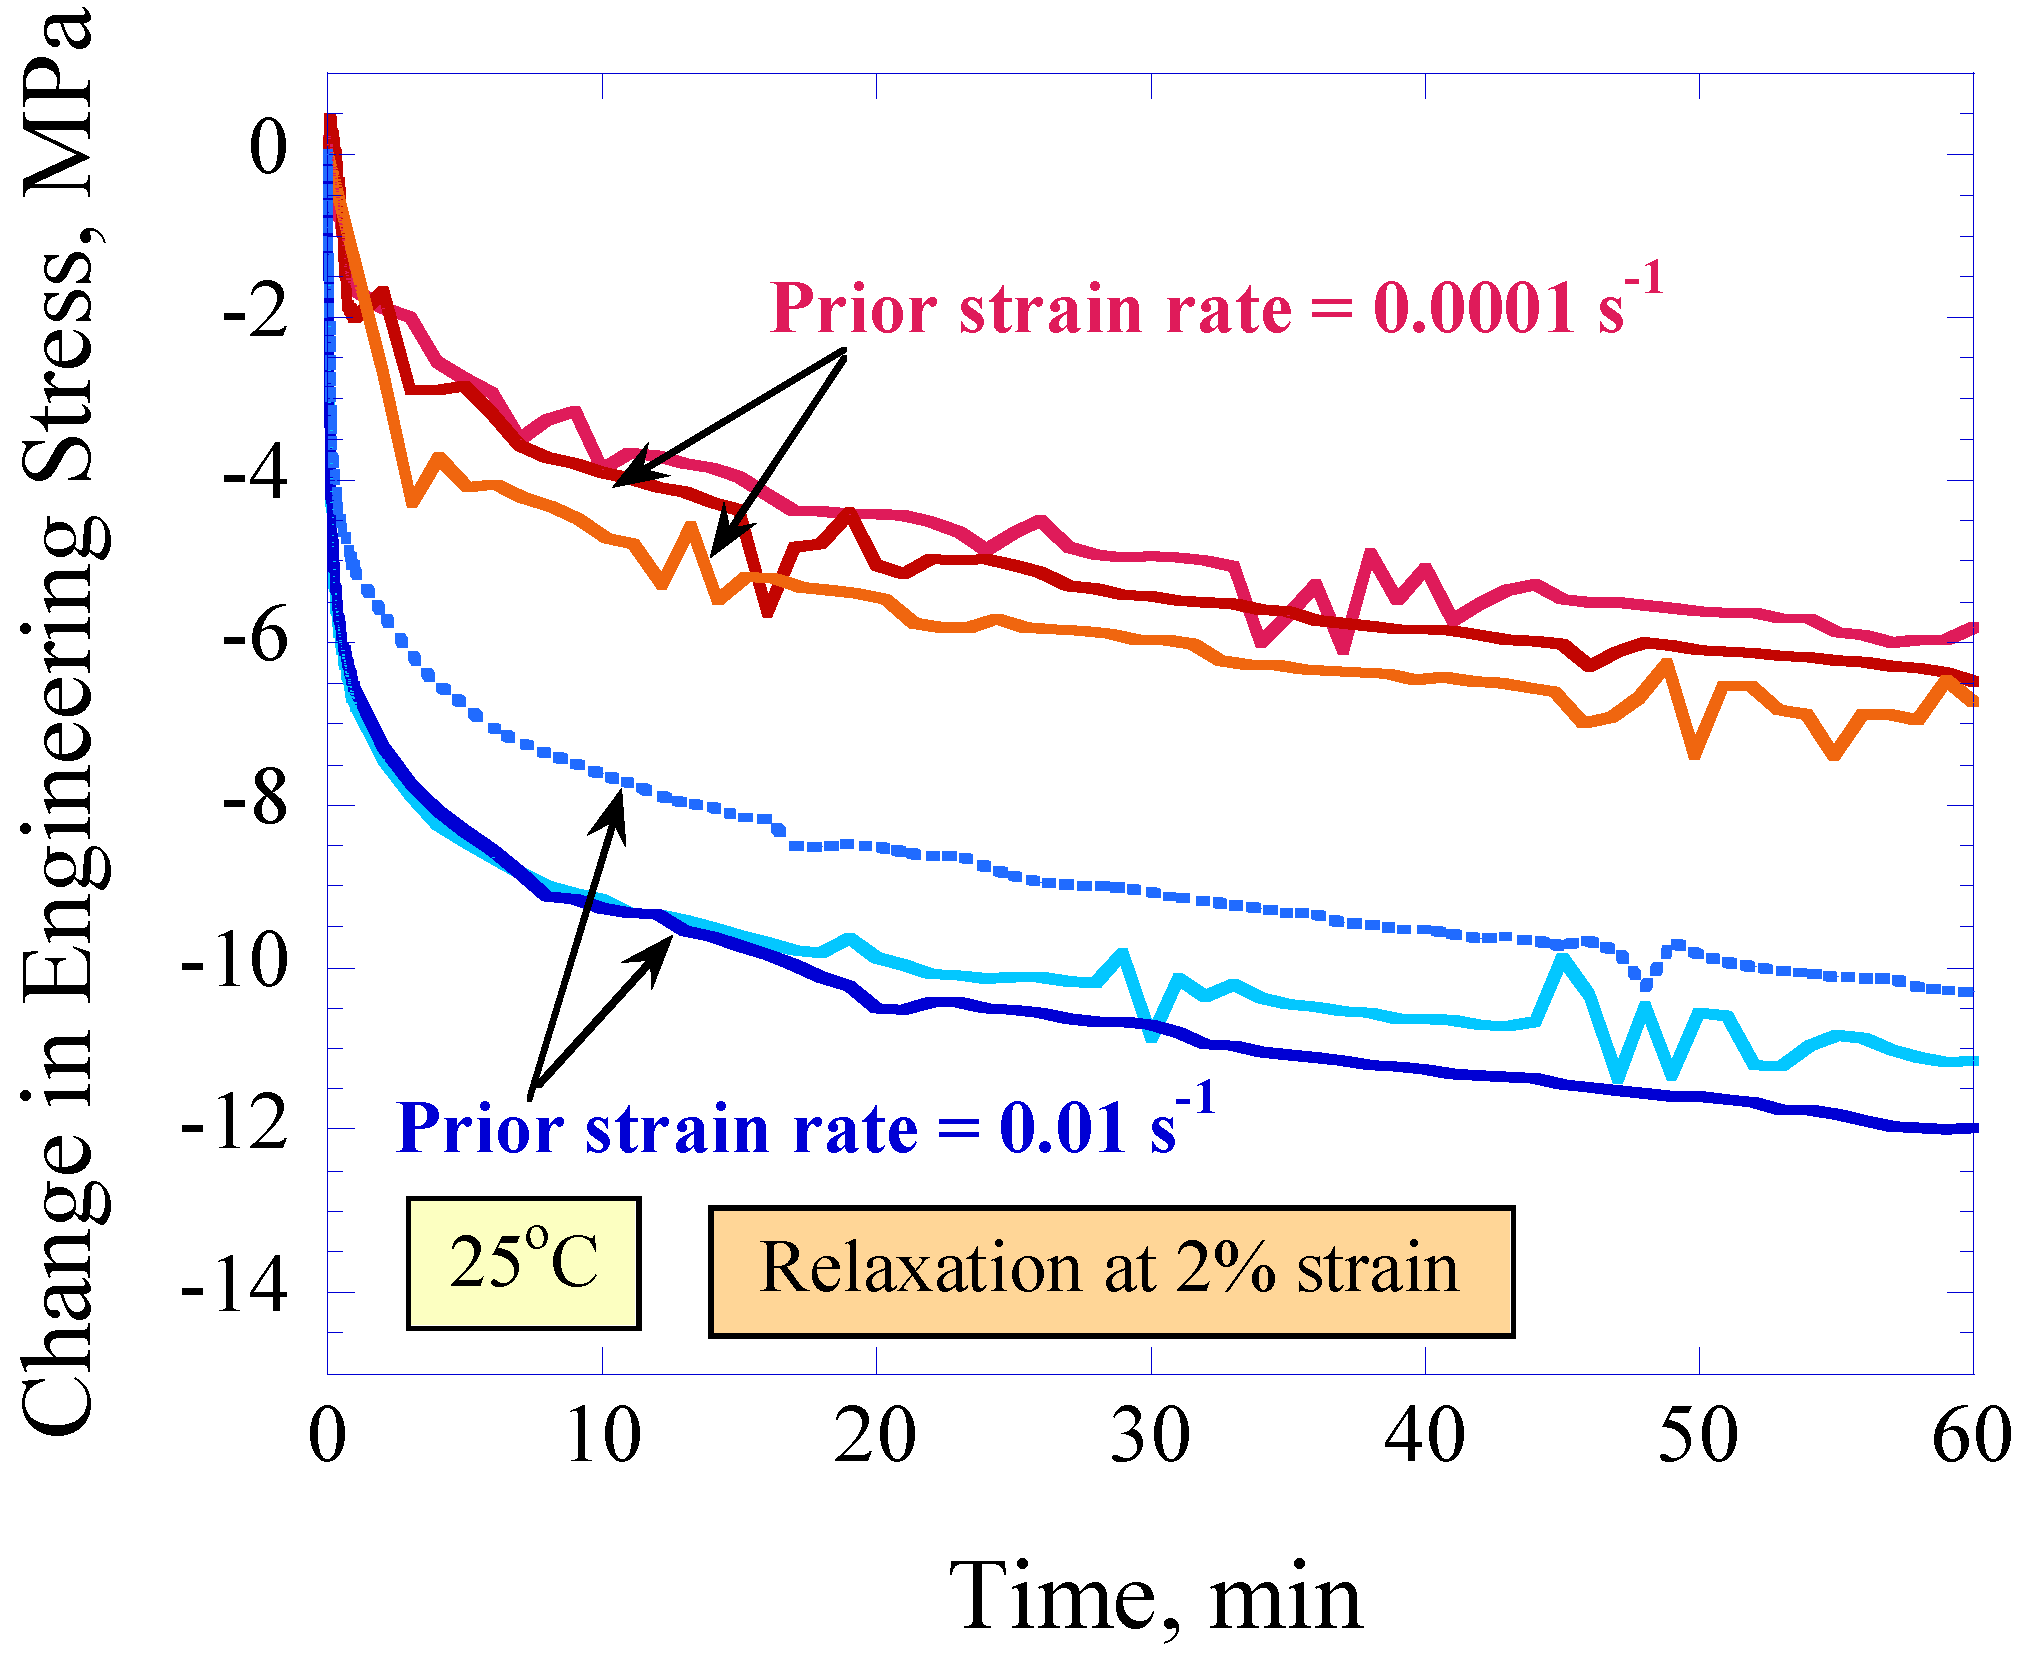
Figure 8.
SMP recovery of strain following load, relaxation, and unload in “glassy” state.
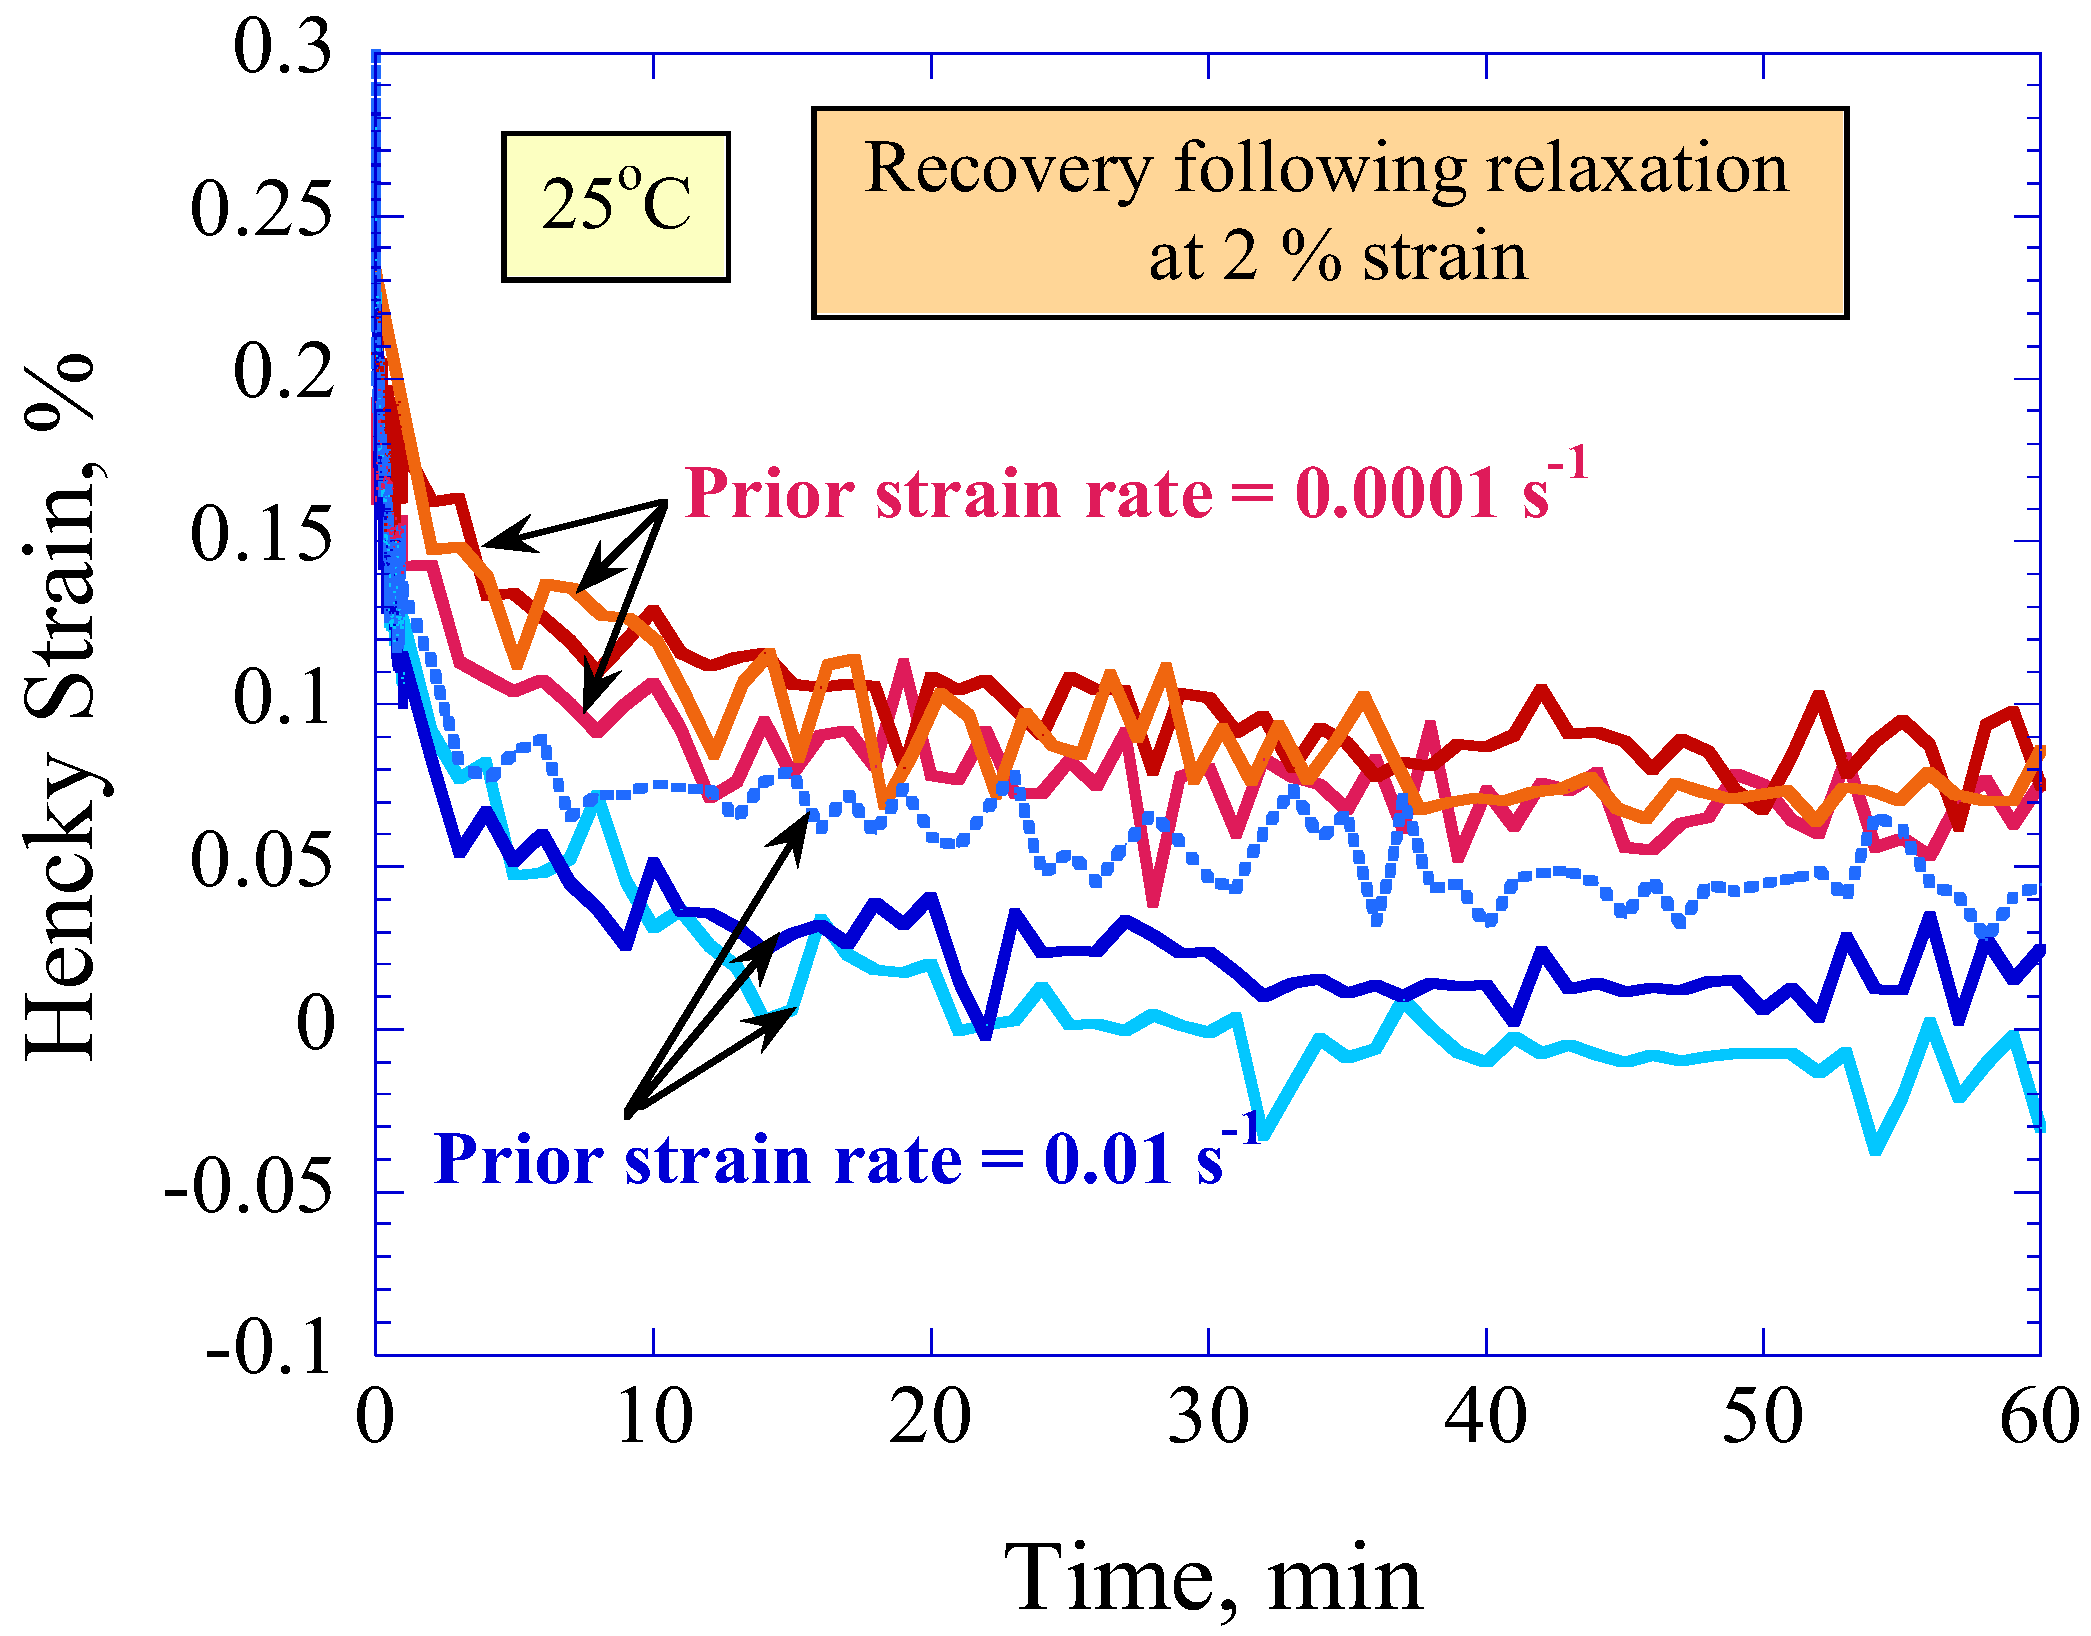
Figure 9.
Baseline shape memory cycle with free recovery. The circled numbers correspond to the second column in Table 4.
Figure 9.
Baseline shape memory cycle with free recovery. The circled numbers correspond to the second column in Table 4.

Table 1.
Elastic moduli comparison for the loading and unloading of an epoxy-based SMP.
| Temperature (°C) | Rate (s−1) | Loading (MPa) | Unloading (MPa) | Relaxation Strain (%) | Unloading (MPa) | Relaxation Strain (%) |
|---|---|---|---|---|---|---|
| 130 | 0.01 | 2.28 ± 0.09 | 1.79 ± 0.05 | 40 | 1.61 ± 0.06 | 60 |
| 130 | 0.0001 | 1.52 ± 0.12 | 1.27 ± 0.04 | 40 | 1.32 ± 0.02 | 60 |
| 25 | 0.01 | 3420 ± 140 | 2940 ± 90 | 2 | ||
| 25 | 0.0001 | 2930 ± 50 | 2750 ± 100 | 2 |
Table 2.
Epoxy-based SMP change in stress during periods of relaxation.
| Temperature (°C) | Rate (s−1) | Relaxation Strain (%) | Change in Stress (MPa) |
|---|---|---|---|
| 130 | 0.01 | 40 | 0.12 ± 0.01 |
| 130 | 0.0001 | 40 | 0.03 ± 0.01 |
| 130 | 0.01 | 60 | 0.14 ± 0.01 |
| 130 | 0.0001 | 60 | 0.02 ± 0.01 |
| 25 | 0.01 | 2 | 11.2 ± 0.9 |
| 25 | 0.0001 | 2 | 6.35 ± 0.5 |
Table 3.
Effect of Temperature and Prior Strain Rate on Recovery Behavior.
| Temperature (°C) | Rate (s−1) | εprescribed (%) | εunloading (%) | εresidual (%) | εresidual/εprescribed (%) |
|---|---|---|---|---|---|
| 25 | 0.0001 | 2 | 0.21 ± 0.02 | 0.08 ± 0.01 | 4.0 |
| 25 | 0.01 | 2 | 0.29 ± 0.02 | 0.03 ± 0.06 | 1.5 |
| 130 | 0.0001 | 40 | 4.31 ± 0.32 | 2.18 ± 0.61 | 5.45 |
| 130 | 0.01 | 40 | 8.85 ± 0.43 | 1.47 ± 0.51 | 3.68 |
| 130 | 0.0001 | 60 | 5.52 ± 0.40 | 3.80 ± 0.15 | 6.34 |
| 130 | 0.01 | 60 | 11.1 ± 0.28 | 1.62 ± 0.39 | 2.7 |
Table 4.
Detailed steps in the shape memory cycle experiment.
| State in Figure 2 | State in Figure 9 | Temperature | Force | Cross-Head Displacement | Strain |
|---|---|---|---|---|---|
| A1 to B | Heat at 2.5 °C/min from 25 °C to 130 °C | Hold at zero | |||
| B | Hold at 130 °C for 60 min | Hold at zero | |||
| B to C | 1 to 2 | Hold at 130 °C | Increase to 60% strain at 0.5 mm/min | ||
| C | 2 to 3 | Hold at 130 °C | Hold at 60% strain for 60 min | ||
| C to D | 3 to 4 | Cool at 2.5 °C/min from 130 °C to 25 °C | Hold at 60% strain | ||
| D | 4 to 5 | Hold at 25 °C for 60 min | Hold at 60% strain | ||
| 5 to 6 | Hold at 25 °C | Decrease at 50 mm/min until force in sample is zero | |||
| Unclamp bottom grip from sample | |||||
| D to E | 6 to 7 | Heat at 2.5 °C/min from 25 °C to 130 °C | No force applied, only top of sample is gripped | ||
| E | 7 to 8 | Hold at 130 °C for 60 min | No force applied, only top of sample is gripped | ||
| E to F | Cool at 2.5 °C/min from 130 °C to 25 °C | No force applied, only top of sample is gripped | |||
| F | Hold at 25 °C for 60 min | No force applied, only top of sample is gripped | |||
Table 5.
Inelastic strain present and total recovery Rr,tot following 60 min of recovery and temperature normalization. Each value is the average of three samples.
Table 5.
Inelastic strain present and total recovery Rr,tot following 60 min of recovery and temperature normalization. Each value is the average of three samples.
| Test Conditions | Temperature (°C) | εf (%) | Rr,tot (%) |
|---|---|---|---|
| Following Stress Relaxation | 130 | 1.220928 | 97.97 |
| Following Stress Relaxation | 25 | 0.013124 | 99.34 |
| Following SMC | 0.049861 | 99.92 |
© 2017 by the authors. Licensee MDPI, Basel, Switzerland. This article is an open access article distributed under the terms and conditions of the Creative Commons Attribution (CC BY) license (http://creativecommons.org/licenses/by/4.0/).
Share and Cite
MDPI and ACS Style
McClung, A.J.W.; Tandon, G.P.; Baur, J.W. Effects of Loading Rate on the Relaxation and Recovery Ability of an Epoxy-Based Shape Memory Polymer. Fluids 2017, 2, 13. https://doi.org/10.3390/fluids2020013
AMA Style
McClung AJW, Tandon GP, Baur JW. Effects of Loading Rate on the Relaxation and Recovery Ability of an Epoxy-Based Shape Memory Polymer. Fluids. 2017; 2(2):13. https://doi.org/10.3390/fluids2020013
Chicago/Turabian StyleMcClung, Amber J.W., Gyaneshwar P. Tandon, and Jeffery W. Baur. 2017. "Effects of Loading Rate on the Relaxation and Recovery Ability of an Epoxy-Based Shape Memory Polymer" Fluids 2, no. 2: 13. https://doi.org/10.3390/fluids2020013