
Flow Configurations in a Y Splitting-Junction Microchannel


Department Mechanical and Aerospace Engineering, University La Sapienza, 00184 Roma, Italy
*
Author to whom correspondence should be addressed.
Fluids 2017, 2(2), 18; https://doi.org/10.3390/fluids2020018
Submission received: 31 January 2017
/
Revised: 20 April 2017
/
Accepted: 20 April 2017
/
Published: 22 April 2017
(This article belongs to the Special Issue MNF 2016 Special Issue—Micro/Nanofluids)
Abstract
:In the present work, the flow field in a splitting-junction micro channel with a Y shape, which is the simplest geometry to be employed for heat and mass transfer in micro-devices such as micro-heat-exchangers and micro-mixers, is investigated experimentally using micro Particle Image Velocimetry (μPIV). The angular divergence in the Y splitting is changed, as well as the Reynolds number, in order to investigate the instantaneous and mean flow fields to determine which configurations are more suitable for practical applications. The results show that the flow configuration is strongly dependent on the Y shape angle, especially in the junction part, and that there is also a significant dependence on the Reynolds number.
1. Introduction
The use of micro-devices is nowadays widely increasing due to their relevant advantages in efficiency when compared to their macro counterparts, as resulting from the heat transfer coefficient being inversely proportional to the characteristic length of the contact surface [1]. This has led to several applications in the fields of Biomedicine and Bio-Engineering, as well as in Sensors, Control and Automation and Energy Engineering, namely in Energy Conversion Systems for solar energy, gas conversion and sequestration and optimization of fuel cells [2]. The starting point of the present research is just in the framework of applications of micro-devices to the field of Energy Engineering, in order to improve heat and mass transfer, in those devices usually employed in this field as micro-heat-exchangers, micro-mixers or micro-pumps [3,4,5]. Specifically, drawing from previous investigations on micro fuel cells [2], it is clear how challenging it can be to design such systems in micro-scales by ensuring net momentum (or temperature) diffusion using only passive methods, i.e., by using changes in geometry or by inserting external passive elements in the flow. In such a way, heat and mass transfer among two or more fluid streams is performed without external actions and without using another phase besides the fluid phase (for example bubbles, solid particles or other species).
Considering the effects due to change in geometry in micro-channel flow, a very effective and simple geometry to increase diffusion is to add a Y splitting section and then recombine the two branches in an inverse Y junction [6,7,8,9]. This configuration is rather simple to be manufactured and can be also used for flow measurements (flow rate) and control. However, the effect of the angular divergence and convergence of the Y junction, also considered in relation to differences in the Reynolds number, has not yet been entirely investigated. In previous studies, the focus was mainly on investigating the effects of abrupt geometrical changes on the field flow, such as a T-junction, rather than on the combined effects of smoother geometries and different Reynolds numbers. Thus, the aim of the present experimental work is to investigate the effect of a Y section angle and flow velocity (Reynolds number) in the resulting flow configuration with micro Particle Image Velocimetry (μPIV), in order to optimize the design of micro-heat-exchangers and micro-mixing devices. Another major objective of the work is to set up an efficient image analysis procedure, i.e., image acquisition and processing, in order to minimize the effects of external disturbances and noise on the data, thus improving their reliability.
2. Device and Setup Specifications
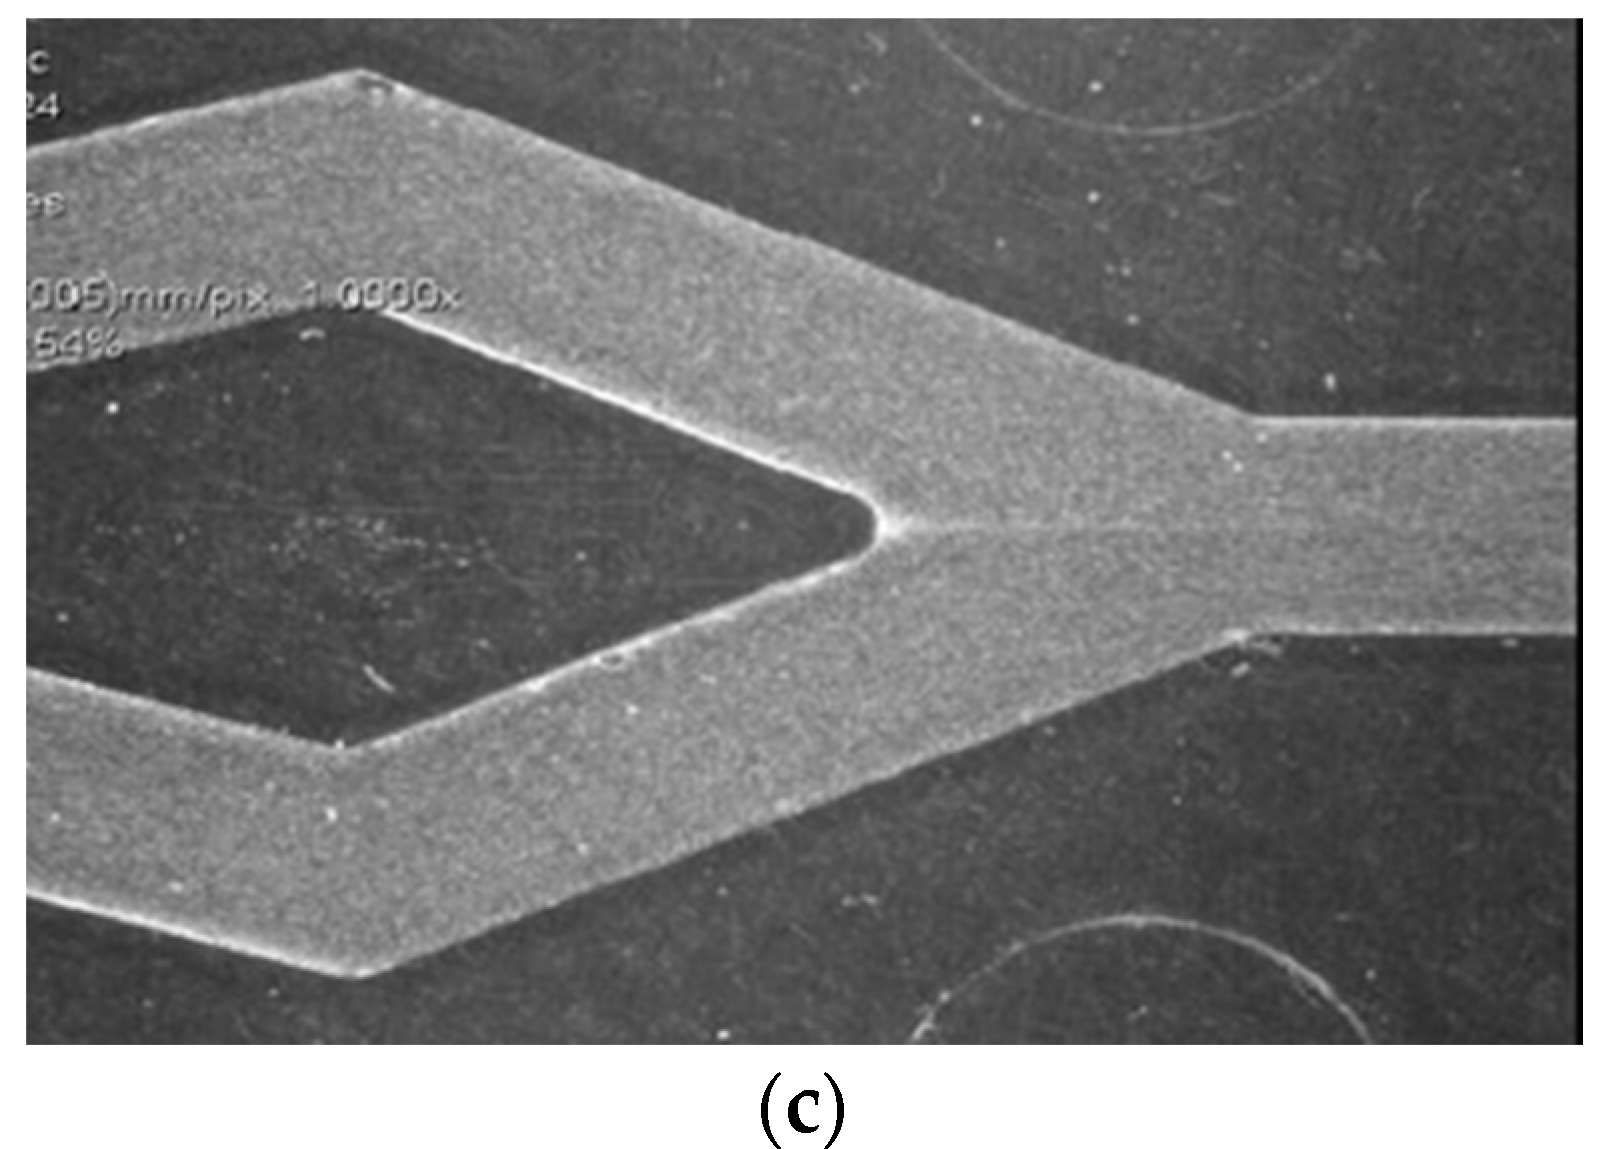
The test section consists of a channel, filled with distilled water, with a rectangular cross-section (height = 0.4 mm, width = 4 mm) followed by a splitting section with two possible angles, 30° and 45°, which in turn is followed by a junction with reverse angles respectively equal to 45° and 30°. These angles have been selected because they are the maximum angles the prevent separation at the splitting and junction sections, as well as at the upper and lower bends. The device was manufactured by the German company ibidi GmbH and is part of the µ-slide Luer family, made of a special polymer hydrophobic uncoated coverslip (ibidi Polymer Coverslip), which prevents cell growth on the surface and is also fully optically transparent. The reported error on surface roughness is quoted to be ±5 μm. The overall experimental configuration with an example of the Y splitting-junction channel is given in Figure 1 (at the top left and right), together with an example of the acquired image (at the bottom). The measurements were performed in a range of velocities from 0.01 m/s to 0.1 m/s, thus resulting in a maximum Reynolds number around 50 (based on the bulk velocity and the hydraulic diameter). The illumination of the test section is provided by three commercial LED lamps, 60 W each, giving uniform light distribution without any major heating problems. A 50-mm focal lens objective Nikon macro Nikkor f1.8 is used with multiple extension tubes up to 36 mm. The depth of focus was around 0.6 mm, so that all tracer particles in the channel are in focus, as observed in Figure 1, whereas the magnification factor is around 20 μm/px. High resolution images of the region upstream of the splitting section, of the two branches and of the junction are acquired by a high speed Photron-Fastcam video-camera (for the present measurements, between 500 frames/s and 1000 frames/s at the maximum spatial resolution of 1024 × 1024 pixels, with a shutter time equal to 1/2000 s) and stored on a PC. The water flow is seeded with hollow glass spherical tracers with an average diameter of 10 μm and a standard deviation of ±2 μm. The relative density in comparison to water is equal to 1.1, thus resulting in a Stokes time scale of less than 10−5 s. This means that the tracers are able to follow fluid velocity fluctuations up to 100 kHz. Typical examples of acquired images are provided in Figure 1 (at the bottom) and Figure 2. Tracers and fluid are injected in the flow continuously by means of a syringe pump (KD Scientific—410 series), with a minimum flow rate of 0.1 mL/min. In the present measurements, the flow rates are varied between 4 mL/min and 10 mL/min, with an error of less than 0.1 mL/min.
A typical image of the entire Y splitting-junction section is presented in Figure 2, where typical examples of optical disturbances are also shown, including background light, diffused light from the source lamp, light reflections on the walls, light scattering due to small air bubbles, external interferences and flickering (which can be appreciated only in video). A specific image pre-processing procedure has been developed in order to minimize these effects before performing PIV analysis. Specifically, all sources which are more or less steady can be removed by evaluating the minimum intensity for each pixel over a sequence of images, and then subtracting the given minimum from each image of the sequence [10]. This operation eliminates all disturbances except for moving bubble contribution and flickering, which can be reduced by computing a moving average minimum. At this stage, a contrast enhancement algorithm is applied to the images in order to emphasize tracer particle images, as reported in Figure 3. Lastly, a mask is added to the images in order to avoid the evaluation of the vector field by PIV outside the channels, thus reducing the computational cost. Details on image pre- and post-processing are reported elsewhere [11].
Two consecutive frames of the time sequence are analyzed to determine the flow tracer displacements as usual in micro Particle Image Velocimetry (μPIV) [10]. An example of the result of the instantaneous flow field is presented in Figure 3. The velocity measurements are obtained from two consecutive images, as those in Figure 1 or Figure 3, by applying iterative cross-correlation algorithms, using 32 × 32 pixel final sub-windows with overlapping 50%. In Figure 3 on the right, velocity vectors are clearly seen without major spurious data. About 1000 frame couples are acquired in each condition to derive mean and root mean square (rms) fields.
3. Results
In Figure 4, the resulting mean fields of the axial velocity for the Y channel splitting section are presented for two diverging angles at the same Reynolds number (around 50). It is clearly observed that the two configurations are rather similar, both in the diverging sections and after the change in direction. This is in agreement with the fact that at such a low Reynolds number the flow is almost laminar, even where the flow abruptly changes directions, and is without any major separation region.
On the other hand, when the junction section is considered, as presented in Figure 5 emphasized by red curves, the velocity values obtained with the largest in-diverging angle (45°, seen on the right in Figure 5) show a velocity reduction at the centerline persisting further downstream in comparison to the other configuration (30°, seen on the left). Thus, the maximum velocity at the centerline is higher for this last configuration, compared to the reverse, by about 10% to 20% depending on the Reynolds number, and the velocity profile is flatter downstream of the junction. Presumably, this is due to the thinner mixing layer developing between the two merging streams for the lower value of the in-diverging angle (30°) in comparison to that with higher value (45°). This is why the flow uniformity is recovered further downstream in this second case. It is also important to recall that the lowest in-diverging angle corresponds to the highest out-converging angle and vice versa. Also, in the 30° configuration, higher velocity rms fluctuations (not shown here) are measured in the junction section (about 20%, i.e., more than double those measured in the other configuration and much larger than the inlet rms level equal to 5%–8%). For the reverse configuration (on the right in Figure 5), a flat velocity profile is recovered further downstream in comparison to the previous one, thus indicating that the two streams are separated for a longer distance. In any case, this is an indication of a strong dependence on the velocity field from the specific Y junction angle, which presumably influences the mixing of the two streams.
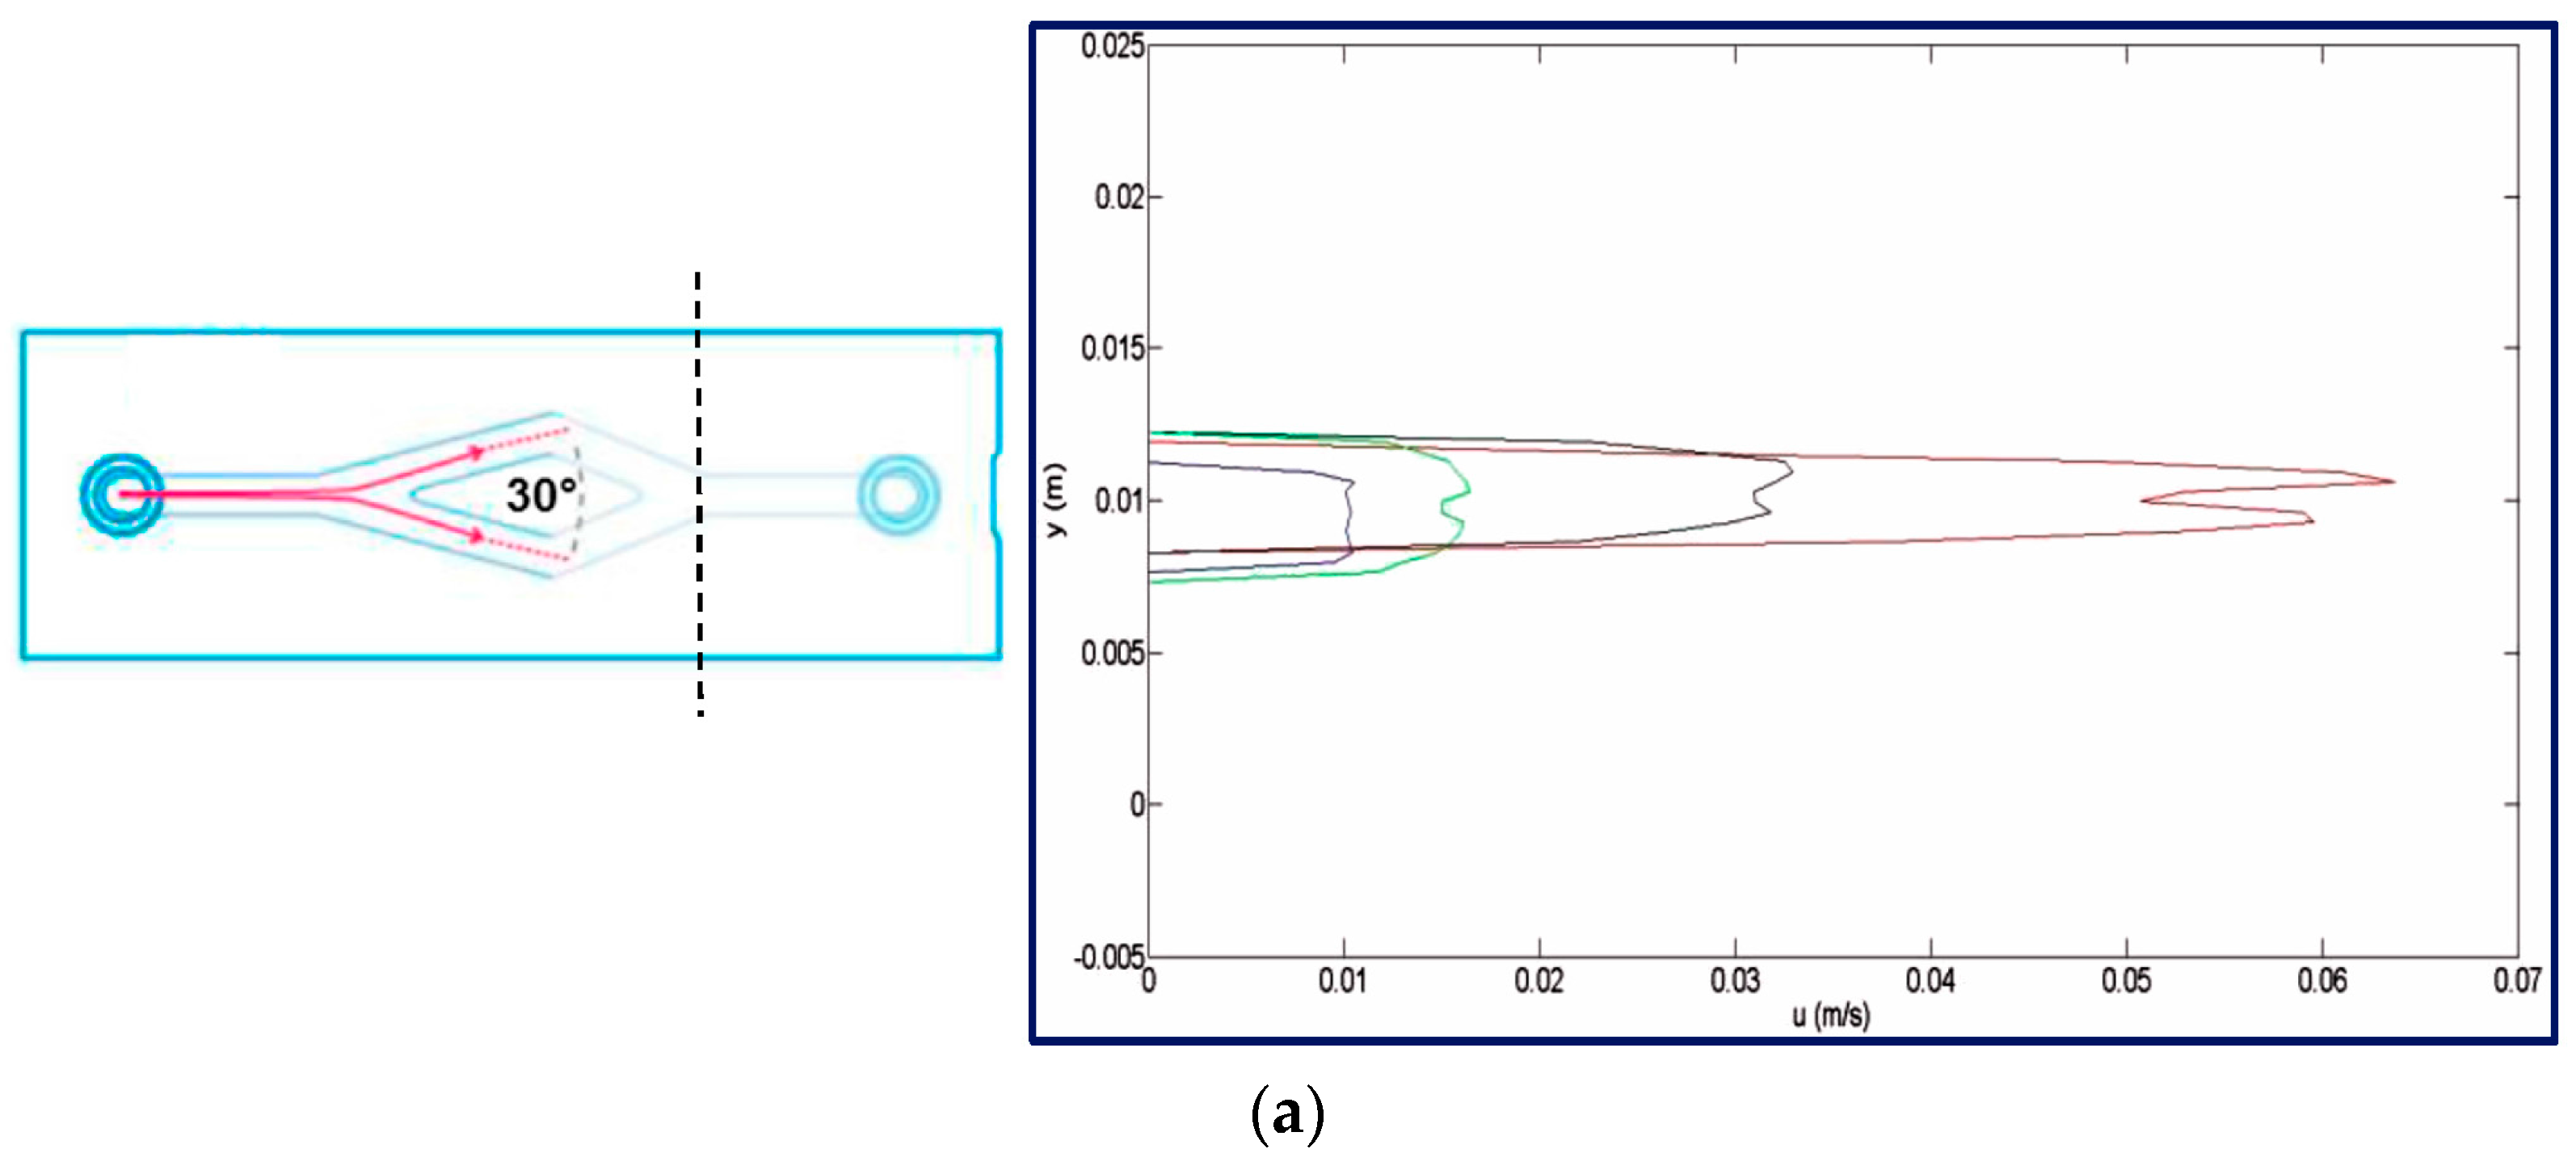
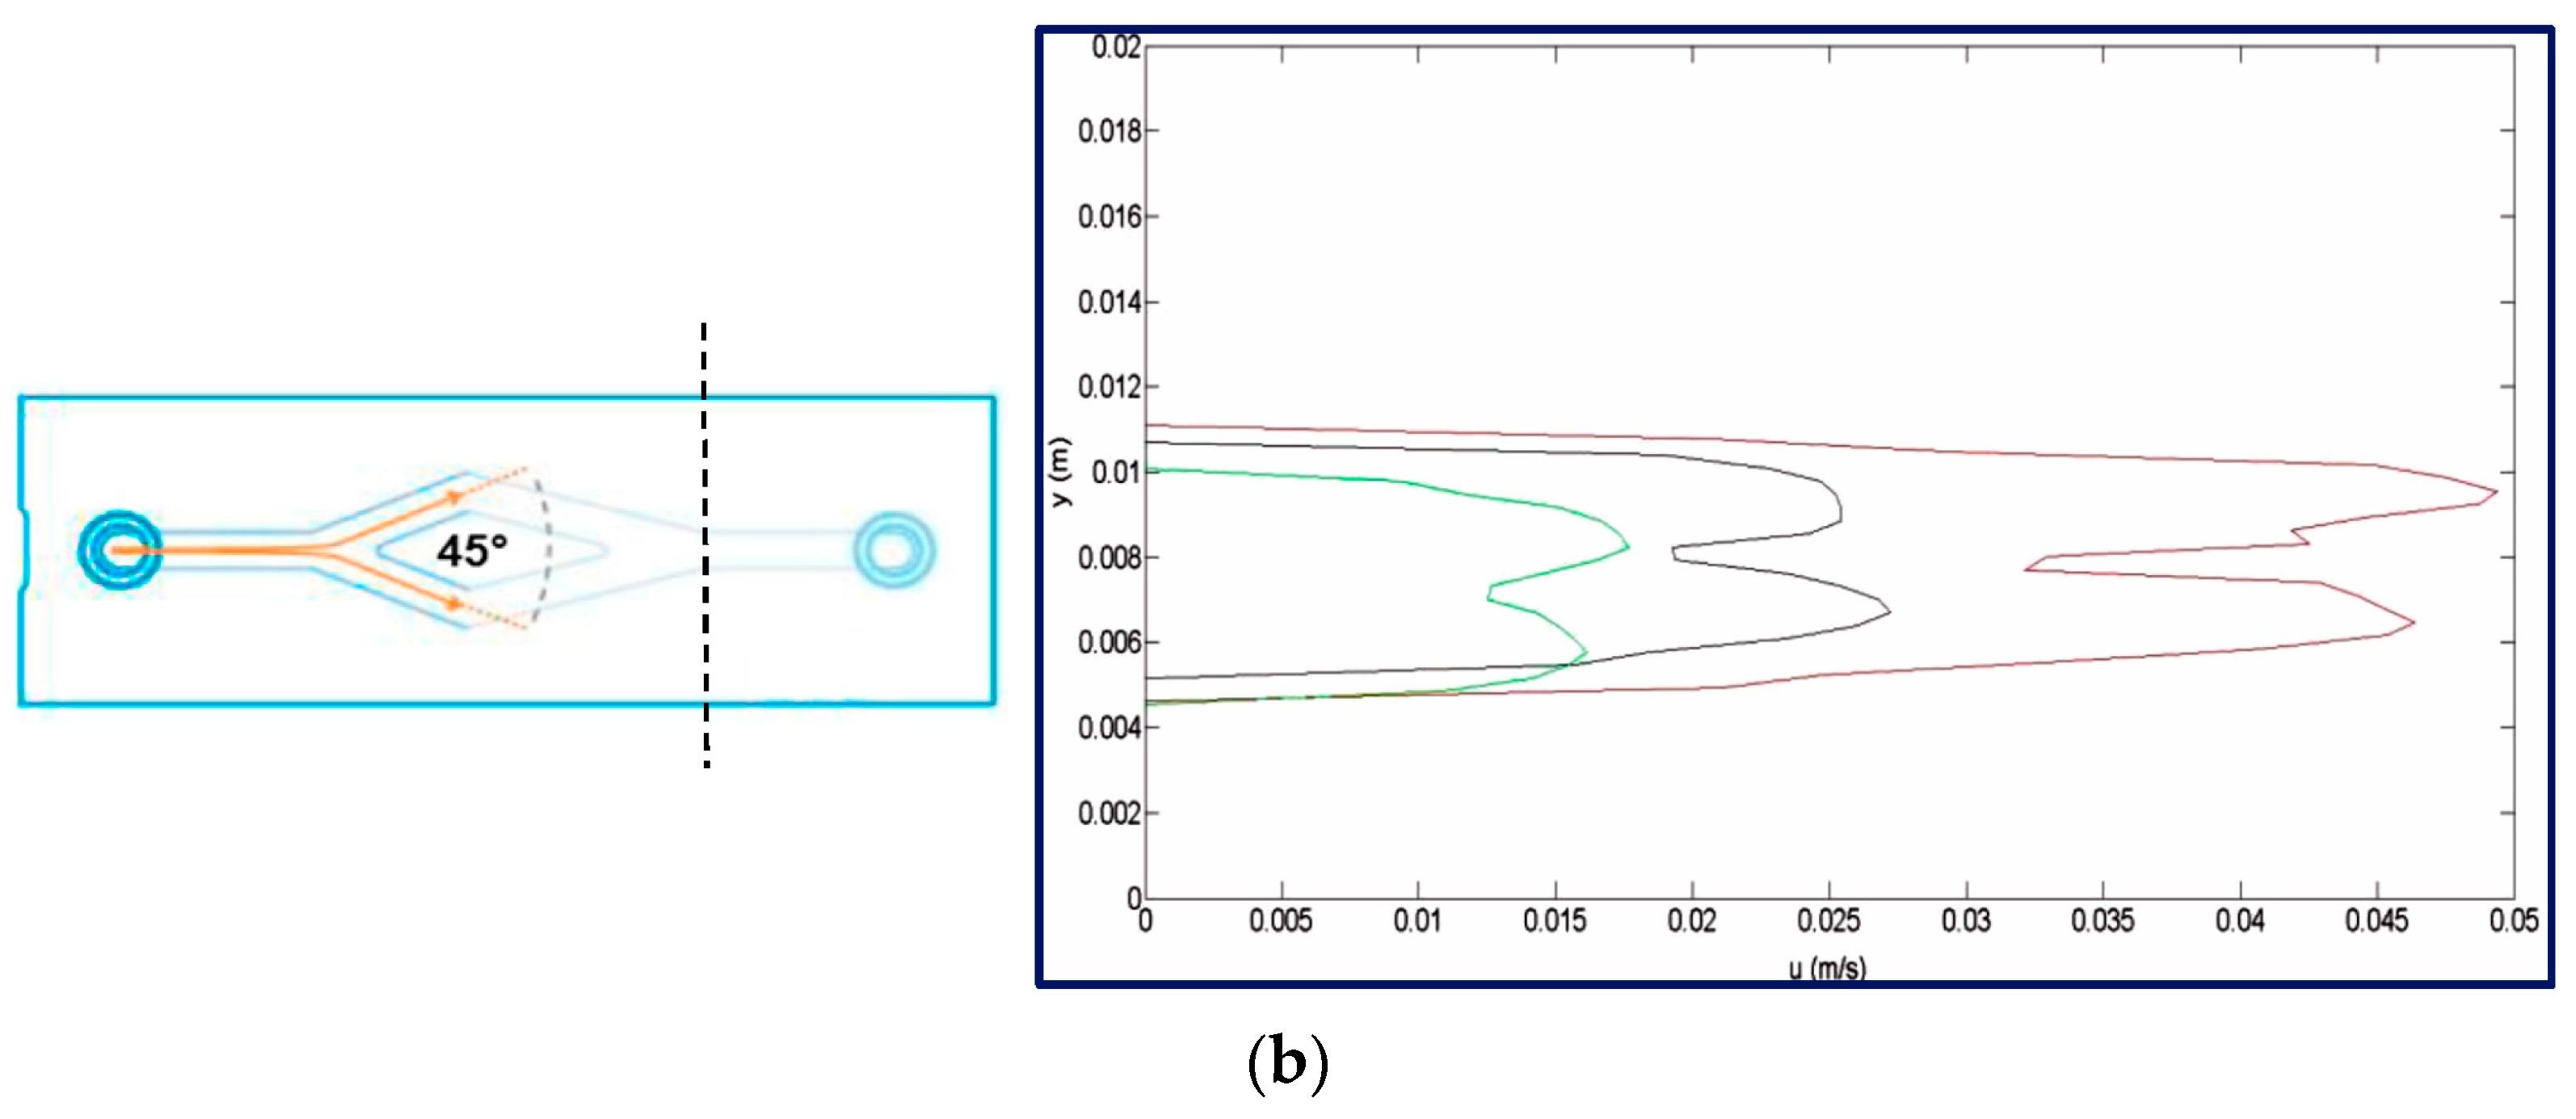
The dependence on the Reynolds number of these results is also related to the specific geometry. In Figure 6, the velocity profiles at the outlet of the junction (the first profile just after the junction, as indicated by dotted lines) for different flow rates are compared for the two geometrical configurations. Again, there are differences among the two geometries which are observed whatever the Reynolds number. However, for the 30° diverging angle, the shape of the velocity profile also exhibits a remarkable dependence on the Reynolds number, which is not so high for the reverse geometry.
4. Discussion and Conclusions
A high-speed micro PIV system was set up and optimized to measure details of mixing in micro flows. In order to derive reliable data, specific image analysis procedures were developed to remove external optical disturbances, such as moving average minimum subtraction and contrast enhancements.
In this way, a Y splitting-junction section was investigated by changing the diverging angles and the Reynolds number of the flow. The configuration with a small splitting angle at the inlet of the bifurcation followed by a large junction angle seemed to produce a better mixing performance in comparison to the opposite (reverse configuration). This is confirmed by the higher level of velocity fluctuations measured in the first configuration. The reason for this behavior resides in the different amplitudes of the related mixing layers, as well as the higher converging angle.
On the other side, while the reverse configuration exhibited rather similar results in the range of tested Reynolds numbers, there was a remarkable Reynolds number dependence for the configuration with the best mixing performances. This indicated that such a simple mixing device design must be optimized for the specific Reynolds number and geometry used in each practical application. However, in addition to the angle between the two sections, there are many other geometrical parameters which deserve further specific investigations in such a Y splitting-junction, as for example roundness details of the vertex of the splitting and junction, top and bottom channel bends and specific values of the surface roughness.
Acknowledgments
The authors acknowledge financial support from Sapienza, University of Rome through the project “Medie e Grandi Attrezzature.” The authors would also like to thank Dr. Marco Pecorario for his help in taking the measurements.
Author Contributions
Giorgia Sinibaldi and Giovanni P. Romano conceived and designed the experiments; Giorgia Sinibaldi performed the experiments and analyzed the data; Giorgia Sinibaldi and Giovanni P. Romano wrote the paper.
Conflicts of Interest
The authors declare no conflict of interest.
References
- Mikielewicz, D.A. New method for determination of flow boiling heat transfer coefficient in conventional-diameter channels and minichannels. Heat Trans. Eng. 2010, 31, 276–287. [Google Scholar] [CrossRef]
- Calabriso, A.; Borello, D.; Romano, G.P.; Cedola, L.; Del Zotto, L.; Santori, S.G. Bubbly flow mapping in the anode channel of a direct methanol fuel cell via PIV investigation. Appl. Energy 2016, 185, 1245–1255. [Google Scholar] [CrossRef]
- Laser, D.J.; Santiago, J.G. A review of micropumps. J. Micromech. Microeng. 2004, 14, R35–R64. [Google Scholar] [CrossRef]
- Kallio, P.; Kunkova, J. Microfluidics; Tekes: Helsinki, Finland, 2004. [Google Scholar]
- Ameel, T.A.; Warrington, R.O.; Wegeng, R.S.; Drost, M.K. Miniaturization technologies applied to energy systems. Energy Convers. Manag. 1997, 38, 978–979. [Google Scholar] [CrossRef]
- Nuno Leal, G.S.; Semiao, V. Determination of microchannels geometric parameters using micro-PIV. Chem. Eng. Res. Des. 2009, 87, 3–298. [Google Scholar]
- Jasikova, D.; Kotek, M.; Kopecky, V. The feasible study of the water flow in the micro channel with the Yjunction and narrow structure for various flow rates. EPJ Web Conf. 2015, 92, 02030. [Google Scholar] [CrossRef]
- Cook, K.J.; Fan, Y.F.; Hassan, I. Experimental investigation of a scaled-up passive micromixer with uneven interdigital inlet and teardrop obstruction elements. Exp. Fluids 2012, 52, 1261–1275. [Google Scholar] [CrossRef]
- Truesdell, R.A.; Bartsch, W.; Buranda, T.; Sklar, L.A.; Mammoli, A.A. Direct measurement of mixing quality in a pulsatile flow micromixer. Exp. Fluids 2005, 39, 819–827. [Google Scholar] [CrossRef]
- Wereley, S.T.; Meinhart, C.D. Recent advances in micro-particle image velocimetry. Annu. Rev. Fluid Mech. 2010, 42, 557–576. [Google Scholar] [CrossRef]
- Capone, A.; Romano, G.P. Interactions between fluid and fibers in a turbulent backward-facing step flow. Phys. Fluids 2015, 27, 053303. [Google Scholar] [CrossRef]
Figure 1.
Measurement of the overall configuration (a), detail of the Y channel junction in direct and inverse configurations with angle definition (b), and example of the acquired image in the 30° configuration (c), flow from left to right.
Figure 1.
Measurement of the overall configuration (a), detail of the Y channel junction in direct and inverse configurations with angle definition (b), and example of the acquired image in the 30° configuration (c), flow from left to right.
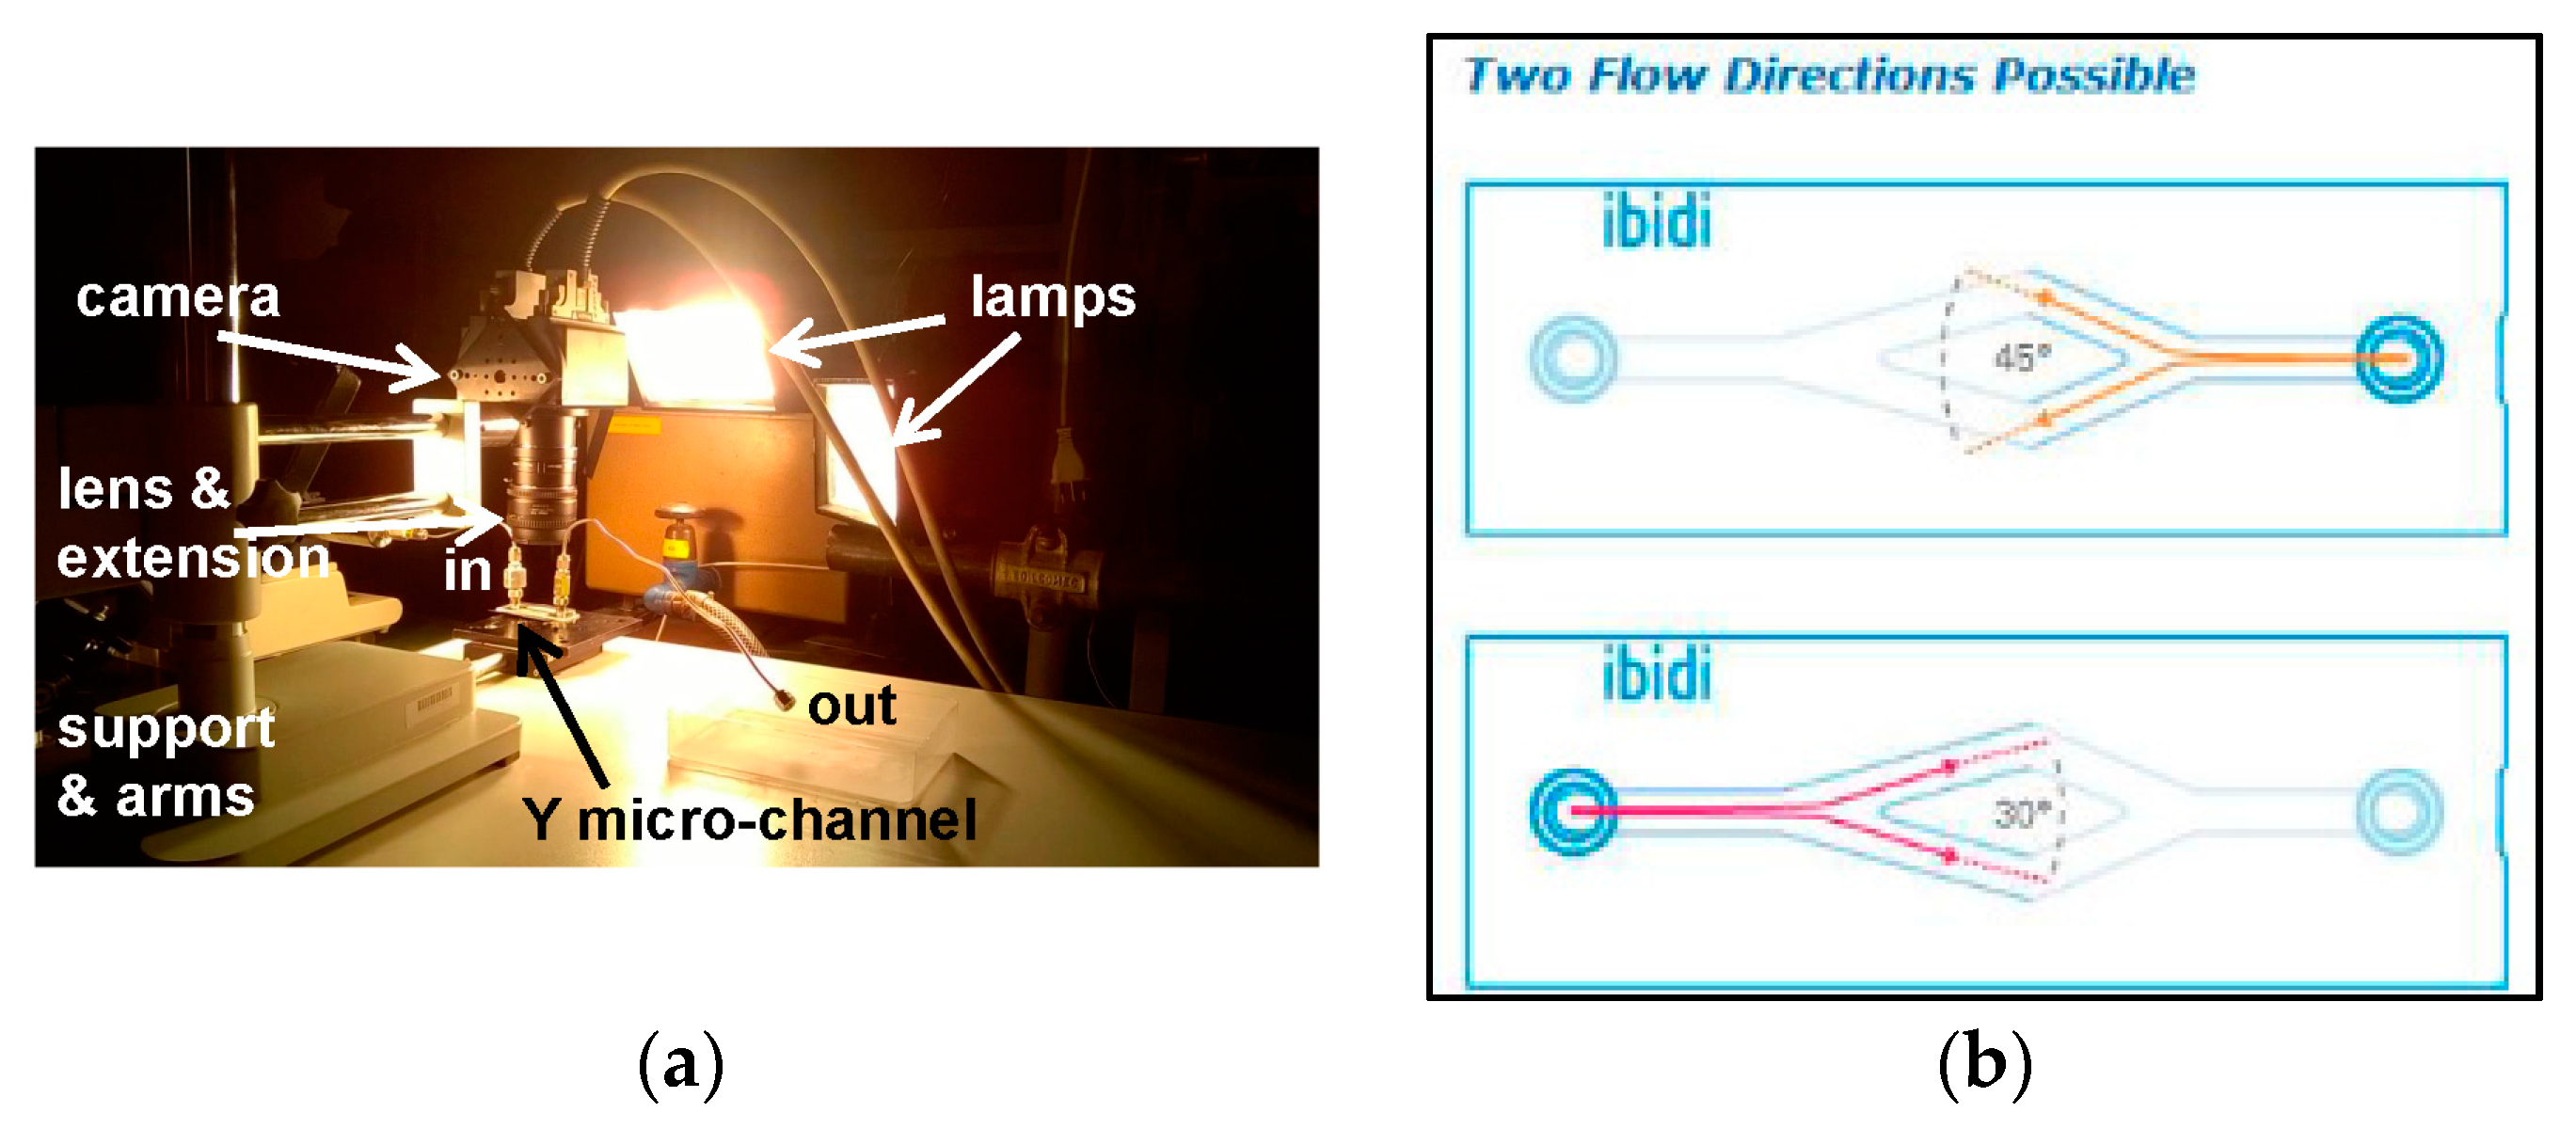

Figure 2.
The Y splitting-junction section with examples of optical disturbances for the 45° configuration (flow from left to right).
Figure 2.
The Y splitting-junction section with examples of optical disturbances for the 45° configuration (flow from left to right).
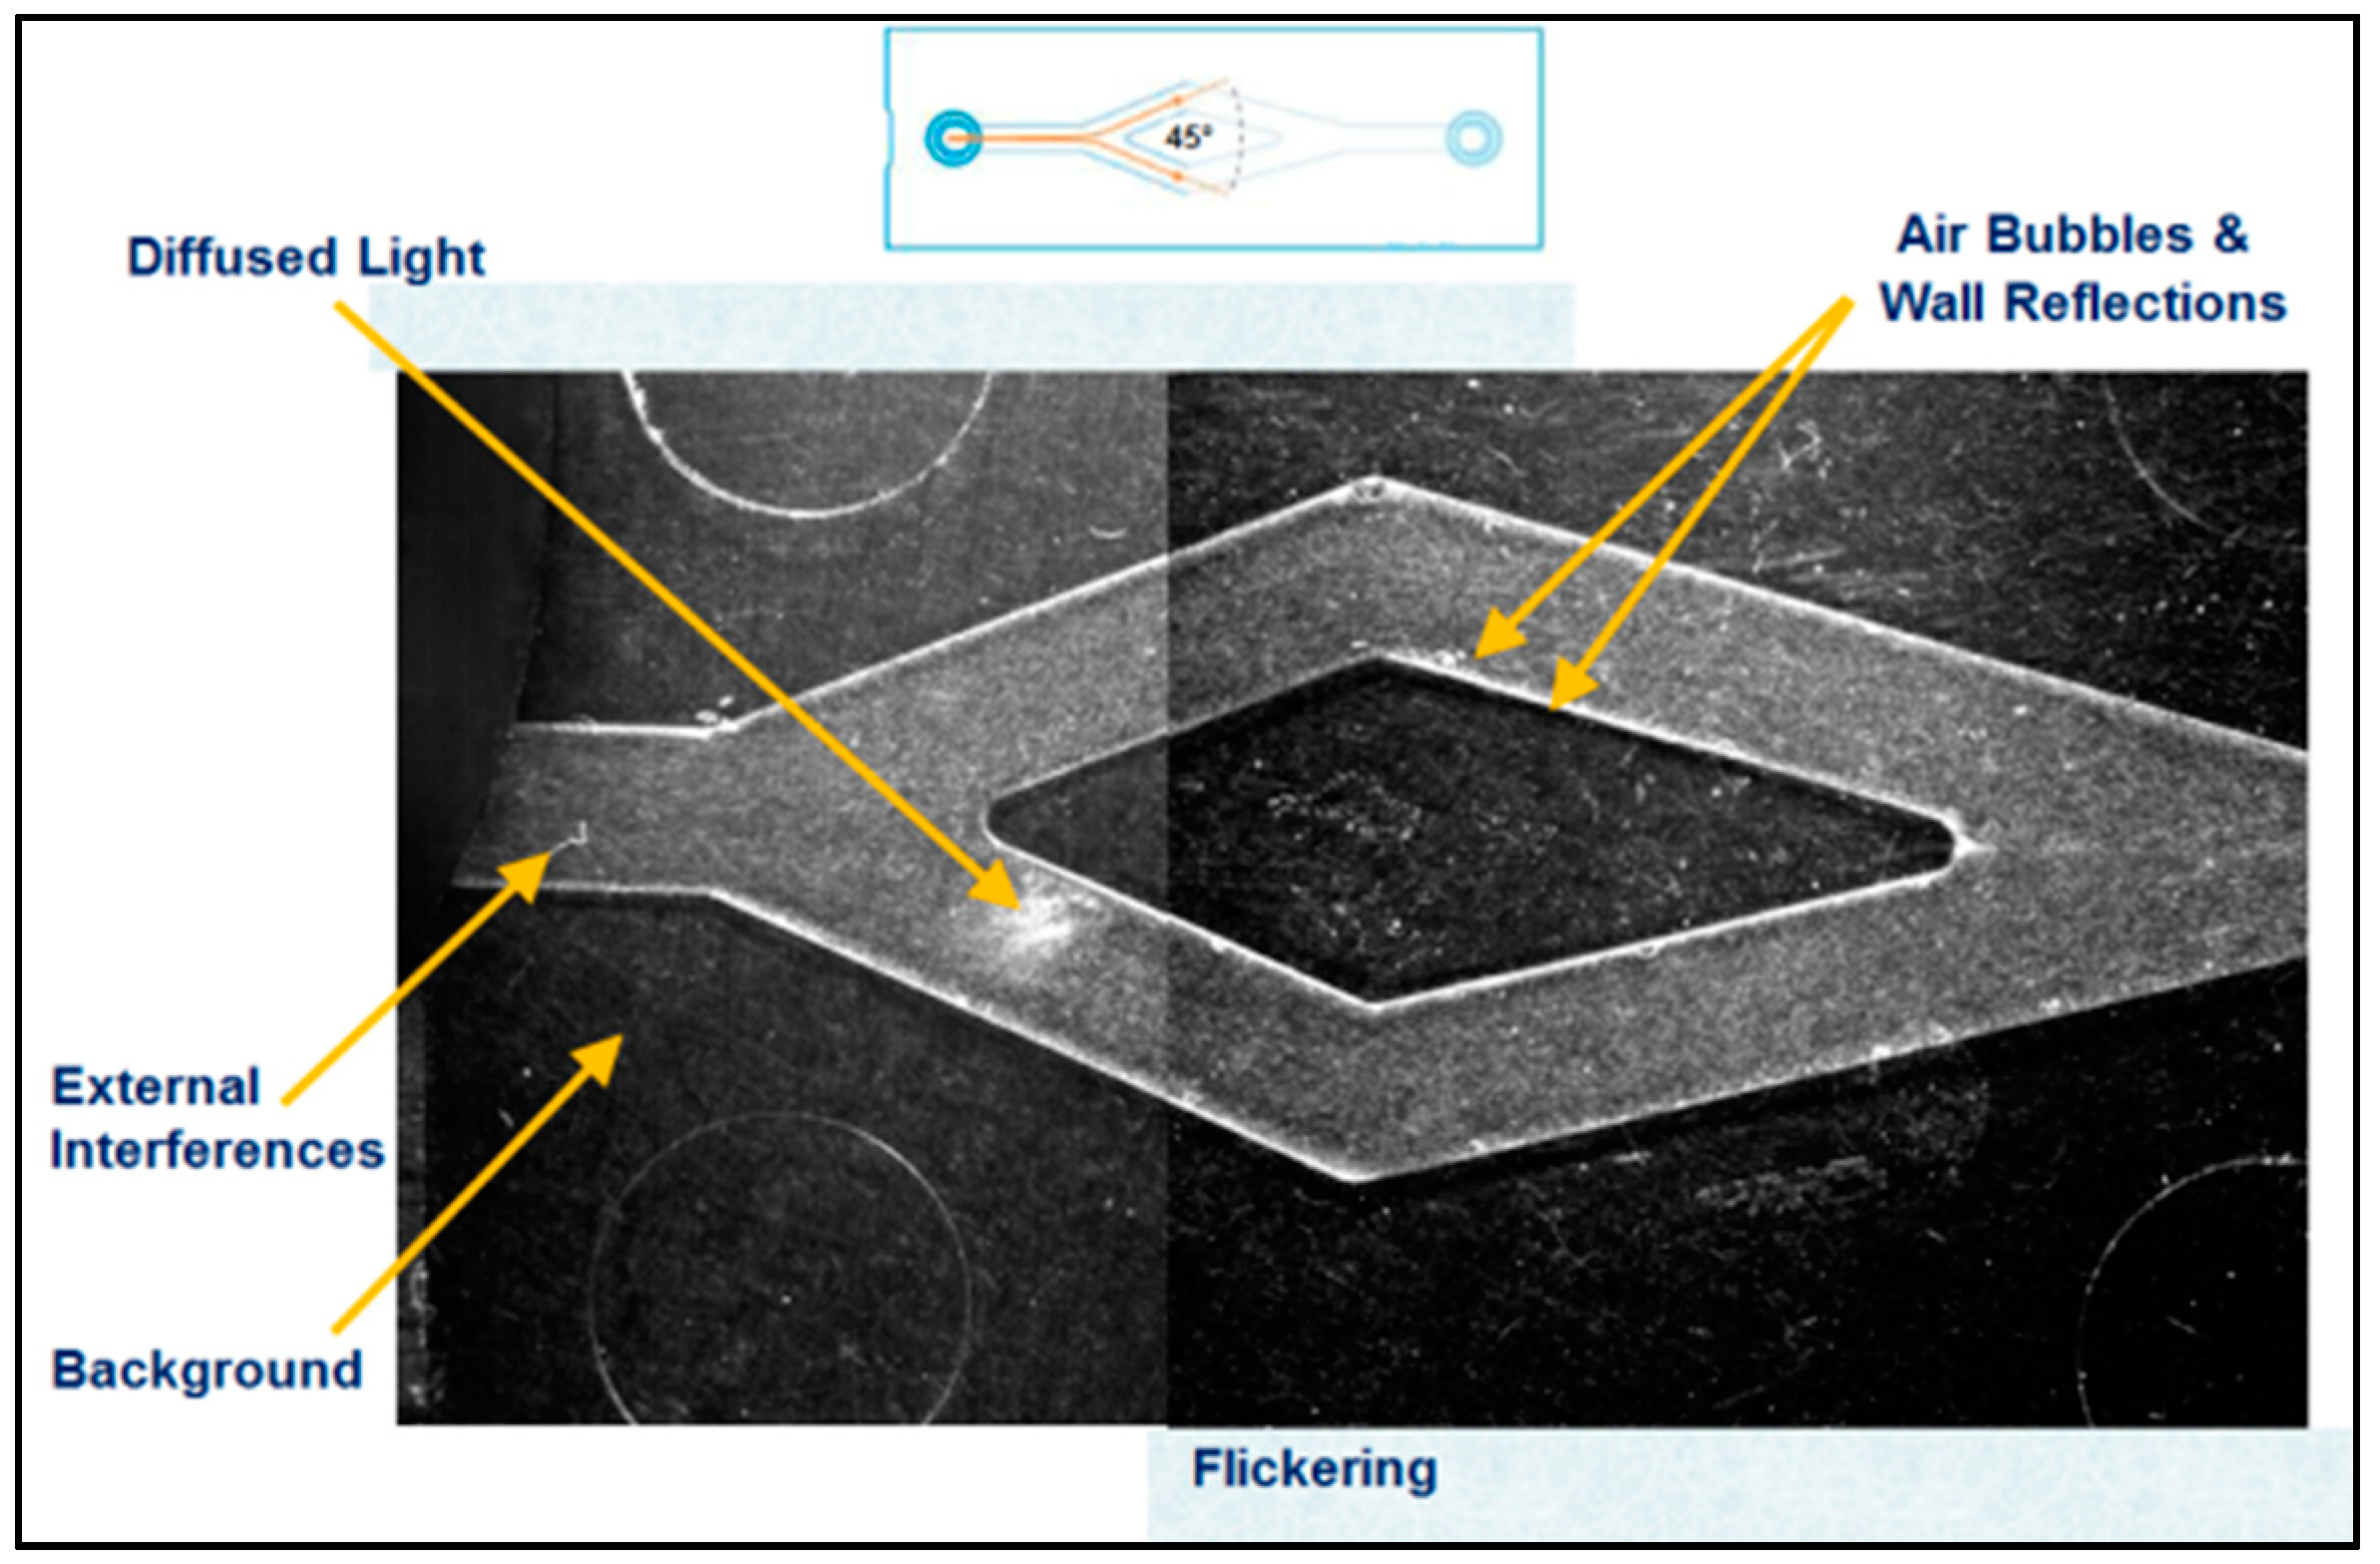
Figure 3.
The schematics of image processing to derive the instantaneous flow vector field. Original image (a), image after subtraction of the minimum and contrast enhancement (b), and the resulting instantaneous vector field with mask (c). Flow is from left to right.
Figure 3.
The schematics of image processing to derive the instantaneous flow vector field. Original image (a), image after subtraction of the minimum and contrast enhancement (b), and the resulting instantaneous vector field with mask (c). Flow is from left to right.
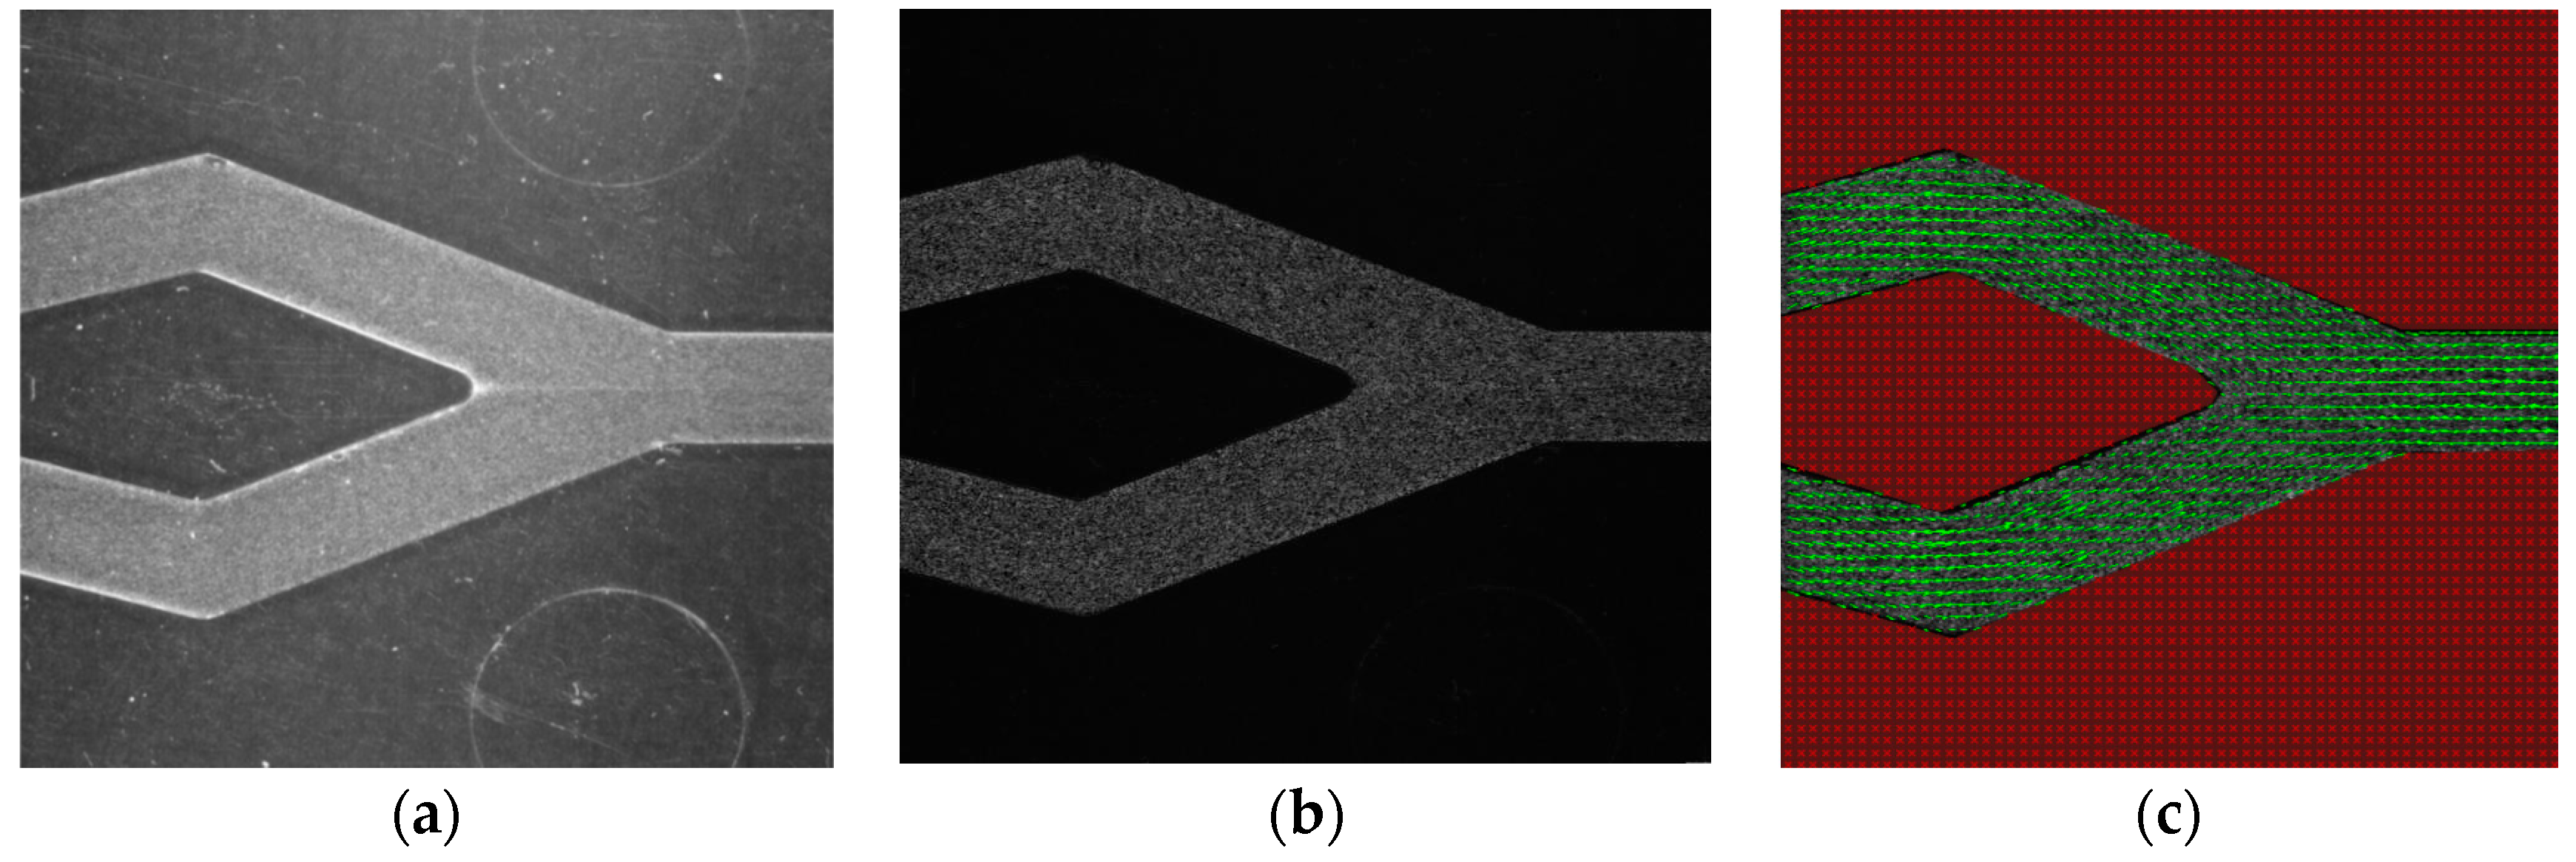
Figure 4.
Color map of axial velocity in the Y channel splitting section for two in-diverging angles, 30° (a) and 45° (b), at a Reynolds number equal to 45. Flow is from left to right. Velocity scale in m/s.
Figure 4.
Color map of axial velocity in the Y channel splitting section for two in-diverging angles, 30° (a) and 45° (b), at a Reynolds number equal to 45. Flow is from left to right. Velocity scale in m/s.
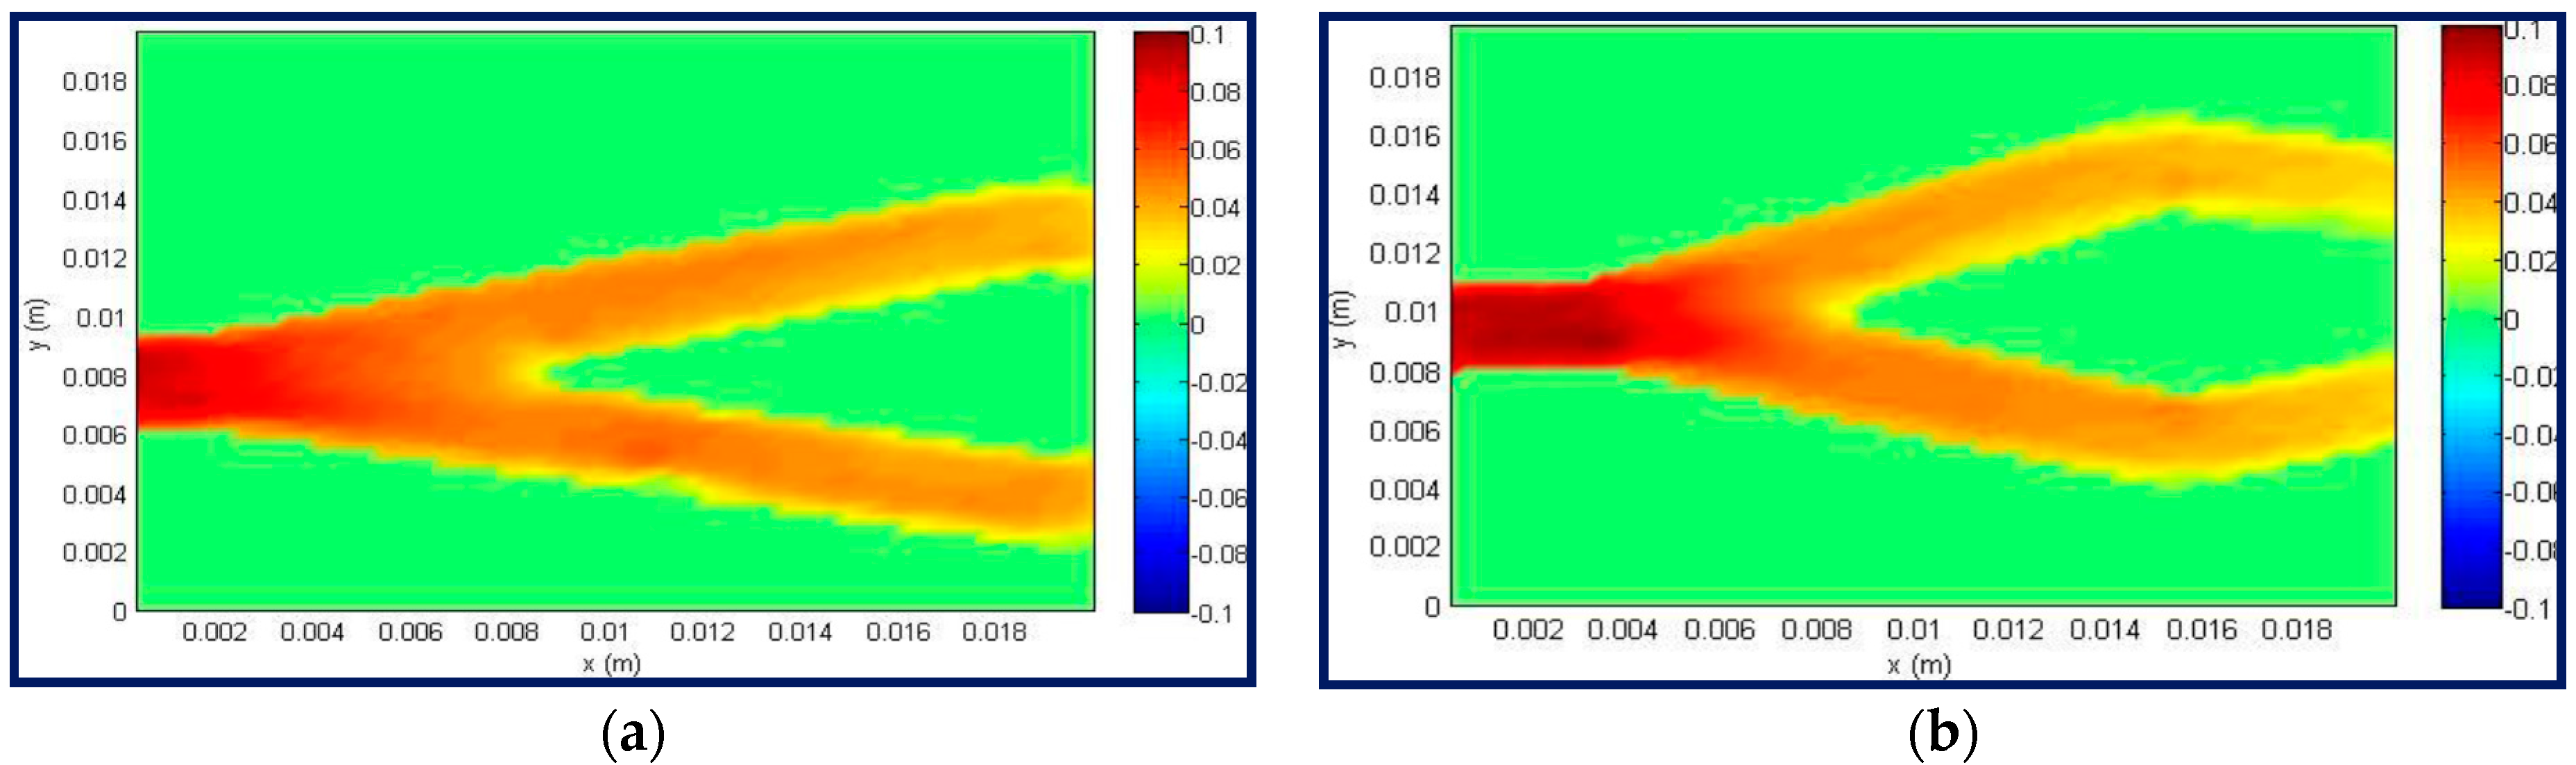
Figure 5.
Color map of the axial velocity in the Y channel junction section for in-diverging angles equal to 30° (a) and 45° (b) at a Reynolds number equal to 45. Flow is from left to right. Velocity scale in m/s.
Figure 5.
Color map of the axial velocity in the Y channel junction section for in-diverging angles equal to 30° (a) and 45° (b) at a Reynolds number equal to 45. Flow is from left to right. Velocity scale in m/s.
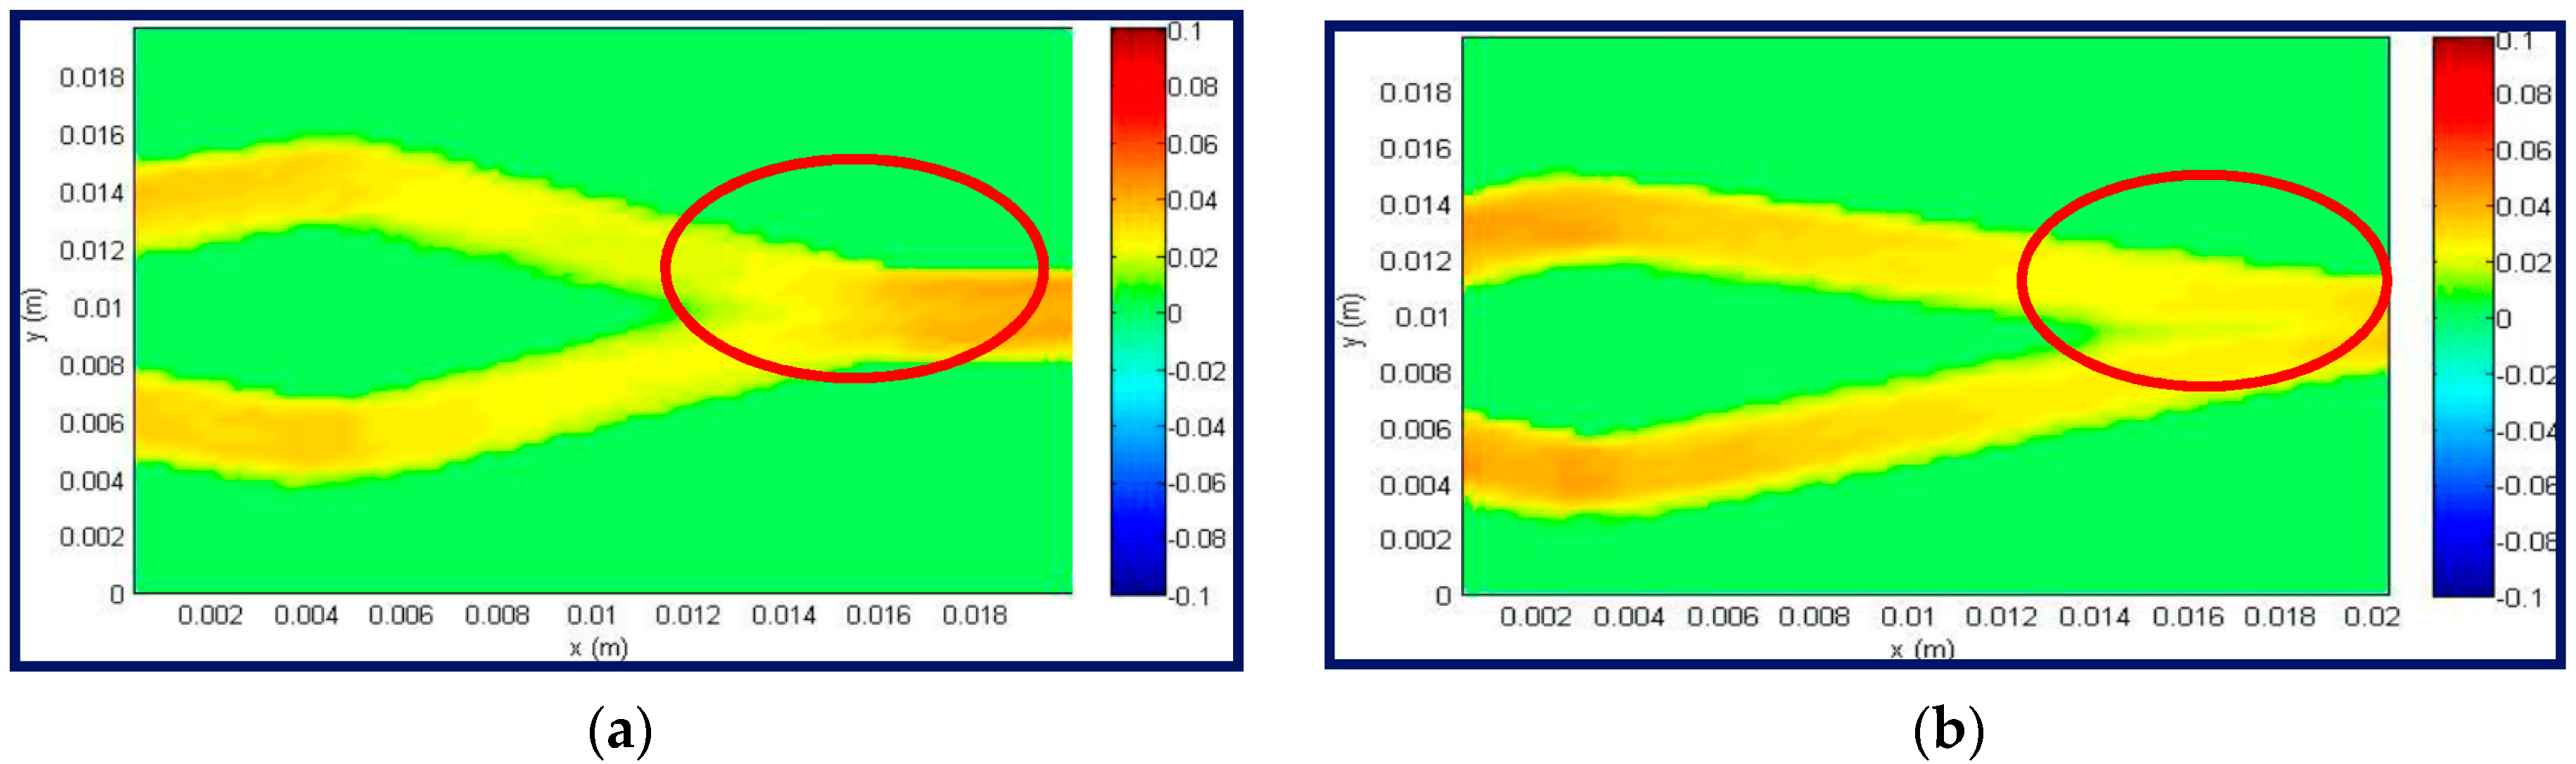
Figure 6.
Axial velocity component profiles in the Y channel junction for an angle equal to 30° (a) and 45° (b) at Reynolds numbers around 30 (green), 45 (blue) and 60 (red). The profiles are taken at the first section after the junction, as indicated by the dotted line.
Figure 6.
Axial velocity component profiles in the Y channel junction for an angle equal to 30° (a) and 45° (b) at Reynolds numbers around 30 (green), 45 (blue) and 60 (red). The profiles are taken at the first section after the junction, as indicated by the dotted line.
© 2017 by the authors. Licensee MDPI, Basel, Switzerland. This article is an open access article distributed under the terms and conditions of the Creative Commons Attribution (CC BY) license (http://creativecommons.org/licenses/by/4.0/).
Share and Cite
MDPI and ACS Style
Sinibaldi, G.; Romano, G.P. Flow Configurations in a Y Splitting-Junction Microchannel. Fluids 2017, 2, 18. https://doi.org/10.3390/fluids2020018
AMA Style
Sinibaldi G, Romano GP. Flow Configurations in a Y Splitting-Junction Microchannel. Fluids. 2017; 2(2):18. https://doi.org/10.3390/fluids2020018
Chicago/Turabian StyleSinibaldi, Giorgia, and Giovanni P. Romano. 2017. "Flow Configurations in a Y Splitting-Junction Microchannel" Fluids 2, no. 2: 18. https://doi.org/10.3390/fluids2020018