Modeling Superparamagnetic Particles in Blood Flow for Applications in Magnetic Drug Targeting


1
Mathematics Department, Princeton University, Princeton, NJ 08544, USA
2
Department of Computer Science, New Jersey Institute of Technology, Newark, NJ 07102, USA
3
Department of Mathematical Sciences, New Jersey Institute of Technology, Newark, NJ 07102, USA
4
Department of Mathematics, Virginia Tech, Blacksburg, VA 24061, USA
*
Author to whom correspondence should be addressed.
Fluids 2017, 2(2), 29; https://doi.org/10.3390/fluids2020029
Submission received: 2 March 2017
/
Revised: 27 May 2017
/
Accepted: 29 May 2017
/
Published: 4 June 2017
(This article belongs to the Special Issue Mechanics of Fluid-Particles Systems and Fluid-Solid Interactions)
Abstract
:Magnetic drug targeting is a technique that involves the binding of medicine to magnetizable particles to allow for more specific transport to the target location. This has recently come to light as a method of drug delivery that reduces the disadvantages of conventional systemic treatments. This study developed a mathematical model for tracking individual superparamagnetic nanoparticles in blood flow in the presence of an externally applied magnetic field. The model considers the magnetic attraction between the particles and the external magnet, influence of power law flow, diffusive interaction between the particles and blood, and random collisions with red blood cells. A stochastic system of differential equations is presented and solved numerically to simulate the paths taken by particles in a blood vessel. This study specifically focused on localized cancer treatment, in which a surface tumor is accessed through smaller blood vessels, which are more conducive to this delivery method due to slower flow velocities and smaller diameters. The probability of the particles reaching the tumor location is found to be directly dependent on ambient factors; thus, diffusion through Brownian motion and red blood cell collisions, different magnetic field and force models, blood viscosities, and release points are considered.
1. Introduction
Traditional drug delivery methods involve the intravenous injection of drugs, which travel through the circulatory system until they are distributed throughout the body. When treating localized diseases, however, this approach is undesirable because a much larger dosage is required for an indicated amount to reach a small area, while the rest of the drug is wasted. Moreover, the toxicity and negative effects of the medication affect the whole body instead of being localized to the target region. These disadvantages are specifically relevant to drastic drug therapy and recent interest and development in cancer treatments such as chemotherapy and IL-2 (interleukin-2).
In response to these issues, renewed efforts in the research and development of this technology have yielded several new methods of drug delivery, namely, magnetic drug targeting, which involves the binding of drugs to magnetic particles that allow the drug to be guided to the area of interest using an external magnetic field. There have been numerous promising trials [1,2] and models of the behavior of ferrofluids intended for applications in retinal detachment restoration [3,4,5], magnetic separation for fluid filtering [6,7], drug therapy for in-stent restenosis [8], and localized cancer treatment [9,10,11,12,13,14] validating the plausibility of this method.
In this study, a mathematical model is proposed that describes the behavior of such particles. Previous research has shown that it is insufficient to only consider the force balance between cross-stream magnetic attraction and drag given a uniform flow across the cross-section of the pipe in light of the significance of diffusion and no-slip near the vessel walls [15,16,17]. As such, studies have evolved from accounting only for magnetic and drag forces [9] to tracking particle trajectories when subjected to an external magnet under power-law flow [10]. Recent models have even considered diffusion and sources of stochasticity with Brownian motion and interactions with red blood cells [11,12].
This study aims to integrate all of the previously mentioned aspects into a single model that considers independent particle trajectories by incorporating the diffusive motion of magnetic particles in response to collisions with red blood cells into a stochastic ordinary differential equation model that accounts for Brownian motion, Stokes drag force, magnetic force, and pulsating power-law flow. As an improvement on the accuracy and applicability of previous models, this study explores various viscosity models and rheology to account for the realistic properties of blood.
To take advantage of magnetic drug targeting, past research has investigated the optimal environment for its usage. It was found not to be conducive to the treatment of internal structures [11] and less effective for drug delivery in large vessels since the particles must overcome a larger distance and stronger flow [12]. Thus, this model focuses on targeting superficial tumors, up to 20 mm deep, accessible through arterioles and venules with low velocities and diameters, according to the extrema investigated, to increase the probability of capture. The advantage of using superparamagnetic particles is that they are characterized by randomly oriented dipoles, until a magnetic field is introduced. When compared to ferromagnetic particles, superparamagnetic particles return to random dipole orientations after the magnetic field is removed from the system. This property makes superparamagnetic particles suitable for biological use because they will not cluster after the drug is delivered and the magnet is consequently removed. The lack of agglomeration is an imperative advantage of paramagnetic particles used in human vasculature as it avoids occluding vessels and blood flow. This model is also flexible and adaptable to different particle, vessel, magnet, and flow conditions and this study describes the effect of variations in parameters such as red blood cell collisions, magnetic moment, and initial injection position on the capture rate. Specifically, the computations show a steep variation in the capture rate due to changes in the magnetic moment within a certain range and demonstrate the importance of the consideration of red blood cells not only as contributors to viscosity, but also as sources of diffusion.
2. Governing Equations
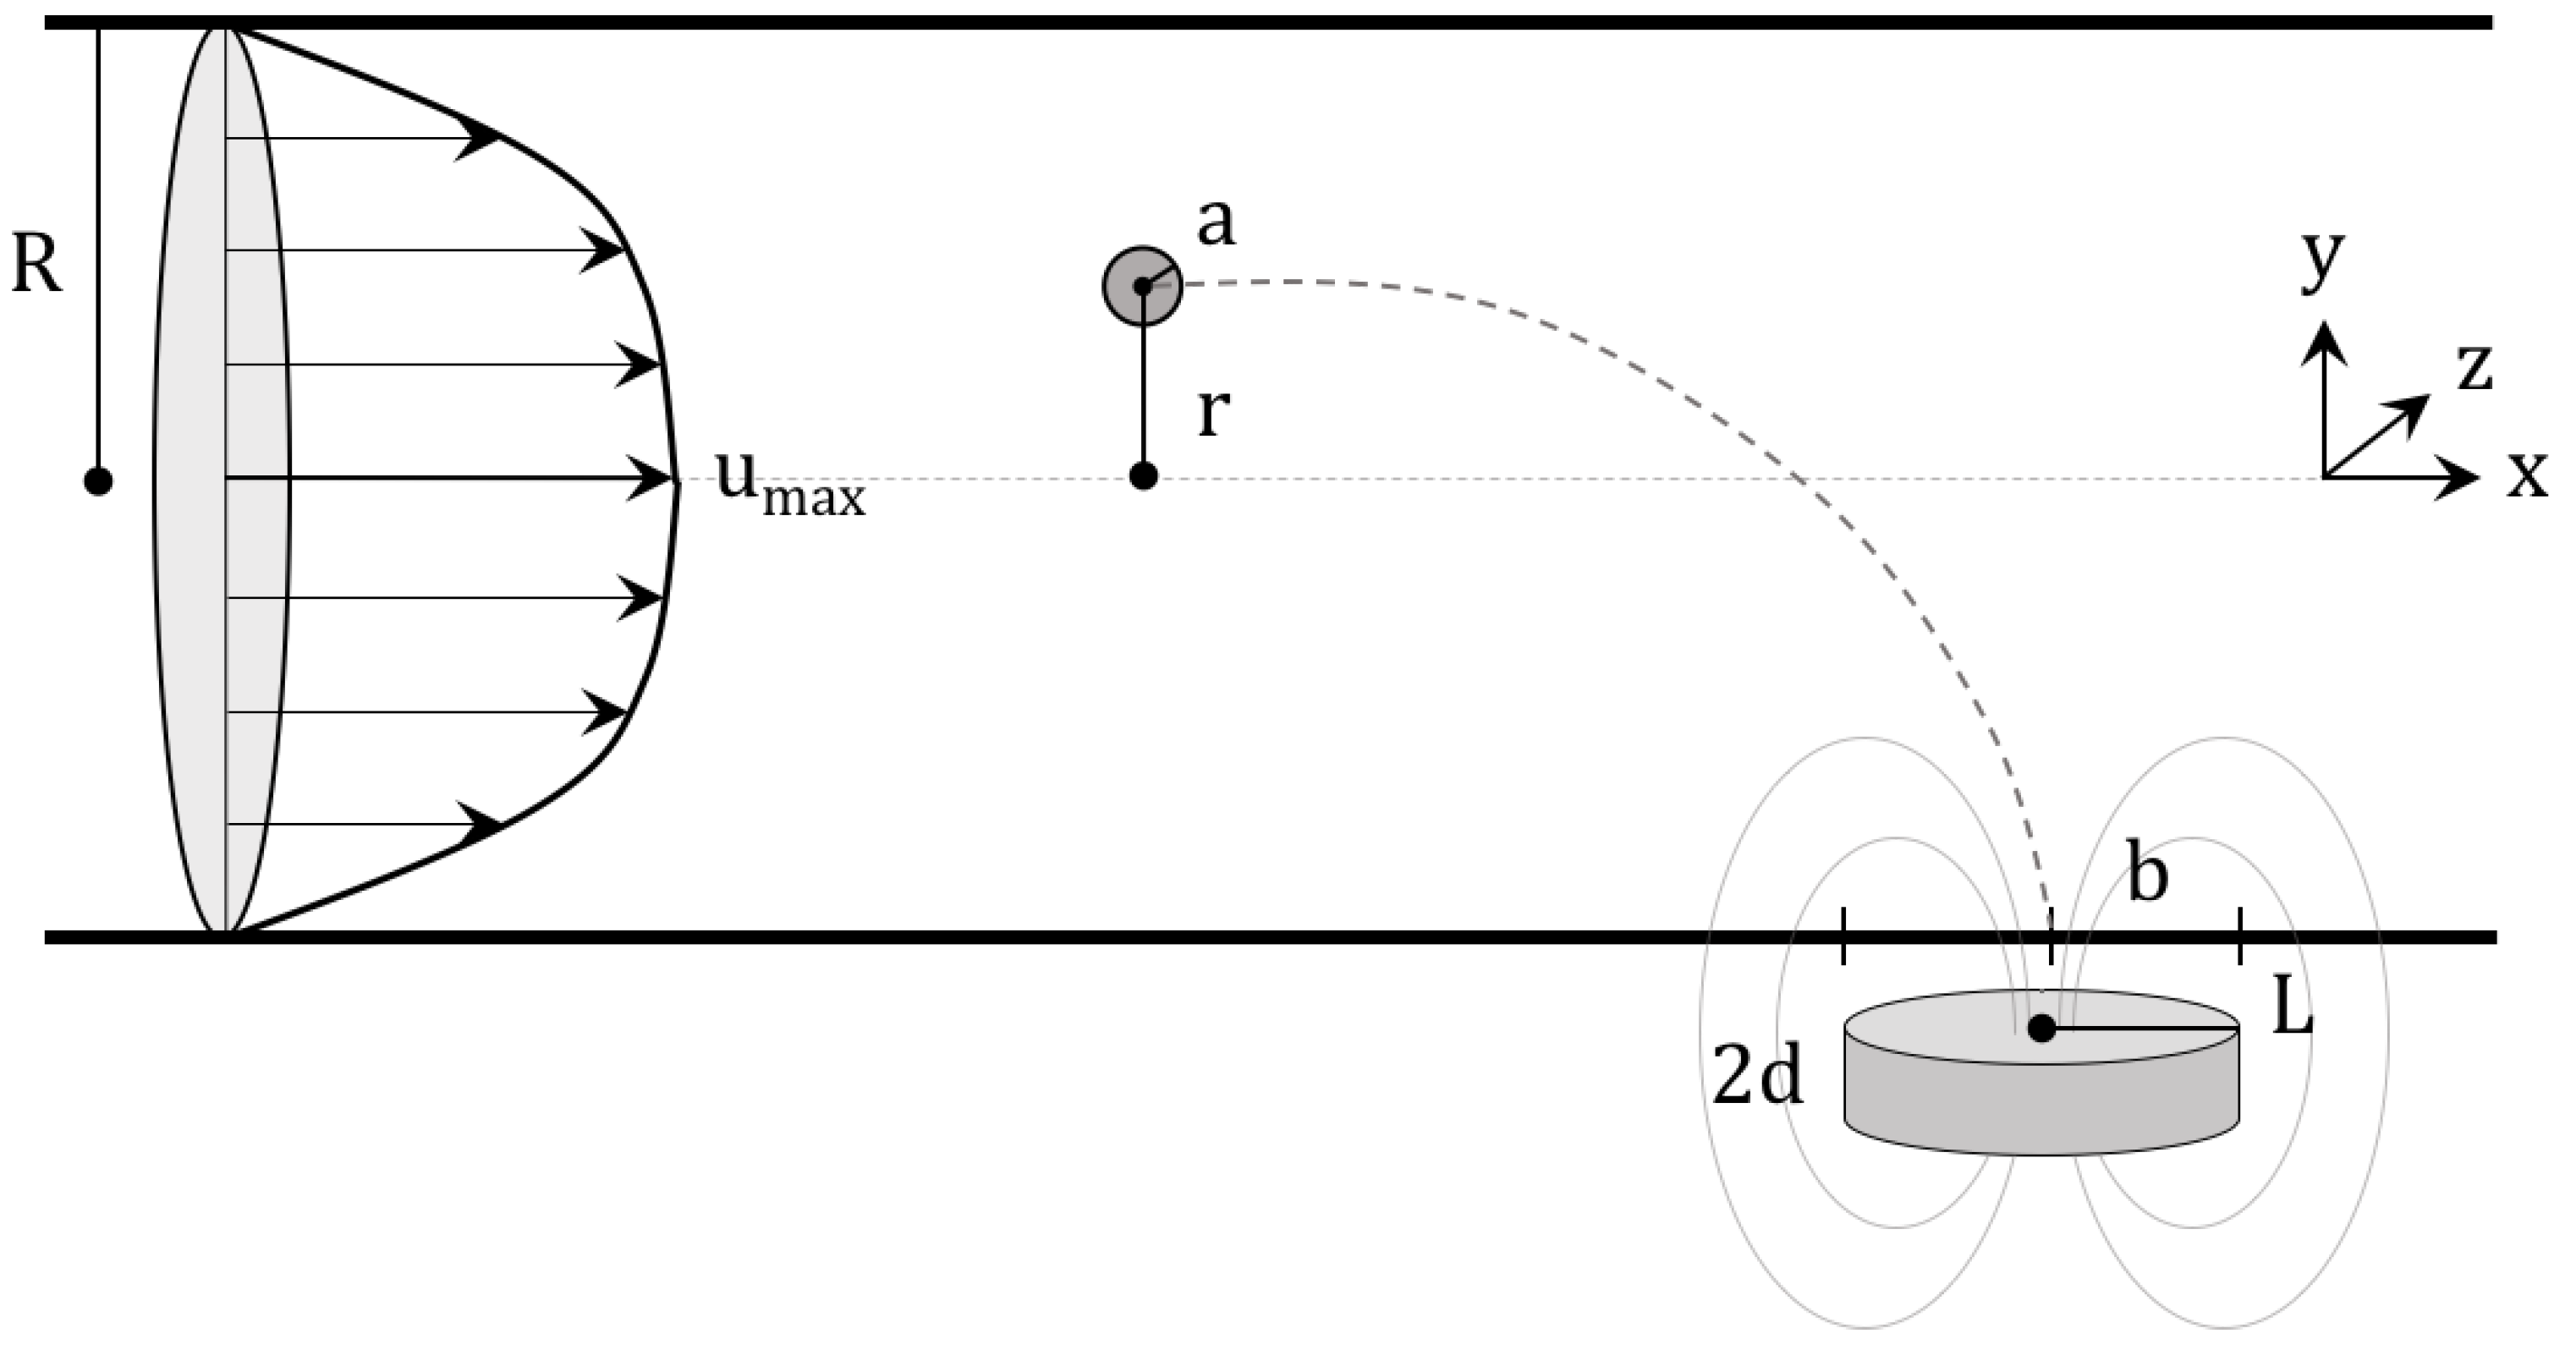
In this study, blood flow is modeled as a pipe flow, with zero velocity in the radial and angular directions. This can be described as shown in Figure 1, where a magnetic particle of radius a is released a distance r from the center of a vessel of radius R to be drawn by a magnet to a tumor of radius b.
The velocity of the fluid in the axial direction is a power-law profile described by the equation
where is the maximum velocity of the blood in the pipe, which occurs at the center () of the pipe, is the oscillatory velocity component, is the oscillatory frequency, n is the flow behavior index, and t is time. Equation (1) offers a general conceptualization of blood flow that accounts for the pulsation from the pumping of the heart. This oscillation is highly relevant in vessels closer to the heart, but the effect of the pulsatile flow decreases in smaller vessels, where viscous forces dominate. The importance of pulsation can be evaluated using the Womersley parameter, , which scales the inertial force of oscillation and viscous force [18]. Since magnetic drug targeting focuses on small topical vasculature, however, the oscillatory component is relatively small so that is negligible in vessels where magnetic drug targeting is effective. That is, in vessels of the size addressed in this paper, the value of is on the order of according to , where R is the relevant distance metric, m for the radius of the vessel considered in this study; is the angular frequency of the pulsatile flow, approximately 1 Hz for the average person; is the density of the fluid, on the order of kg/m for whole blood; and is the dynamic viscosity of the fluid, for which kg/ms is used as an order of magnitude approximation since it is relatively accurate throughout most of the vessel (and does not significantly affect the Womersley parameter since is rooted). Thus, since is small, much less than 1, the pulsatile frequency is sufficiently low that the flow is practically in phase and the velocity profile develops within each period so that can be neglected for the vessels considered. Similarly, it should be noted that settling is not included in the model, as the sedimentation velocity is on the order of m/s according to , where is the difference in the densities of the particle and fluid, which is on the order of kg/m; g is gravitational acceleration; a is the radius of the particle, m in this paper; and is the dynamic viscosity of the fluid, which, as before, is on the order of kg/ms. As such, the effects of settling are negligible for the purposes of this paper. With these factors accounted for, the model is appropriately simplified and questions regarding the motion of particles in these vessels can be addressed.
As the particle travels through this fluid, a drag force is generated, leading to the following force balance:
where is the velocity of the particle relative to that of the blood and D is the drag coefficient. Due to the low Reynolds number and the small size of the nanoparticles relative to the vessel, the forces on the particle are local. That is, when the differential equation for the balance between drag and external forces is solved for the velocity, the time constant is extremely small, indicating that the terminal velocity is reached nearly instantaneously. As such, it can be reasonably assumed that the particle travels at the terminal velocity, , that satisfies Equation (2) and that the drag on individual particles can be expressed as Stokes drag
in which is the dynamic viscosity of the blood.
For the attraction of the particle to the tumor location, this study considers a point dipole as an intermediate for the construction of the field for a cylindrical permanent magnet. The magnetic field, denoted by , is related to the inductance, , according to . Here, is the permeability and can be expressed as in terms of , the magnetic susceptibility, which is assumed to be constant.
To begin, we represent a point dipole magnet with some magnetic moment m. The scalar magnetic field potential can be obtained from
where is the magnetic moment vector and is the vector pointing from the point dipole to the center of the nanoparticle. This potential field yields the following equation for the induced magnetic field
The point dipole is then placed some distance d from the blood vessel to represent the size of the magnet.
The cylindrical magnet, which is more practical both because it is more realistically conceivable and because it produces a stronger field, can be imagined as many dipoles integrated over the volume of the magnet. For a cylindrical magnet with a height of and a radius of L, then, the strength of the magnetic field is given by
where is a scalar that corresponds to the strength of the magnet and h is the vertical distance measured from the surface of the magnet [19]. This paper uses two separate equations to obtain the magnetic force acting on the particle. The first is given by
with signifying the particle’s magnetization and V the volume of the particle [10]. The Clausius–Mossotti formula for a spherical particle is then used to produce a uniform magnetization throughout the particle
from which the following force equation follows:
The second magnetic force model is derived from the equation:
A Langevin function can then be used to relate to , so that
where is the Boltzmann constant, T is the temperature measured in Kelvin, and is the magnetic saturation of the particle, given by
where is the density of the magnetic particles and is the mass saturation magnetization [5].
The representation proposed here also utilizes multiple viscosity models: power-law, Cherry [12], Carreau [20], and constant viscosity. The Cherry model is based on a fit to empirical blood viscosity data, but the analytical expressions of the other models can be represented meaningfully. The power-law model is given by
where is the flow consistency index. Next, the Carreau viscosity model is defined as
where is the viscosity at infinite shear rate, is the viscosity at zero shear rate, and is the relaxation factor. In both, is the local shear rate, which can be expressed as
from the definition of the shear rate as the gradient of the velocity profile. When all of this information impacting the potential motion of a particle through the vessel is combined, including the fact that the particles are sufficiently small that diffusion becomes important, it yields a Stochastic Differential Equation (SDE) that can be developed to realistically model the trajectories of the particles. The SDE has the form
where is the drift of the particle, is a standard Wiener process random variable, and . The drift is the sum of the velocity of the blood flow, , as defined in Equation (1), and the terminal slip velocity and is therefore given by
As for the other term in the equation, is the diffusion matrix of the SDE, which is defined as the root of the variance J. The variance accounts for both Brownian motion, which is modeled as
and the diffusion due to collisions with red blood cells, which is modeled as
where is the radius of red blood cells and is the local shear rate. This equation is well established for calculating the flux due to a sheared suspension of an inhomogenous distribution of particles [12,21]. The diffusion is thus defined as
where is the 3-by-3 identity matrix.
3. Results and Discussion
To be explicit, in the following numerical analysis, experimentally-derived values are taken for some of the constants in the following analysis to not only display general trends within the model, but also to provide numerical simulation of realistic proportions. The advantage of this is to both verify the consistency of the simulations with measured values from previous experiments as well as to produce estimates for quantities that are, practically, extremely difficult to measure. Some universal constants that are used include m for the tumor radius, the release location as m upstream from the tumor from the center of the vessel (except when a distribution of starting positions is applied), m as the radius of the vessel consistent with venules and arterioles, as desired, and particle radius of m consistent with commercially available products and previously conducted theoretical studies [10,22].
3.1. Viscosity Models
The behavior and properties of blood are unique relative to each patient. In order to account for the variability of blood viscosity, several models are incorporated to examine the effect of altering viscosity on the effectiveness of the drug delivery: power-law, Cherry, Carreau, and constant viscosity models. It is immediately clear from Figure 2a that the model preserves the intuitive behavior of blood as a shear-thinning fluid and of its flow in the vessel, with logically decreasing viscosity as the shear rate increases, or as the radial distance from the center of the blood vessel increases. Moreover, as shown in Figure 2b, the models are all internally consistent in terms of the trend and end behavior of the relationship between shear rate and viscosity.
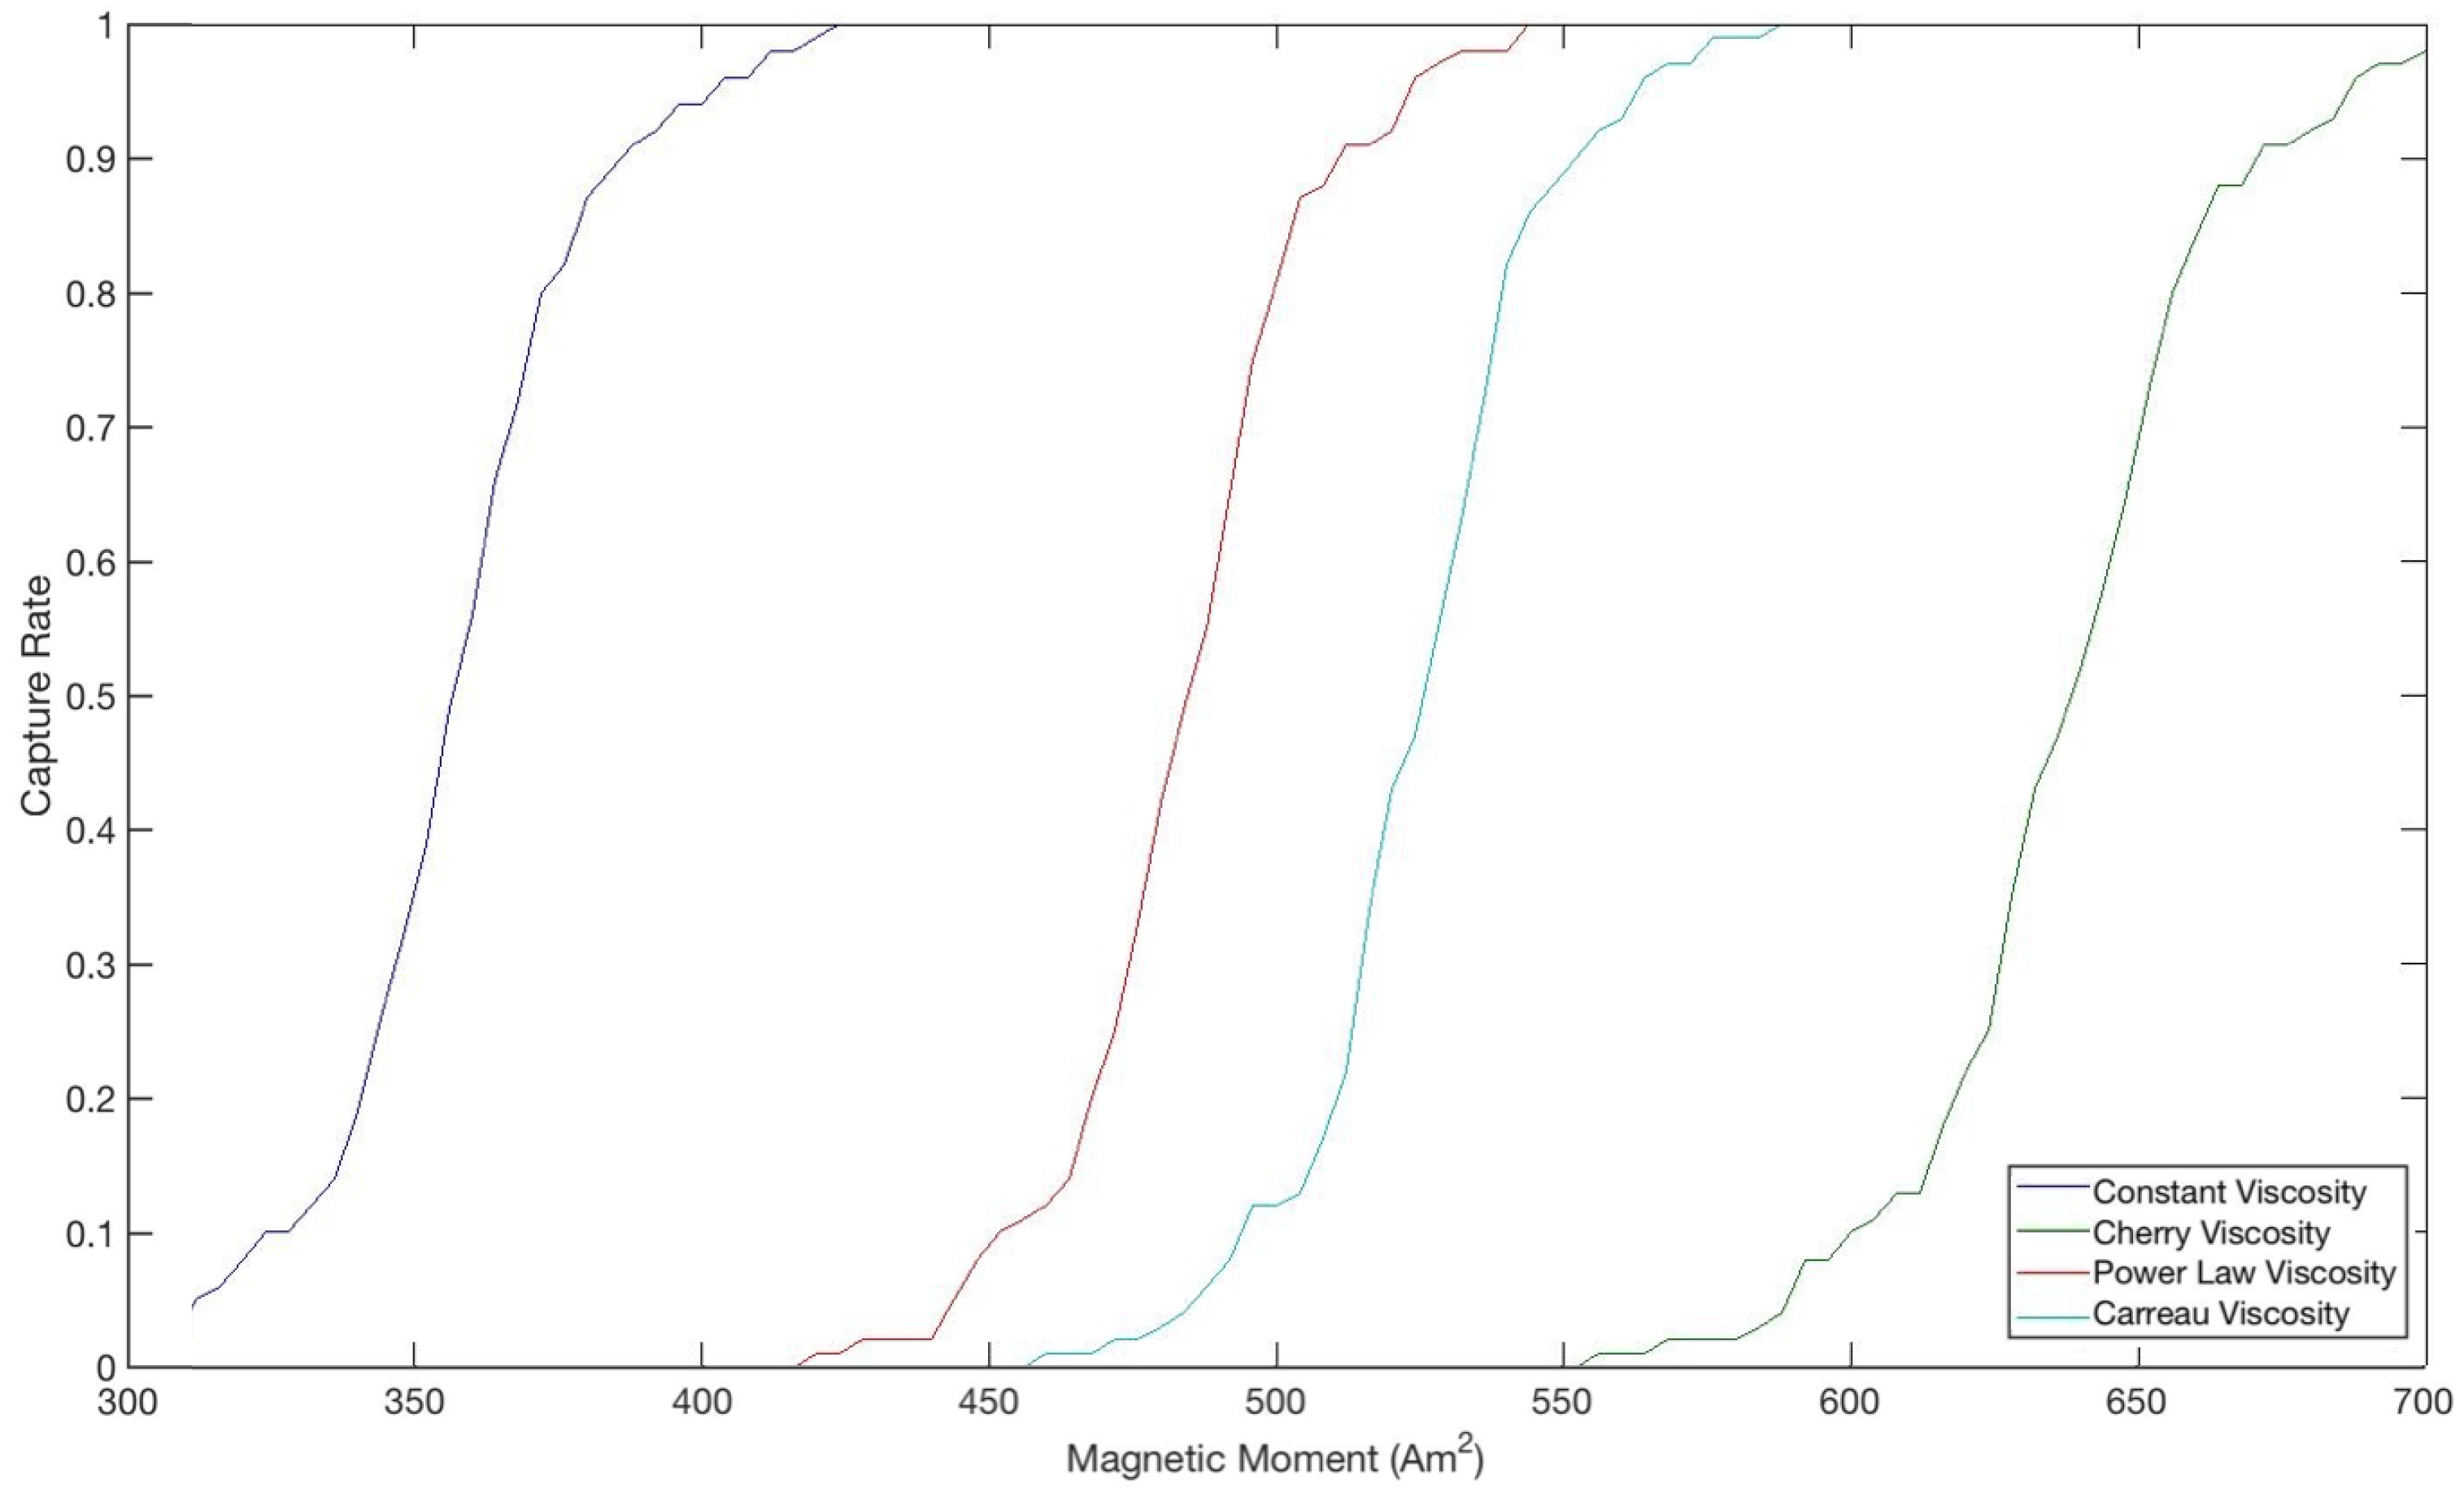
As can also be seen, both the shear rate and viscosities, and specifically the value the viscosity approaches as the shear rate increases, are consistent with average statistics and measurements that have been made in human vessels of this size. From the juxtaposition of Figure 2 and Figure 3, it can be deduced that lower viscosities lead to higher capture rates, as they do not supply as much resistance to the path of the particles toward the tumor and thus do not require as large a magnetic force when compared to higher viscosities. The shape of the curves in Figure 3 is also very suggestive in terms of the variation of the capture rate due to changes in magnetic moment within a certain range. Although this range differs for each viscosity model, the overall trend is consistent, showing a steep variation in the capture rate due to small changes in the magnetic moment within a certain range. That is, for example, decreasing the magnetic moment by about 60 Am lowers the capture rate from 90% to 10% irrespective of the viscosity model despite the offset among them. This implies that, especially with limitations on the strength of the magnet, there exists a tradeoff and, presumably, an optimal magnetic moment that would produce the highest capture rate without incurring unwanted costs. However, the implication is bidirectional in that not only does this seem to suggest that very small changes in the magnetic moment around the capture rate mark will improve the performance of the drug therapy greatly, but also that it may be difficult to get into the range in the first place and small inaccuracies or deviations in the magnetic moment may drastically diminish the capture rate.
It is useful to observe that since the behavior of the viscosity models is nearly identical for the purposes of this paper, and share the core characteristics (shape, asymptotic behavior, etc.), generality is not lost when using the Cherry model with throughout the rest of the paper, as it is the most computationally simple. Additionally, it should be noted that it has been shown that blood viscosity can be reduced with magnetic fields [24], and one limitation of this model in representing the behavior of blood during magnetic drug targeting is that it does not consider this effect. This is an interesting point for future study, as the decrease in viscosity will lead to less interference in the trajectory of the particle and, potentially, an increase in capture rate. Nevertheless, the effect described is expressed in the magnitude of the viscosity, while the relative properties and flow behavior of the blood should be conserved and still be consistent with the model presented in this paper.
3.2. Magnetic Field
Magnetic drug targeting relies on an external magnetic field to guide particles to the target location. Logically, this magnetic field has a significant effect on capture rate. Two magnetic models were considered in this study: point dipole model and cylindrical magnet model, with the behavior of the point dipole used mainly to inform on that of the cylindrical magnet, as a composition of dipoles. For , 1 T was used as an order-of-magnitude estimate for the magnetic strength, with as presented in Equation (6). With a dipole magnet, the smallest possible magnetic moment to yield a 100% capture rate for a particle with a radius of m is found to be about 730 Am. When the particle radius is m, the minimal magnetic moment for a 100% capture rate is about 365 Am. By extrapolating from this data, the particle radius and the magnetic moment are found to be inversely proportional to one another when keeping a constant capture rate.
When comparing the point dipole magnet and the cylindrical magnet, the cylindrical model obviously maintains its strength over a larger distance than any one of its component dipoles and can thus attract particles farther away from the tumor. To ensure a capture rate, with a cylindrical magnet and red blood cell collisions, the magnetic moment necessary is 766 Am, or the thickness of the magnet can be increased to about m at the original magnetic moment of 730 Am. The benefit of modeling the cylindrical magnet as the sum of many dipoles over a volume rather than as an abstraction with one strong dipole is that it maintains the integrity of the field over the entire tumor. Furthermore, the slow degradation of the field of the cylindrical magnet as compared to the dipole causes the slip velocity to be strong further form the tumor so that the capture rate is improved.
3.3. Release Point
A major concern with the magnetic attraction of particles injected into a vessel is the ability to capture the particles successfully regardless of their position on a cross-section of the vessel as the drug dissipates and mixes with the blood. In a basic situation, the particle is released at location (−0.01 m, 0 m, 0 m), which is located at the center of the vessel, one centimeter away from the origin. When the injection site is moved further on the x-axis from the tumor site and at the top of the vessel with respect to the center, expressed by the coordinates (−0.06 m, 0 m, 9 × m), the capture rate is zero. This decline in capture is due to diffusion since the particles are at the furthest possible location from the target and have a greater probability of collision with the top of the vessel wall, causing its motion to stop due to the no-slip model implemented in this study. In this situation, there is also more distance to overcome, and the center of the vessel, where the blood flow is strongest, must be crossed. Alternately, when the z-value is zero, the particles are located at the center of the vessel, allowing for more flexibility regarding injection farther on the x-axis from the tumor site. In fact, when released at the center of the vessel, particles as far as m from the center of the tumor are successfully captured. The closer particles are injected to the tumor, the larger the probability of capture, but to a certain degree. When released too close to the target, there is not enough time for the magnet to attract the particle for capture, and the particle is whisked away before it reaches the tumor.
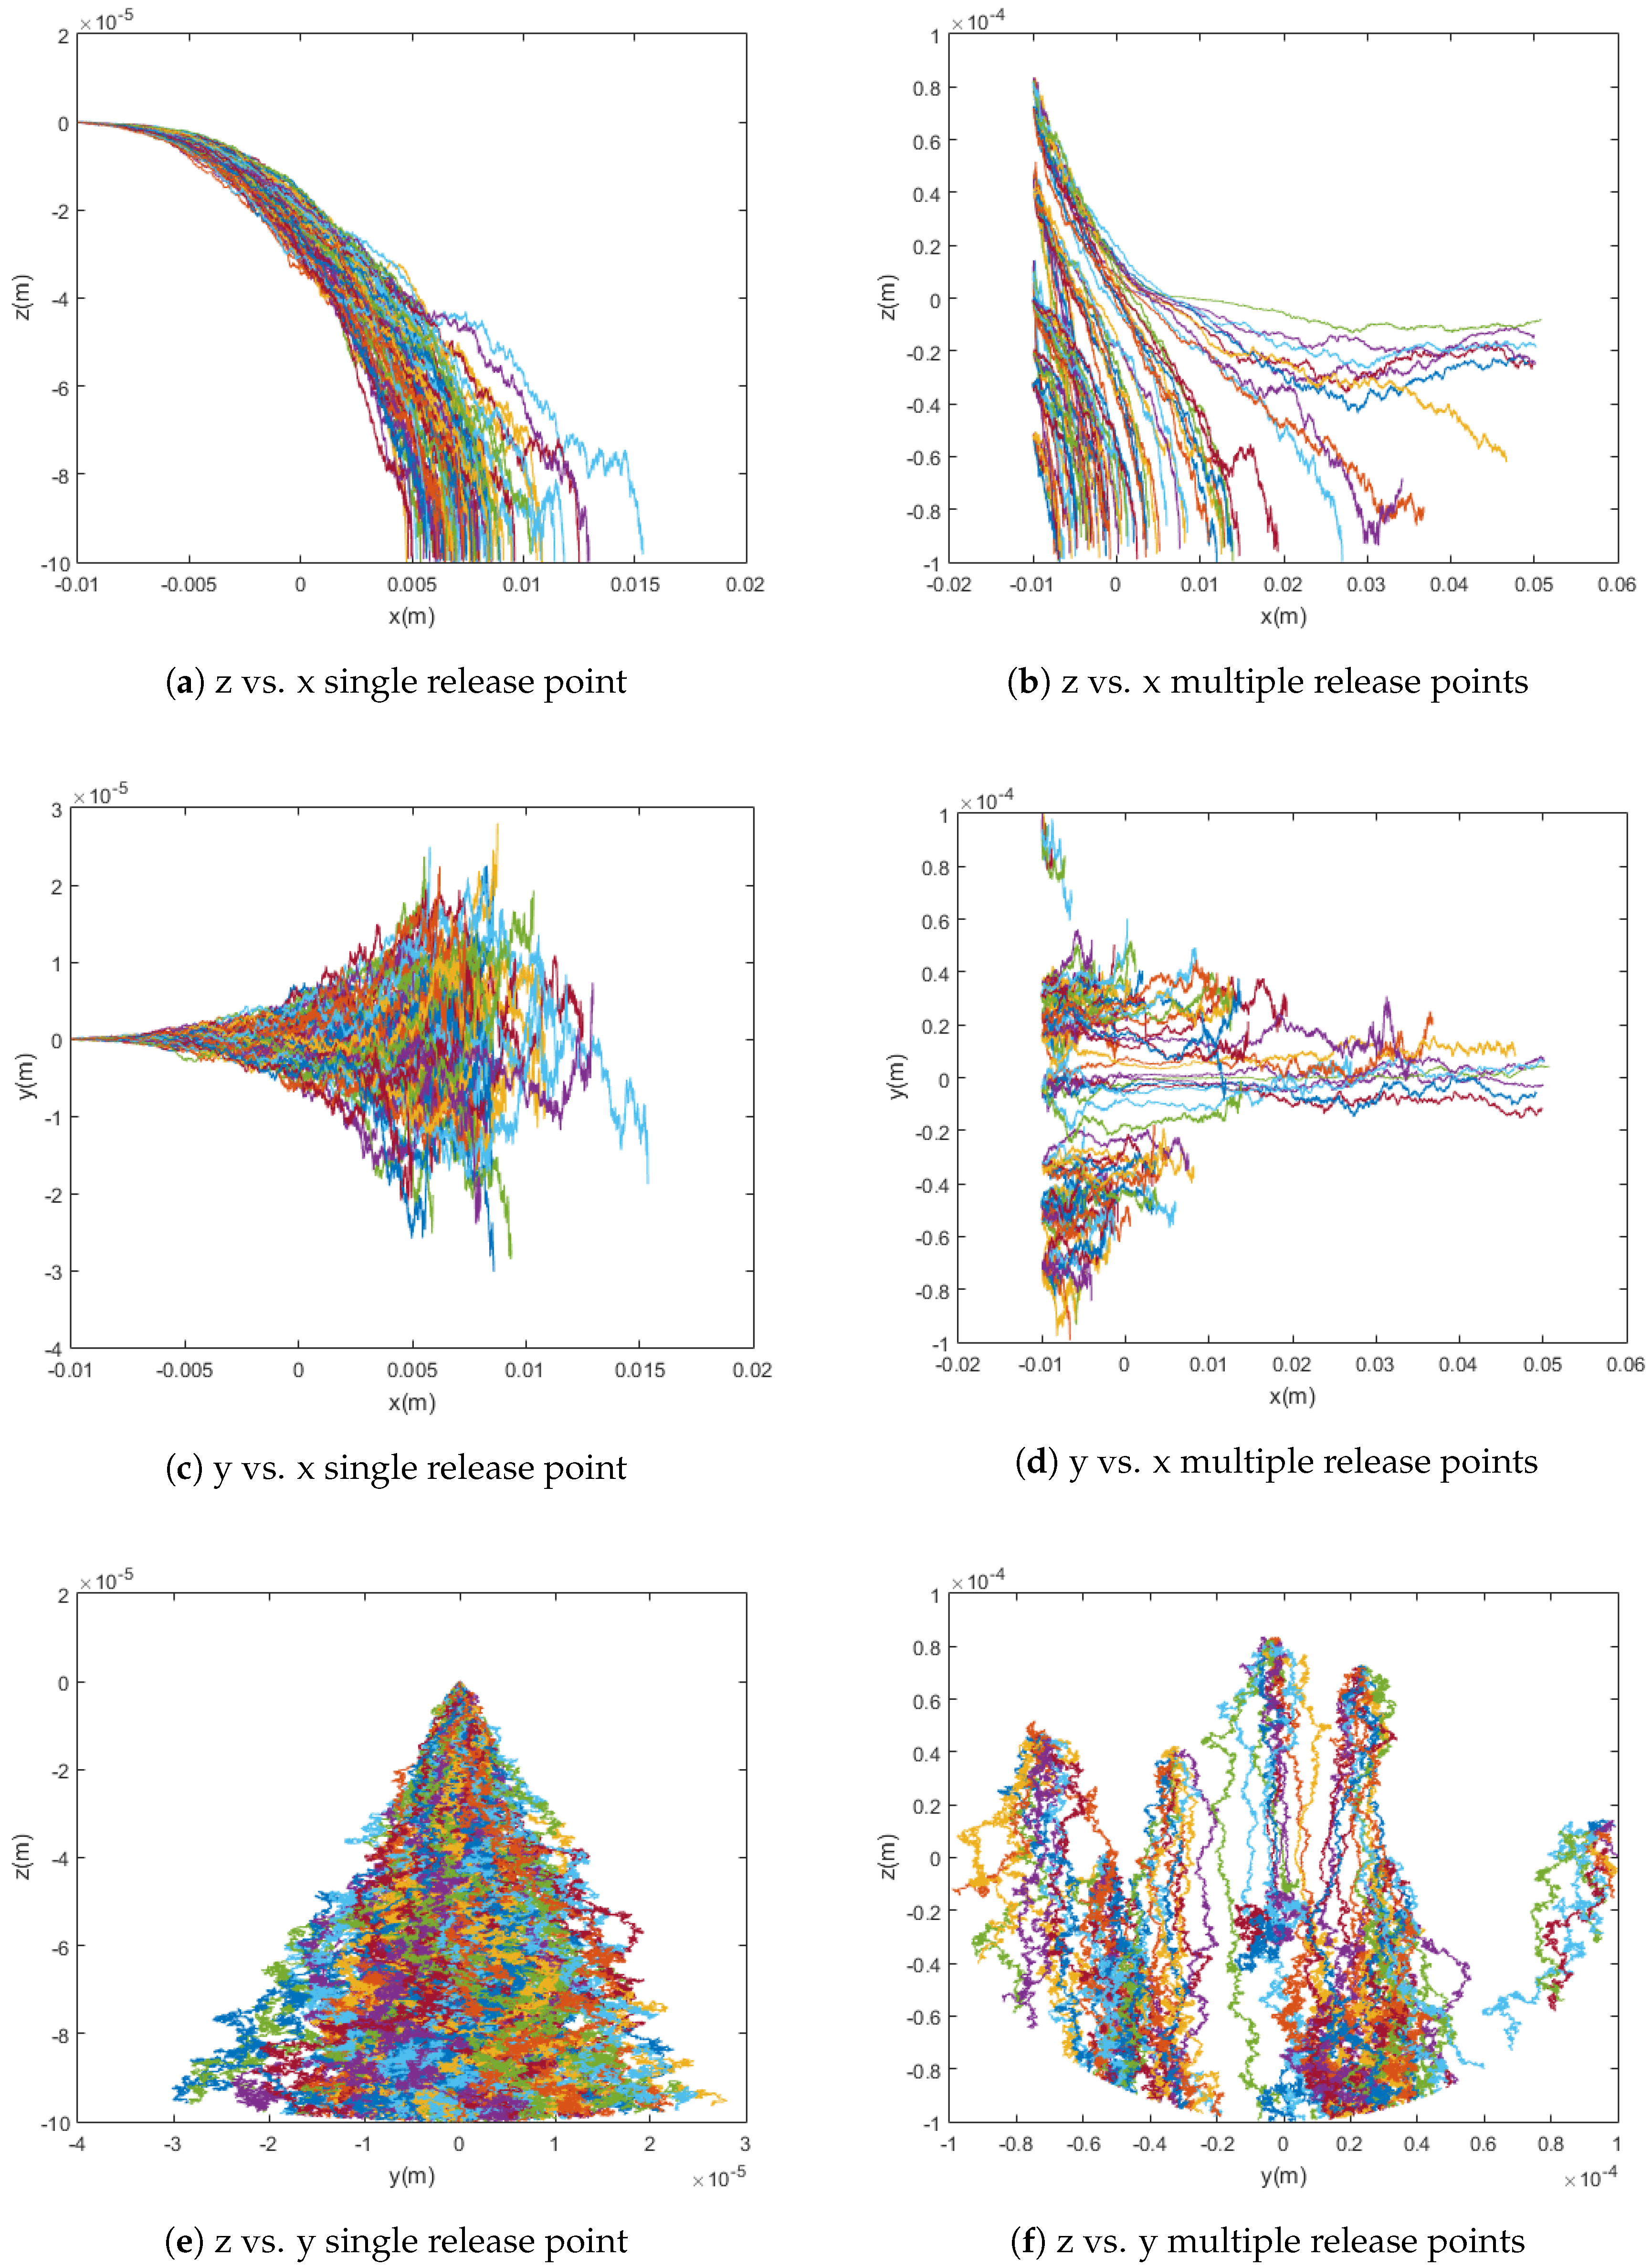
In practice, when the drug is injected into the bloodstream, it spreads out over the cross-section of the vessel, at various z and y values. To model this more realistically, random initial release points were incorporated into the trajectory simulations to determine their effect on capture rate. The particles are released at random uniformly distributed points within a spherical region whose radius is equal to that of the blood vessel. This and its effect on the capture rate can be seen in Figure 4 below.
In a simulation using the point dipole model with Am, changing the release point from a single release point to randomly distributed release points changed the capture rate from 91% to 81%. In this case, the cloud release method centered at the middle of the vessel yields a slightly lower capture rate than the single release point method due to the optimal initial placement of all simulated particles in the latter method when compared to the random distribution of the former.
3.4. Red Blood Cell Collisions
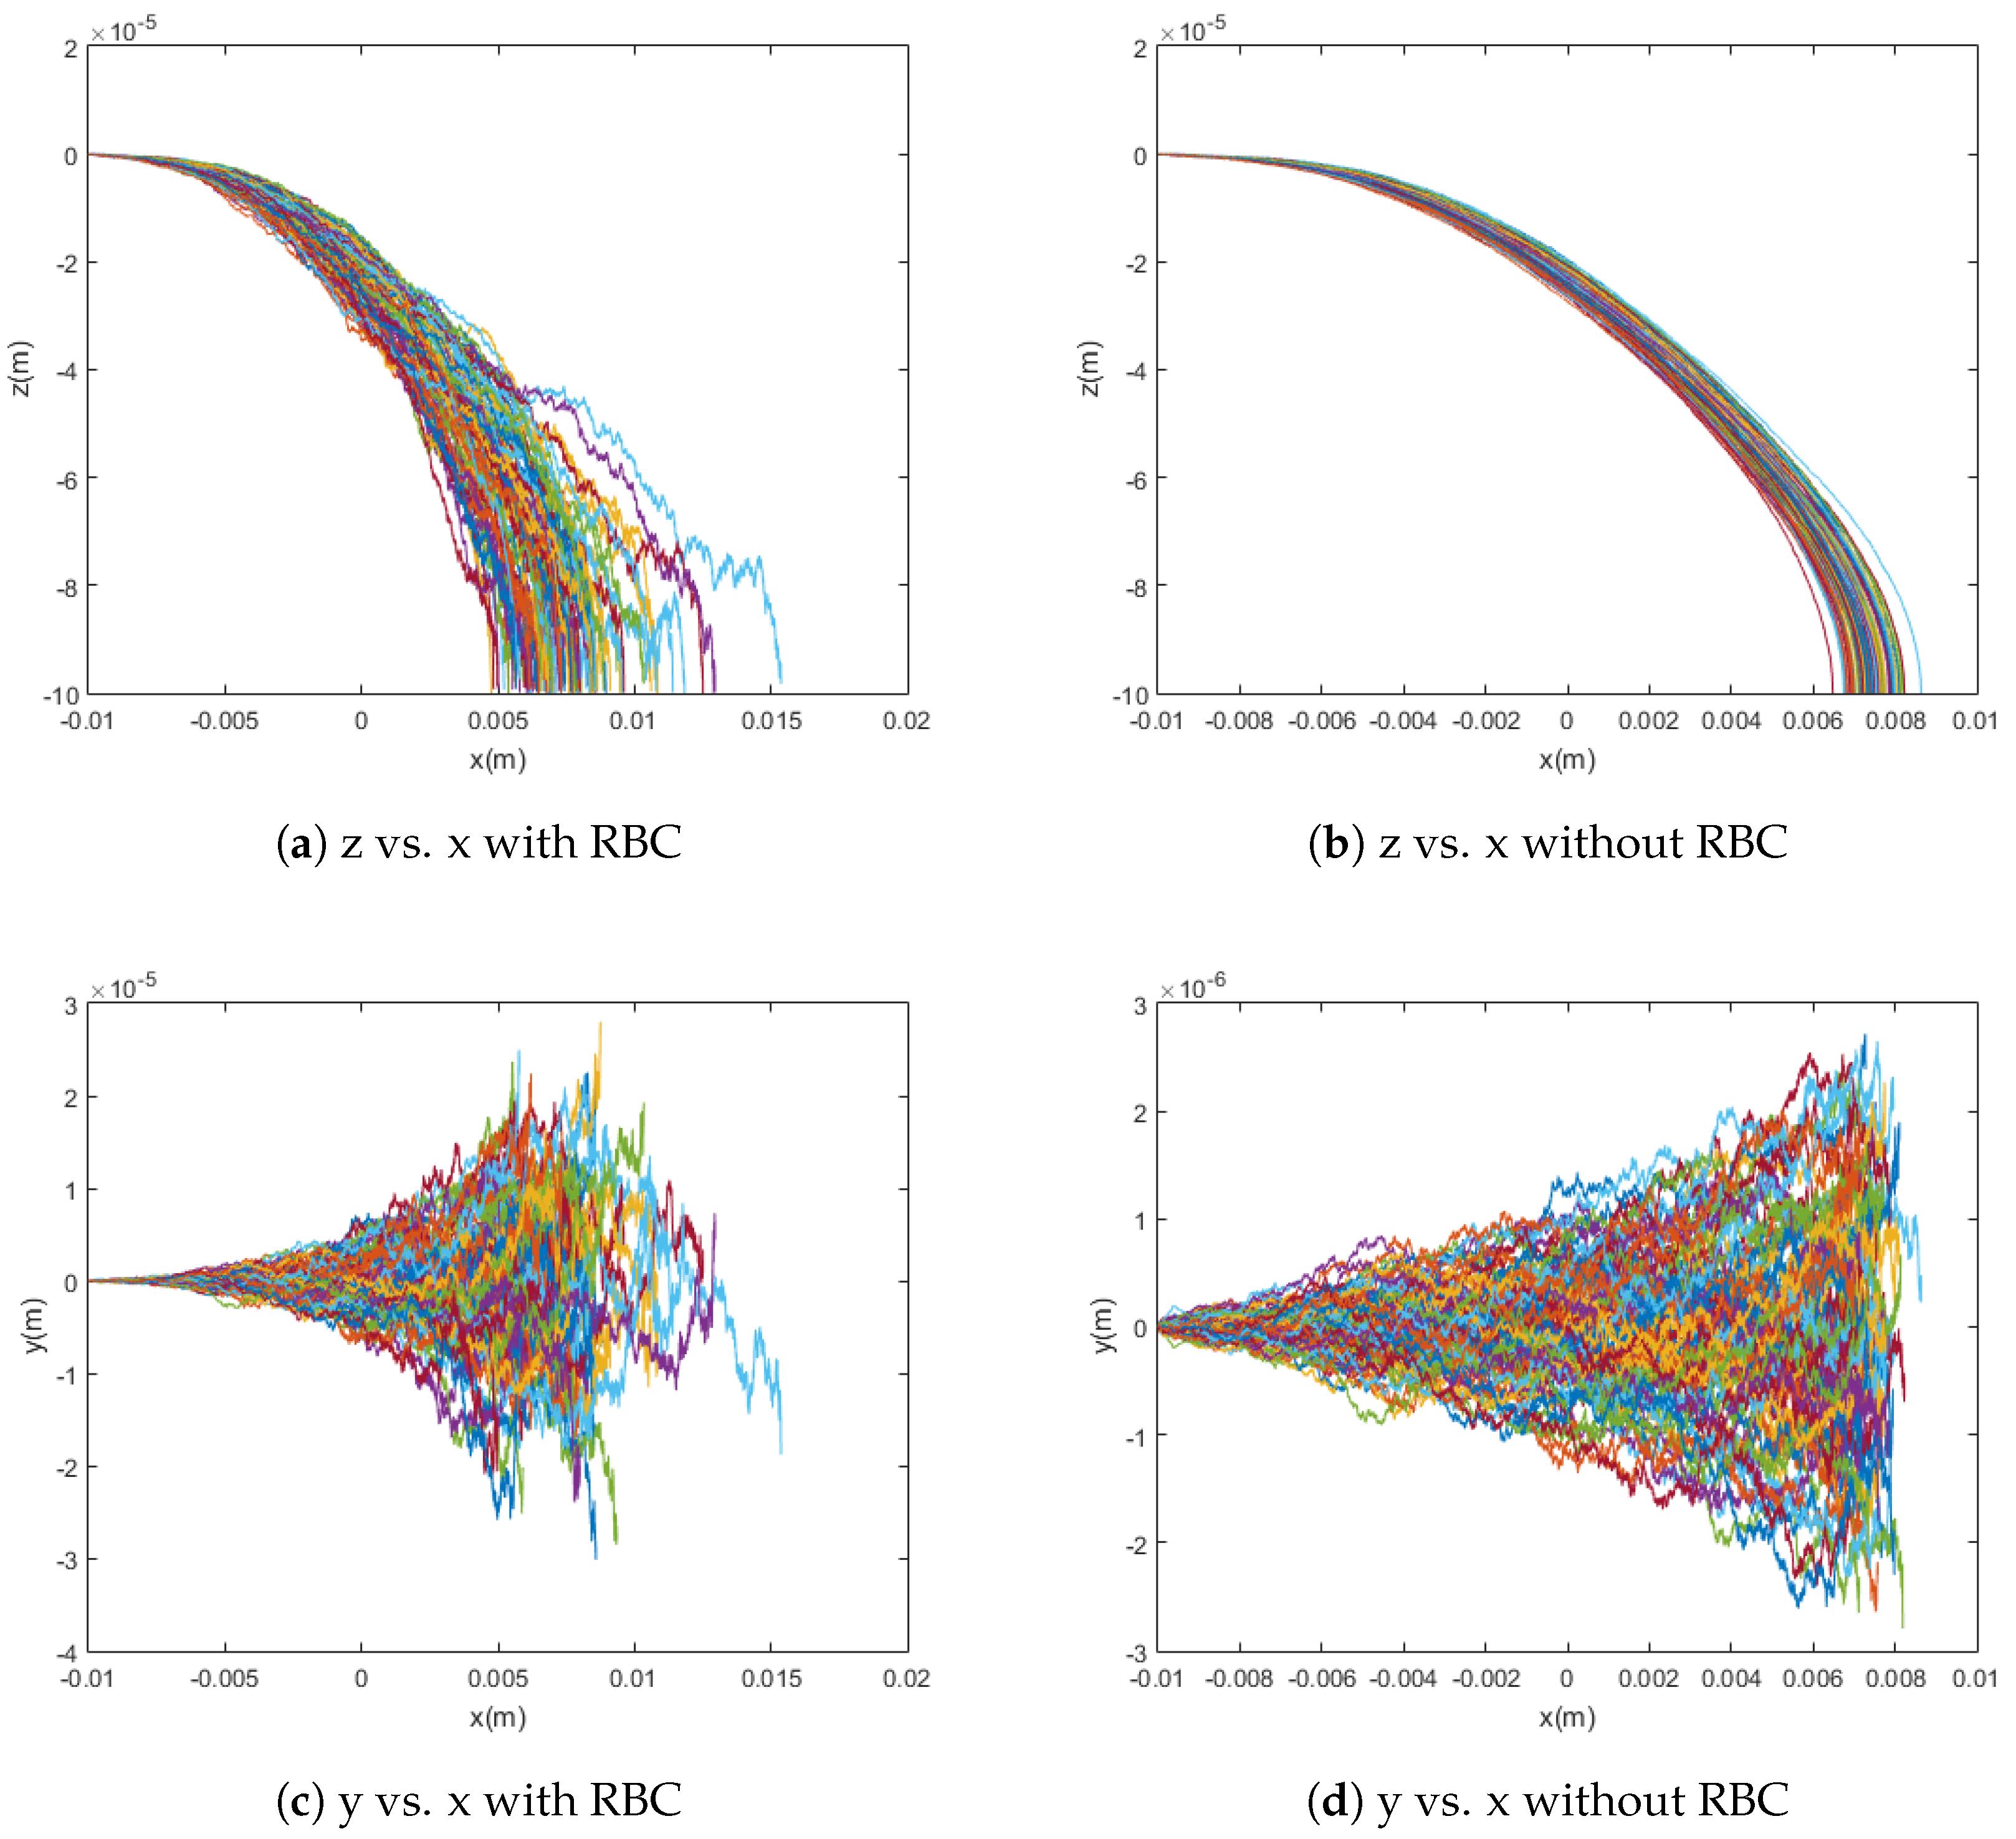
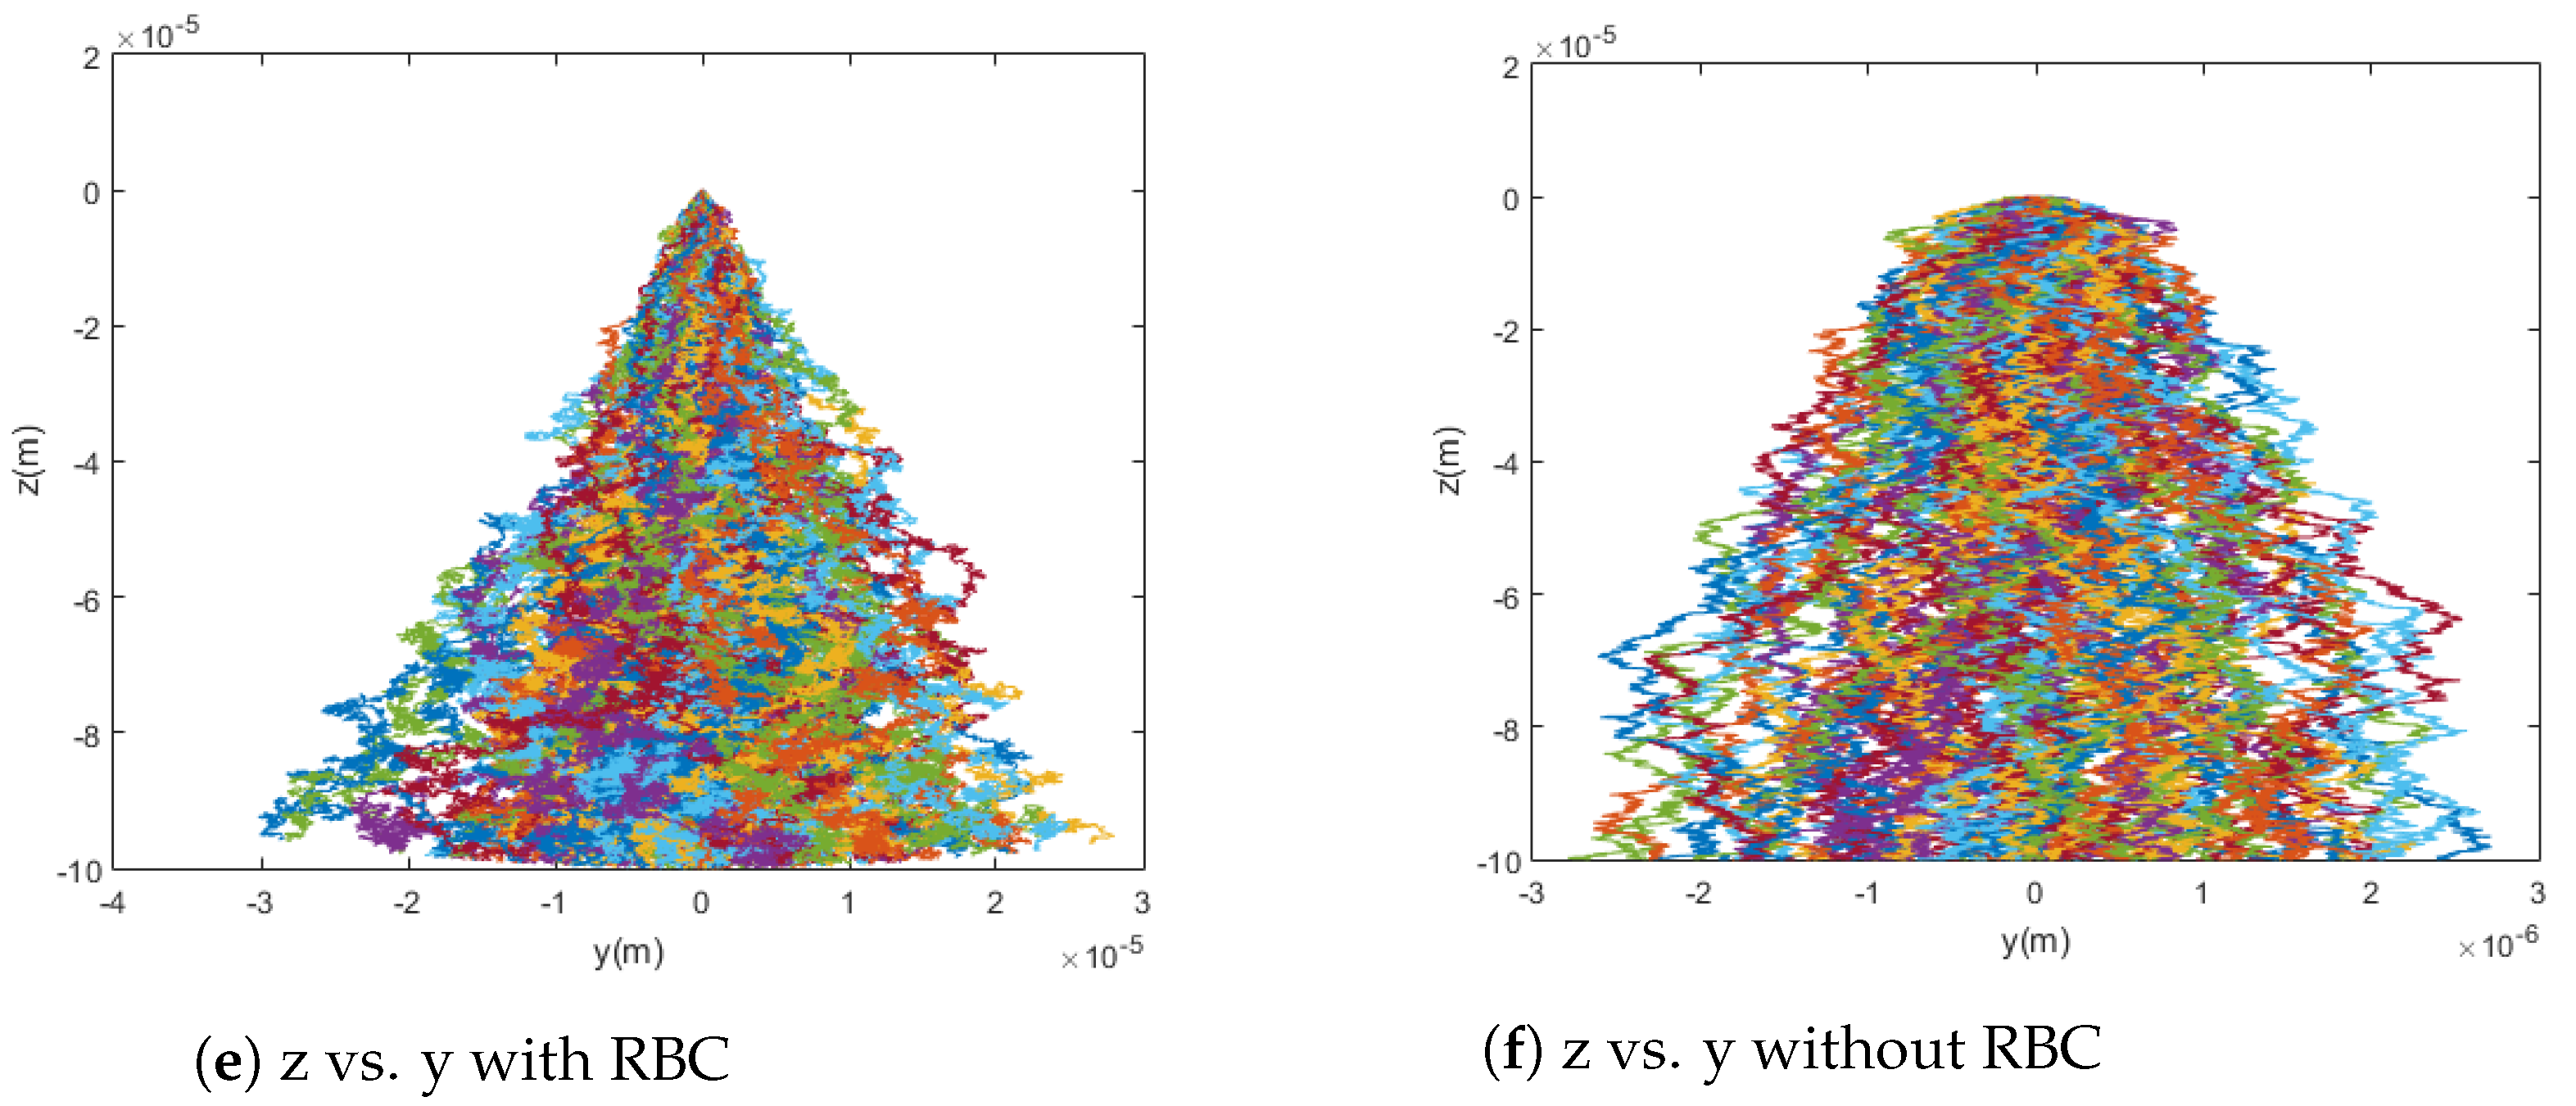
By comparing Equations (19) and (20), it can be shown that, in a typical case, the diffusion due to collisions with red blood cells (RBC) significantly overpowers standard Brownian motion. This fact is confirmed by the model presented in this paper and shown in Figure 5. When the particles are simulated without any diffusion, with only Brownian motion, and with only red blood cell collision diffusion, it can easily be seen that the difference in capture rate between the first and third cases is much greater than the difference in capture rate between the first and second cases. That is, the capture rate is much more dramatically affected by the introduction of red blood cell collisions than by that of Brownian motion. Even conceptually, the scale for red blood cell collisions is larger and its effects are much less local as compared to the relevant dimensions for Brownian motion. This highlights the need to consider the effects of red blood cells as sources of diffusion in addition to their impact on the viscosity of blood. That is, the viscosity models implemented in this paper and previous work have been adapted to treat blood as a homogeneous fluid while capturing its shear-thinning behavior, which is dictated largely by the radial distribution of cells across the flow in vessels. However, as can be seen from the trajectories and differences in capture rates shown in Figure 5—for example, the red blood cells also have significant impact as sources of collisions. For these reasons, though the stochasticity from Brownian motion is incredibly important for the modeling of the trajectories of these particles, it alone is insufficient and, based on the significant effect of the diffusion due to collisions with red blood cells on capture rate, red blood cell collisions must also be taken into account for a model to be considered accurate.
4. Conclusions
In this study, the motion of superparamagnetic nanoparticles in a pressure-driven pipe flow directed by an extracorporeal magnet is analyzed. The governing equations are modeled to visualize particle trajectories and compute capture rates in an attempt to evaluate the impact of various physical conditions on the success of magnetic drug targeting. The effect of Brownian motion and interaction of the particles with red blood cells and blood matrix is incorporated into the study to assess the significance of diffusive motion to desirable capture rates. Diffusion as a result of collisions with red blood cells was found to overpower Brownian motion, emphasizing the importance of the role of red blood cells as sources of diffusion, rather than solely as contributors to blood viscosity. Particle arrival at the tumor site was found to heavily rely on particle size, with a direct relationship between particle radius and capture rates, as a magnetic force is overpowered by diffusion for smaller particles. The cylindrical magnet model was also found to maintain its strength over longer distances than one of its constituent point dipoles, allowing for more assured capture of particles released further from the magnet. Furthermore, the computations showed a steep variation in the capture rate due to changes in the magnetic moment within a certain range, suggesting the possibility of the optimization of capture rates given industrial or health-related constraints on the magnetic moment. Finally, lower blood viscosities were found to yield easier and more probable particle capture, as particles have less resistance to overcome. Overall, many novel biological factors are included in this research, but the study of the particles’ agglomeration and interaction with each other is left for future study. This model is intended for applications to and comparisons with experimental data in magnetic drug targeting for localized cancer treatment.
Acknowledgments
This study and its publication in open access were not specially funded.
Author Contributions
Shahriar Afkhami and Pengtao Yue conceived and designed the models. Iris Rukshin and Josef Mohrenweiser executed the computations. Iris Rukshin analyzed the data and wrote the paper.
Conflicts of Interest
The authors declare no conflict of interest.
References
- Goodwin, S.; Peterson, C.; Hoh, C.; Bittner, C. Targeting and retention of magnetic targeted carriers (MCTs) and enhancing intra-arterial chemotherapy. J. Magn. Magn. Mater. 1999, 194, 132–139. [Google Scholar] [CrossRef]
- Lübbe, A.; Alexiou, C.; Bergemann, C. Clinical Application of Magnetic Drug Targeting. J. Surg. Res. 2001, 95, 200–206. [Google Scholar] [CrossRef] [PubMed]
- Afkhami, S.; Cummings, L.J.; Renardy, Y.; Renardy, M. Direct numerical simulation of ferrofluid drops in a cylindrical microfluidic under the influence of a non-uniform magnetic field. In Proceedings of the 16th US National Congress of Theoretical and Applied Mechanics, State College, PA, USA, 27 June–2 July 2010. [Google Scholar]
- Afkhami, S.; Renardy, Y.; Renardy, M. Effects of viscosity ratio on the transient and steady deformation of a Newtonian drop in a viscous and viscoelastic matrix under shear flow. In Proceedings of the 16th US National Congress of Theoretical and Applied Mechanics, State College, PA, USA, 27 June–2 July 2010. [Google Scholar]
- Afkhami, S.; Renardy, Y.; Renardy, M.; Riffle, J.S.; St. Pierre, T. Field-induced motion of ferrofluid droplets through immiscible viscous media. J. Fluid Mech. 2008, 610, 363–380. [Google Scholar] [CrossRef]
- Tsai, S.S.H.; Griffiths, I.M.; Stone, H.A. Microfluidic immunomagnetic multi-target sorting—A model for controlling deflection of paramagnetic beads. Lab Chip 2011, 11, 2577–2582. [Google Scholar] [CrossRef] [PubMed]
- Kang, J.H.; Um, E.; Kiaz, A.; Driscoll, H.; Rodas, M.J.; Domansky, K.; Watters, A.L.; Super, M.; Stone, H.A.; Ingber, D.E. Optimization of pathogen capture in flowing fluids with magnetic nanoparticles. Small 2015, 11, 5657–5666. [Google Scholar] [CrossRef] [PubMed]
- Vyas, S.; Genis, V.; Friedman, G. Computation Study of Kinematic of Capture of Magnetic Particles by Stent: 2-D Model. IEEE Trans. Magn. 2016, 52, 5400204. [Google Scholar] [CrossRef]
- Driscoll, C.F.; Morris, R.M.; Senyei, A.E.; Widder, K.J.; Heller, G.S. Magnetic targeting of microspheres in blood flow. Microvasc. Res. 1984, 27, 353–369. [Google Scholar] [CrossRef]
- Yue, P.; Lee, S.; Afkhami, S.; Renardy, Y. On the motion of superparamagnetic particles in magnetic drug targeting. Acta Mech. 2012, 223, 505–527. [Google Scholar] [CrossRef]
- Grief, A.D.; Richardson, G. Mathematical modeling of magnetically targeted drug delivery. J. Magn. Magn. Mater. 2005, 293, 455–463. [Google Scholar] [CrossRef]
- Cherry, E.M.; Eaton, J.K. A comprehensive model of magnetic particle motion during magnetic drug targeting. Int. J. Multiph. Flow 2014, 59, 173–185. [Google Scholar] [CrossRef]
- Tietze, R.; Lyer, S.; Dürr, S.; Alexiou, C. Nanoparticles for cancer therapy using magnetic forces. Nanomedicine 2012, 7, 447–457. [Google Scholar] [CrossRef] [PubMed]
- Nacev, A.; Komaee, A.; Sarwar, A.; Robst, R.; Kim, S.H.; Emmert-Buck, M.; Shapiro, B. Towards control of magnetic fluids in patients: Directing therapeutic nanoparticles to disease locations. IEEE Control Syst. 2012, 32, 32–74. [Google Scholar] [CrossRef]
- Nacev, A.; Beni, C.; Bruno, O.; Shapiro, B. Magnetic nanoparticle transport within flowing blood and into surrounding tissue. Nanomed. (Lond) 2010, 5, 1459–1466. [Google Scholar] [CrossRef] [PubMed]
- Nacev, A.; Beni, C.; Bruno, O.; Shapiro, B. The behaviors of ferro-magnetic nano-particles in and around blood vessels under applied magnetic fields. J. Magn. Magn. Mater. 2011, 323, 651–668. [Google Scholar] [CrossRef] [PubMed]
- Freund, J.B.; Shapiro, B. Transport of particles by magnetic forces and cellular blood flow in a model microvessel. Phys. Fluids 2012, 24, 051904. [Google Scholar] [CrossRef]
- Womersley, J.R. Method for the calculation of velocity, rate of flow, and viscous drag in arteries when the pressure gradient is known. J. Physiol. 1955, 127, 553–563. [Google Scholar]
- Camacho, J.M.; Sosa, V. Alternative method to calculate the magnetic field of permanent magnets with azimuthal symmetry. Revista Mexicana de Física E 2013, 59, 8–17. [Google Scholar]
- Bird, R.B.; Carreau, P.J. A nonlinear viscoelastic model for polymer solutions and melts. Chem. Eng. Sci. 1968, 23, 427–434. [Google Scholar] [CrossRef]
- Rusconi, R.; Stone, H.A. Shear-induced diffusion of platelike particles in microchannels. Phys. Rev. Lett. 2008, 101, 254502. [Google Scholar] [CrossRef] [PubMed]
- Takeda, S.; Mishima, F.; Fujimoto, S.; Izumi, Y.; Nishijima, S. Development of magnetically targeted drug delivery system using superconducting magnet. J. Magn. Magn. Mater. 2007, 311, 367–371. [Google Scholar] [CrossRef]
- Johnston, B.M.; Johnston, P.R.; Corney, S.; Kilpatrick, D. Non-Newtonian blood flow in human right coronary arteries: Steady state simulations. J. Biomech. 2004, 37, 709–720. [Google Scholar] [CrossRef] [PubMed]
- Tao, R.; Huang, K. Reducing blood viscosity with magnetic fields. Phys. Rev. E 2011, 84, 011905. [Google Scholar] [CrossRef] [PubMed]
Figure 1.
Schematic for the visualization of the implemented model of magnetic drug targeting. The velocity profile, as shown, is entirely in the axial direction with no turbulence. It should be noted that red blood cells are not pictured and that the magnet is represented by a cylinder.
Figure 1.
Schematic for the visualization of the implemented model of magnetic drug targeting. The velocity profile, as shown, is entirely in the axial direction with no turbulence. It should be noted that red blood cells are not pictured and that the magnet is represented by a cylinder.

Figure 2.
Comparison of (a) shear rate at different positions in the blood vessel and (b) the relationship between shear rate and viscosity over different viscosity models. All parameters were kept constant among the models and only shear rate, as a function of position, changed. These included: m/s for the maximum velocity, Pa s and Pa s for and , respectively, s for relaxation time, Pa s for the flow consistency index [23], and as the constant viscosity based on the asymptotic behavior. Specifically, the flow behavior index for all models is the same, 0.708.
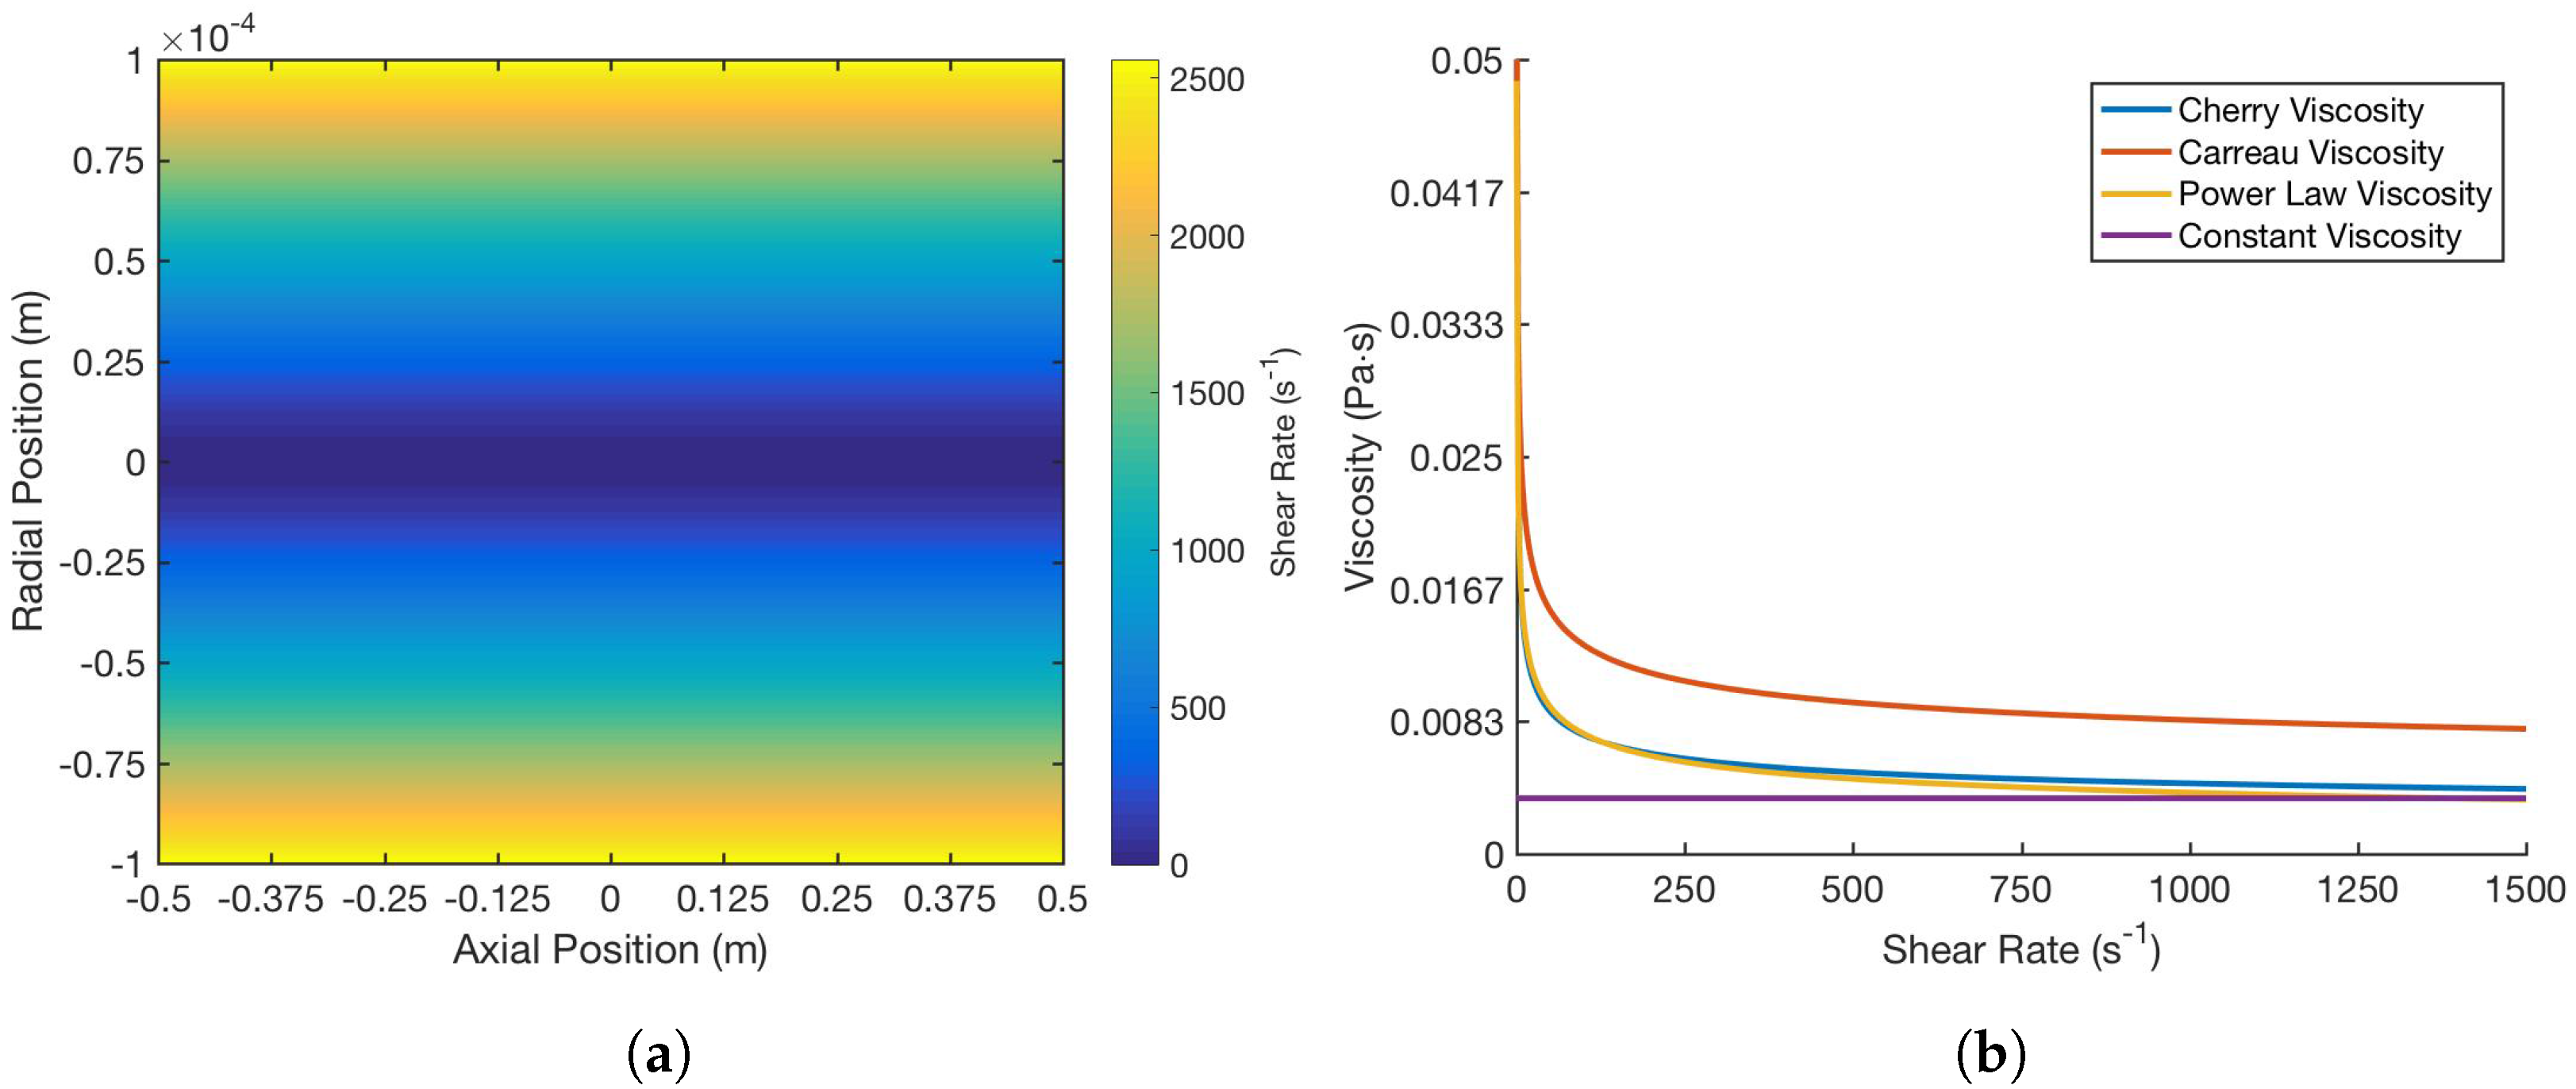
Figure 3.
Comparison of magnetic moment and capture rate over different viscosity models. Each curve was generated by running a simulation of 100 trajectories for particles released at the center of vessel for that viscosity model, where a captured particle is one whose path terminates within the tumor. All parameters were kept constant among the models, consistent with the values in Figure 2, and the paths of every particles are independent and identically distributed by definition.

Figure 4.
Graphs comparing simulations with single release points versus simulations with randomly chosen release points for magnetic particles. The simulations show 100 particle trajectories with m = [0, 0, 700] Am2 and use the Cherry viscosity model with n = 0.708.
Figure 4.
Graphs comparing simulations with single release points versus simulations with randomly chosen release points for magnetic particles. The simulations show 100 particle trajectories with m = [0, 0, 700] Am2 and use the Cherry viscosity model with n = 0.708.

Figure 5.
Graphs comparing simulations with and without red blood cell collisions. The simulations show 100 particle trajectories with m = [0, 0, 700] Am2 and use the Cherry viscosity model with n = 0.708. Without red blood cell collisions, the capture rate was 100%; with red blood cell collisions, the capture rate was 91%.


© 2017 by the authors. Licensee MDPI, Basel, Switzerland. This article is an open access article distributed under the terms and conditions of the Creative Commons Attribution (CC BY) license (http://creativecommons.org/licenses/by/4.0/).
Share and Cite
MDPI and ACS Style
Rukshin, I.; Mohrenweiser, J.; Yue, P.; Afkhami, S. Modeling Superparamagnetic Particles in Blood Flow for Applications in Magnetic Drug Targeting. Fluids 2017, 2, 29. https://doi.org/10.3390/fluids2020029
AMA Style
Rukshin I, Mohrenweiser J, Yue P, Afkhami S. Modeling Superparamagnetic Particles in Blood Flow for Applications in Magnetic Drug Targeting. Fluids. 2017; 2(2):29. https://doi.org/10.3390/fluids2020029
Chicago/Turabian StyleRukshin, Iris, Josef Mohrenweiser, Pengtao Yue, and Shahriar Afkhami. 2017. "Modeling Superparamagnetic Particles in Blood Flow for Applications in Magnetic Drug Targeting" Fluids 2, no. 2: 29. https://doi.org/10.3390/fluids2020029