Article

Numerical Study of Natural Gas/Diesel Reactivity Controlled Compression Ignition Combustion with Large Eddy Simulation and Reynolds-Averaged Navier–Stokes Model

1
Vehicle Powertrain System Research Laboratory, School of Automotive Engineering, Iran University of Science and Technology, Tehran 16846-13114, Iran
2
Aerothermochemistry and Combustion Systems Laboratory, Swiss Federal Institute of Technology, CH-8092 Zurich, Switzerland
*
Author to whom correspondence should be addressed.
Fluids 2018, 3(2), 24; https://doi.org/10.3390/fluids3020024
Submission received: 12 February 2018 / Revised: 20 March 2018 / Accepted: 24 March 2018 / Published: 28 March 2018

Abstract

:
In the current study, a comparative study is performed using Large Eddy Simulation (LES) and Reynolds-averaged Navier–Stokes (RANS) turbulence models on a natural gas/diesel Reactivity Controlled Compression Ignition (RCCI) engine. The numerical results are validated against the available research work in the literature. The RNG (Re-Normalization Group) k ε and dynamic structure models are employed to model turbulent flow for RANS and LES simulations, respectively. Parameters like the premixed natural gas mass fraction, the second start of injection timing (SOI2) of diesel and the engine speed are studied to compare performance of RANS and LES models on combustion and pollutant emissions prediction. The results obtained showed that the LES and RANS model give almost similar predictions of cylinder pressure and heat release rate at lower natural gas mass fractions and late SOI2 timings. However, the LES showed improved capability to predict the natural gas auto-ignition and pollutant emissions prediction compared to RANS model especially at higher natural gas mass fractions.

1. Introduction

In last decade, the use of new and advanced combustion strategies along with alternative fuels in internal combustion engines (ICEs) are of global interest to achieve higher fuel economy and lower pollutant emissions. It has been reported that simultaneous reduction in particulate matter (PM) and nitrogen oxides (NOx) emissions can be obtained with low temperature combustion strategies like reactivity controlled compression ignition (RCCI) combustion [1,2,3]. In RCCI combustion, in-cylinder reactivity gradient is generated by port-injection of a fuel with low reactivity, like natural gas or gasoline and direct-injection of a high reactivity fuel, like diesel which enables combustion and heat release rate control of the engine. Generally, RCCI combustion results in lower NOx and PM emissions and higher gross indicated efficiency (GIE) compared to conventional diesel combustion (CDC) and homogenous charge compression ignition (HCCI) combustion [4,5,6,7,8,9,10]. There are comprehensive and thorough review papers in the previous studies about RCCI combustion, that can be referred for more detailed information regarding various aspects of RCCI combustion [11,12].
Since using natural gas-blended diesel fuel can reduce engine’s pollutant emissions [13], there have been some research works in the literature on the influence of natural gas on RCCI engine combustion [14,15,16]. Nieman et al. [17] investigated natural gas/diesel RCCI combustion at various engine loads along with optimization of different affecting parameters. Zoldak et al. [18] computationally studied direct injection of natural gas (DI-NG) in RCCI engine and showed improved stratification of the NG fuel portion, which enables higher load operation. Jia and Denbratt [19] experimentally investigated the effect of duration of the diesel injections and timing in a RCCI engine at various compression ratios, engine speeds and loads. Paykani et al. [14] studied the effects of premixed natural gas percentage, the SOI1 and SOI2 injection timings and the injected diesel mass divided between the two injections on natural gas/diesel RCCI combustion. Increased efficiency along with reductions in NOx and soot emissions were observed but UHC and CO emissions were increased.
Large Eddy Simulation (LES) and Reynolds-averaged Navier–Stokes (RANS) are two types of turbulent modelling approaches in ICEs simulation [20]. In RANS, detailed information regarding immediate unsteady properties of the turbulent flow is lost due to averaging. Flow details through an axisymmetric inlet and exhaust valve-port assembly have been investigated numerically by Naser et al. [21,22]. Predictions obtained with the standard k ε model showed reasonably good agreement with the available measured data, except near the seat face, where the effects of streamline curvature were not reproduced in the predictions. This discrepancy was mainly attributed to the deficiencies in the k ε model used. For engine cylinder applications, LES can provide several benefits over RANS modelling, like resolving more flow structures, more accurate solutions and having access to the cycle-to-cycle variations [23,24]. The significant difference in the two modelling approaches is related to turbulence timescale formulations. In the RANS, the turbulence timescale is related to the eddy turnover time, while in the LES model it is the time required for the mixture to catch perfectly combination status according to the scalar dissipation ratio [24,25]. Moreover, the computational cost of LES is much larger than for RANS, because LES is intrinsically unsteady and requires a finer grid to resolve a sufficient part of the turbulent length scales in the flow. However, since a larger part of the turbulent fluctuations is resolved and the modelled terms are much smaller, LES has a superior accuracy compared to RANS. According to the literature, LES-based approaches have found increasing trend in engine turbulent combustion modelling applications [26,27,28,29,30].
In previous studies, the LES model showed proper ability to predict both the in-cylinder heat release rate and the pressure trace for diesel engines but in-cylinder combustion behaviour of the RCCI engine is more complicated. There is one research work published in literature comparing LES and the RANS models in dual fuel engine. Xu et al. [31] numerically compared LES and RANS turbulence models in a diesel–methanol dual-fuel engine. They demonstrated that the LES model has greater capability in prediction of the high methanol mass fraction rates and numerical results are in good agreement with the experimental ones.
According to the literature, no study has been conducted on comparing LES and RANS turbulent models on the emission and combustion properties of a RCCI engine fuelled with natural gas/diesel. Thus, in the present study, a comprehensive comparative study of LES and RANS models is performed to simulate the in-cylinder combustion of a natural gas-diesel RCCI engine. The capability of RANS and LES models in combustion and emission prediction of RCCI engine is compared in different cases.

2. Proposed Models and Validation

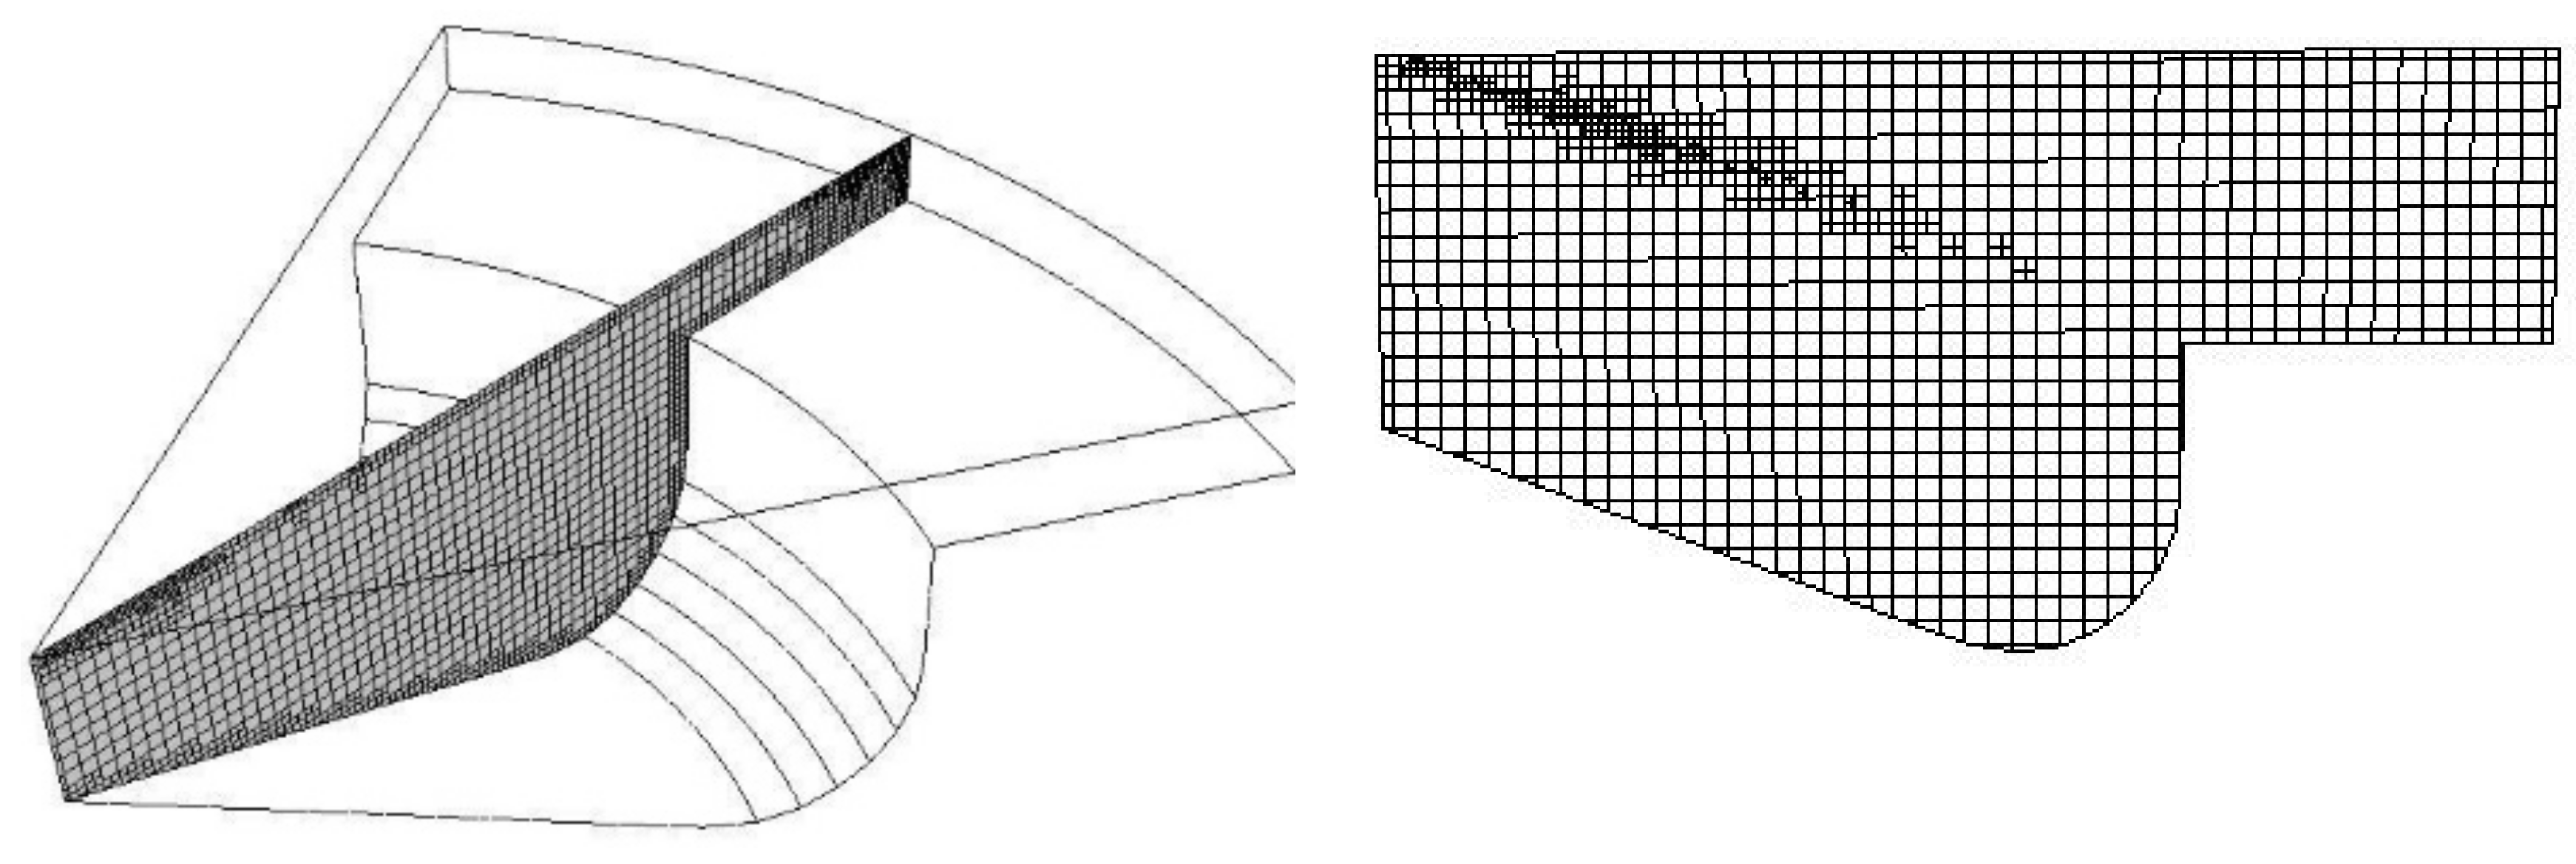
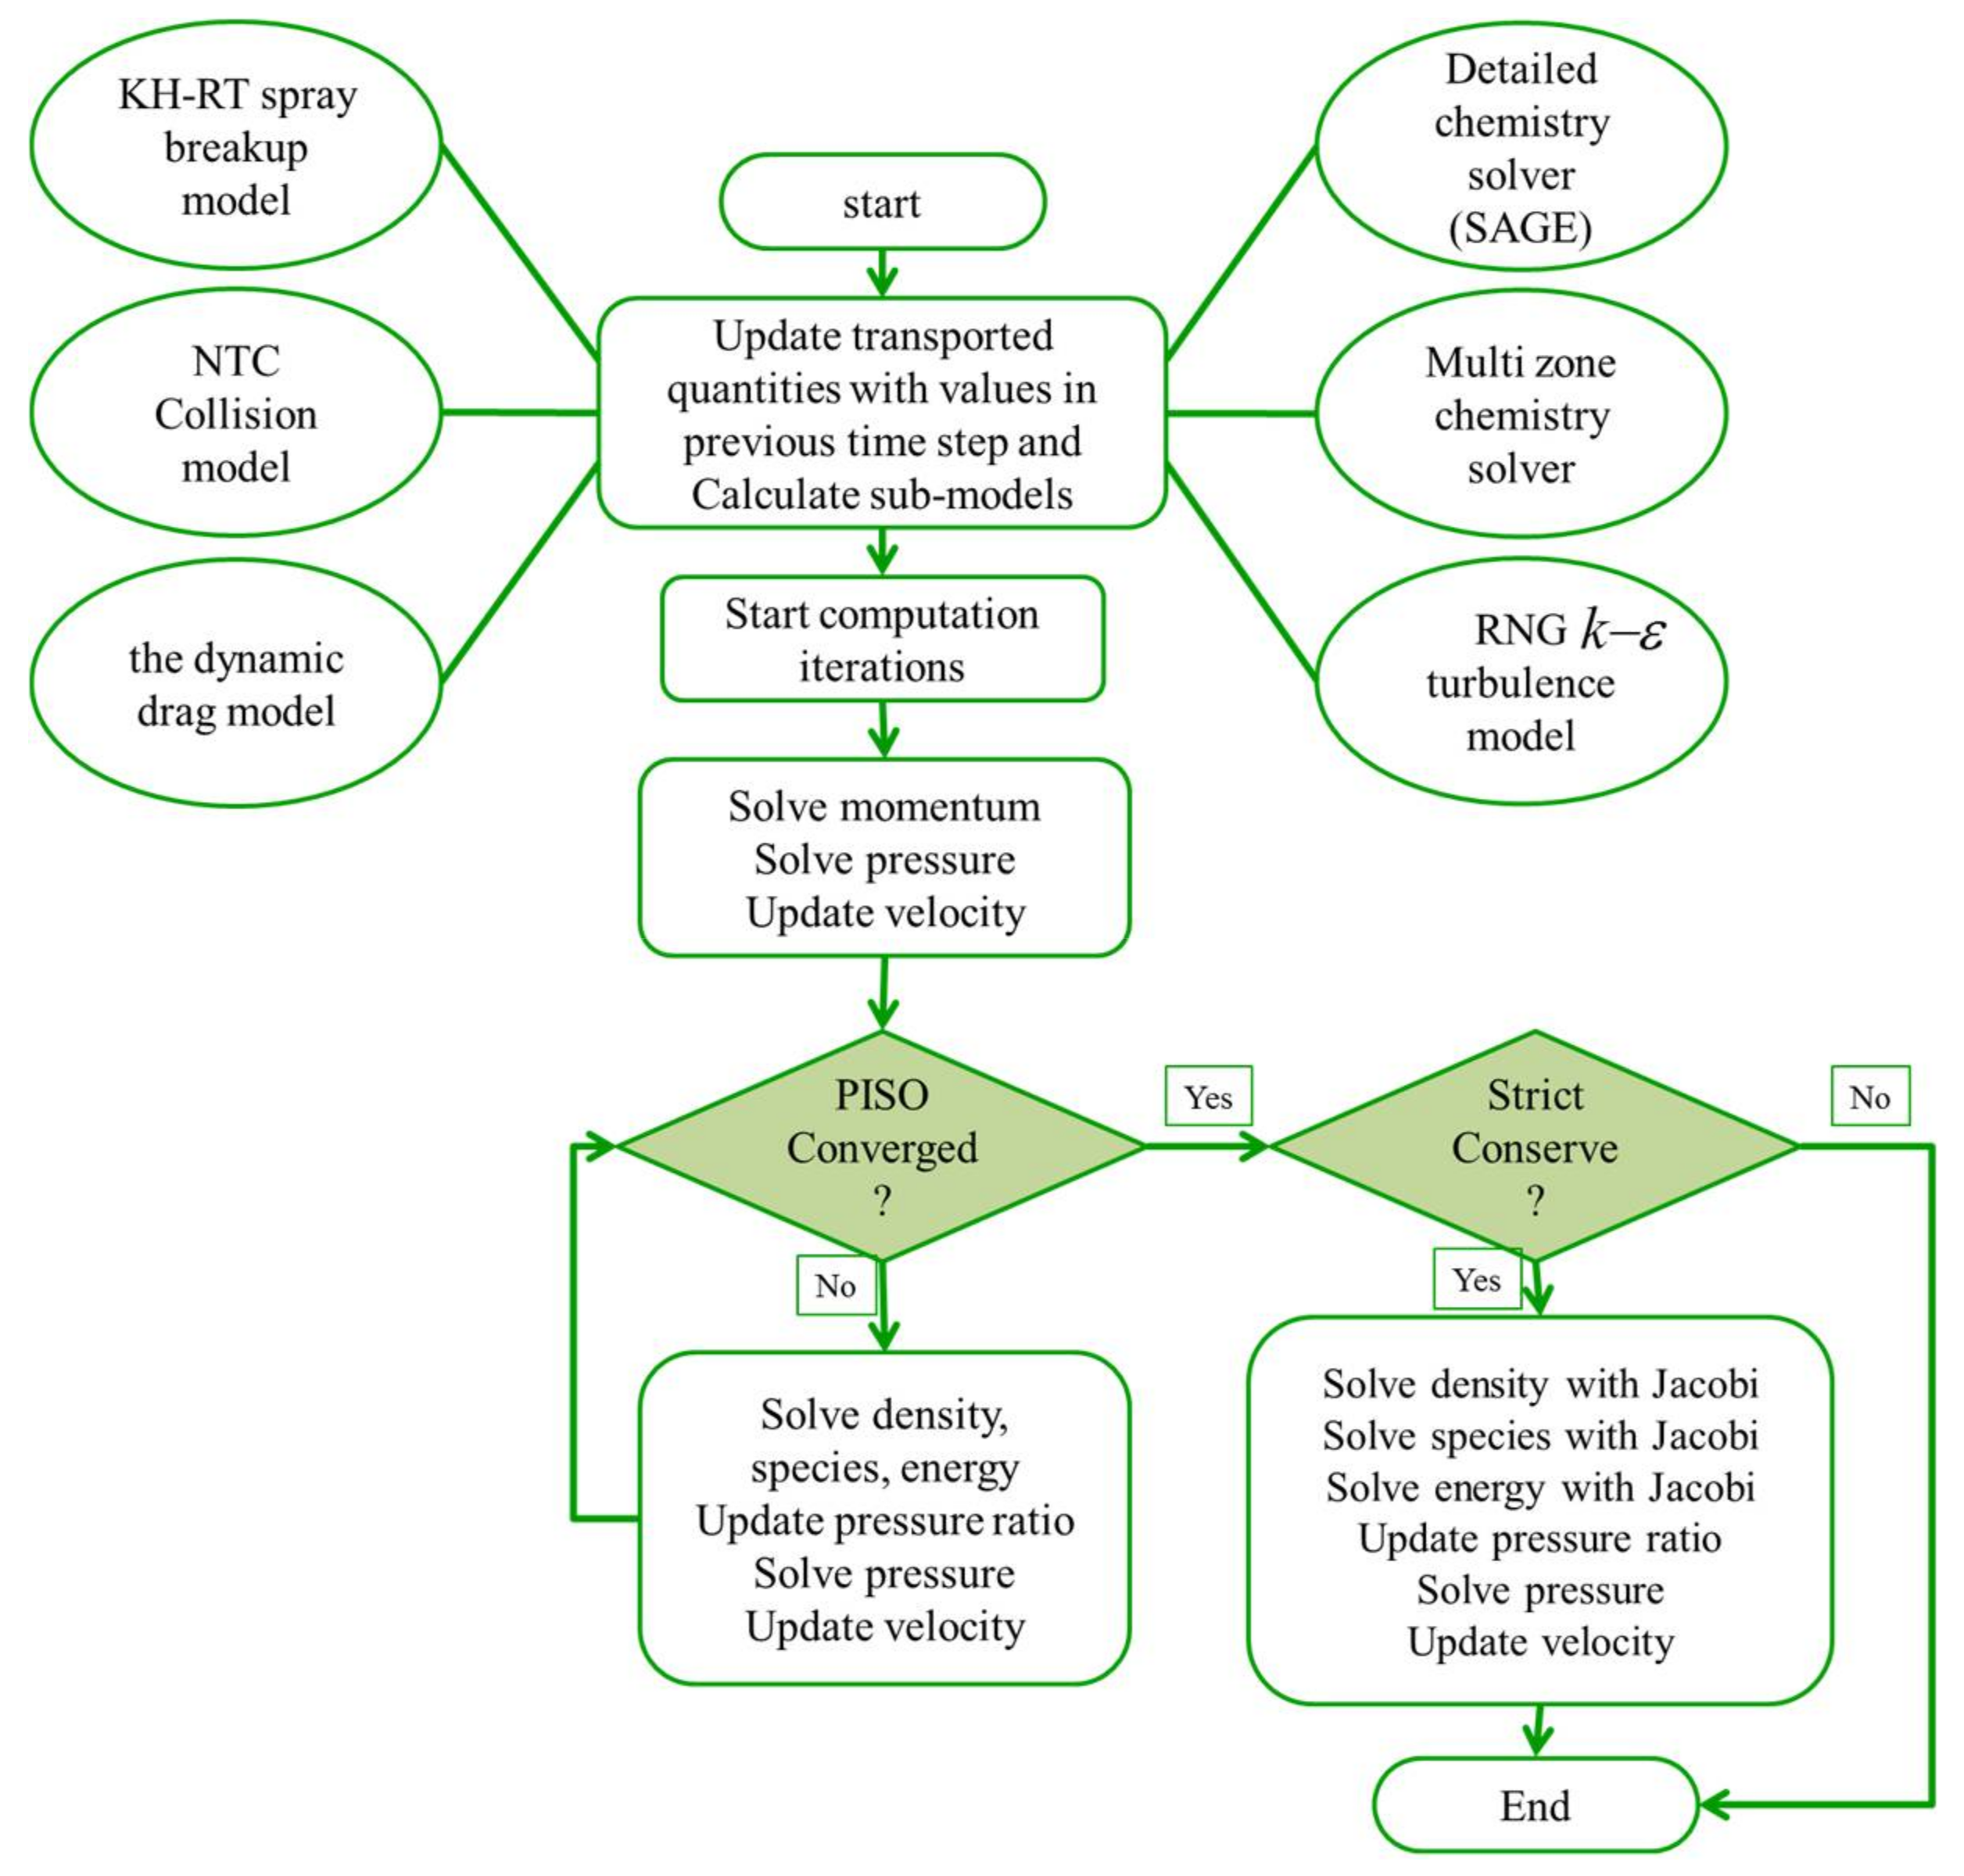
2.1. Computational Model

In the current research RCCI engine simulations carried out utilizing the CONVERGE CFD tool [32]. Port fuel injected hydrogen and natural gas proposed to be homogeneously combined at IVC and the blob injection model was used to simulate the diesel injection procedure [33]. The primary and secondary breakups of the injected fuel were modelled employing the hybrid KH-RT model [34]. The No Time Counter (NTC) collision approach [35] was utilized for collision of fuel droplets and droplet drag was described using the dynamic drag model [36]. The RNG (Re-Normalization Group) k ε model with wall-functions was employed to model turbulent flow [37,38]. A well-defined chemistry method utilized via the SAGE solver for combustion modelling. Tetradecane (C14H30) was used as a fuel surrogate to model physical characteristics of diesel fuel.
The simulations conducted utilizing the multi-zone chemistry solver to decrease the run time [39]. A 76 species and 464 reaction mechanism of GRI-Mech 3.0 was utilized [40]. The NOx formation was modelled utilizing an extended Zeldovich procedure [41]. Hiroyasu-NSC soot model was employed to predict soot according to the method of Hiroyasu [42] which uses acetylene as an inception species, allowing coupling of the soot model and the detailed chemical kinetics solver. A crevice model based on the model of Namazian and Heywood [43] was used which is a substitute to analysing the crevice regions in the CFD grid directly. The model includes two rings and five crevice regions and calculates the relevant parameters needed to determine the amount of mass entering and leaving the cylinder. A flowchart representing the overview of the solvers and models was depicted in Figure 1.

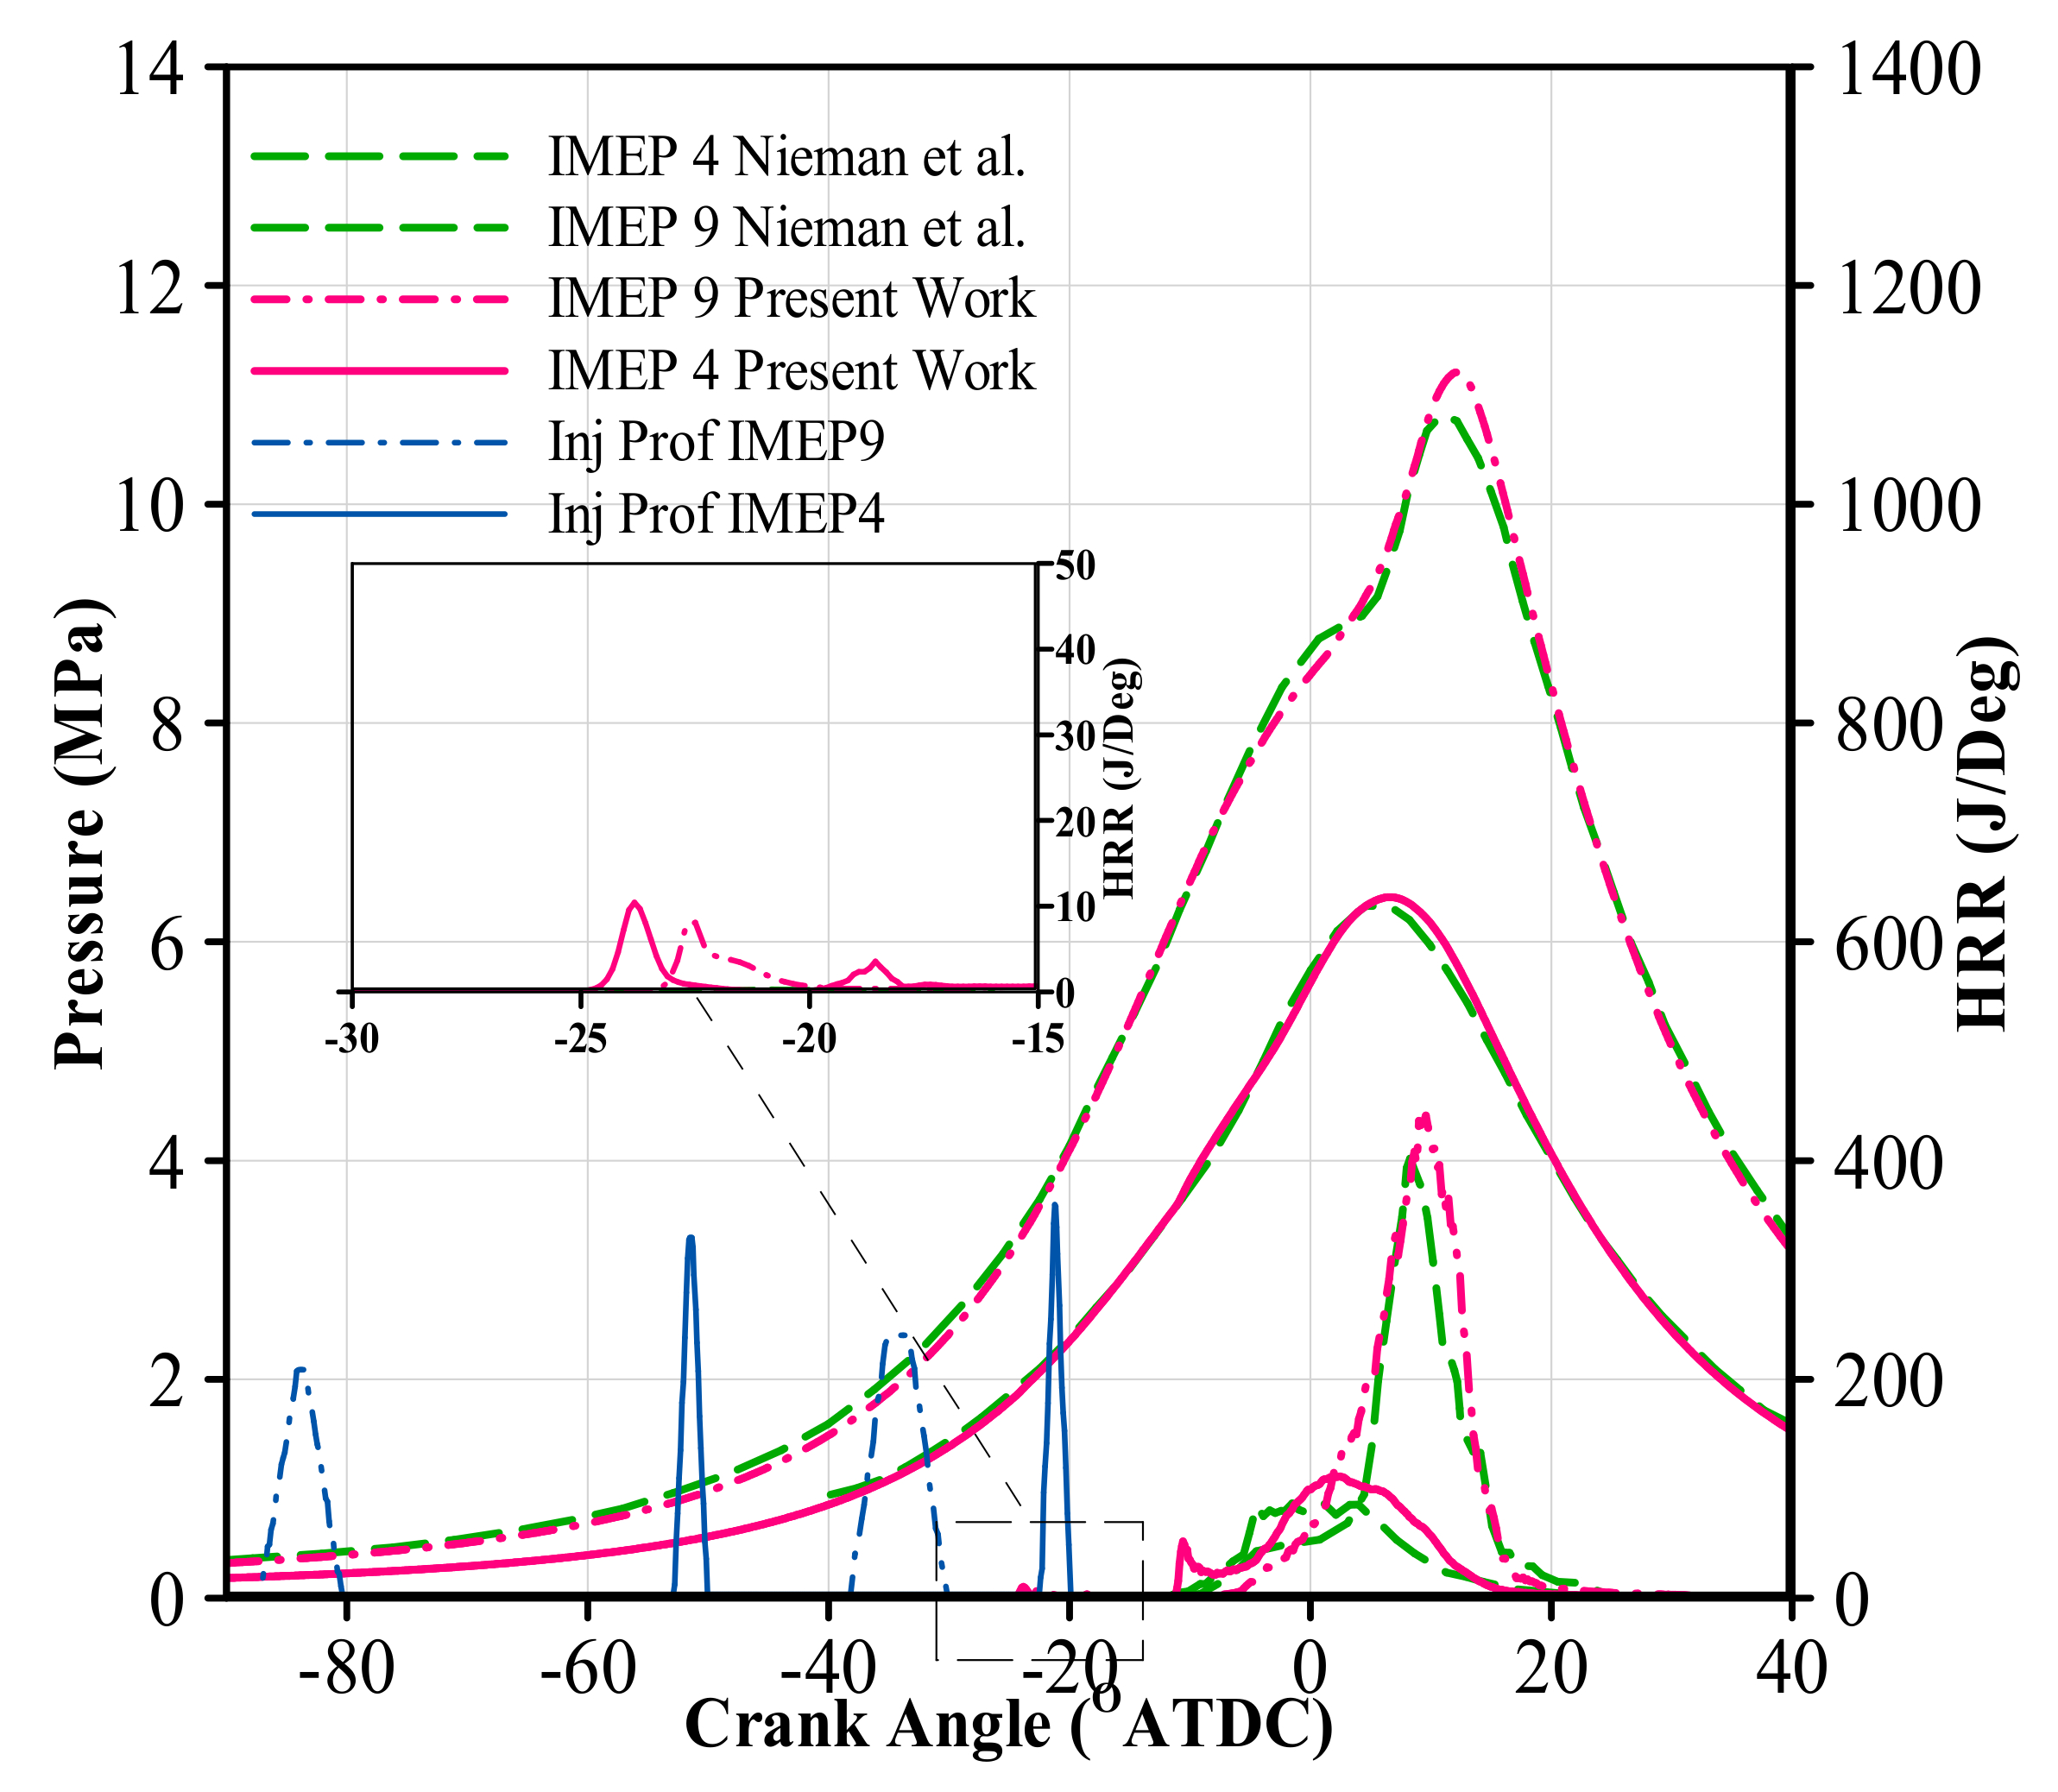
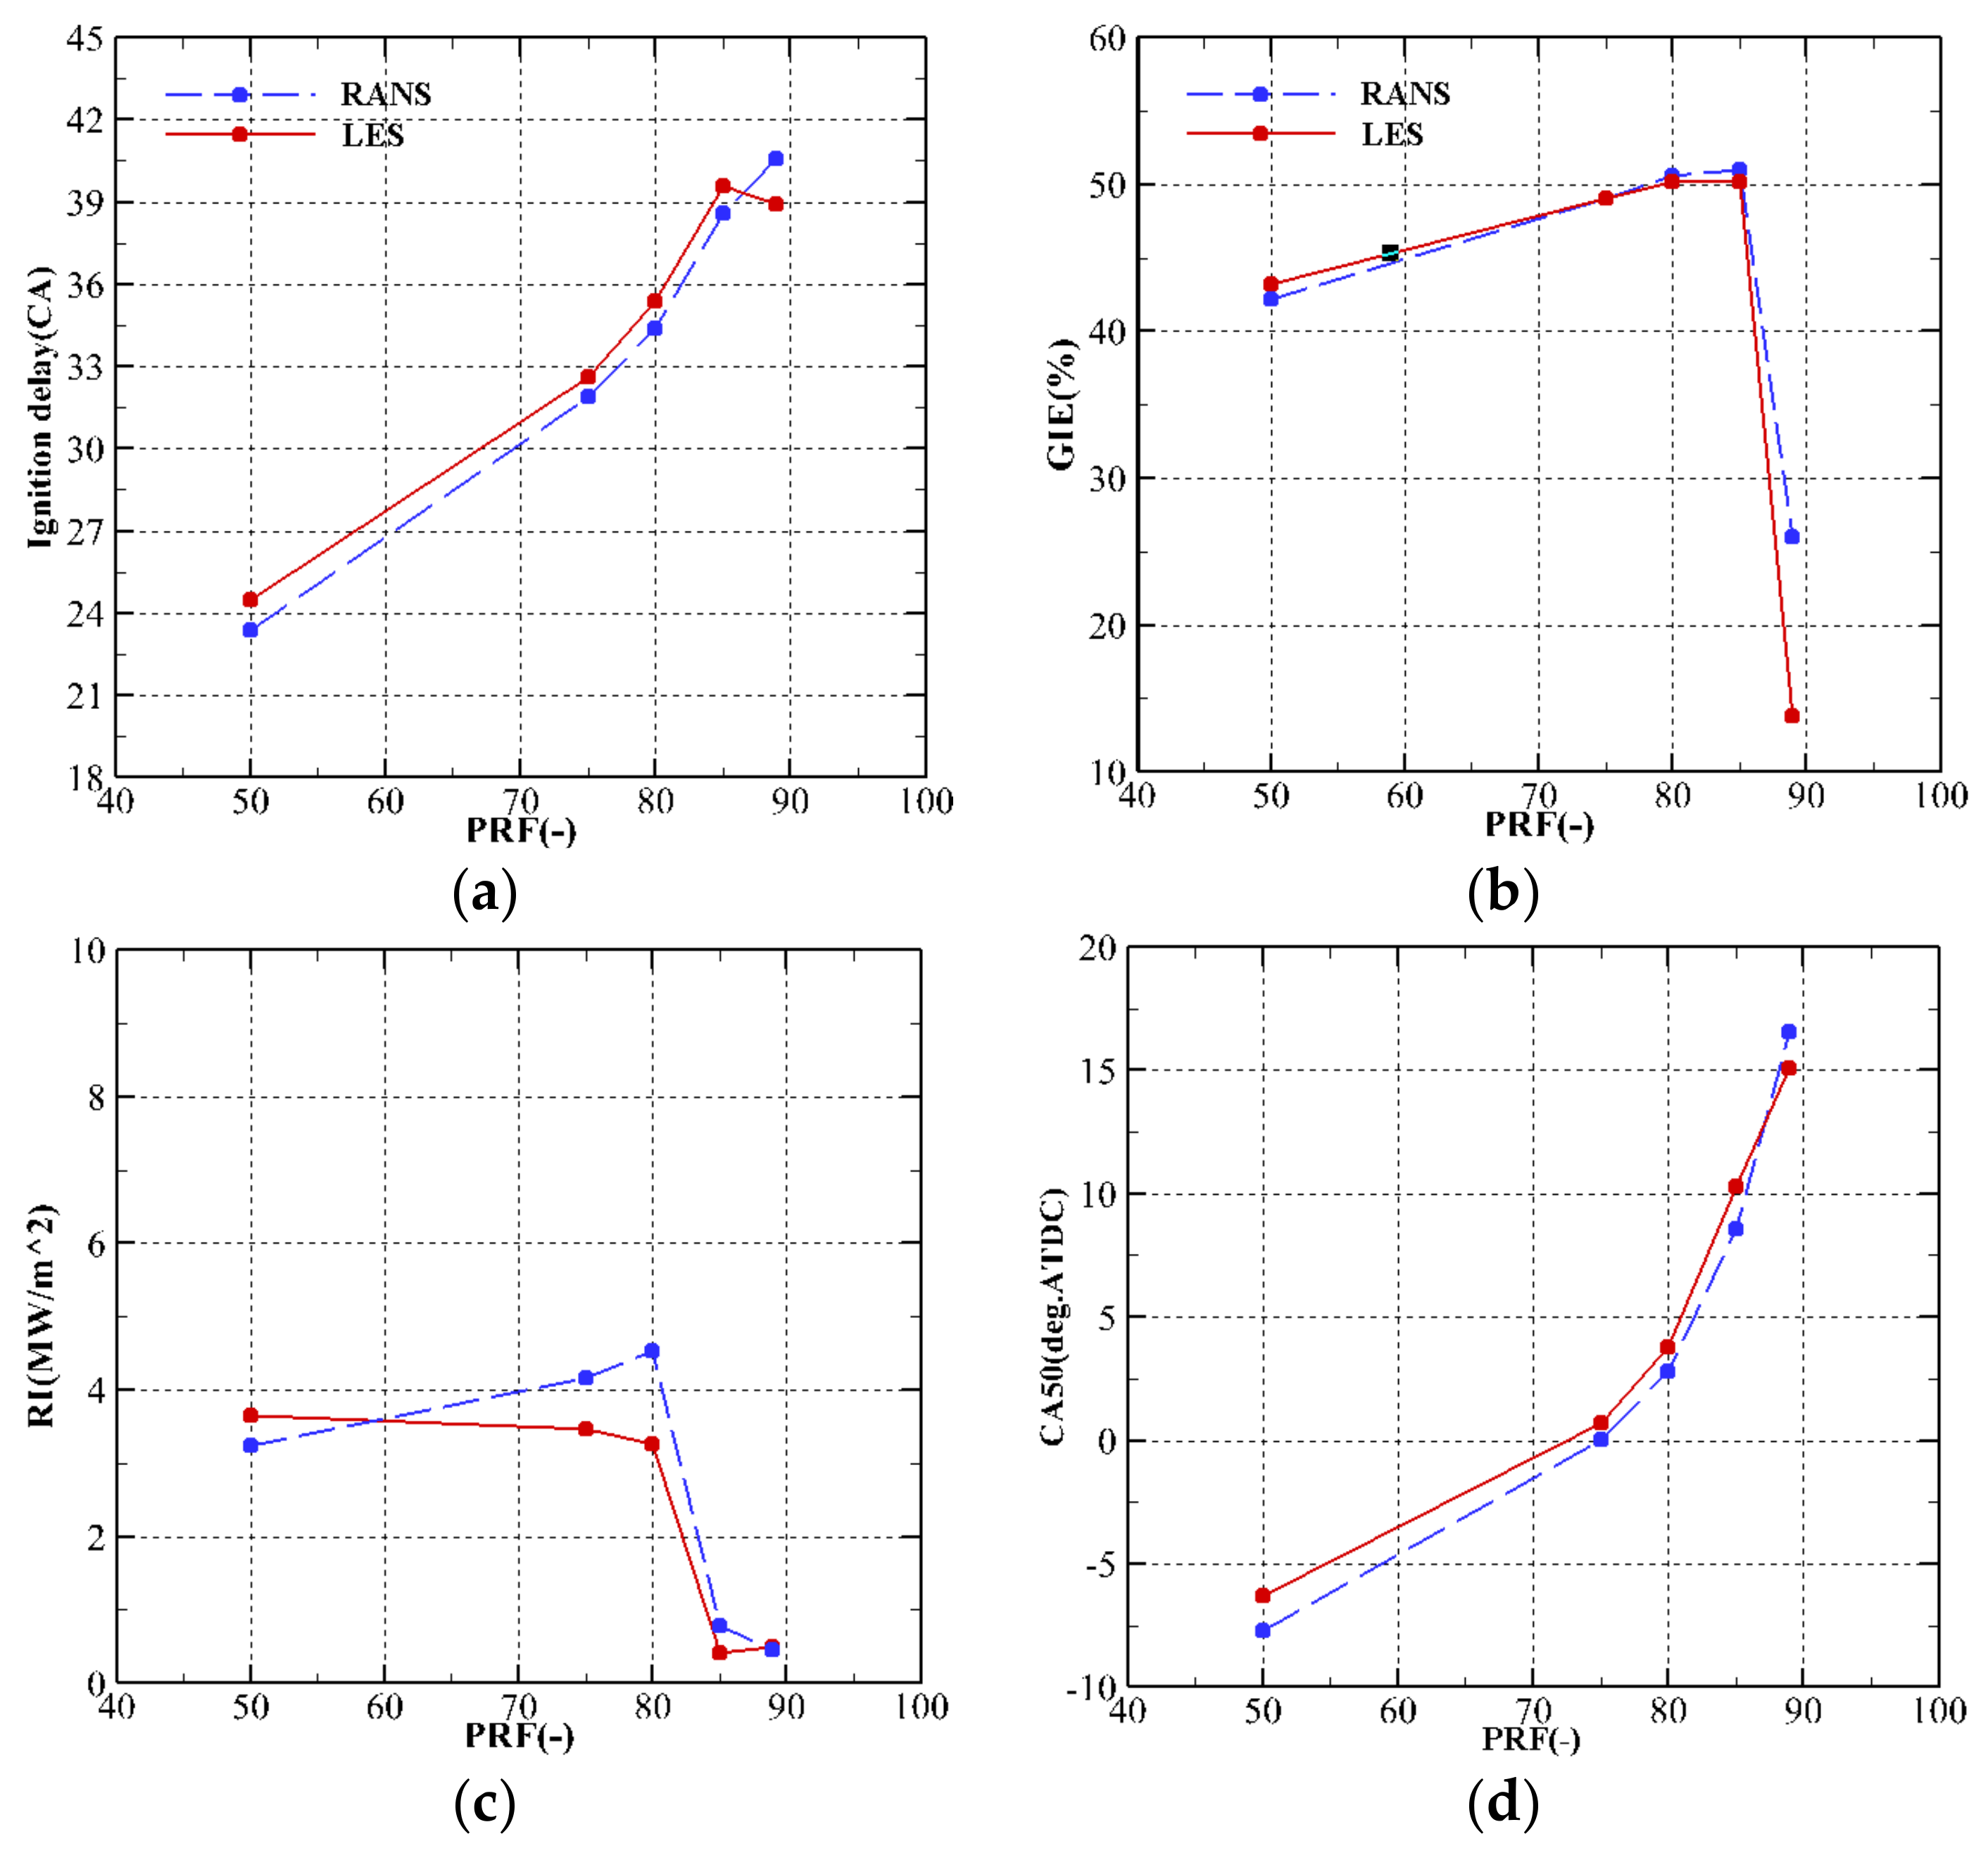
2.2. Validation of Model

To improve computational efficiency, closed-cycle calculations on sector grids via periodic boundaries are conducted. The liner temperature of 450 K, piston temperature of 550 K and head temperature of 525 K is taken in the simulation for heat transfer model. The law-of-wall boundary condition is applied to the boundaries like piston, liner and head. The grid represents one of the six holes of the direct injector, so a sixty-degree sector geometry is created. The CFD code uses a structured Cartesian grid with base cell size of 1.0 mm for RANS and LES calculations as reported in previous studies [25,31]. Boundary, nozzle and cylinder embedding along with adaptive mesh refinement (AMR) are employed to provide mesh resolution only when and where it is needed to minimize the cell count. Injector embedding was used since the amount of injected diesel is low and the injector angle is also towards the squish region, it is not so distinguishable. Fixed embedding scale of four at the piston and cylinder head boundaries and near the injector nozzle and an AMR scaling of four according to fixed thresholds for the spatial gradients in velocity and temperature are used (see Figure 2).
The numerical findings are validated against the Nieman et al. [17] results. The specifications of Caterpillar Single-Cylinder Oil Test Engine (SCOTE) 3401E are presented in Table 1. This heavy-duty diesel engine is a 2.4 L single-cylinder version of the Caterpillar 3406 six-cylinder, on-road engine and representative of Caterpillar’s engine technology for the 1994–1997 model years. Validations are performed at low load 4 bar indicated mean effective pressure (IMEP) and medium load 9 bar IMEP as demonstrated in Table 2.
Figure 3 shows cylinder pressure traces and heat release rate at two engine loads compared to Reference [17] using RANS turbulence model. As observed, the prediction of combustion phasing and pressure traces are good and the model also captures the low temperature heat release region at −24 and −23 for the two loads which is the result of the energy release of the decomposition of early injected pilot fuel (low temperature reactions). The absolute errors in the peak in-cylinder pressure are 0.3956 and 0.0842 MPa and the absolute errors in the relevant crank angle at the peak in-cylinder pressure are 1.2448 and 1.15 CA for the IMEP 4 and 9 bar, respectively. The errors for other outputs are included in Table 3. As presented in Table 3, the model has successfully predicted emissions and performance parameters trends at medium and low loads of RCCI engine. It should be noted that the difference in the emission results is maybe due to the difference in the used chemical mechanism.

2.3. LES Model Description

Traditionally, in RANS models an effective turbulent viscosity is used to model the Reynolds stress term. Thus, the turbulent convective mixing is modelled by additional turbulent diffusion (i.e., diffusive mixing). The common RANS model which has been extensively used for turbulence modelling in internal combustion engines is Rapid Distortion RNG k − ε [37]. A key difference between LES and RANS models is how the fields are decomposed for modelling. For a RANS approach, the field is decomposed into an ensemble mean and a fluctuating component. In the LES approach, the field is decomposed into a resolved field and a sub-grid field as follows:
u i = u i ¯ + u i
where the over-bar indicates the resolved field and the prime indicates the sub-grid field. The resolved velocity field is defined as a spatial average of the actual velocity field. This differs from the RANS approach, where the mean velocity field is an ensemble average. Because of these decomposition differences, the LES filter has properties, unlike RANS, given by,
u i ¯ ¯ u i ¯   u i 0
If the LES decomposition is applied to the conservation of momentum equation, the following LES equation can be derived:
ρ ¯ u ˜ i t + ρ ¯ u ˜ i u ˜ j x j = P ¯ x i + σ i j ¯ x j τ i j x j
where,
u ˜ i ρ u i ¯ ρ ¯   τ i j = ρ ¯ ( u i u j ˜ u i ˜ u j ˜ )
Most LES models focus on modelling the expression for the sub-grid stress tensor, ij, given above. However, it is also possible to allow upwinding to be used as the LES model. In this case, no additional term is added for the sub-grid stress tensor [32].

Dynamic Structure Model (One-Equation)

In CONVERGE, there are two classes of LES models; zero-equation and one-equation models. For zero-equation models, CONVERGE does not solve any additional transport equations. For one-equation models, an additional transport equation is added for the sub-grid kinetic energy [32]. In the dynamic structure model, a transport equation is added for the sub-grid kinetic energy to enforce a budget on the energy flow between the resolved and the sub-grid scales. The dynamic structure model does not use turbulent viscosity to model the sub-grid stress tensor [44]. The sub-grid turbulent kinetic energy needs the sub-grid stress tensor models, which are given by:
τ i j = c i j k ,   T i j = c i j K
where the test level kinetic energy is defined by:
K = 1 2 ( u i u i ¯ u i ¯ u i ¯ )
The test and grid level kinetic energies are related by the trace of the Leonard term, thus another transport equation for K is not required:
K = k + 1 2 L i i
Substituting these models for the two stress tensors into the Germano identity yields the following:
L i j = K c i j k c i j
Alternatively, in an algebraic model, in which the tensor coefficient is removed from the integral and then solved for ij, the model for the sub-grid tensor becomes:
τ i j = 2 k ( L i j L i i )
Sufficient grid resolution would be used to resolve the flow into the viscous sub-layer, when running an LES simulation. In this case, walls are modelled directly with no-slip boundary conditions and Dirichlet temperature conditions. However, in many cases it is not feasible to add enough resolution to resolve the viscous sub-layer and thus wall models must be employed. The Werner and Wengle [45] wall model is designed to work with LES models. This model is more complicated than the standard law-of-the-wall but it does not require iterations. Like the other wall models there are two regimes. If the magnitude of the tangential velocity satisfies the inequality given as,
| u i , tan g | μ 2 ρ y A 2 1 B
Then the shear speed is given as,
u τ = μ | u i , tan g | ρ y
where A is 8.3 and B is 1/7. If the inequality is not satisfied, then the shear speed is given by,
u τ = [ 1 B 2 A 1 + B 1 B ( μ ρ y ) 1 + B + 1 + B A ( μ ρ y ) B | u i , tan g | ] 2 1 + B
Once the shear speed is calculated, the stress tensor can be determined as,
σ i j = [ ( u i , tan g | u i , tan g | ρ u τ 2 ) n j ]
In addition, the Amsden [46] temperature law-of-the-wall is used for energy law-of-the-wall. Regarding the run time for LES simulations, it took longer time compared to RANS model.

3. Results and Discussion

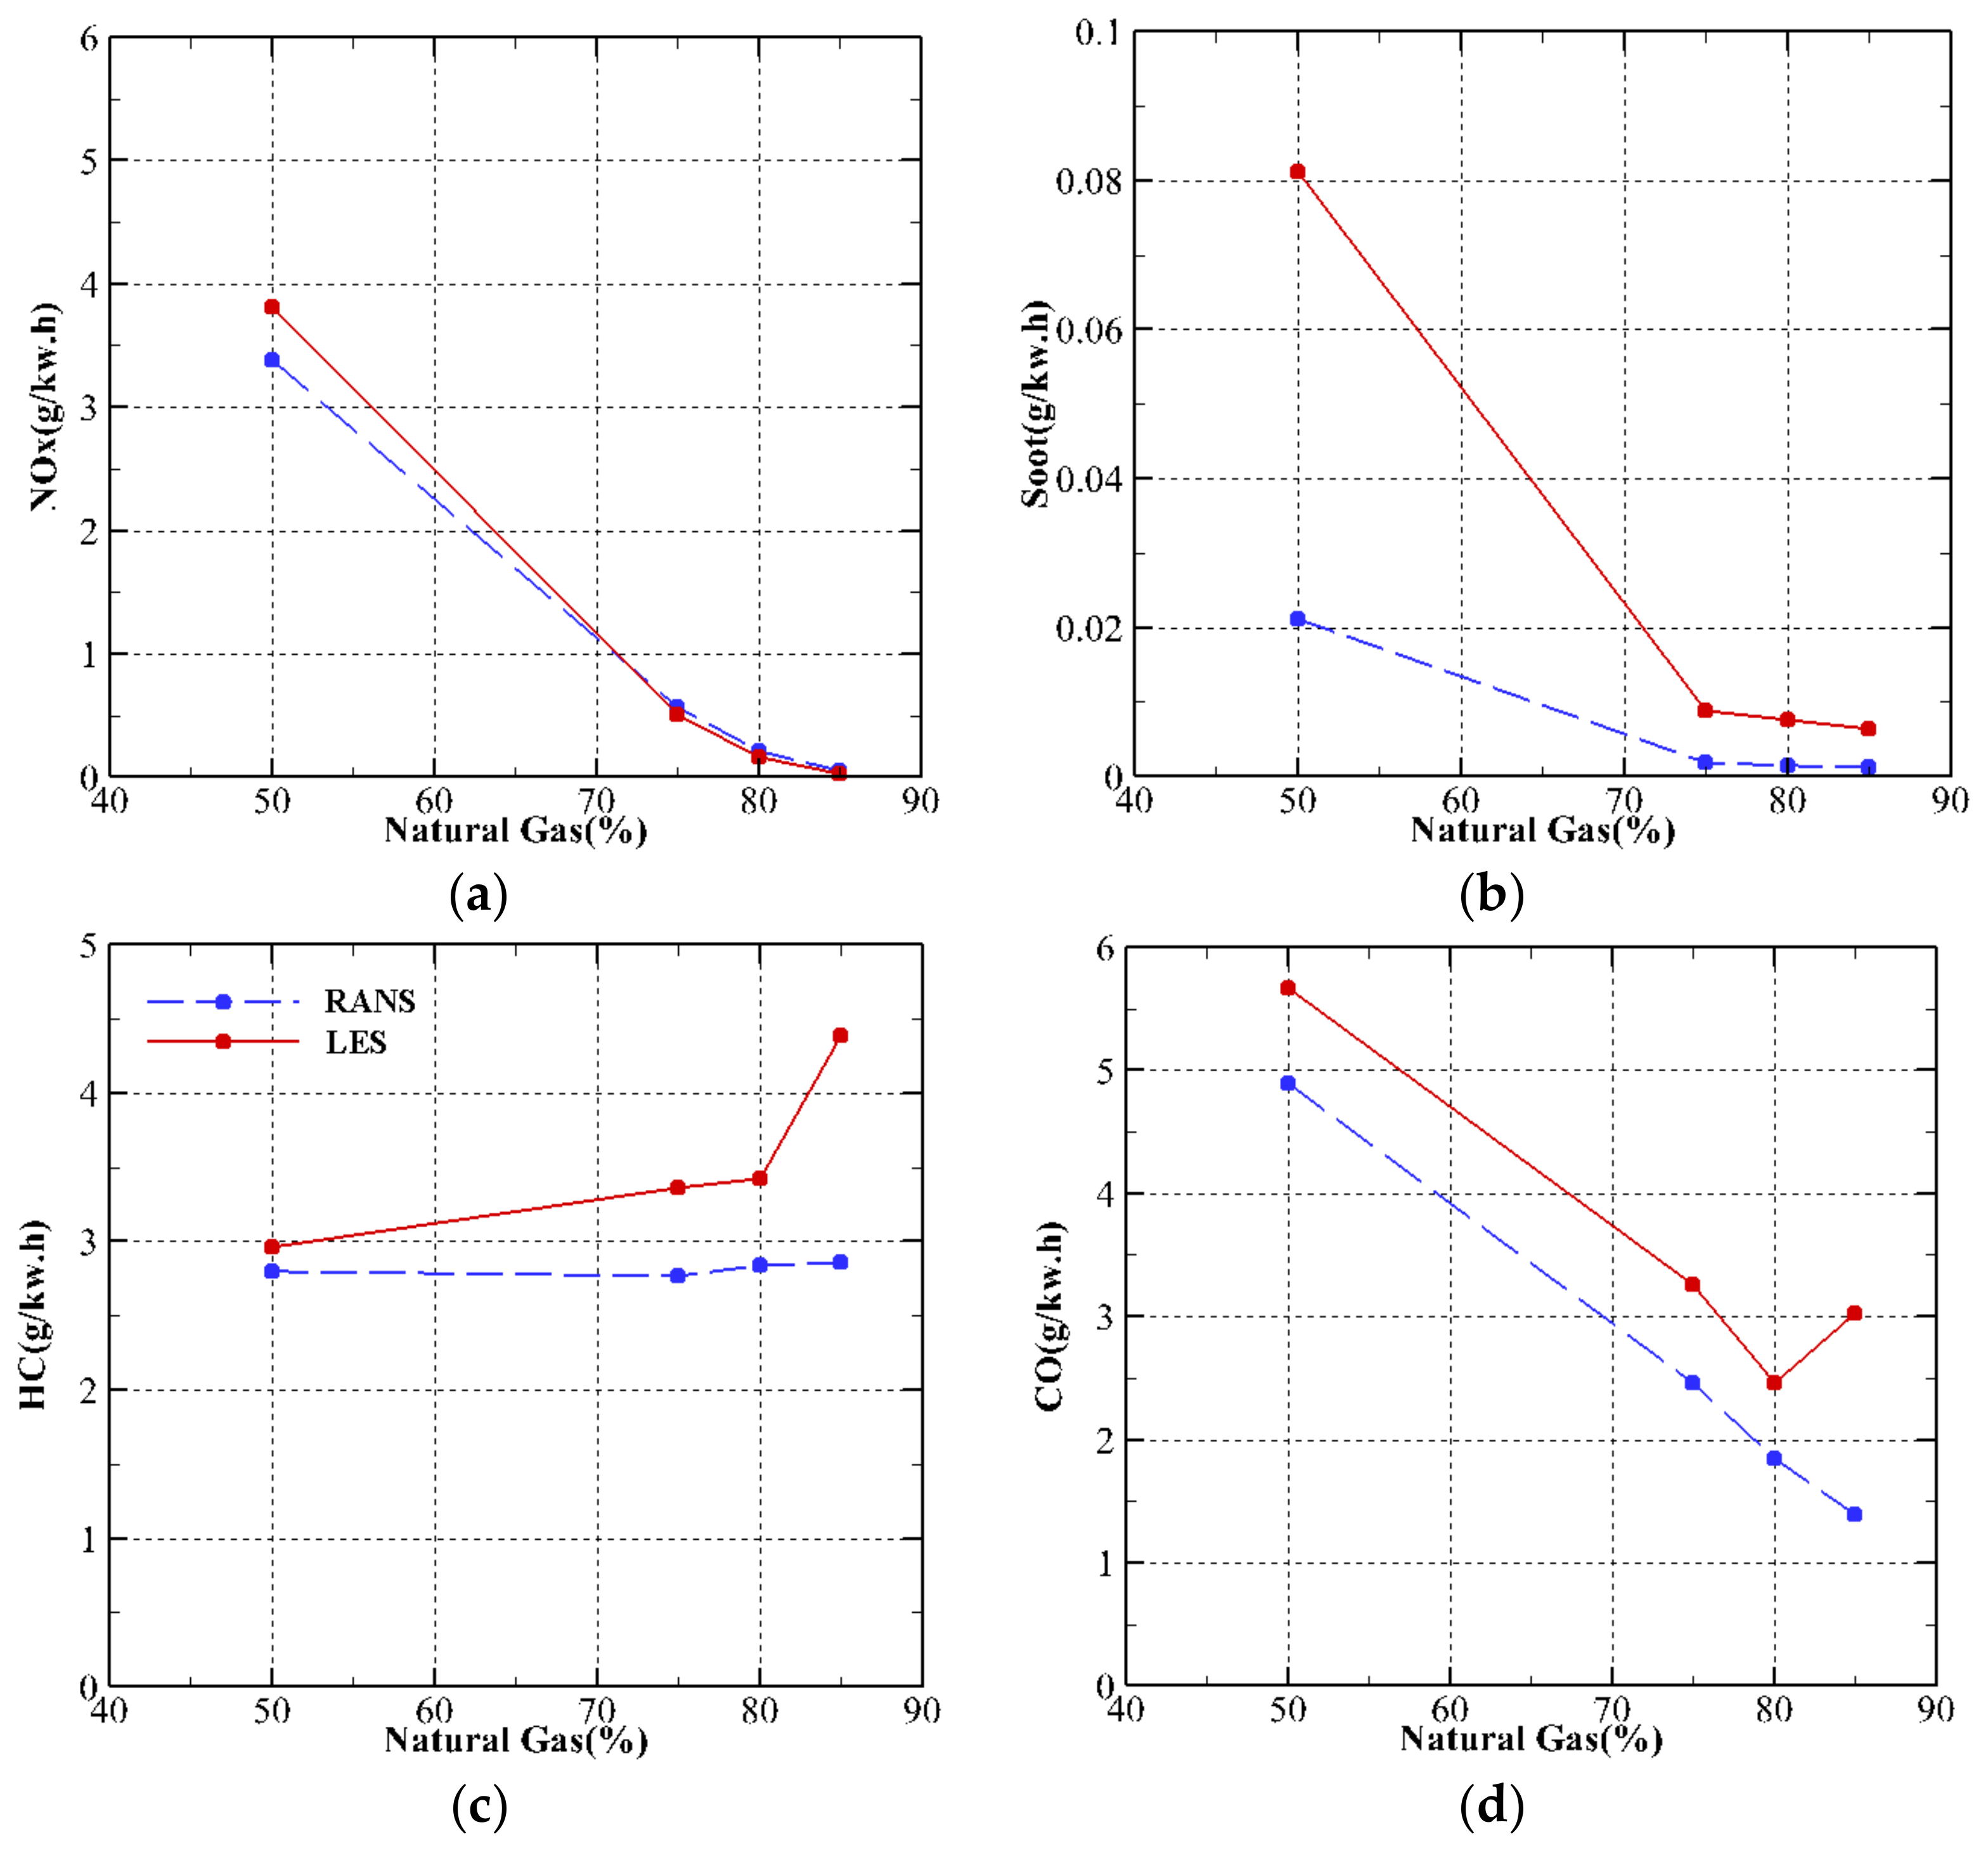
3.1. Effect of Natural Gas Mass Fraction

The medium load case (i.e., 9 bar IMEP) in Table 2 was selected as the base case condition in the current paper. Figure 4 depicts the cylinder heat release rate (HRR) and pressure with different natural gas percentages for LES and RANS models. As it is observed, when mass fraction of natural gas increases, combustion delays, heat release rate decreases and ignition delay (ID) increases. Increasing the diesel fraction increases the local fuel reactivity and so, results in advanced start of combustion (SOC) and decreased ignition delay, which improves combustion efficiency but it has a detrimental effect on soot (see Figure 5). It can be seen that in low natural gas mass fractions, both models have insignificant difference but this difference between two models is much more distinctive with increasing of natural gas percentage.
Figure 5 shows ignition delay, gross indicated efficiency (GIE), ringing intensity (RI) and CA50 variations for RANS and LES models. It is apparent that wherever natural gas mass fraction increases, the ignition delay rises [47] and the LES and RANS give similar trend. The detailed discussion about this behaviour can be found in Ref. [14]. In addition, LES model predicts misfiring at 89% natural gas mass fraction and descending RI trend compared to RANS, thus that LES is much more reliable in combustion simulation of natural gas/diesel RCCI engine.
In-cylinder temperature contours are shown in Figure 6 in order to discuss more details of the in-cylinder combustion processes in RCCI engine. As known, the early-injected diesel targets the squish region whereas the late-injected diesel targets the piston bowl and plays as an ignition source, which results in the high temperature combustion happening in both bowl and squish regions. It is apparent from Figure 6 that the ignition zone of 89% natural gas case was smaller than that of 85% natural gas case, indicating that with by increasing natural gas mass fraction, ignition delay increases. According to Figure 6, more precise temperature contours are captured by the LES model due to the point that LES can specify more detailed turbulence structures, fuel/air combination and temperature fluctuations. This is much more distinctive in the chemically dominated premixed auto-ignition step. The main drawback of the RANS model is its over-estimation of the turbulent kinetic energy, so, the RANS results in a larger Damköhler number compared to the LES and leads to a lower reaction ratio [31].
Comparison of engine-out emissions for LES and RANS models is depicted in Figure 7. As shown, by increasing natural gas mass fraction ratio, the CO emission decreases. Low CO is achieved when ignition happens near TDC (i.e., low CA50). UHC emission slightly increases at higher natural gas mass fraction in the case of LES model due to the part of fuel not burning resulting of the high combustion delay time. In addition, previous studies have showed that the UHC depend more on crevices and squish volumes in RCCI combustion. As shown in Figure 7, NOx emissions decrease by increasing natural gas fraction due to the in-cylinder temperature drop along with reduction of the residence time of the mixture. Soot emission also decreases by increasing of the natural gas, since the amount of soot produced is highly related to the mass of direct injected diesel fuel and mainly depends on the local equivalence ratio. The detailed discussion about this behaviour can be found in reference [14]. As can be seen, both LES and RANS models successfully captured the emission trends but LES predicts them more precisely than RANS particularly at high natural gas mass fractions.

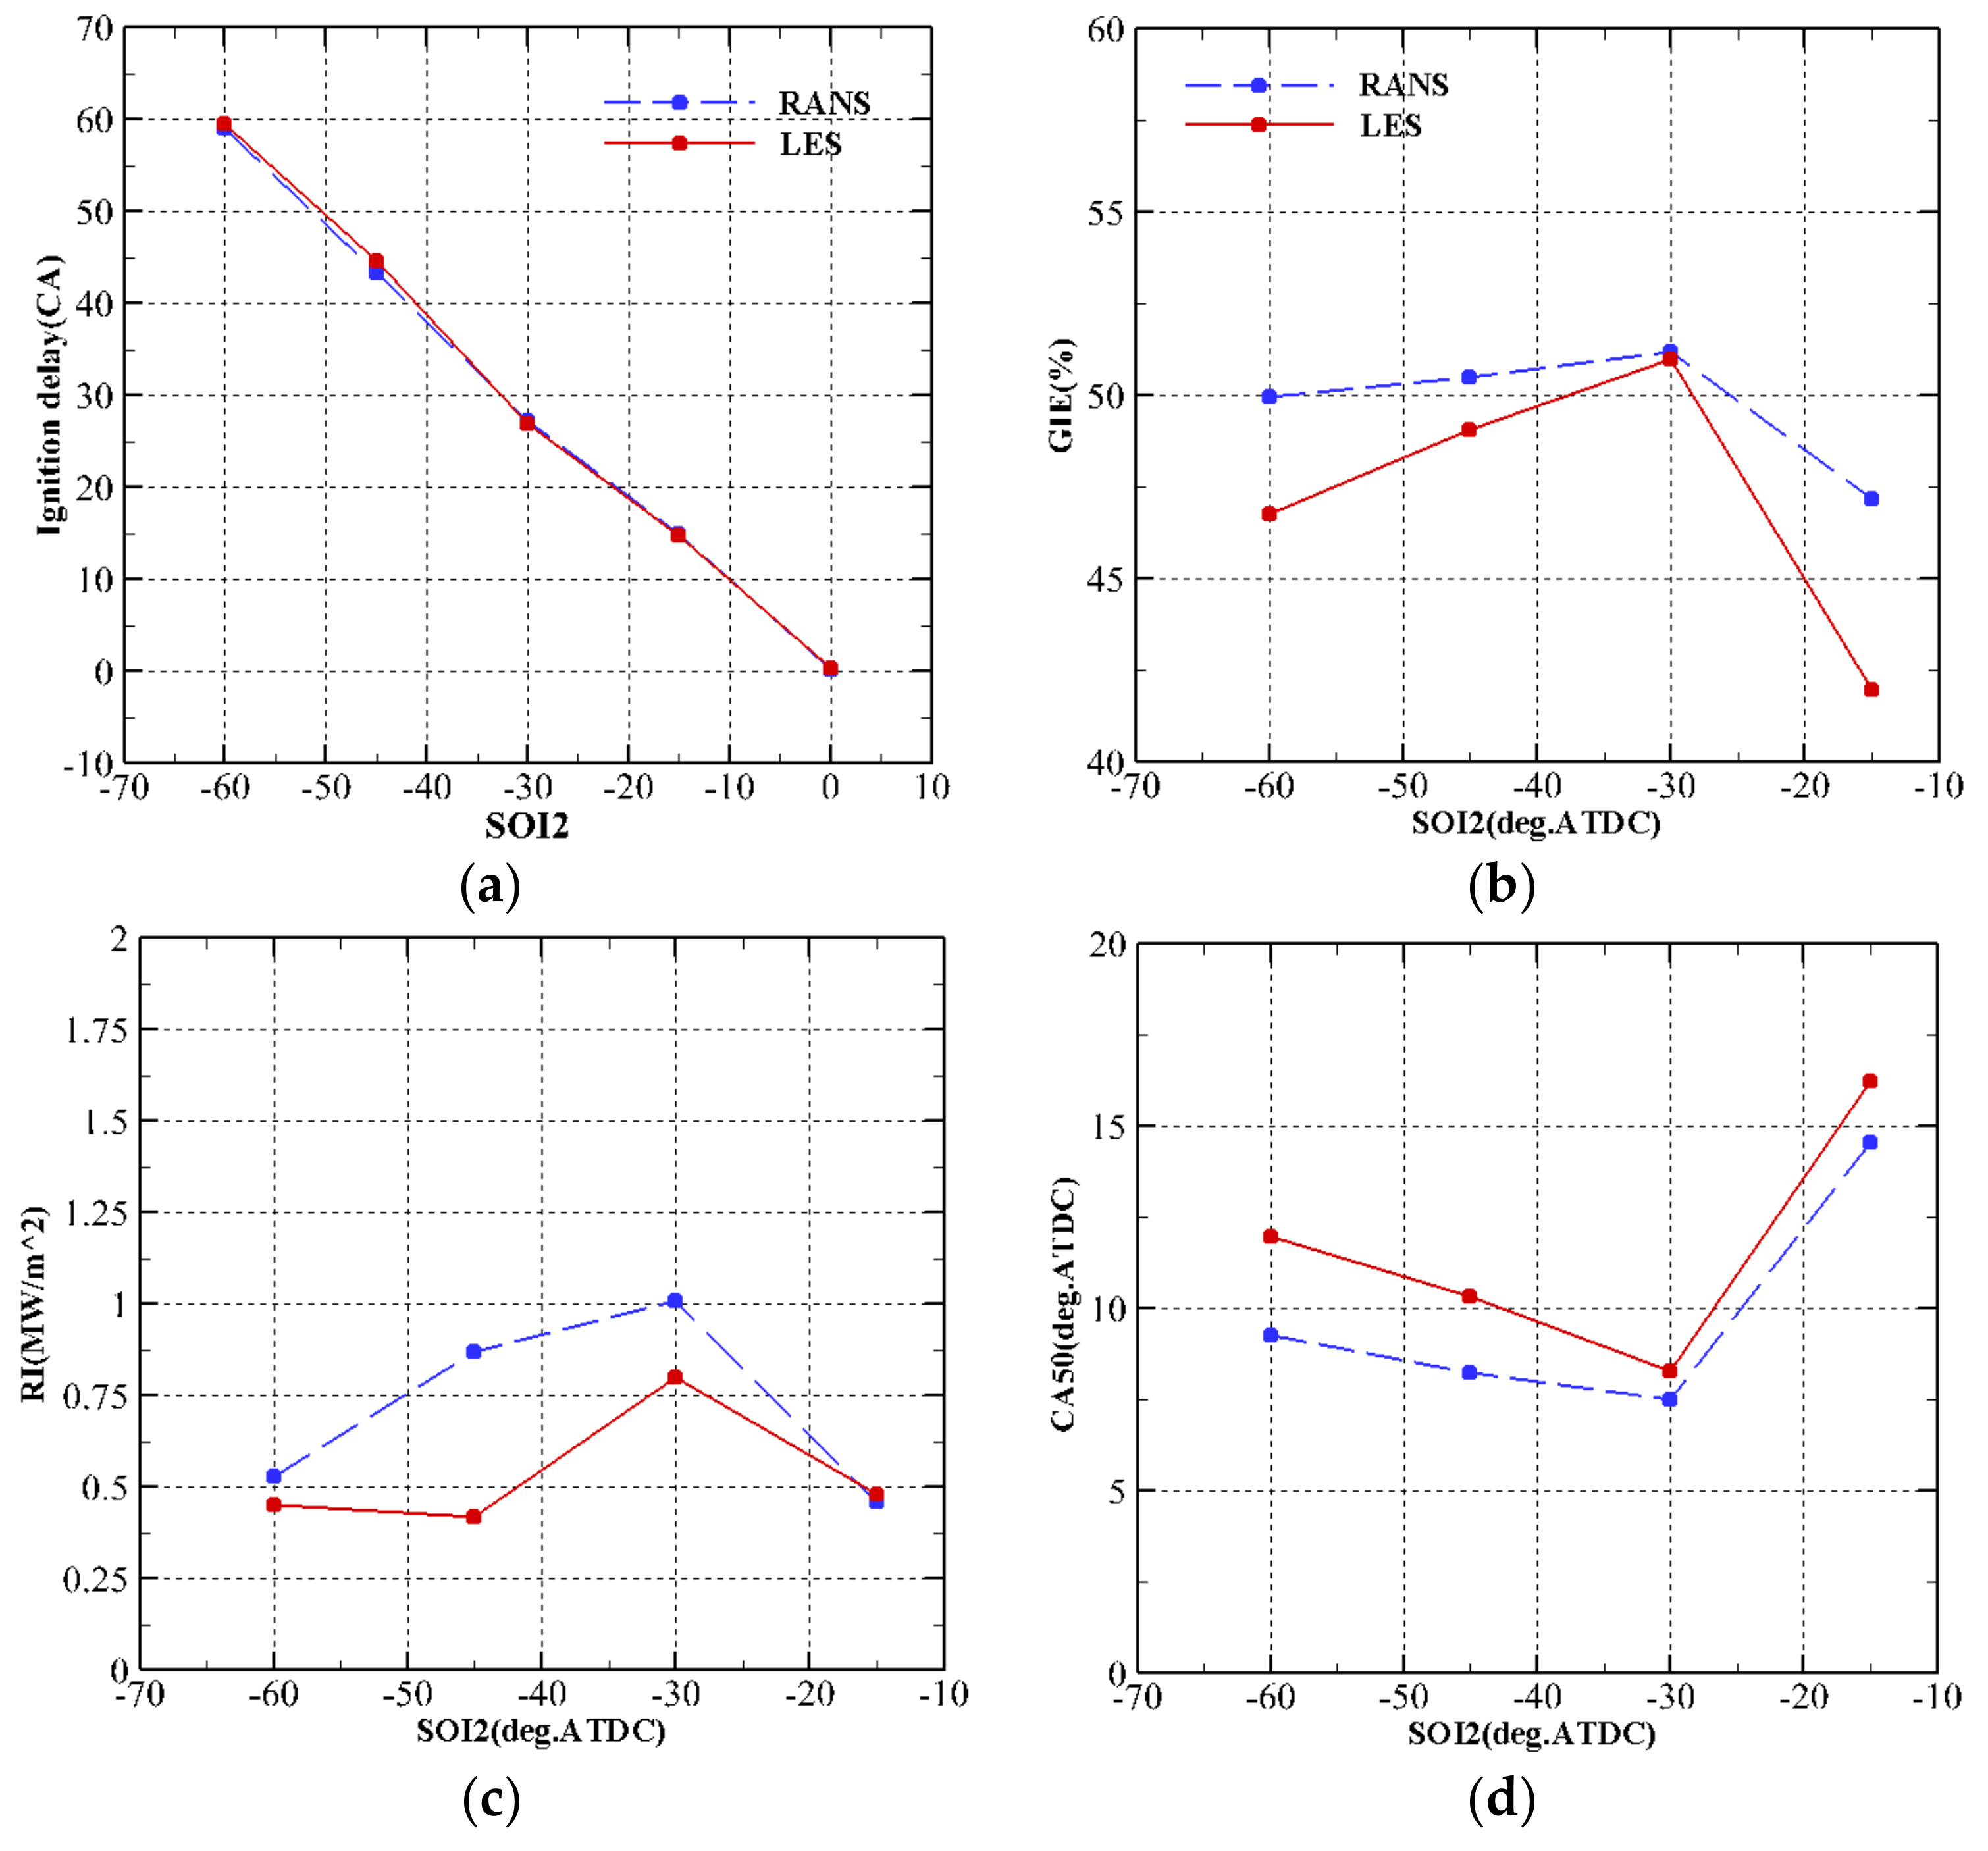
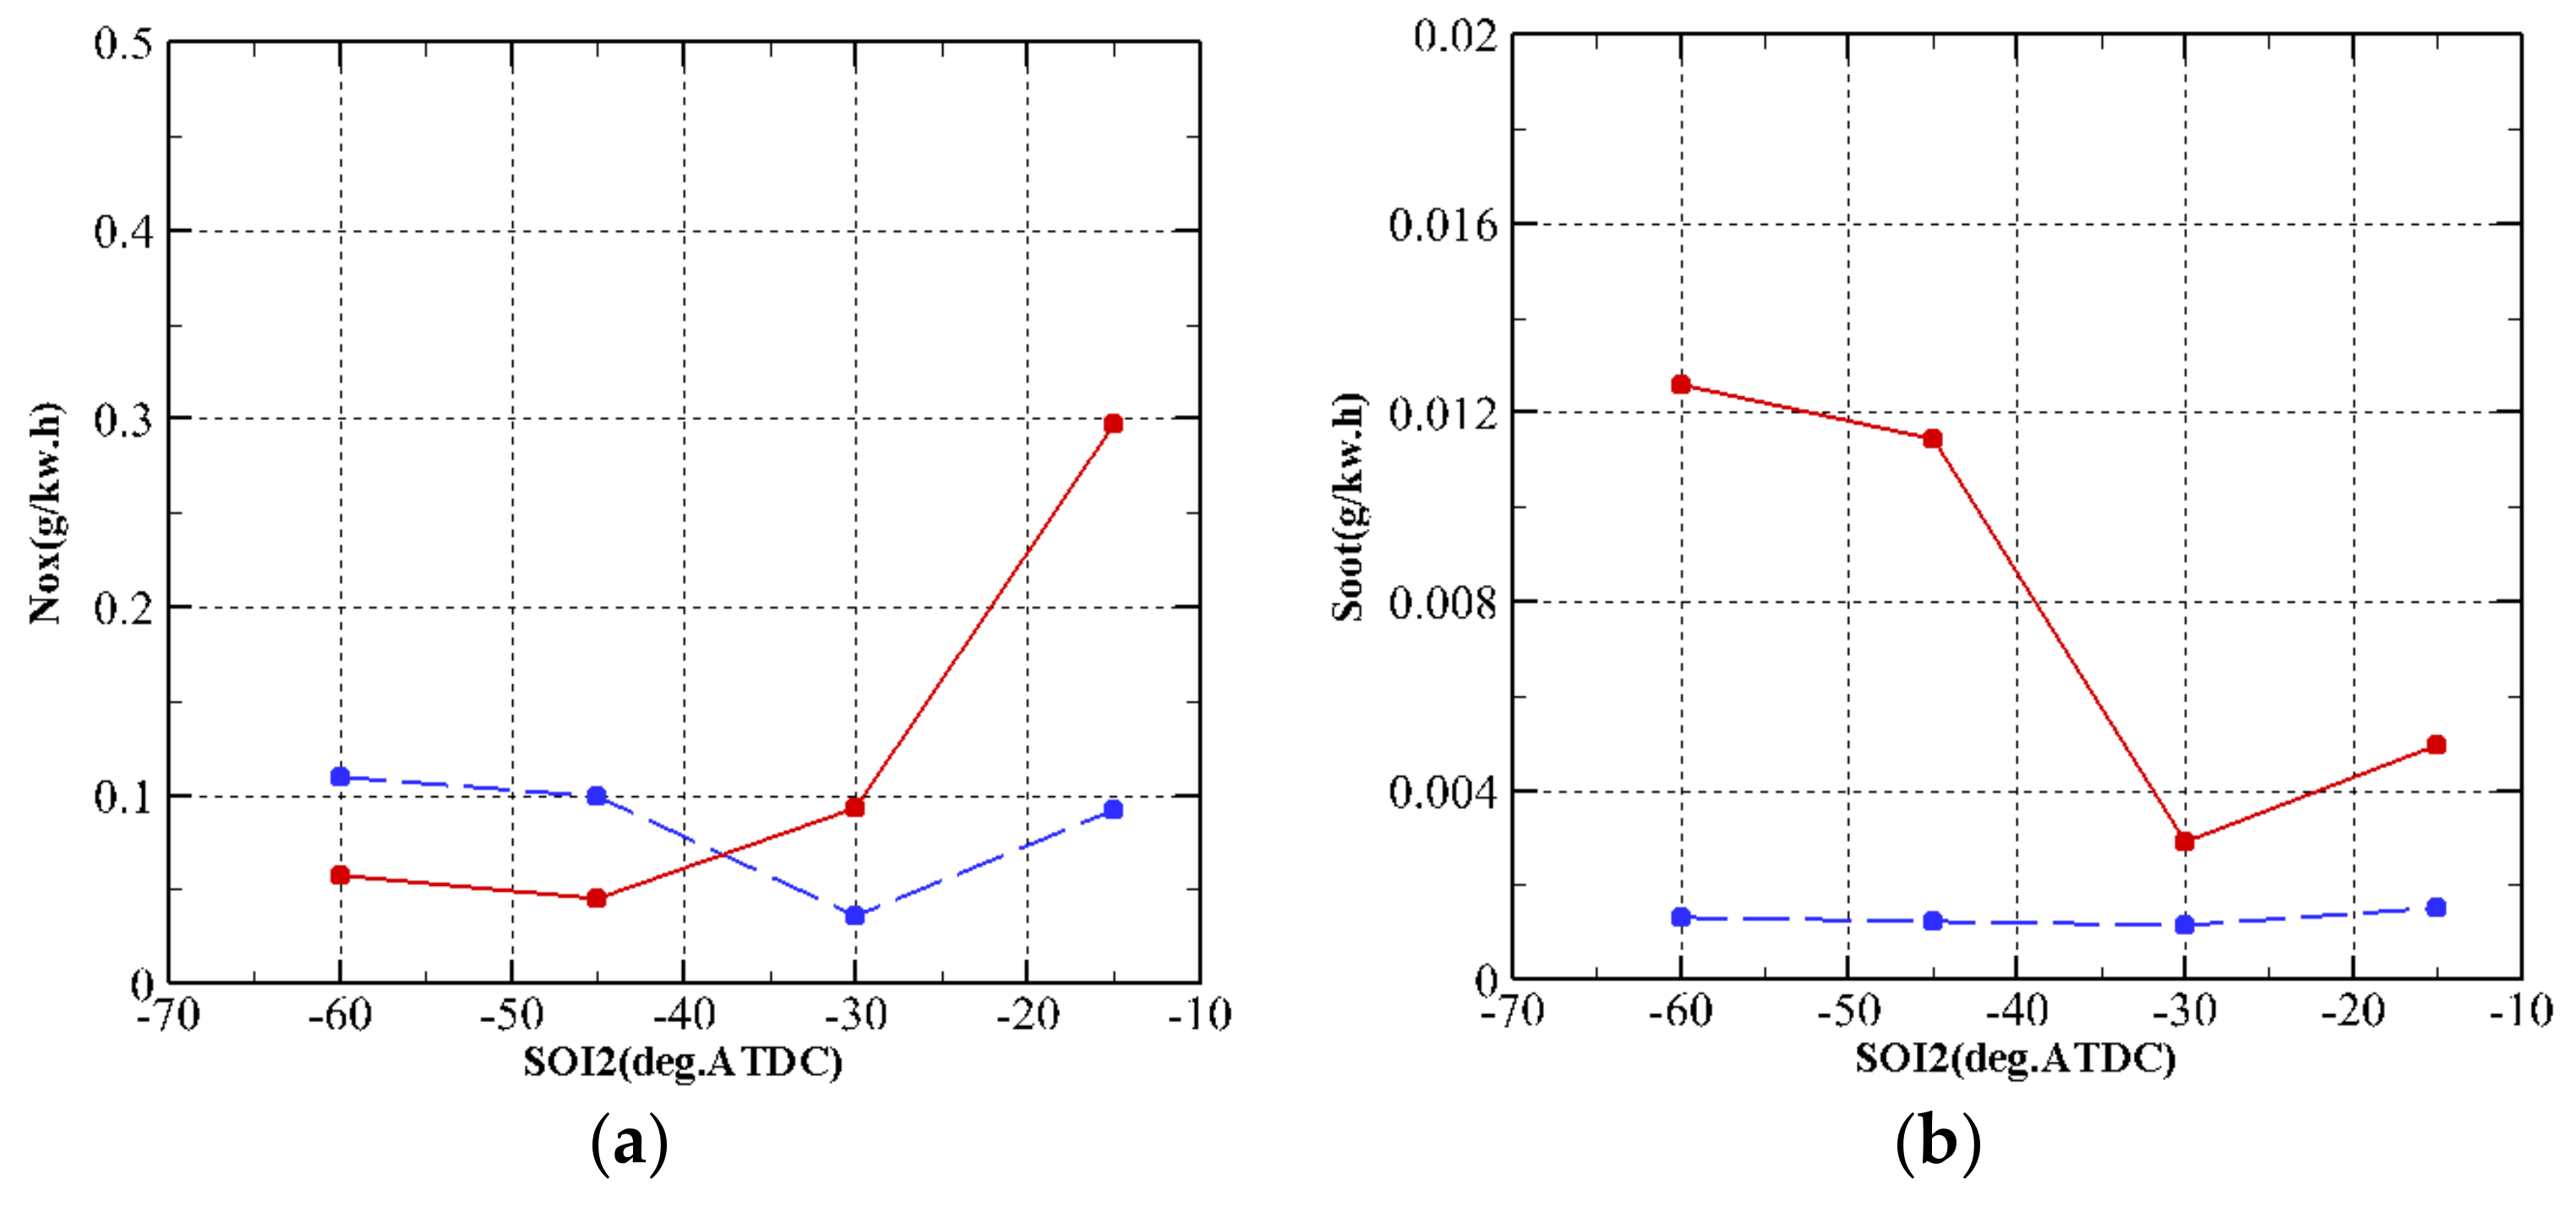
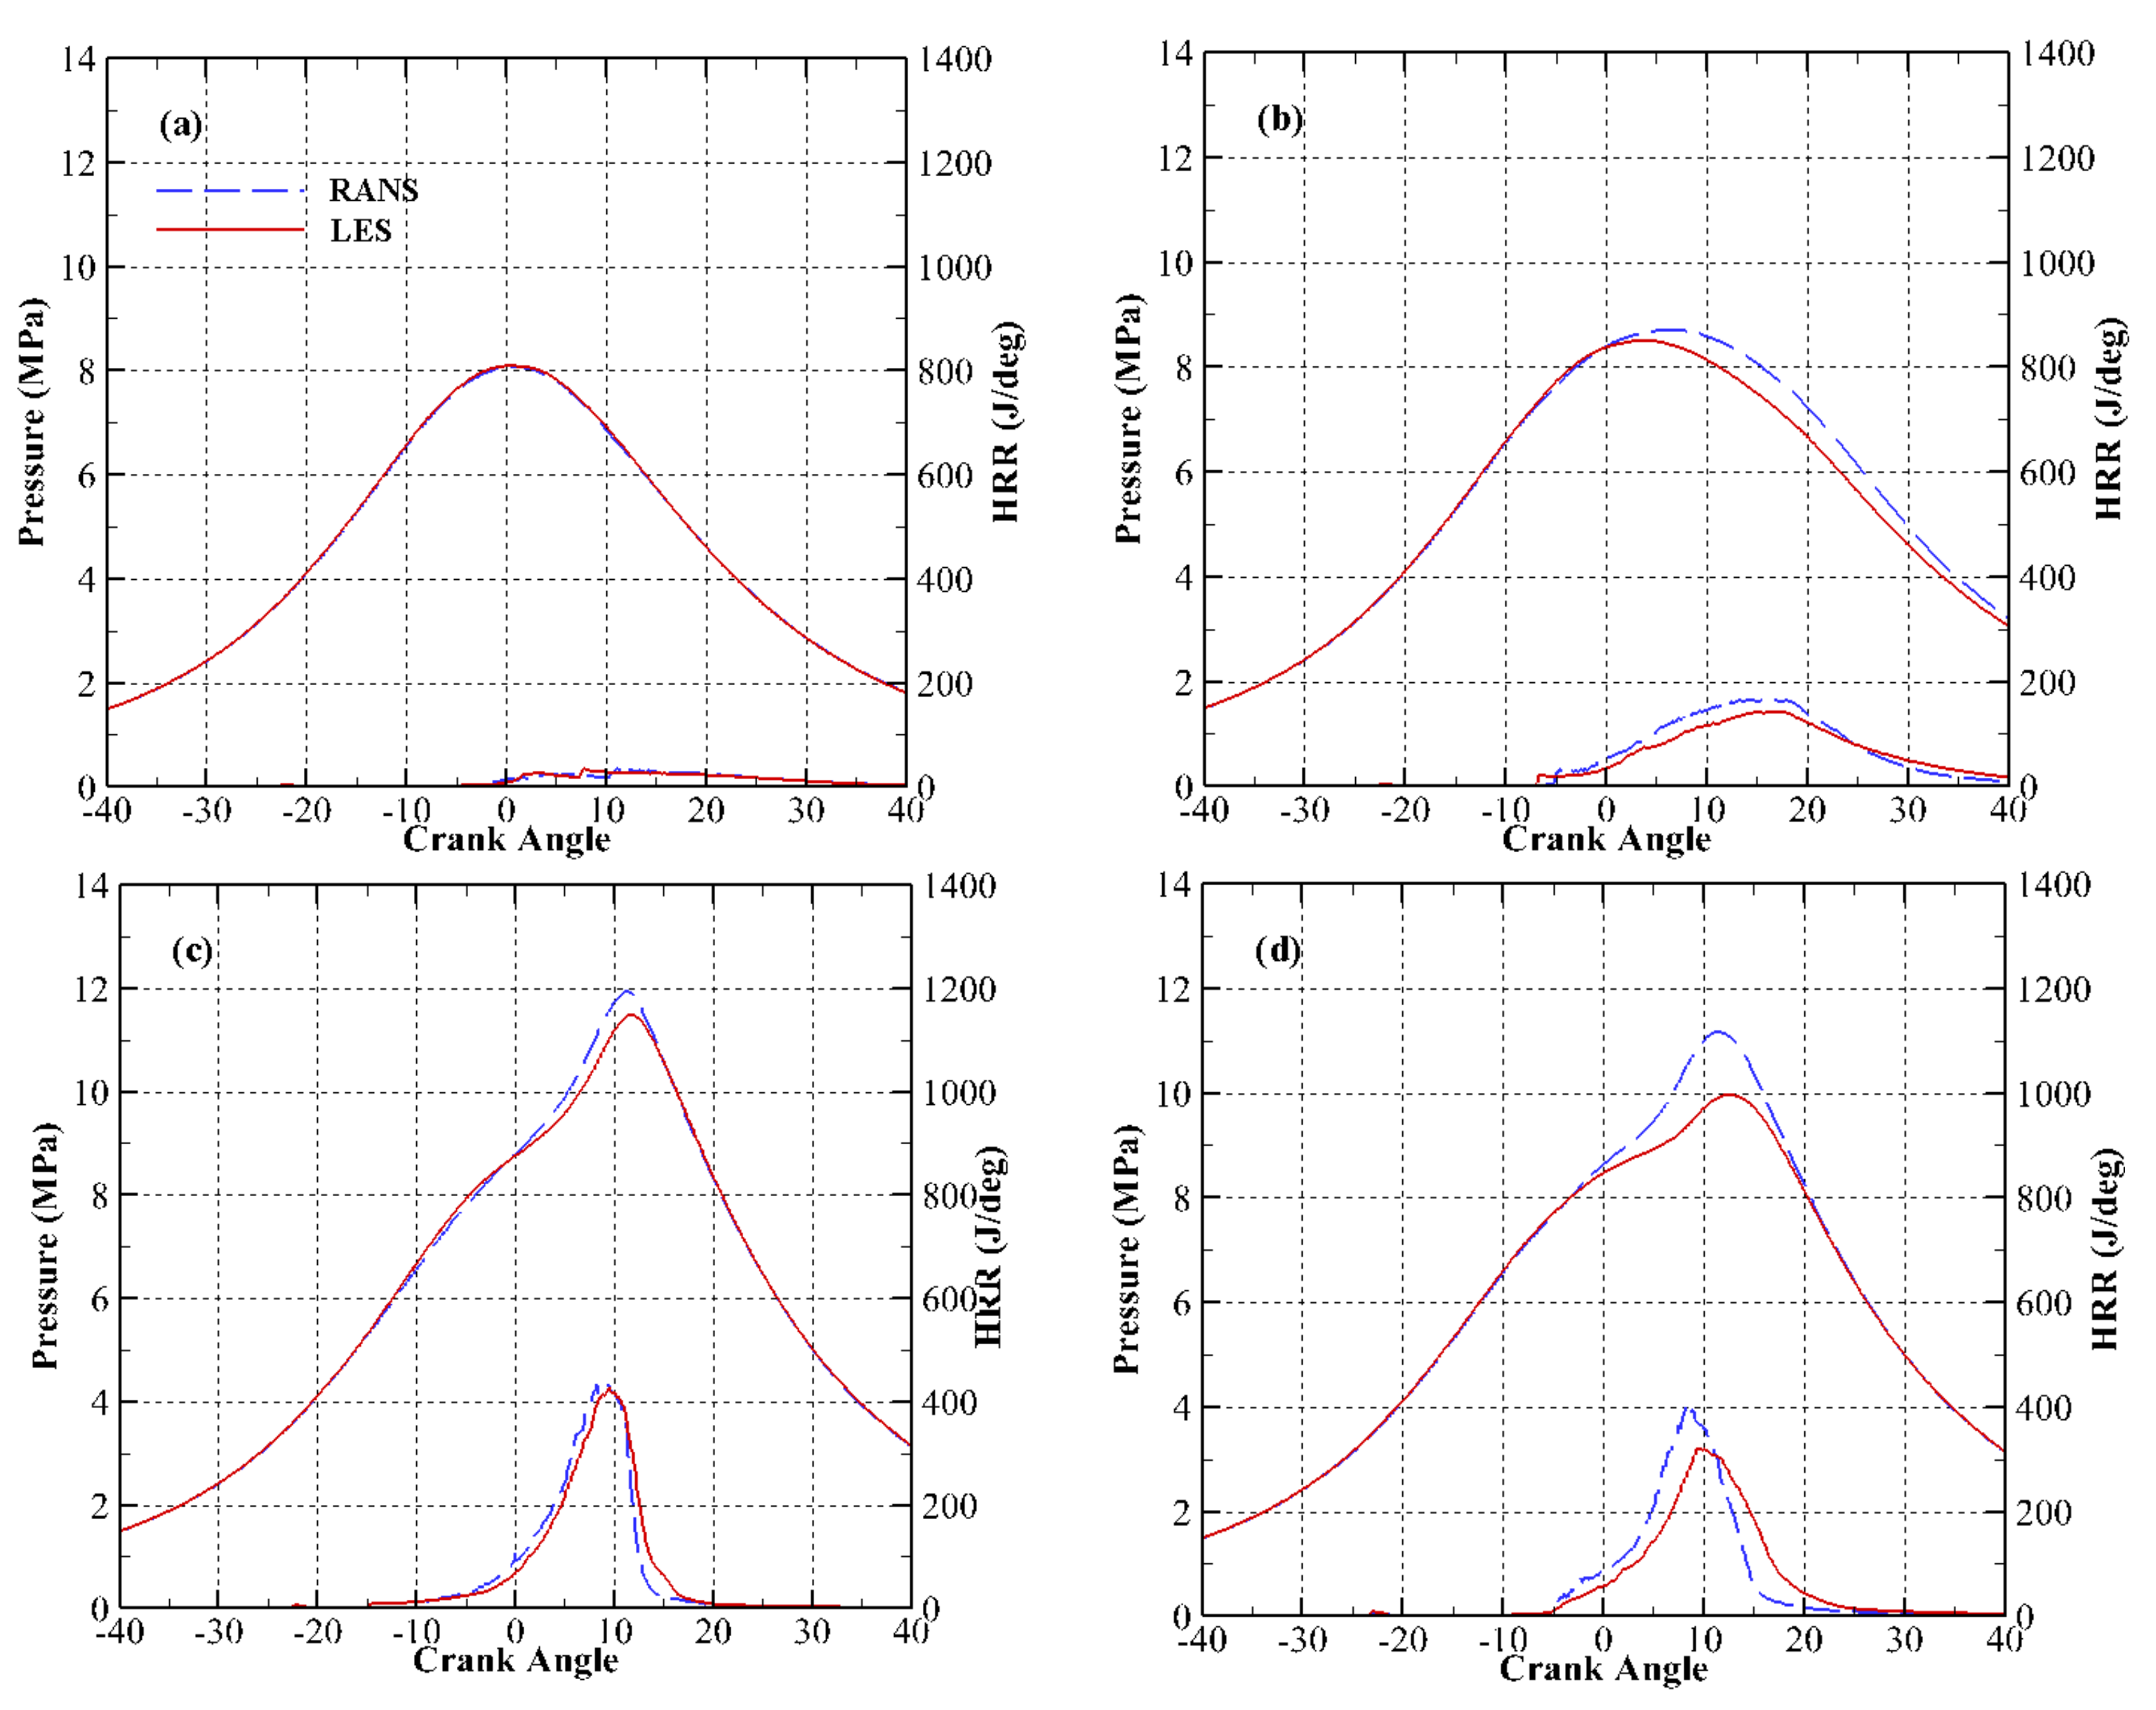
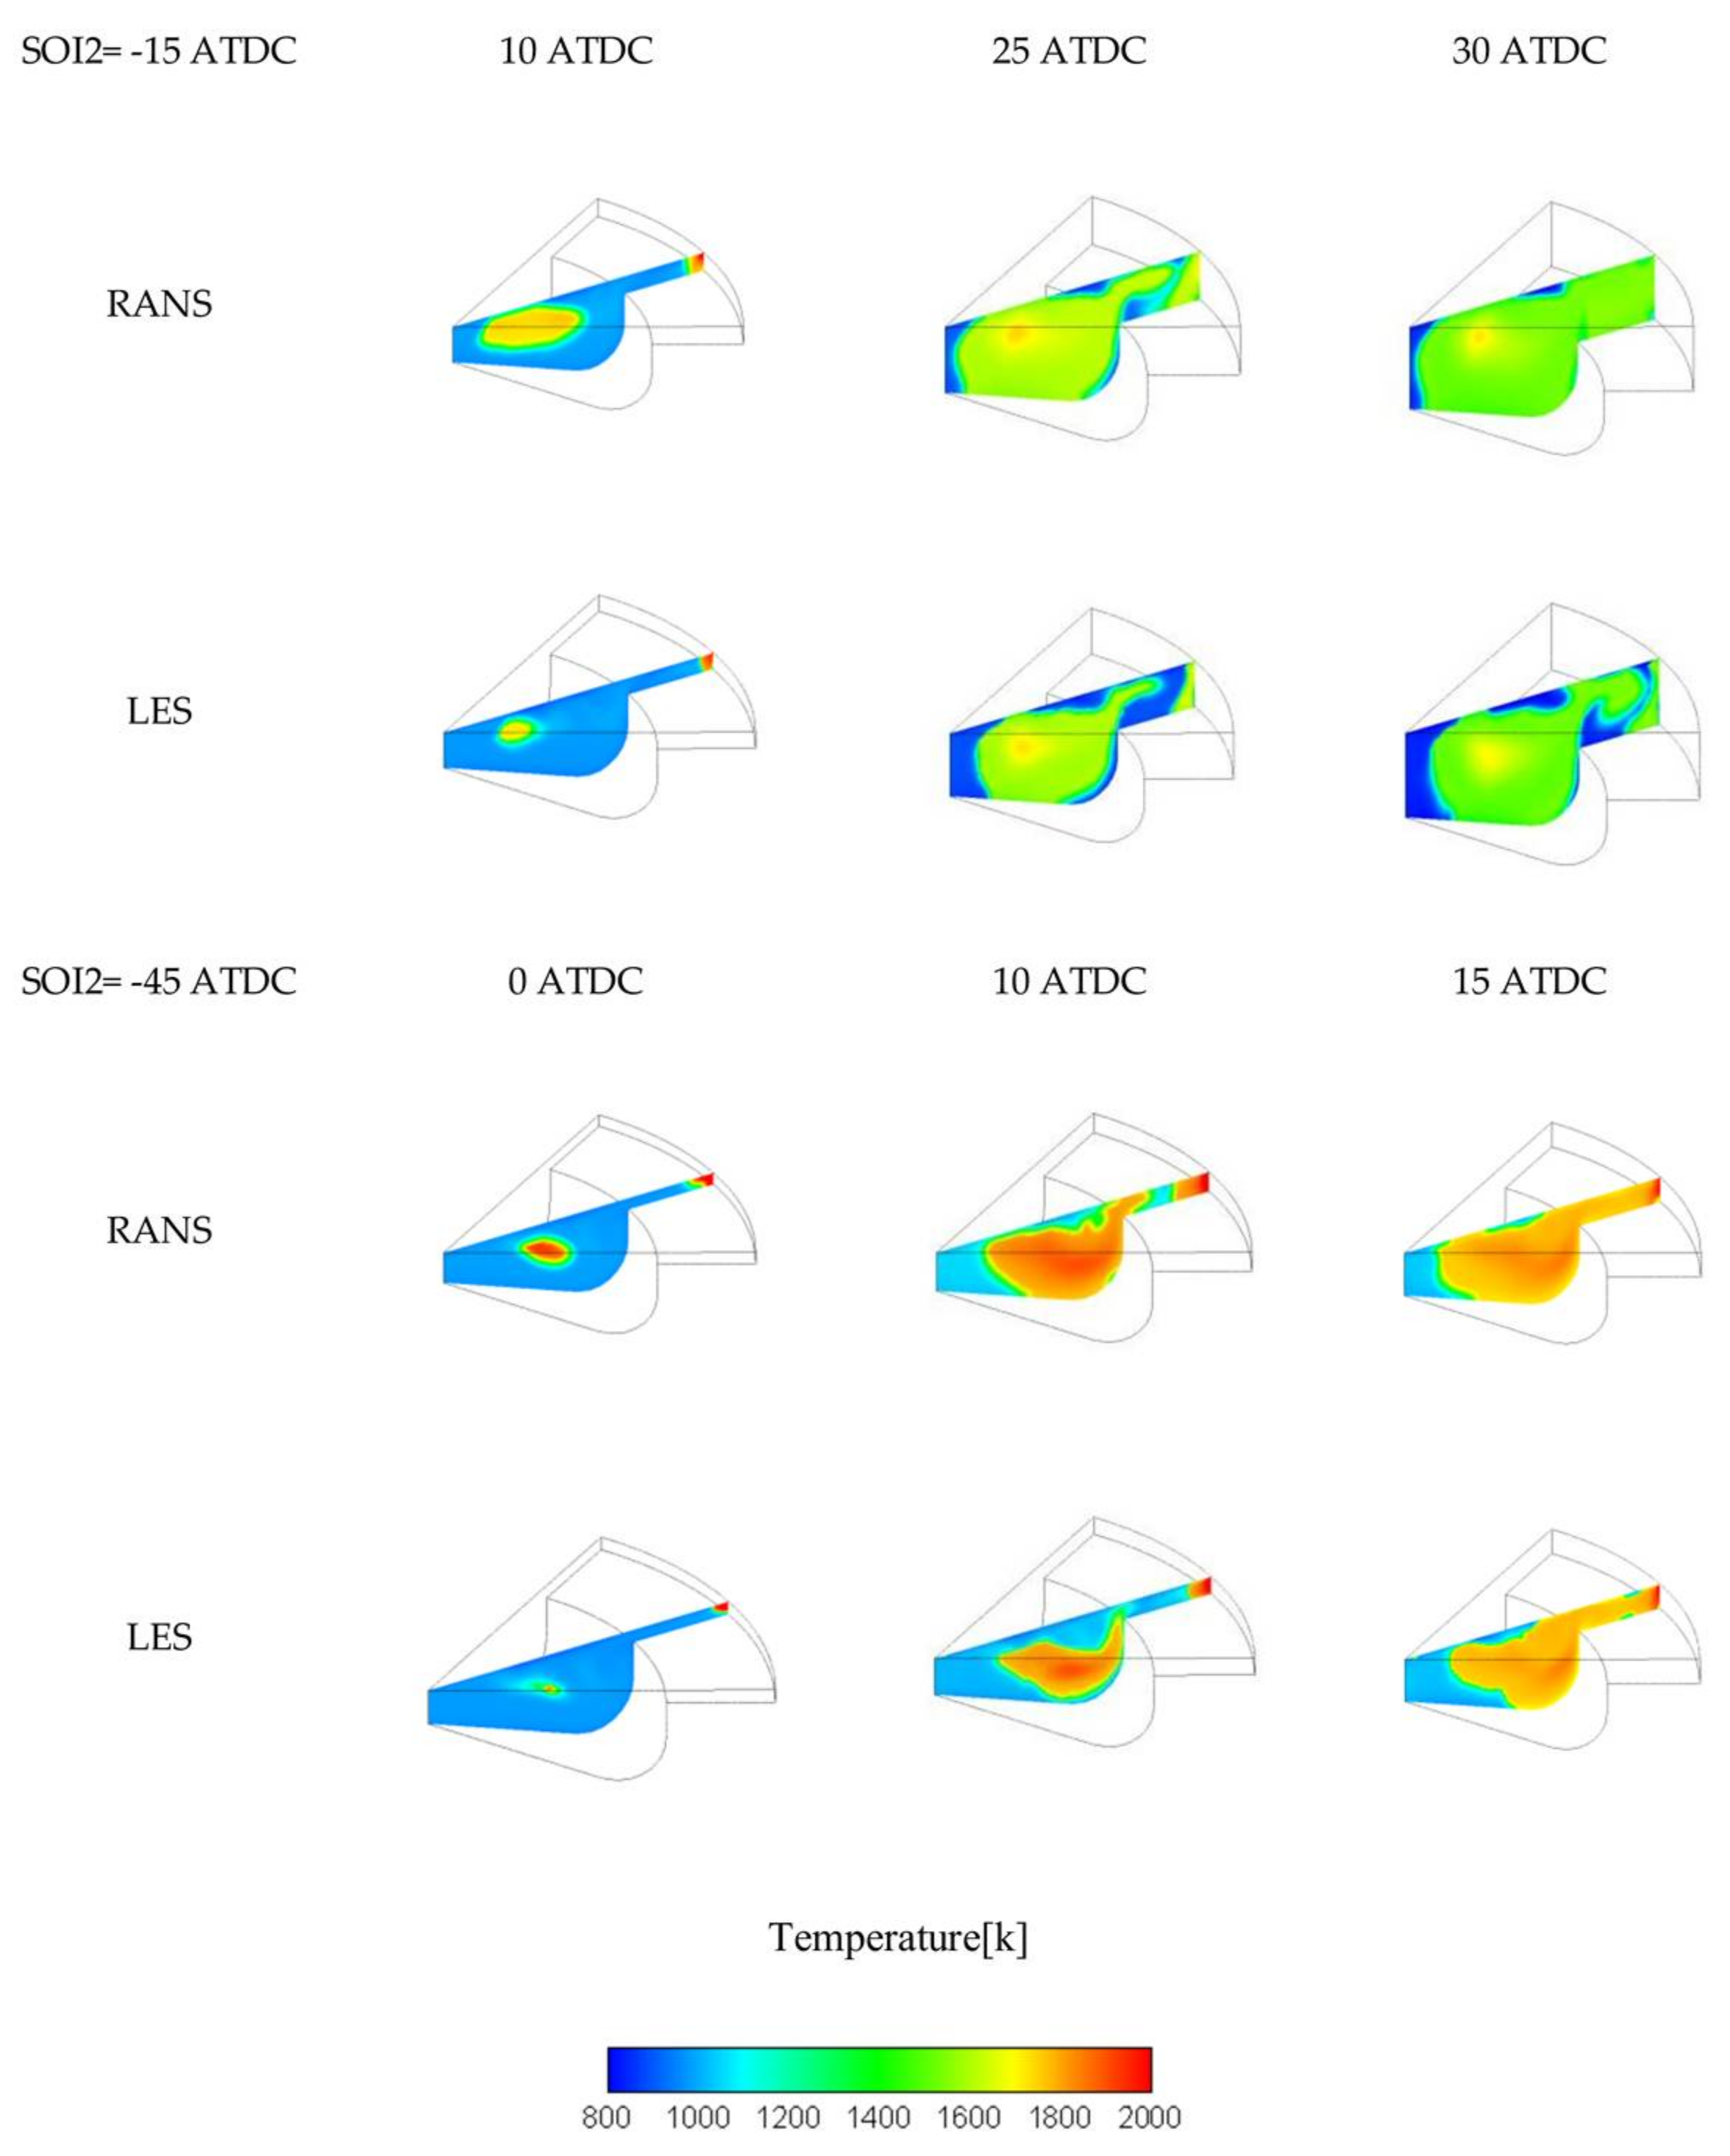
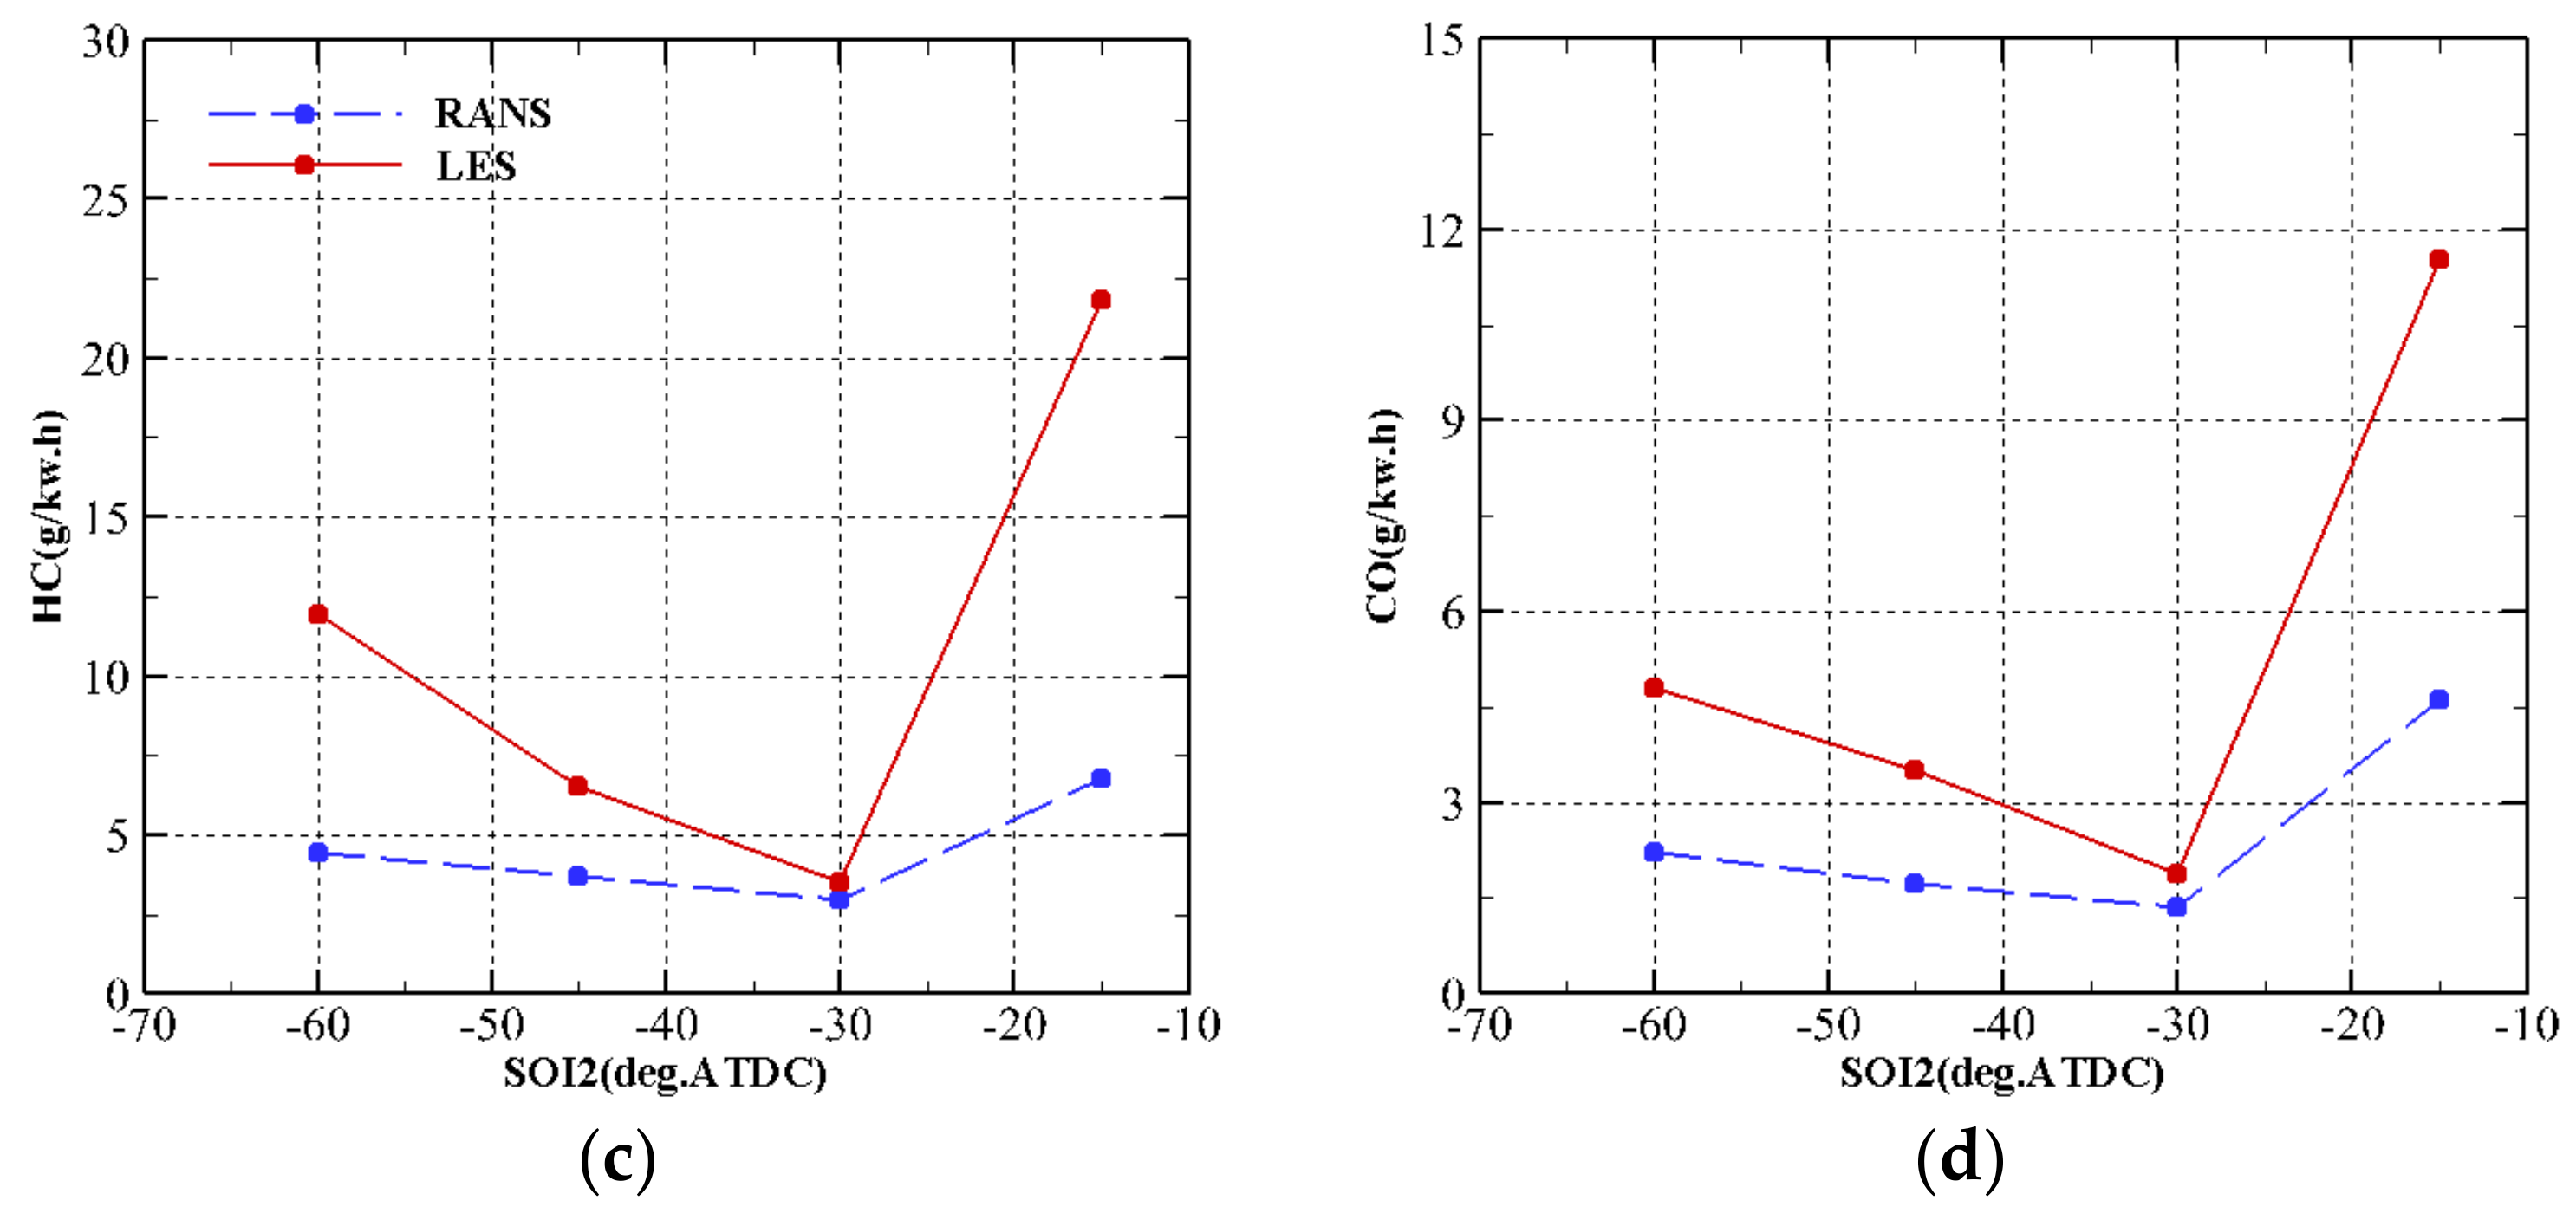
3.2. Effect of SOI2 Timing

In this section, SOI2 timing is varied in the range of −60 to −15 ATDC, meanwhile the SOI1 timing is kept constant at −80 ATDC. Figure 8 shows the predicted cylinder pressure and HRR for the SOI2 timing sweep for both RANS and LES models. It can be seen that, as SOI2 is advanced from 0 to −30 ATDC, the cylinder HRR and pressure are raised and combustion phasing is advanced, leading to higher in-cylinder temperatures (see Figure 9). But, as the SOI2 timing is further advanced to −60 ATDC, a contradictory behaviour is observed. With advanced SOI, the combustion is reactivity controlled; in contrast, the combustion with late SOI2 timing is close to mixing controlled. Generally, an early SOI2 timing is recommended to achieve low RI and emissions. The detailed discussion about this behaviour can be also found in Reference [14]. The interesting point is that the difference between LES and RANS models are much distinctive and obvious as the SOI2 timing is advanced. The comparison of RANS and LES models for SOI2 effect on ID, GIE, RI and CA50 are illustrated in Figure 10. Regarding the ignition delay, both models have predicted it precisely but LES is more robust and reliable in prediction of performance parameters.
Figure 11 shows the emissions trends as the SOI2 timing varies. As the SOI2 timing is delayed, CA50 is near to TDC, which increases the temperature of combustion and consequently increases NOx emissions. When ignition happens close to TDC, the lowest CO emission is achieved, since the in-cylinder temperature and pressure are high. Regarding UHC and CO emissions, both models have similar prediction with this difference that LES predicts the amount of these two pollutants more precisely than RANS. Figure 11 indicates that by using RANS model soot emission does not change with SOI2 timing sweep but LES can predict soot trend well. Generally, both LES and RANS models show the similar behaviour during SOI2 sweep but LES more exactly predicts the emissions trends.

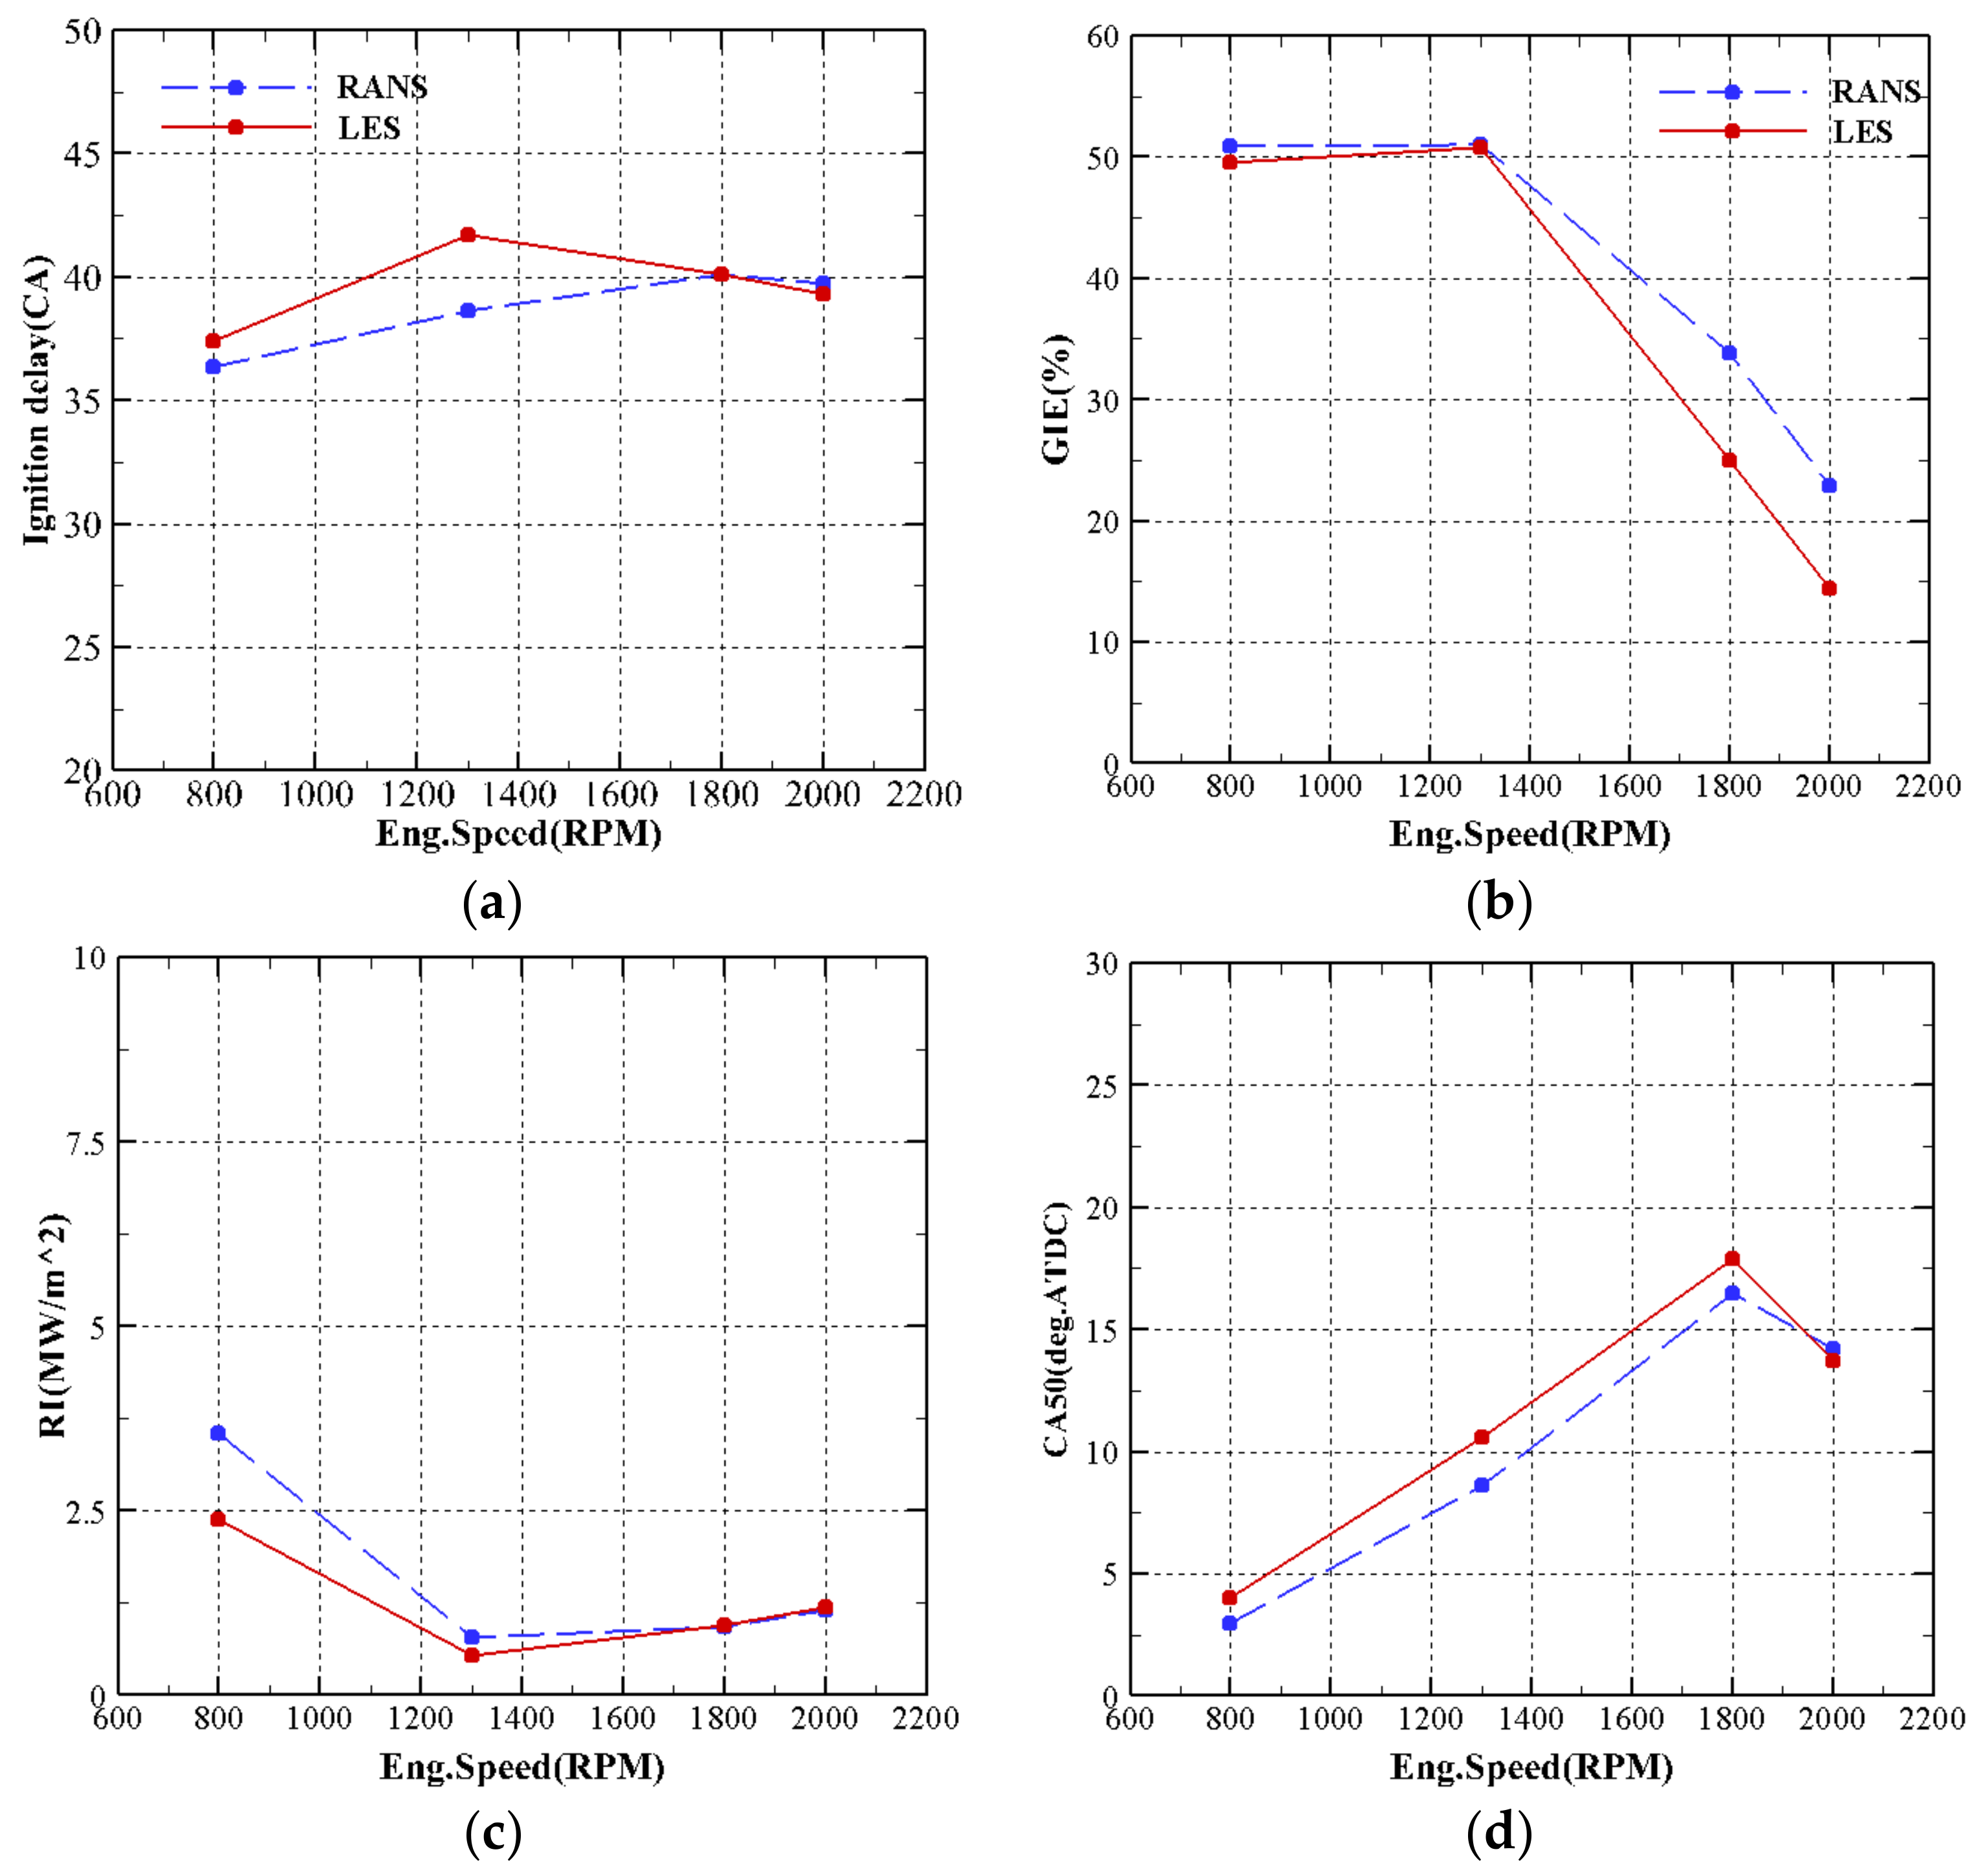
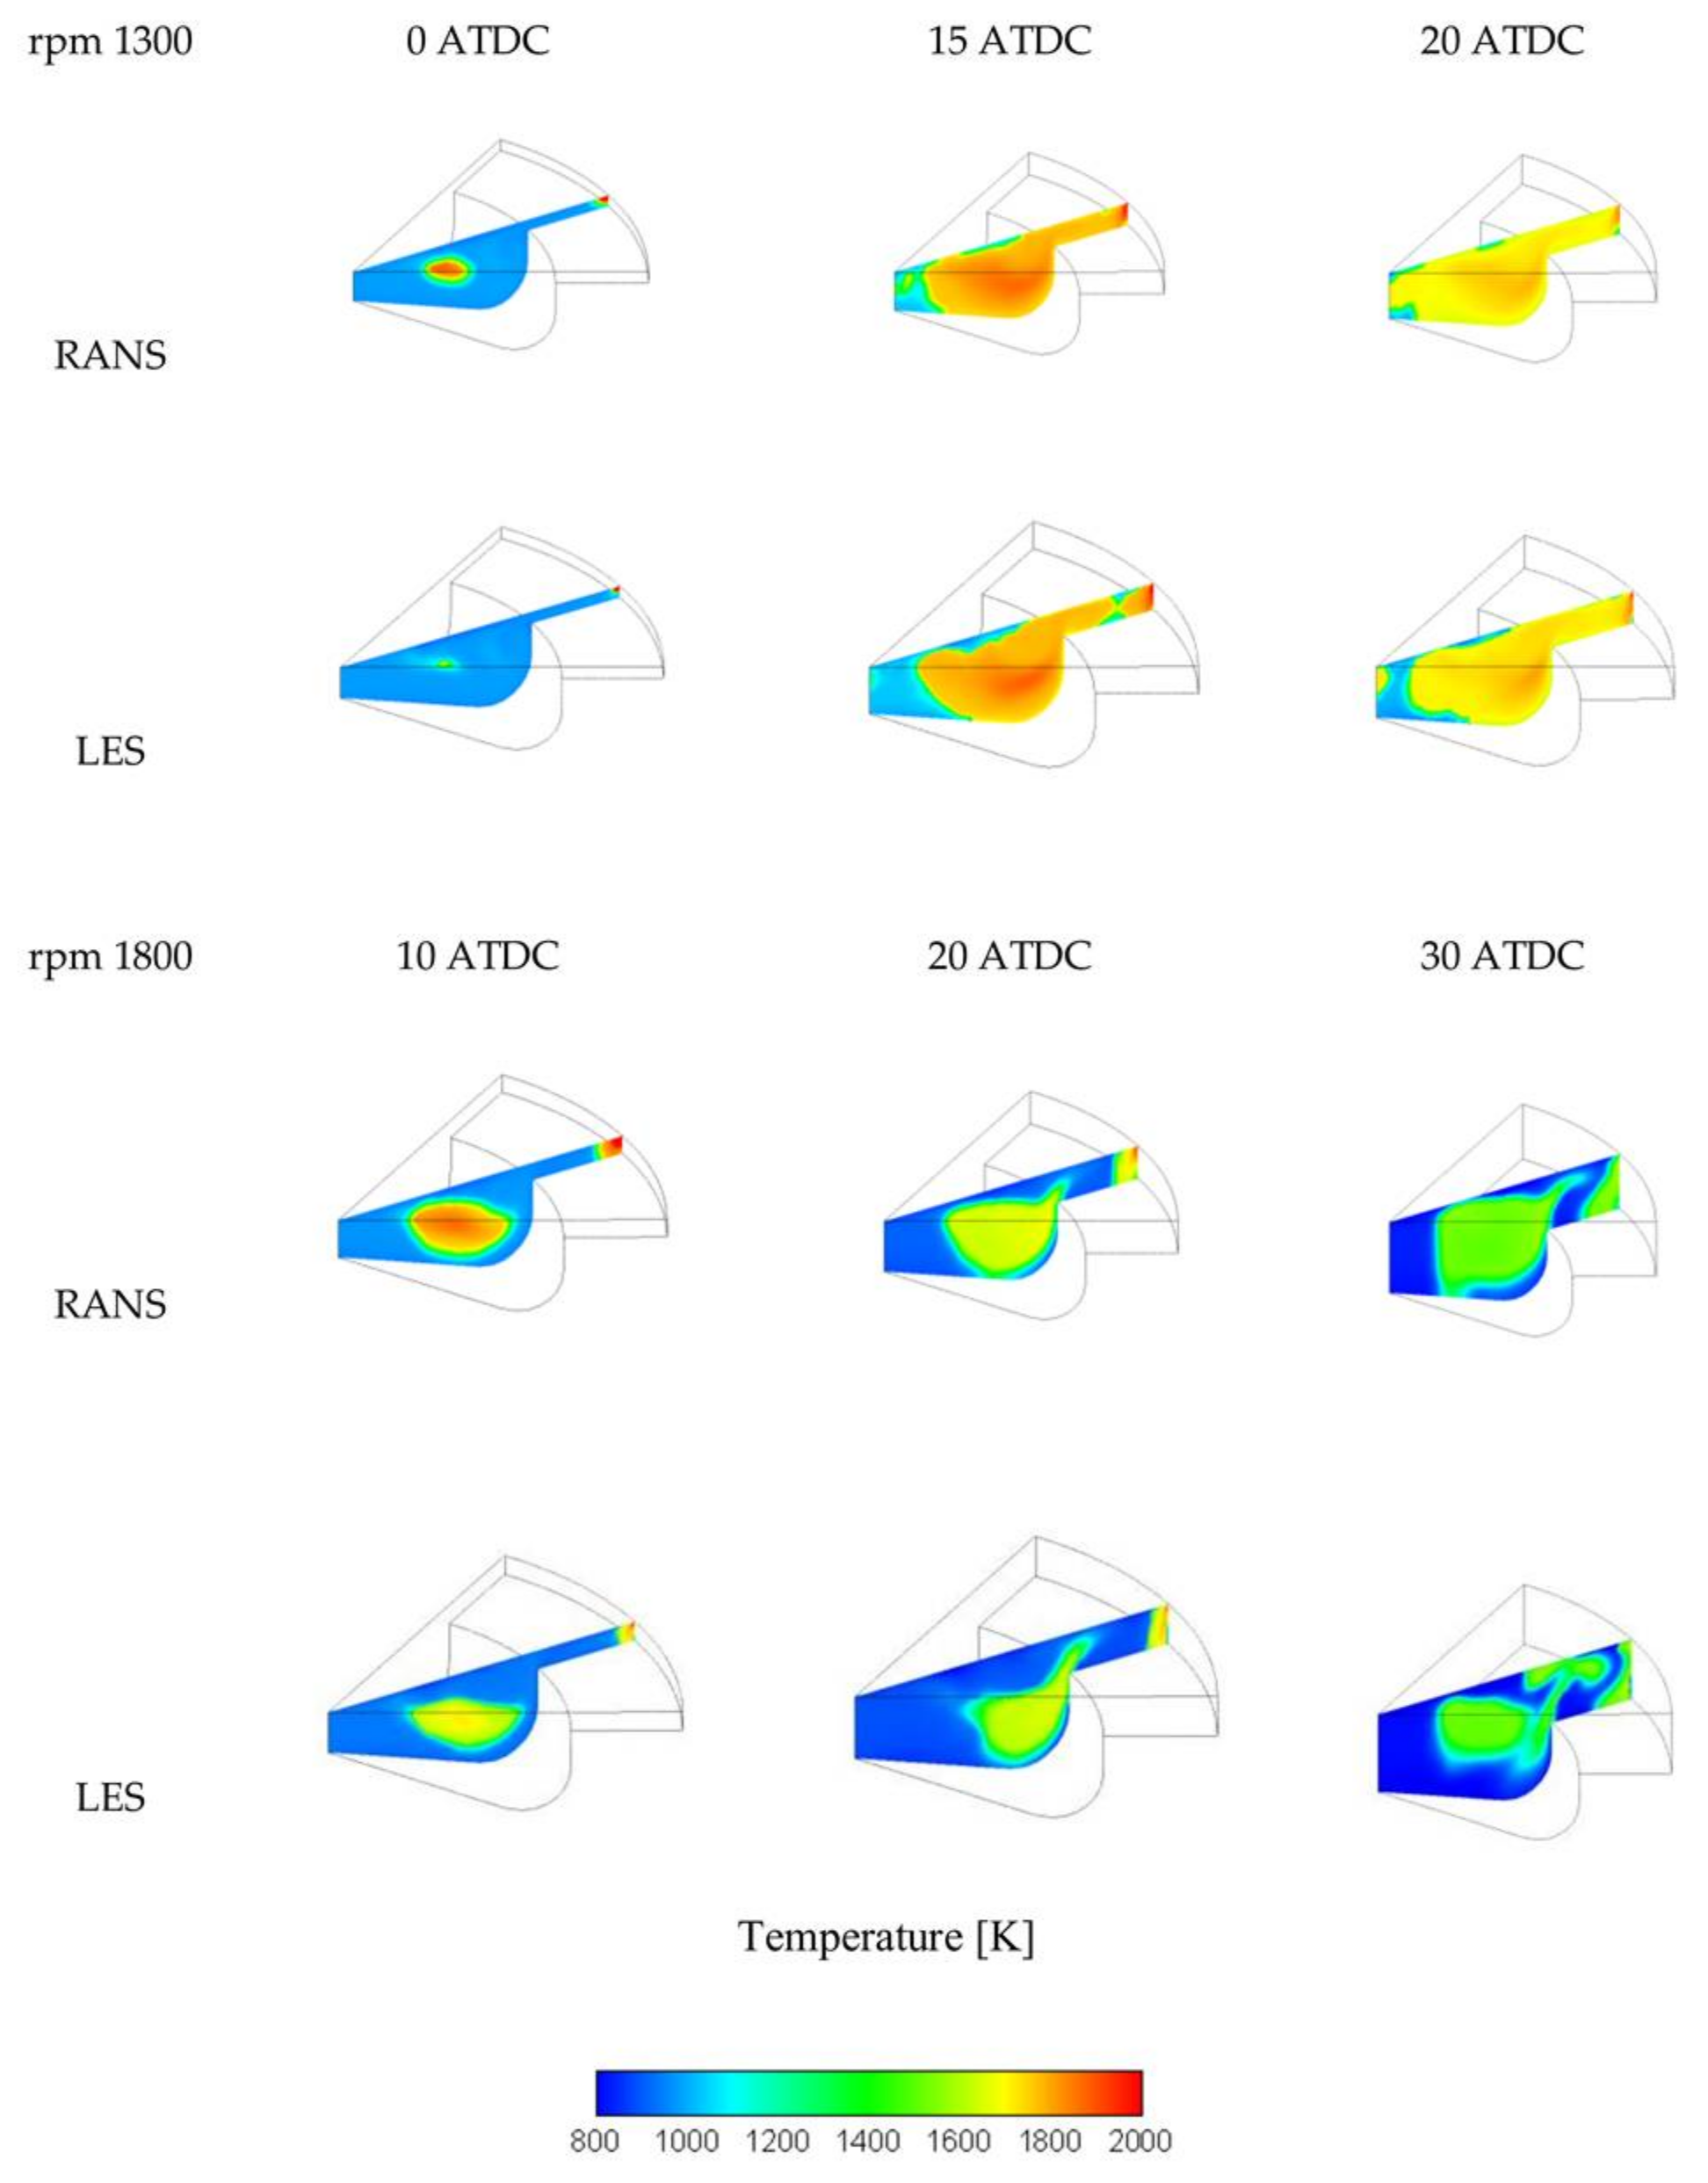
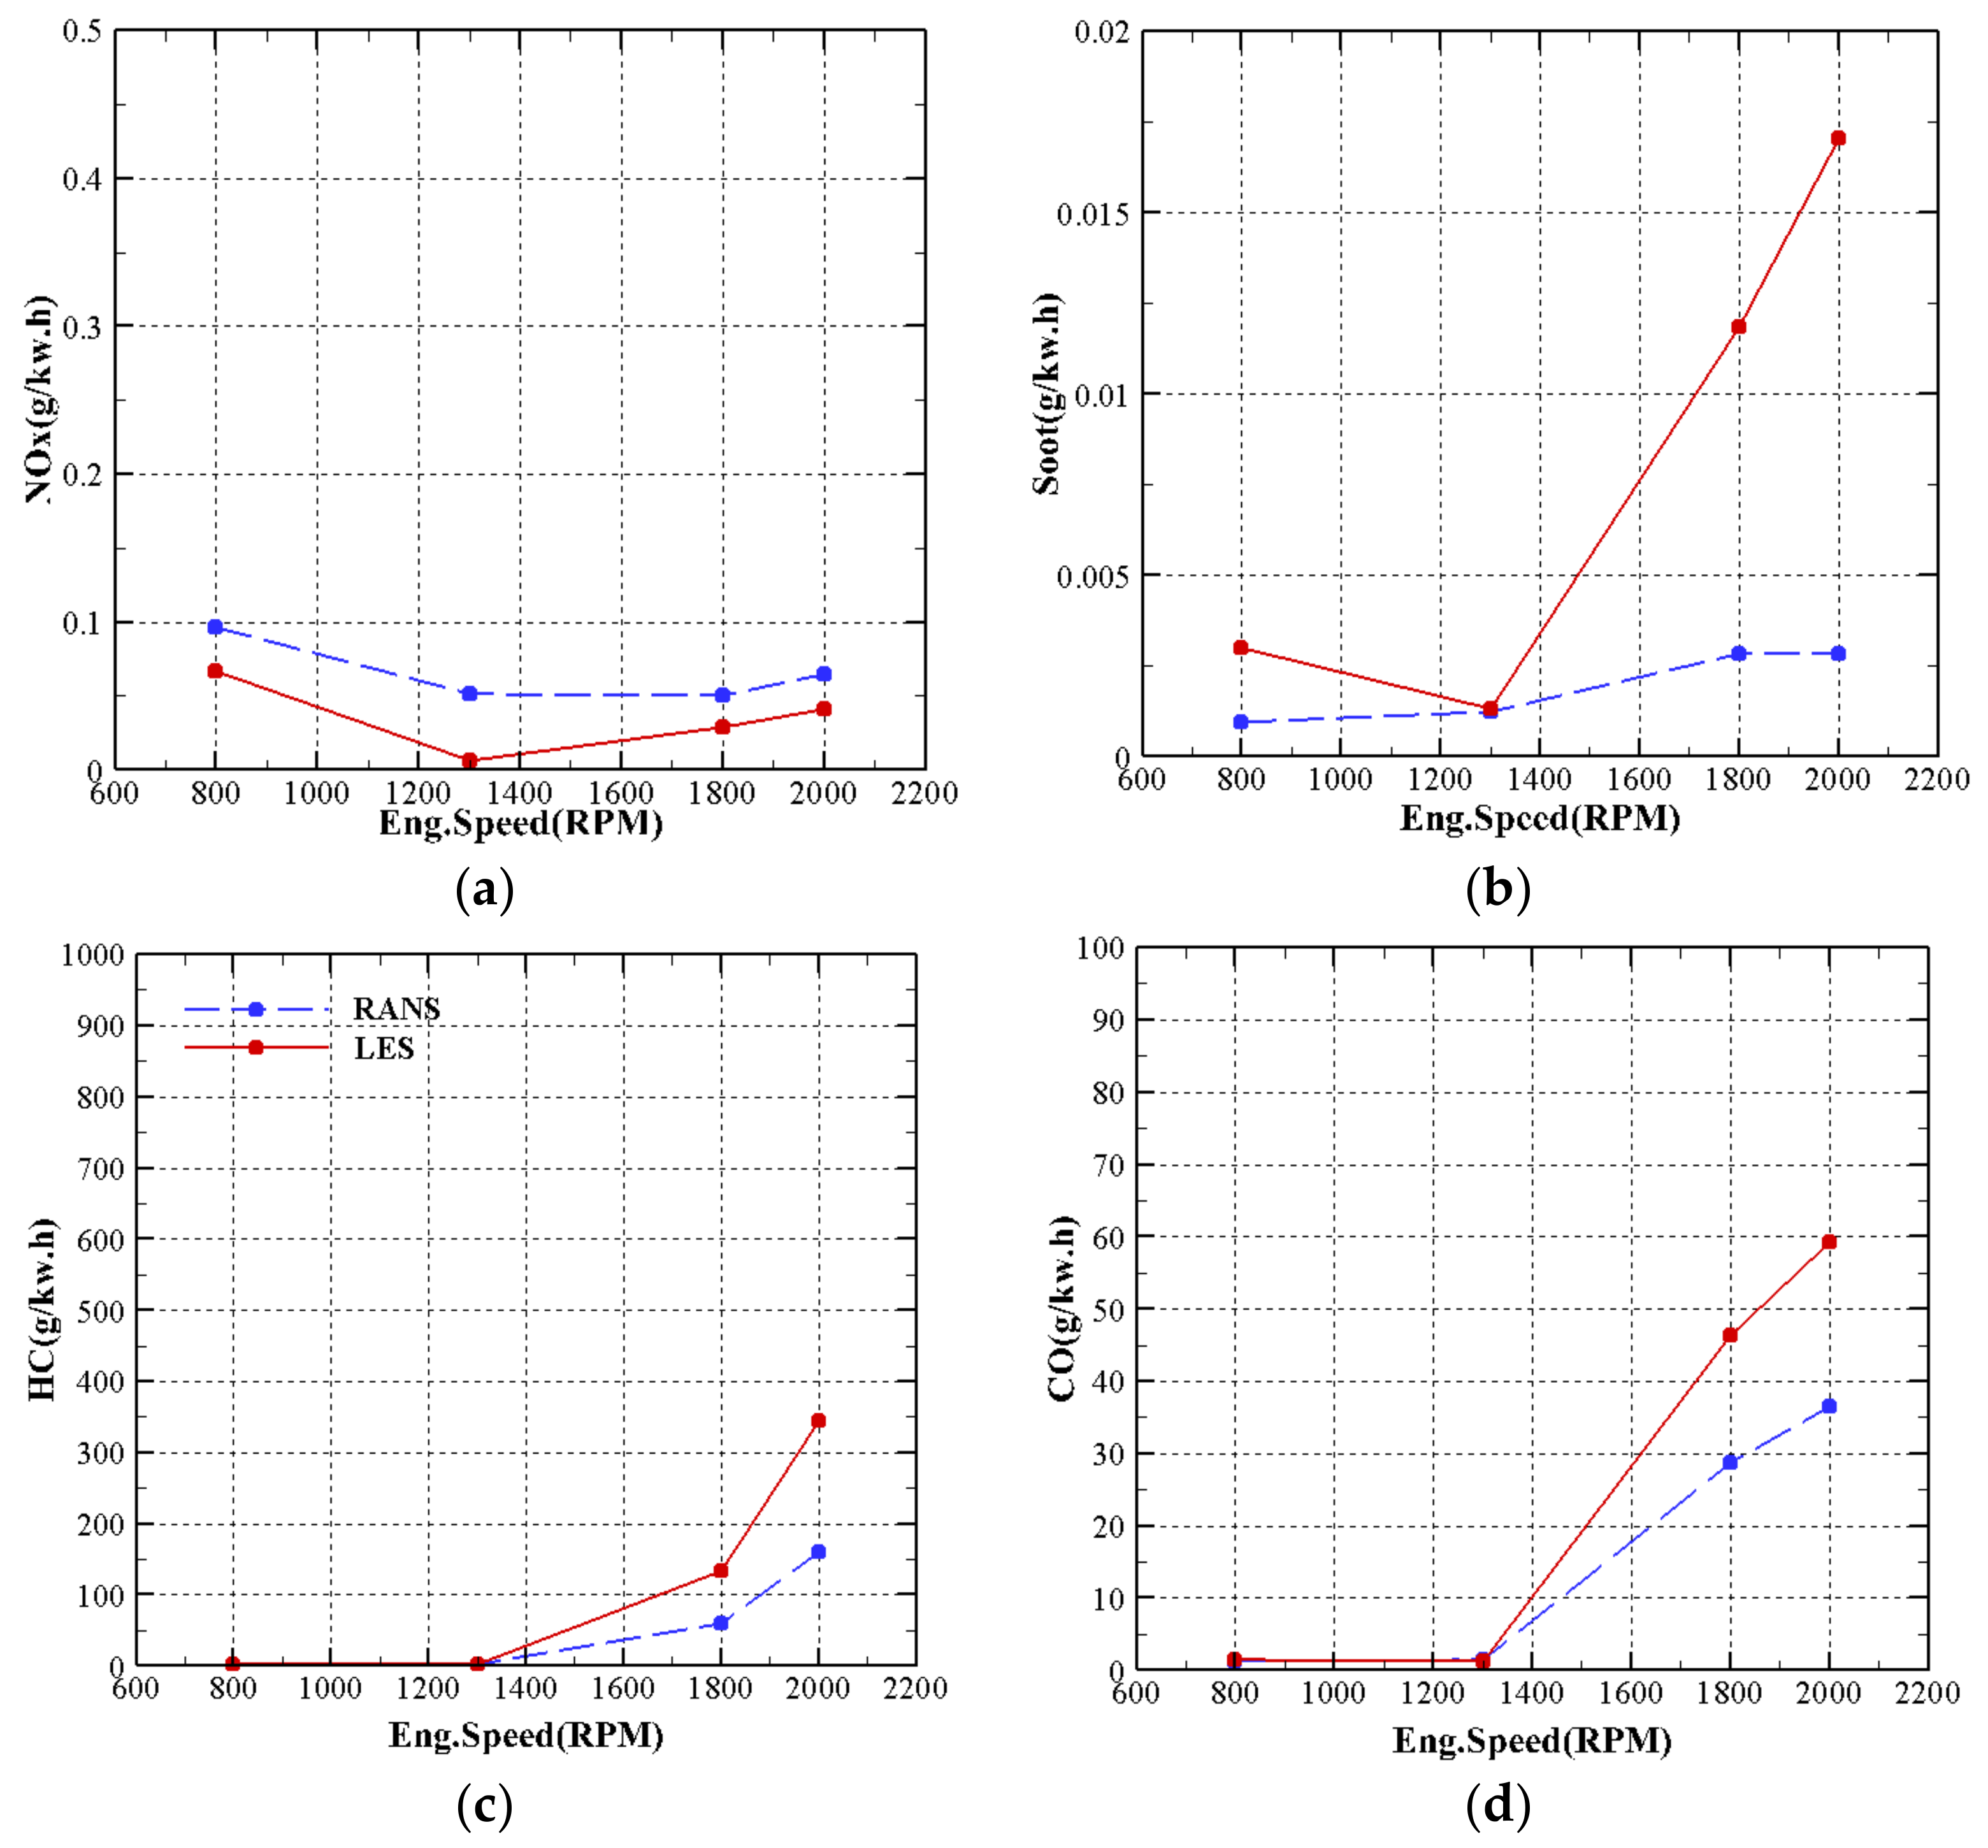
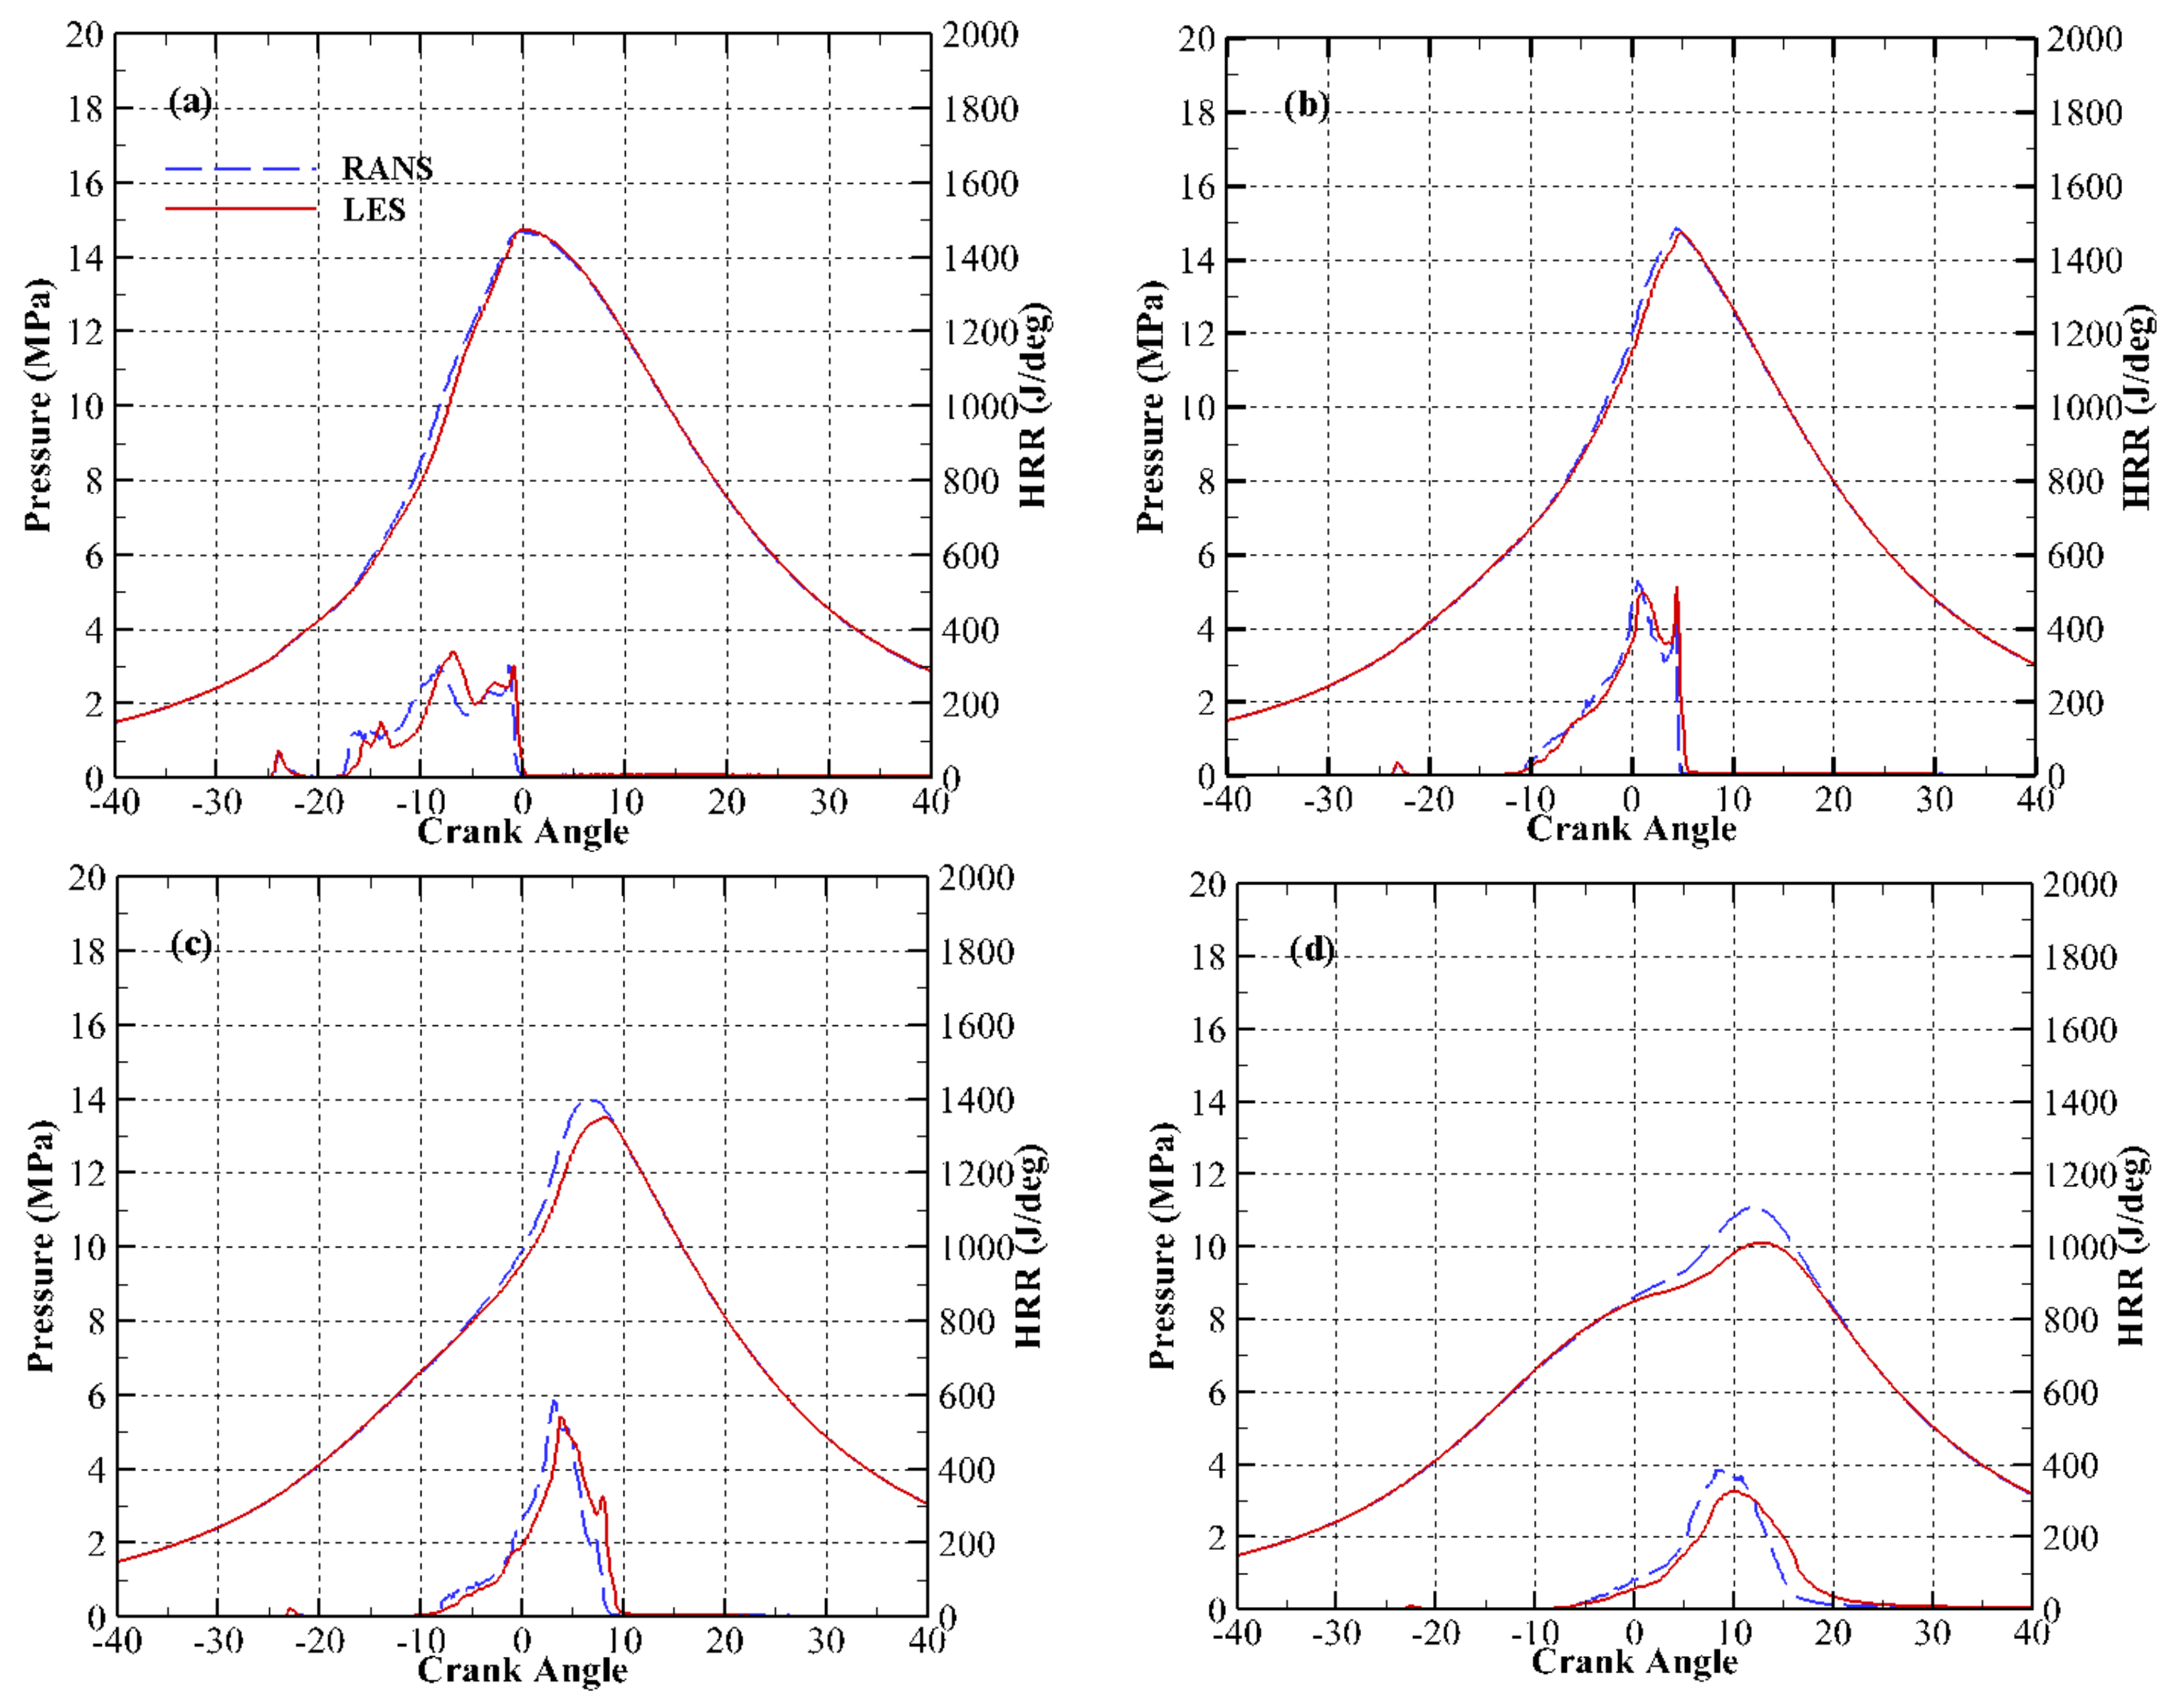
3.3. Effect of Engine Speed

The engine speed effect on cylinder pressure and heat release rate is illustrated in Figure 12. The influence of engine speed on ID, GIE, RI and CA50 is also shown for LES and RANS models in Figure 13. It is known that, at lower engine speed, the needed time for initiation of combustion reactions is higher and combustion happens at lower CA50 and the higher temperature which results (see Figure 14) in higher NOx emissions and lower UHC and CO emissions. At higher engine speeds, the reduced available time for chemical reactions leads to more incomplete combustion and so UHC and CO soot are considerably increased (see Figure 15) [8]. This delay in combustion for LES model is more than RANS. Generally, LES and RANS model give similar predictions for heat release rate, temperature, pressure inside the cylinder and performance parameters; however, LES provides quite accurate results in prediction of engine emissions.

4. Conclusions

In the present research, the comparison of LES and RANS model in a natural gas/diesel RCCI combustion was studied by using a 3D-CFD modelling. Various parameters involving natural gas mass fraction, diesel SOI2 timing and engine speed were selected to explore effects of the two turbulence modelling approach on RCCI combustion prediction. The results obtained were validated by the available ones in the literature. It was found that as natural gas mass fraction increases, the SOC was delayed. Generally, a good level of agreement was observed between LES and RANS models for cylinder pressure and heat release ratios prediction for all cases but the LES gives much better prediction at higher natural gas mass fractions, while RANS model under-predicts emission levels in specific cases. Moreover, the RANS has difficulty predicting the cases containing natural gas auto-ignition. In conclusion, RANS simulations are good enough for capturing overall qualitative flow trends, however in order to get reasonably accurate estimates of velocity magnitudes, flow structures, turbulence magnitudes and its distribution, LES simulations must be used. For future research, use of open-cycle mesh with intake and exhaust valves and detailed study of flow structure considering cyclic variations may provide better predictions of in-cylinder RCCI combustion process.

Acknowledgments

The authors thank Mr. Pourya Rahnama for his support, and Convergent Science Inc. for providing a free version of their CONVERGE package for academic purposes.

Author Contributions

Amin Paykani planned the study, developed the methodology and modelling aspects and drafted the manuscript. Parvaneh Jafari performed the numerical simulations; Amir-Hasan Kakaee collaborated on editing/finalizing the manuscript.

Conflicts of Interest

The authors declare no conflict of interest.

References

  1. Kokjohn, S.; Hanson, R.; Splitter, D.; Reitz, R. Fuel reactivity controlled compression ignition (RCCI): A pathway to controlled high-efficiency clean combustion. Int. J. Engine Res. 2011, 12, 209–226. [Google Scholar] [CrossRef]
  2. Kokjohn, S.L.; Hanson, R.M.; Splitter, D.A.; Reitz, R.D. Experiments and modeling of dual-fuel HCCI and PCCI combustion using in-cylinder fuel blending. SAE Int. J. Engines 2009, 2, 24–39. [Google Scholar] [CrossRef]
  3. Reitz, R.D. Directions in internal combustion engine research. Combust. Flame 2013, 1, 1–8. [Google Scholar] [CrossRef]
  4. Benajes, J.; Pastor, J.V.; García, A.; Monsalve-Serrano, J. An experimental investigation on the influence of piston bowl geometry on RCCI performance and emissions in a heavy-duty engine. Energy Convers. Manag. 2015, 103, 1019–1030. [Google Scholar] [CrossRef]
  5. Desantes, J.M.; Benajes, J.; García, A.; Monsalve-Serrano, J. The role of the in-cylinder gas temperature and oxygen concentration over low load reactivity controlled compression ignition combustion efficiency. Energy 2014, 78, 854–868. [Google Scholar] [CrossRef]
  6. Kakaee, A.; Rahnama, P.; Paykani, A. Numerical study of reactivity controlled compression ignition (RCCI) combustion in a heavy-duty diesel engine using 3D-CFD coupled with chemical kinetics. Int. J. Automot. Eng. 2014, 4, 792–804. [Google Scholar]
  7. Kakaee, A.-H.; Rahnama, P.; Paykani, A. Influence of fuel composition on combustion and emissions characteristics of natural gas/diesel RCCI engine. J. Nat. Gas Sci. Eng. 2015, 25, 58–65. [Google Scholar] [CrossRef]
  8. Kakaee, A.-H.; Nasiri-Toosi, A.; Partovi, B.; Paykani, A. Effects of piston bowl geometry on combustion and emissions characteristics of a natural gas/diesel RCCI engine. Appl. Therm. Eng. 2016, 102, 1462–1472. [Google Scholar] [CrossRef]
  9. Dempsey, A.B.; Walker, N.R.; Gingrich, E.; Reitz, R.D. Comparison of low temperature combustion strategies for advanced compression ignition engines with a focus on controllability. Combust. Sci. Technol. 2014, 186, 210–241. [Google Scholar] [CrossRef]
  10. Mahabadipour, H.; Srinivasan, K.K.; Krishnan, S.R. A second law-based framework to identify high efficiency pathways in dual fuel low temperature combustion. Appl. Energy 2017, 202, 199–212. [Google Scholar] [CrossRef]
  11. Reitz, R.D.; Duraisamy, G. Review of high efficiency and clean reactivity controlled compression ignition (RCCI) combustion in internal combustion engines. Prog. Energy Combust. Sci. 2015, 46, 12–71. [Google Scholar] [CrossRef]
  12. Paykani, A.; Kakaee, A.-H.; Rahnama, P.; Reitz, R.D. Progress and recent trends in reactivity-controlled compression ignition engines. Int. J. Engine Res. 2016, 17, 481–524. [Google Scholar] [CrossRef]
  13. Kakaee, A.-H.; Paykani, A.; Ghajar, M. The influence of fuel composition on the combustion and emission characteristics of natural gas fueled engines. Renew. Sustain. Energy Rev. 2014, 38, 64–78. [Google Scholar] [CrossRef]
  14. Paykani, A.; Kakaee, A.-H.; Rahnama, P.; Reitz, R.D. Effects of diesel injection strategy on natural gas/diesel reactivity controlled compression ignition combustion. Energy 2015, 90, 814–826. [Google Scholar] [CrossRef]
  15. Rahnama, P.; Paykani, A.; Reitz, R.D. A numerical study of the effects of using hydrogen, reformer gas and nitrogen on combustion, emissions and load limits of a heavy duty natural gas/diesel RCCI engine. Appl. Energy 2017, 193, 182–198. [Google Scholar] [CrossRef]
  16. Rahnama, P.; Paykani, A.; Bordbar, V.; Reitz, R.D. A numerical study of the effects of reformer gas composition on the combustion and emission characteristics of a natural gas/diesel RCCI engine enriched with reformer gas. Fuel 2017, 209, 742–753. [Google Scholar] [CrossRef]
  17. Nieman, D.E.; Dempsey, A.B.; Reitz, R.D. Heavy-duty RCCI operation using natural gas and diesel. SAE Int. J. Engines 2012, 5, 270–285. [Google Scholar] [CrossRef]
  18. Zoldak, P.; Sobiesiak, A.; Wickman, D.; Bergin, M. Combustion simulation of dual fuel CNG engine using direct injection of natural gas and diesel. SAE Int. J. Engines 2015, 8, 846–858. [Google Scholar] [CrossRef]
  19. Jia, Z.; Denbratt, I. Experimental investigation of natural gas-diesel dual-fuel RCCI in a heavy-duty engine. SAE Int. J. Engines 2015, 8, 797–807. [Google Scholar] [CrossRef]
  20. Kaario, O.; Pokela, H.; Kjäldman, L.; Tiainen, J.; Larmi, M. LES and RNG Turbulence Modeling in DI Diesel Engines; Society of Automotive Engineers: Warrendale, PA, USA, 2003. [Google Scholar]
  21. Naser, J.; Gosman, A. Prediction of compressible subsonic flow through an axisymmetric exhaust valve-port assembly. Proc. Inst. Mech. Eng. D J. Automob. Eng. 1995, 209, 289–295. [Google Scholar] [CrossRef]
  22. Naser, J.; Gosman, A. Flow Prediction in an Axisymmetric Inlet Valve/Port Assembly Using Variants of k-ε. Proc. Inst. Mech. Eng. D J. Automob. Eng. 1995, 209, 57–69. [Google Scholar] [CrossRef]
  23. Celik, I.; Yavuz, I.; Smirnov, A. Large eddy simulations of in-cylinder turbulence for internal combustion engines: A review. Int. J. Engine Res. 2001, 2, 119–148. [Google Scholar] [CrossRef]
  24. Rutland, C. Large-eddy simulations for internal combustion engines—A review. Int. J. Engine Res. 2011, 12, 421–451. [Google Scholar] [CrossRef]
  25. Yang, X.; Gupta, S.; Kuo, T.-W.; Gopalakrishnan, V. RANS and LES of IC Engine Flows–A Comparative Study. In Proceedings of the ASME 2013 Internal Combustion Engine Division Fall Technical Conference, Dearborn, MI, USA, 13–16 October 2013. [Google Scholar]
  26. Jhavar, R.; Rutland, C.J. Using Large Eddy Simulations to Study Mixing Effects in Early Injection Diesel Engine Combustion; Society of Automotive Engineers: Warrendale, PA, USA, 2006. [Google Scholar]
  27. Zhou, L.; Xie, M.-Z.; Jia, M.; Shi, J.-R. Large eddy simulation of fuel injection and mixing process in a diesel engine. Acta Mech. Sin. 2011, 27, 519–530. [Google Scholar] [CrossRef]
  28. Bottone, F.; Kronenburg, A.; Gosman, D.; Marquis, A. Large eddy simulation of diesel engine in-cylinder flow. Flow Turbul. Combust. 2012, 88, 233–253. [Google Scholar] [CrossRef]
  29. Banaeizadeh, A.; Afshari, A.; Schock, H.; Jaberi, F. Large-eddy simulations of turbulent flows in internal combustion engines. Int. J. Heat Mass Transf. 2013, 60, 781–796. [Google Scholar] [CrossRef]
  30. Toosi, A.N.; Farokhi, M.; Mashadi, B. Application of modified eddy dissipation concept with large eddy simulation for numerical investigation of internal combustion engines. Comput. Fluids 2015, 109, 85–99. [Google Scholar] [CrossRef]
  31. Xu, G.-L.; Yao, C.-D.; Rutland, C.J. Simulations of diesel–methanol dual-fuel engine combustion with large eddy simulation and Reynolds-averaged Navier–Stokes model. Int. J. Engine Res. 2014, 15, 751–769. [Google Scholar] [CrossRef]
  32. Richards, K.; Senecal, P.; Pomraning, E. CONVERGE (v2. 2.0); Theory Manual, Convergent Science: Madison, WI, USA, 2014. [Google Scholar]
  33. Reitz, R.D.; Diwakar, R. Structure of High-Pressure Fuel Sprays; Society of Automotive Engineers: Warrendale, PA, USA, 1987. [Google Scholar]
  34. Beale, J.C.; Reitz, R.D. Modeling spray atomization with the Kelvin-Helmholtz/Rayleigh-Taylor hybrid model. Atomization Sprays 1999, 9, 623–650. [Google Scholar]
  35. Schmidt, D.P.; Rutland, C. A new droplet collision algorithm. J. Comput. Phys. 2000, 164, 62–80. [Google Scholar] [CrossRef]
  36. Liu, A.B.; Mather, D.; Reitz, R.D. Modeling the Effects of Drop Drag and Breakup on Fuel Sprays; Wisconsin Univ-Madison Engine Research Center: Madison, WI, USA, 1993. [Google Scholar]
  37. Han, Z.; Reitz, R.D. Turbulence modeling of internal combustion engines using RNG κ-ε models. Combust. Sci. Technol. 1995, 106, 267–295. [Google Scholar] [CrossRef]
  38. Shahsavan, M.; Mack, J.H. Numerical study of a boosted HCCI engine fueled with n-butanol and isobutanol. Energy Convers. Manag. 2018, 157, 28–40. [Google Scholar]
  39. Raju, M.; Wang, M.; Dai, M.; Piggott, W.; Flowers, D. Acceleration of Detailed Chemical Kinetics Using Multi-Zone Modeling for CFD in Internal Combustion Engine Simulations; Society of Automotive Engineers: Warrendale, PA, USA, 2012. [Google Scholar]
  40. Smith, G.P.; Golden, D.M.; Frenklach, M.; Moriarty, N.W.; Eiteneer, B.; Goldenberg, M.; Bowman, C.T.; Hanson, R.K.; Song, S.; Gardiner, W.C., Jr.; et al. GRI 3.0 Mechanism. Gas Research Institute, 1999. Available online: http://combustion.berkeley.edu/gri-mech/releases.html (accessed on 27 March 2018).
  41. Heywood, J.B. Internal Combustion Engine Fundamentals; Mcgraw-Hill: New York, NY, USA, 1988. [Google Scholar]
  42. Hiroyasu, H.; Kadota, T. Models for Combustion and Formation of Nitric Oxide and Soot in Direct Injection Diesel Engines. In Proceedings of the Automotive Engineering Congress and Exposition, Detroit, MI, USA, 23 February 1976. [Google Scholar]
  43. Namazian, M.; Heywood, J.B. Flow in the Piston-Cylinder-Ring Crevices of a Spark-Ignition Engine: Effect on Hydrocarbon Emissions, Efficiency and Power; Society of Automotive Engineers: Warrendale, PA, USA, 1982. [Google Scholar]
  44. Pomraning, E. Development of Large Eddy Simulation Turbulence Models; University of Wisconsin: Madison, WI, USA, 2000. [Google Scholar]
  45. Werner, H.; Wengle, H. Large-Eddy Simulation of Turbulent Flow over and around a cuBe in a Plate Channel; Turbulent Shear Flows 8; Springer: Berlin/Heidelberg, Germany, 1993; pp. 155–168. [Google Scholar]
  46. Amsden, A.A. KIVA-3V: A Block-Structured KIVA Program for Engines with Vertical or Canted Valves; Los Alamos National Lab.: Los Alamos, NM, USA, 1997. [Google Scholar]
  47. Nobakht, A.Y.; Saray, R.K.; Rahimi, A. A parametric study on natural gas fueled HCCI combustion engine using a multi-zone combustion model. Fuel 2011, 90, 1508–1514. [Google Scholar] [CrossRef]
Figure 1. Flow chart of CONVERGE simulation for a single time-step.
Fluids 03 00024 g001
Figure 2. 3D and 2D computational grid of large eddy simulation (LES) using adaptive mesh refinement (AMR) and embedding.
Fluids 03 00024 g002
Figure 3. The validation cases pressure and heat release rate traces.
Fluids 03 00024 g003
Figure 4. Comparison of Large eddy simulation (LES) and Reynolds-averaged Navier–Stokes (RANS) model for cylinder pressure and heat release rate variations: (a) 50%; (b) 75%; (c) 80% and (d) 85% natural gas mass fractions.
Fluids 03 00024 g004
Figure 5. Comparison of LES and RANS model for: (a) ignition delay (ID), (b) gross indicated efficiency (GIE), (c) ringing intensity (RI) and (d) CA50 variations over natural gas mass fractions sweep.
Fluids 03 00024 g005
Figure 6. Comparison of LES and RANS model for cylinder temperature cut planes at three crank angles for different natural gas percentages.
Fluids 03 00024 g006
Figure 7. Comparison of LES and RANS model for: (a) NOx, (b) soot, (c) HC and (d) CO emissions with different natural gas percentages.
Fluids 03 00024 g007
Figure 8. Comparison of LES and RANS model for cylinder pressure and HRR: (a) SOI2 = 0 ATDC; (b) SOI2 = −15 ATDC, (c) SOI2= −30 ATDC; (d) SOI2= −45 ATDC.
Fluids 03 00024 g008
Figure 9. Comparison of LES and RANS model for cylinder temperature cut planes at 3 crank angles for SOI2 = −15 TDC and SOI2 = −45 ATDC.
Fluids 03 00024 g009
Figure 10. Effects of SOI2 timing sweep on: (a) ID, (b) GIE, (c) RI and (d) CA50 for LES and RANS model.
Fluids 03 00024 g010
Figure 11. Comparison of LES and RANS model for: (a) NOx, (b) soot, (c) HC and (d) CO emissions with different SOI2 timings.
Fluids 03 00024 g011aFluids 03 00024 g011b
Figure 12. Comparison of LES and RANS model for cylinder pressure and heat release rate (HRR) variation with engine speed sweep: (a) 800 rpm; (b) 1300 rpm; (c) 1800 rpm.
Fluids 03 00024 g012
Figure 13. Effect of engine speed sweep on: (a) ID, (b) GIE, (c) RI and (d) CA50 for LES and RANS model.
Fluids 03 00024 g013
Figure 14. Comparison of LES and RANS model for cylinder temperature cut planes at 3 crank angles for 1300 rpm and 1800 rpm engine speeds.
Fluids 03 00024 g014
Figure 15. Comparison of LES and RANS model for: (a) NOx, (b) soot, (c) HC and (d) CO emissions with different engine speeds.
Fluids 03 00024 g015
Table 1. Geometry of Cat® 3401E SCOTE engine [17].
ParameterValue
Displacement2.44 L
Bore × Stroke (cm)13.72 × 16.51
Connecting rod size (cm)26.16
Rate of compression16.1:1
Swirl rate0.7
Type of bowlMexican Hat
Valves No.4
Intake valve closing−143 ATDC
Exhaust valve opening130 ATDC
Common Rail Diesel Fuel Injector
Holes No.6
Diameter of hole (μm)250
Included spray degree (degree)145
Table 2. The validation cases for natural gas/diesel reactivity controlled compression ignition (RCCI) [17].
ParameterIMEP 4 BarIMEP 9 Bar
Intake Pressure (bar)1.01.75
Intake Temperature (°C)6060
Engine Speed (rpm)8001300
Total Fuel Mass (mg)4089
Methane (% by mass)7385
Diesel SOI1 (°ATDC)−52.9−87.3
Diesel SOI2 (°ATDC)−22.5−38.3
Diesel in 1st Inj. (%)5240
EGR (%)5%0
Table 3. The validation cases emissions and performance.
CaseGIE (%)RI (MW/m2)NOx (g/kW·h)Soot (g/kW·h)UHC (g/kW·h)CO (g/kW·h)
Nieman et al. [17], IMEP 9 bar50.41.20.020.0032.51.8
Present Work IMEP 9 bar50.70.90.0160.00122.721.22
Absolute errors0.30.30.0040.00180.220.58
Nieman et al. [17], IMEP 4 bar45.10.20.240.00410.810.5
Present Work IMEP 4 bar47.10.190.1580.003212.64.2
Absolute errors2.00.010.0820.00081.86.3

