Sinus Hemodynamics in Representative Stenotic Native Bicuspid and Tricuspid Aortic Valves: An In-Vitro Study


Department of Biomedical Engineering, The Ohio State University, Columbus, OH 43210, USA
*
Author to whom correspondence should be addressed.
Fluids 2018, 3(3), 56; https://doi.org/10.3390/fluids3030056
Submission received: 21 June 2018
/
Revised: 24 July 2018
/
Accepted: 3 August 2018
/
Published: 6 August 2018
(This article belongs to the Special Issue Cardiovascular Flows)
Abstract
:(1) The study’s objective is to assess sinus hemodynamics differences between stenotic native bicuspid aortic valve (BAV) and native tricuspid aortic valve (TrAV) sinuses in order to assess sinus flow shear and vorticity dynamics in these common pathological states of the aortic valve. (2) Representative patient-specific aortic roots with BAV and TrAV were selected, segmented, and 3D printed. The flow dynamics within the sinus were assessed in-vitro using particle image velocimetry in a left heart simulator at physiological pressure and flow conditions. Hemodynamic data calculations, vortex tracking, shear stress probability density functions and sinus washout calculations based on Lagrangian particle tracking were performed. (3) (a) At peak systole, velocity and vorticity in BAV reach 0.67 ± 0.02 m/s and 374 ± 5 s−1 versus 0.49 ± 0.03 m/s and 293 ± 3 s−1 in TrAV; (b) Aortic sinus vortex is slower to form but conserved in BAV sinus; (c) BAV shear stresses exceed those of TrAV (1.05 Pa versus 0.8 Pa); (d) Complete TrAV washout was achieved after 1.5 cycles while it was not for BAV. (4) In conclusion, sinus hemodynamics dependence on the different native aortic valve types and sinus morphologies was clearly highlighted in this study.
1. Introduction
A bicuspid aortic valve (BAV) typically comprises two leaflets of unequal size, while tricuspid aortic valves (TrAV) are comprised of three leaflets [1]. The BAV is susceptible to the early development of accelerated stenosis and calcific degeneration, which often necessitates replacement in the 5th or 6th decade of life [2]. The proportion of patients with bicuspid aortic stenosis in the general population is 2% to 6% [3,4]. While the durability of BAV compared to TrAV is of critical concern, calcification and thrombus formation have been common between these populations [5]—both related to hemodynamic factors [6,7,8,9]. A study by Wallby et al. [10] suggested that if aortic stenosis disease process is the same in trileaflet and bicuspid valves and is related to the mechanical characteristics of the valve, then it is, in essence and in part, the result of interaction with local hemodynamics. To date, there is little knowledge regarding sinus flow hemodynamics in a BAV root, or for that matter, an anatomical TrAV root, and little knowledge around what makes sinus flow different between a bicuspid valve sinus and a tricuspid valve sinus. Evaluating these may shed the light on the differences between valve function and valve disease progression from one side, and may put into context how patient-specific parameters can dictate different fluid mechanics.
In general, as the pulsatile cardiac blood flow leads the aortic valve leaflets to open and close throughout the cardiac cycle, the jet engendered through the aortic valve and the ensuing fluid dynamics may be described as a pulsatile jet through a constantly changing valve orifice area that interacts with patient specific anatomical (geometrical) conditions. These complex fluid dynamic conditions, such as pulsatility, time dependency, area variability, patient-specific geometry, etc., can lead to a highly rich physical state that may be characterized through the classical tools of fluid mechanics, namely shear layers, separation zones, recirculation zones, vortices, and flow instabilities. The dynamics seen through the lens of these measures can help paint a broader picture of understanding the specific contributions of valve type (BAV vs TrAV) and the surrounding patient-specific geometry [6,11].
In particular, sinus flow hemodynamics can affect valve operation and longevity [8,12,13]. The primary hemodynamic feature of the aortic sinus that influences aortic valve dynamics, progression of disease, or thrombosis through sinus washout [14,15], is the aortic sinus vortex. The thin boundary layer that travels next to the aortic wall reaches the tip of the fully open valve leaflets before it is forced to separate from the leaflet tip, and travels as a free shear layer [16]. When the separated shear layer which transports vorticity is intercepted by the sinus ridge (at the sinotubular junction), a portion of the fluid begins to curl back, and a spinning vortex is formed (primarily fed by the vorticity in the shear layer) within each sinus cavity [16]. The ensuing sinus flow hemodynamics and flow patterns involve further vorticity dynamics and interactions that largely dictate spatiotemporal shear stress distributions and valve leaflet “washout”, and their characteristics, can affect the degree of flow movement around the valve [8], and thus, the progression of aortic valve disease, such as calcific lesions or thrombosis. The spatiotemporal distributions of shear stress, vorticity, and any Lagrangian measures are all a result of the complex patient-specific interaction of blood flow, anatomy of the root, and the valve leaflets.
One important fluid dynamic aspect to investigate and assess in the above context is how sinus flow would differ in different aortic sinus morphologies combined with different pathological leaflet anatomies. A multitude of computational and experimental modalities and studies is needed to capture the underlying mechanisms of heart valve disease [17]. While it is clear that fluid dynamic factors and the hemodynamic environment of the aortic valve (flow stasis, poor washout, etc.) may be highlighted as potential factors that may contribute to disease onset and progression, it is not clear whether these occurrences can be attributed to the valve alone or the native leaflets type, or the complex interaction between the valve and the patient-specific parameters. How much of the sinus flow hemodynamics is dictated by the morphology of the sinus itself compared to the nature of valve?
The aim of the present study is to assess the differences in sinus hemodynamics between a BAV and TrAV models using high resolution hemodynamic measurements, in order to better understand how patient-specific parameters (sinus morphologies and leaflet anatomy) can dictate different fluid mechanic properties and potentially shed light on the development of disease.
2. Materials and Methods
2.1. Patient-Specific Aortic Root Modeling
Patients with severe degenerative aortic stenosis being evaluated for transcatheter aortic valve replacement at the Ohio State University Wexner Medical Center were selected as part of an institutional review board (IRB)-approved study. The study’s IRB number is 2016H0079 and is approved on 07/01/2016 (renewed every year). The high spatial resolution of the computed tomography (CT) imaging data provide clear depiction of the aortic valve cusps and calcific regions. Two patients with a clinical diagnosis of severe aortic stenosis one with a bicuspid aortic valve with fusion of right and left coronary sinus leaflets and one with a tricuspid aortic valve were selected for anatomic modeling, to represent two samples of different and wide ranges of aortic sinus root geometries. Each patient provided written informed consent to participate in the study as approved by the IRB.
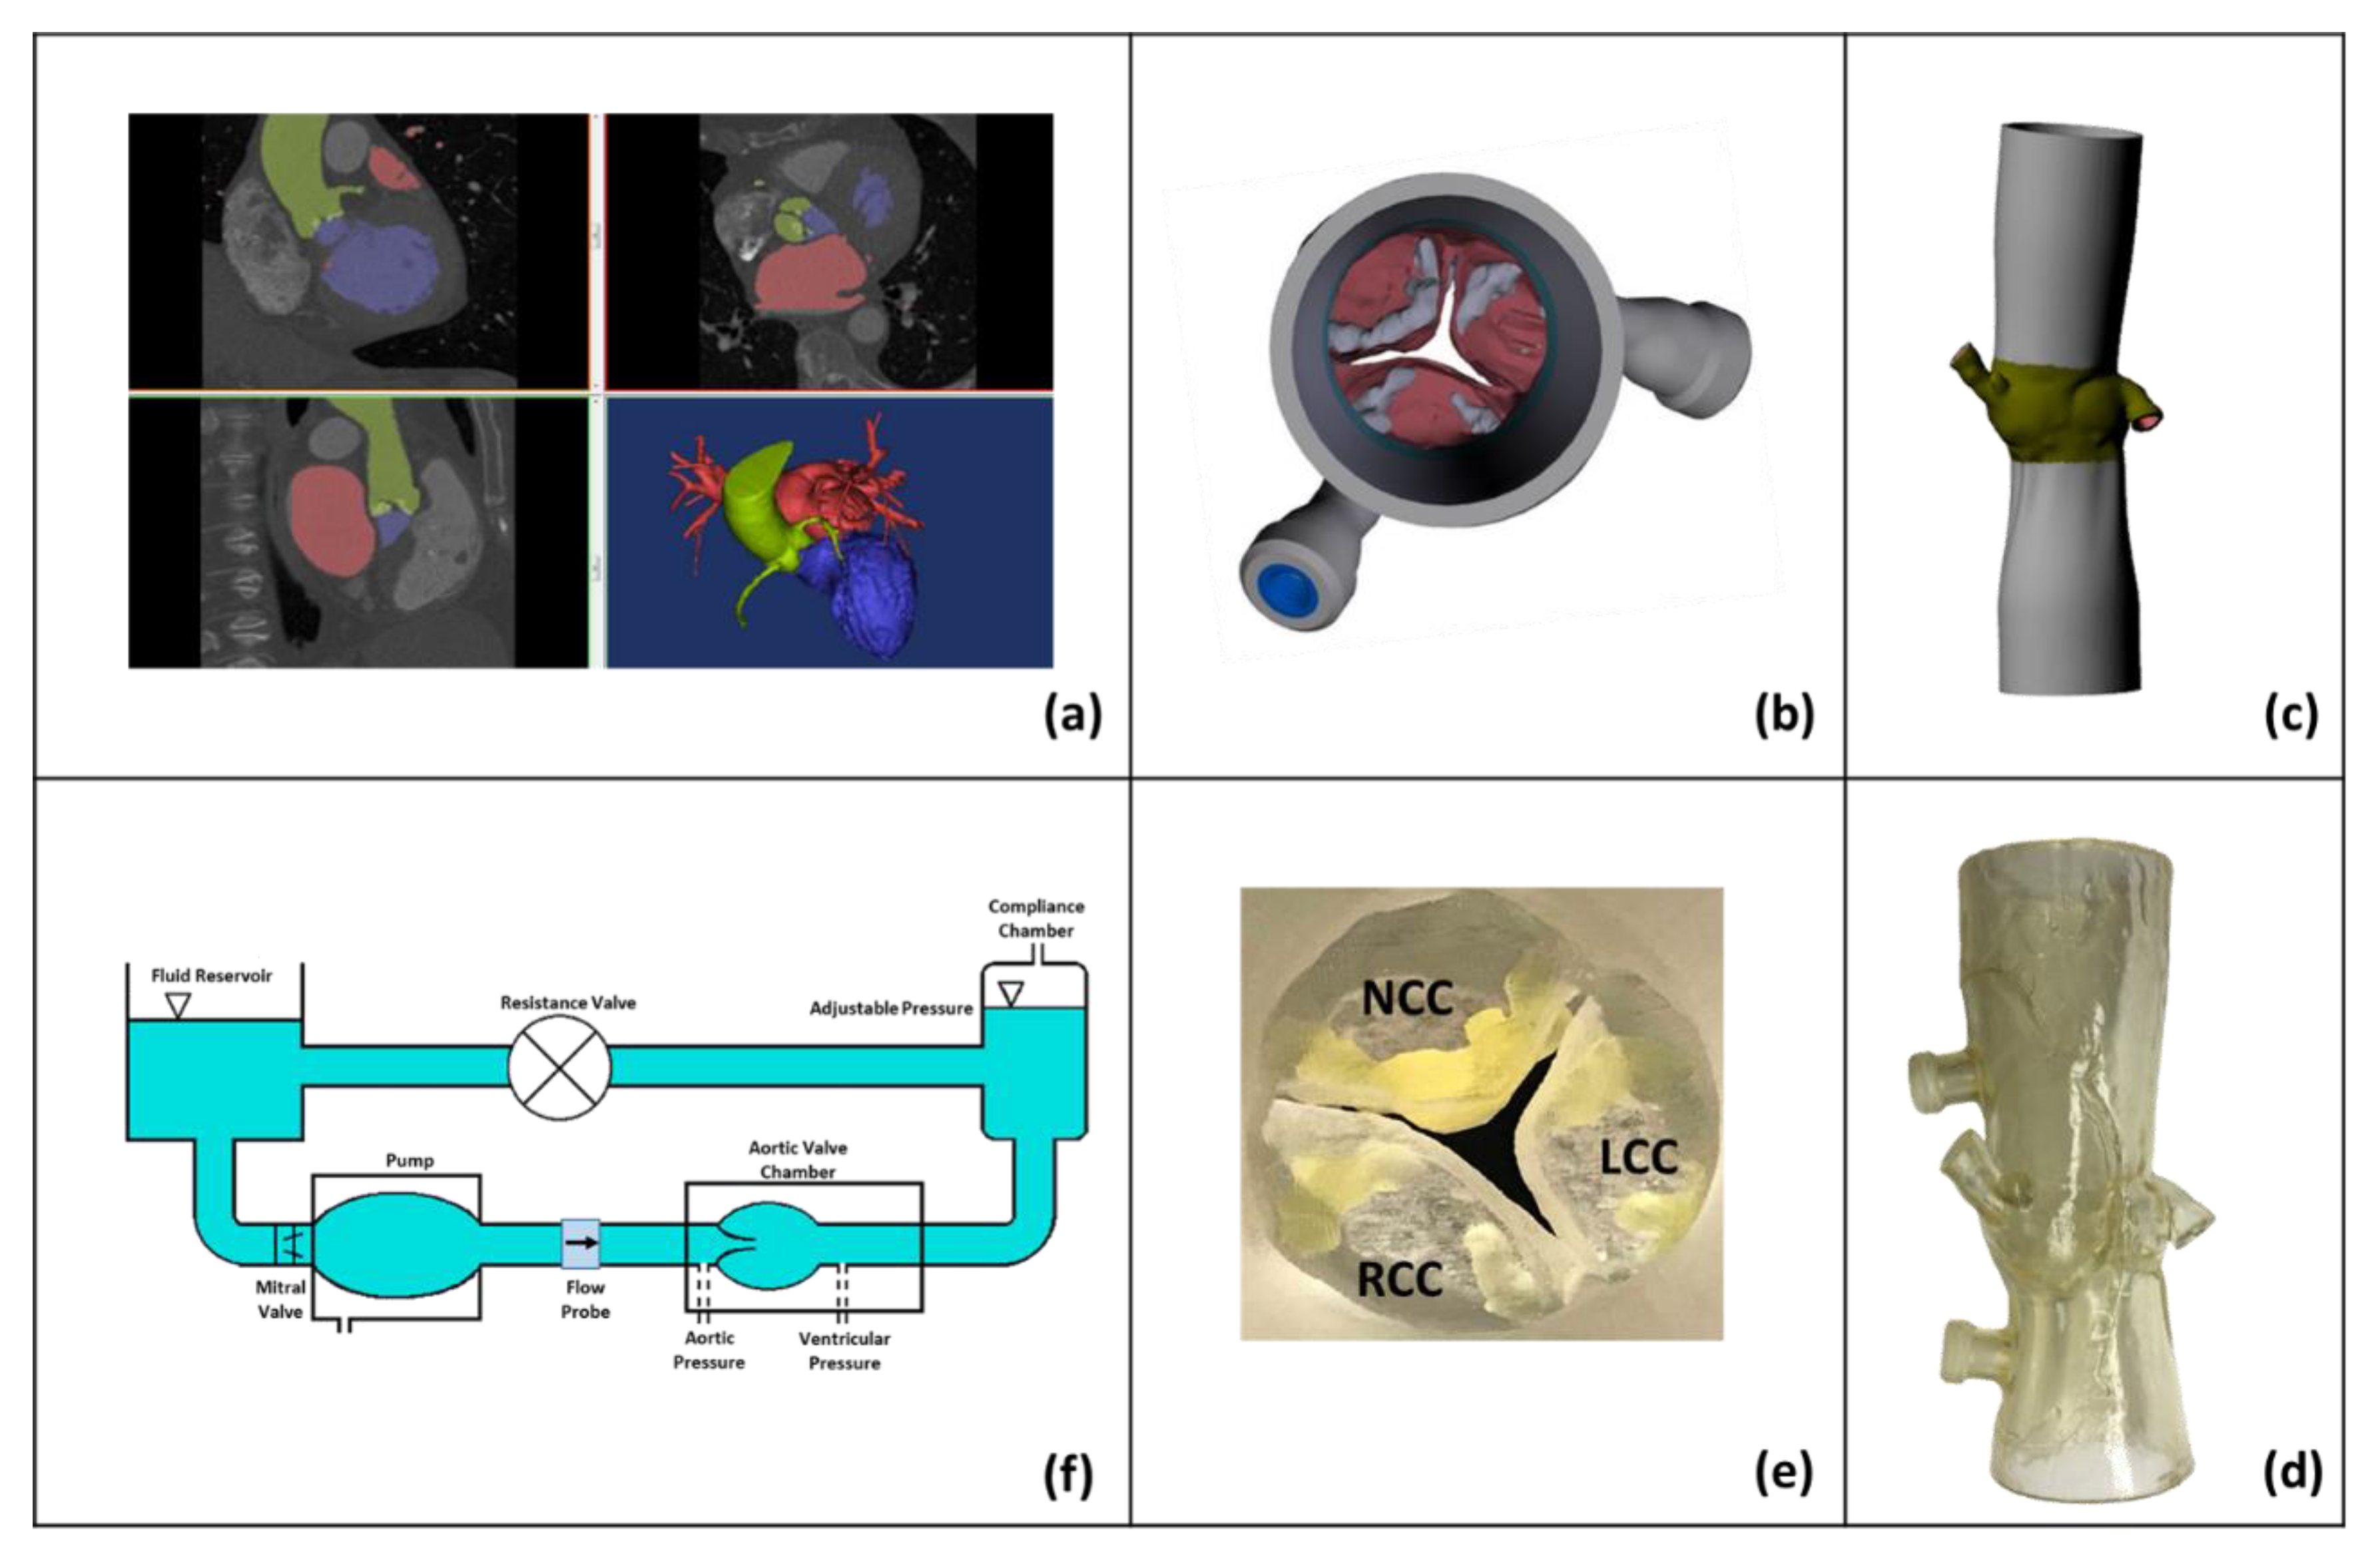
Contrast enhanced CT DICOM images at the 70% phase were imported into anatomic modeling software (version 19.0, Mimics, Materialise, Belgium) for each patient (Figure 1a). The left ventricular outflow tract (LVOT), valve cusps, ascending aorta, and all calcified tissues were segmented individually, and then reconstructed into a model consisting of two paired stereolithographic files composed of the calcified and non-calcified structures within the dataset. The files are then exported to another 3D modeling software (version 11.0, 3-Matic Research, Materialise, Belgium) for trimming the excess parts and for smoothing the geometry. These stereolithographic files were exported to a Stratasys Connex Printer (PolyJet, Stratasys, Eden Prairie, MN, USA) where the two files were used to create a fused material 3D construct (Figure 1b,c) of the predefined anatomic region. Cusp calcification was replicated using rigid print material (VeroWhite clear) and soft tissue structures, including the non-calcified cusp segments, LVOT, and ascending aorta, were replicated using a compliant rubber-like material (TangoPlus FLX930). Each model was coated externally with a thin layer of silicone to improve visual clarity and durability (Figure 1d,e). Print material properties were chosen to best represent the complex tissue properties of an aortic root. The print material used for the non-calcified anatomic regions (TangoPlus) has a manufacturer-reported elastic modulus of 0.1 MPa at 20% strain, and 0.2 MPa at 30% strain. The print material used for the calcified anatomic region (VeroWhite) has a manufacturer-reported elastic modulus of 2000 to 3000 MPa.
The bicuspid native annulus area and perimeter at mid-systole were measured to be 366 mm2 and 69.1 mm respectively. The tricuspid valve native annulus area and perimeter at mid-systole were measured to be 616 mm2 and 90.5 mm, respectively. In-vitro representative patient modeling was done based on the work of Maragiannis et al. [18] and Hatoum et al. [6,19].
2.2. Hemodynamic Assessment
Hemodynamic parameters were evaluated under pulsatile flow conditions created by a left heart simulator (Figure 1f) yielding physiological flow and pressure curves as previously described [6,7,8,19,20,21]. The desired outputs can be summarized as establishing a systolic to diastolic pressure of 98/68 mmHg and 100/61 mmHg, an 81 bpm heart rate, a systolic duration of 33%, and a cardiac output of 4.2 L/min and 5.15 L/min for the bicuspid and tricuspid valves, respectively. These are the patient’s respective specific conditions, and were chosen in place of normalized conditions to directly relate to clinical relevance. The working fluid in this study was a mixture of water-glycerin (99% pure glycerin) producing a density of 1080 kg/m3, and a kinematic viscosity of 3.5 cSt, similar to that of human blood. Sixty consecutive cardiac cycles of aortic pressure, ventricular pressure, and flow rate data were recorded at a sampling rate of 100 Hz. Flow data were acquired using ultrasonic flow probes (HXL, Transonic Inc., Ithaca, NY, USA), and pressures upstream and downstream of the valve were measured with Validyne pressure transducers (DP, Validyne Engineering Corp., Northridge, CA, USA).
The mean transvalvular pressure gradient (PG) is defined as the average of positive pressure difference between the ventricular and aortic pressure curves during forward flow.
2.3. Particle Image Velocimetry (PIV)
For PIV, the flow was seeded with fluorescent Polymethyl methacrylate PMMA–rhodamine B particles with diameters ranging from 1 to 20 µm. For all cases, the velocity field within the sinus region, including the region adjacent to the native leaflets, were measured using high spatial and temporal resolution PIV. Briefly, this involved illuminating the sinus region using a laser sheet created by pulsed Nd:YLF single cavity diode pumped solid state laser coupled with external spherical and cylindrical lenses, while acquiring high-speed images of the fluorescent particles within the sinus region. Raw PIV images were acquired with a resulting spatial and temporal resolutions of 0.02964 mm/pixel and 4000 Hz, respectively. Refraction was corrected using a calibration in DaVis particle image velocimetry software (version 7.2, DaVis, LaVision, Göttingen, Germany). Velocity vectors were calculated using adaptive cross-correlation algorithms. Further details of PIV measurements can be found in Hatoum et al. [6,7,8,19,20,21,22].
2.4. Sinus Vorticity and Shear Stress Dynamics
Using the velocity measurements from PIV, vorticity dynamics were also evaluated for the sinus region. Vorticity is the curl of the velocity field and therefore captures rotational components of the blood flow shearing. Regions of high vorticity along the axis perpendicular to the plane indicate both shear and rotation of the fluid particles. Out of plane vorticity in the z direction was computed using the following equation:
where ωz is the vorticity component with units of s−1; and and are the x and y components of the velocity vector with units of m/s. The x and y directions are axial and lateral, respectively, with the z direction being out of measurement plane.
2.5. Sinus Washout
Velocity measurements from PIV were also used to evaluate sinus washout. Sinus washout is defined as the characteristic curve representing the percent of fluid particles, initially seeded in the sinus region at the beginning of the cardiac cycle, and still remaining in the sinus as a function of time plotted over the cardiac cycle. Ideally, good washout is associated with a high percentage of particles exiting over a minimum number of cardiac cycles. To quantify sinus washout curves, first, particle tracking was performed similar to other studies [6,7,23]. Briefly, particles were seeded as a uniform grid of 0.001 m × 0.001 m cell size over the sinus region at the beginning of the cardiac cycle. Each particle’s trajectory was computed by integrating its velocity with respect to time based on
with
The integration time step was 0.00025 s, and at the end of every time step, the particle’s velocity vector was calculated based on the particle’s updated location through interpolating the PIV velocity data.
After every cardiac cycle, only the particles that remained in the sinus were re-seeded based on their last positions, and their trajectory over the subsequent cardiac cycle was calculated. This process continued until all particles exited, or until 10 cardiac cycles elapsed.
Once all the particles exited the sinus, a histogram of the time spent by the particles was generated and then converted to a cumulative distribution function representing the particles’ survival probability as a function of time. This procedure was repeated over 10 cycles for every valve combination. The resulting curves represent the sinus washout characteristic for all cases.
3. Results
3.1. Hemodynamic Parameters
Table 1 summarizes standard in-vitro hemodynamic parameters of the stenotic BAV and the TrAV models. Both models yielded high pressure gradients that demonstrate that both valves are severely stenotic, and consistent with clinical in vivo pressure gradients for the respective patients. The average PG of the bicuspid valve was found to be 76.25 ± 0.98 mmHg, and that of the tricuspid valve was found to be 49.47 ± 2.62 mmHg. Similarly, RFs were shown to be 23.2 ± 0.54% for BAV and 51.5 ± 1.30% for TrAV.
3.2. Flow Velocity Fields
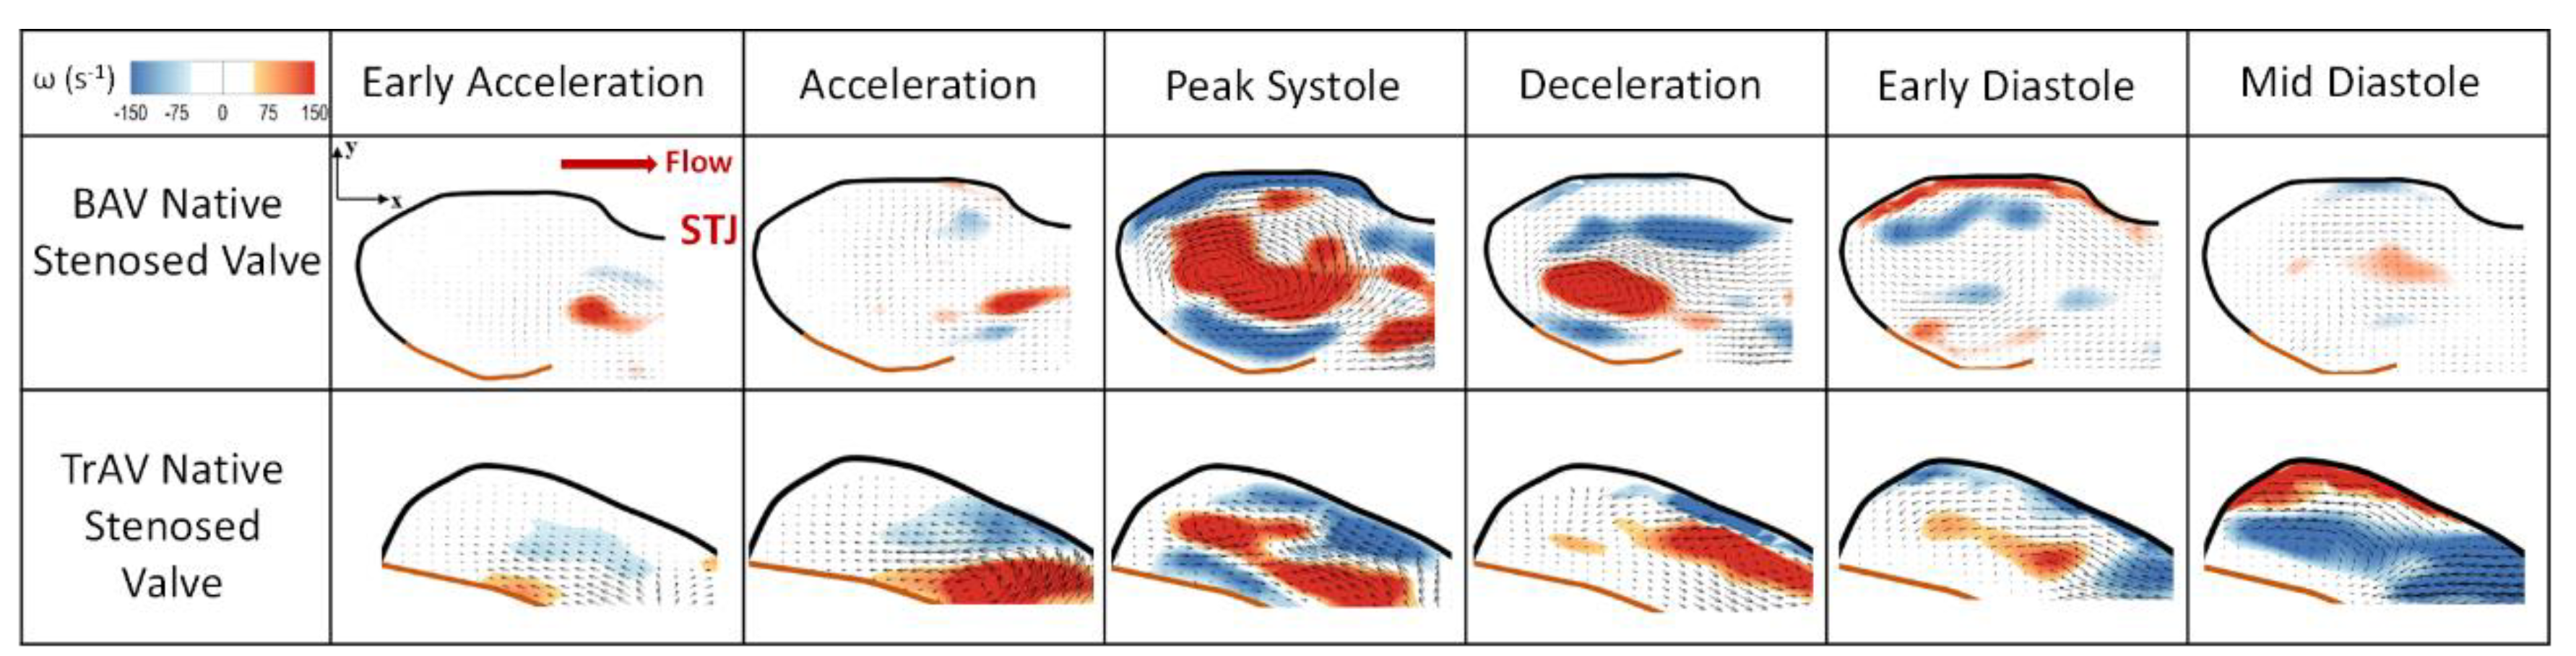
Figure 2 shows the velocity vectors and vorticity contours within the sinus of the bicuspid valve at selected time points throughout the cardiac cycle. Video 1 shows the streaks in both native sinuses. Comparing the velocity and vorticity fields in both valves, a significant number of differences can be highlighted (a) qualitatively and (b) quantitatively.
Quantitatively, during early systole, the average peak velocity reaches 0.057 ± 0.005 m/s in the BAV sinus versus 0.078 ± 0.009 m/s for the TrAV, then increases to 0.08 ± 0.002m/s versus 0.12 ± 0.004 m/s during acceleration. At peak systole, the velocity in the bicuspid sinus reaches 0.67 ± 0.02m/s versus 0.49 ± 0.03 m/s in the tricuspid sinus. The velocities start decreasing during deceleration to reach 0.45 ± 0.03 m/s in the BAV sinus versus 0.18 ± 0.04m/s in the TrAV sinus.
Regarding vorticity magnitudes, during early systole, the average vorticity reaches 74 ± 5 s−1 in the BAV sinus versus 88 ± 4s−1 for the TrAV, then increases to 128 ± 6 s−1 versus 205 ± 4 s−1 during acceleration. At peak systole, the vorticity in the bicuspid sinus reaches 374 ± 5 s−1 versus 293 ± 3 s−1 in the tricuspid sinus. The vorticities start decreasing during deceleration to reach 230 ± 5 s−1 in the BAV sinus versus 198 ± 4 s−1 in the TrAV sinus.
Regurgitation leak during diastole causes significant backflow-driven flow dynamics in the respective sinuses. A persistent rotation in the sinuses, in addition to the relatively high peak velocity, reaching 0.13 ± 0.002 s−1 in the BAV and 0.25 ± 0.01 s−1 during mid-diastole, was observed. Vorticity in the BAV sinus during diastole reached 86 ± 6s−1, versus 172 ± 5 s−1 in TrAV sinus.
Qualitatively, the aortic sinus vortex is slower to form in the BAV sinus. While in early systole the vortex onset is clearly shown, it is not until peak systole starts that it occupies the whole sinus region. Contrary to the mechanism observed in the TrAV, where the flow starts curling towards the sinus at the edge of the leaflet during early systole and a clear vortex shows at the tip of the leaflet during acceleration phase. During peak systole, in both sinuses the vortex is entrapped, and vorticity extraction takes place. It is obvious though that the BAV vortex is well conserved in terms of strength and size compared to the TrAV, where a detachment from the main shear layer that feeds the vortex starts to occur. The location of the vortices is interesting, and varies between the sinuses. In the BAV, the vortex engenders a whole rotational motion inside the sinus, especially at the back away from the tip of the leaflets (0.07 ± 0.005 m/s), while the motion at the back of the TrAV is not as strong (0.03 ± 0.002 m/s). This is specifically highlighted during deceleration.
3.3. Shear Stress Distribution
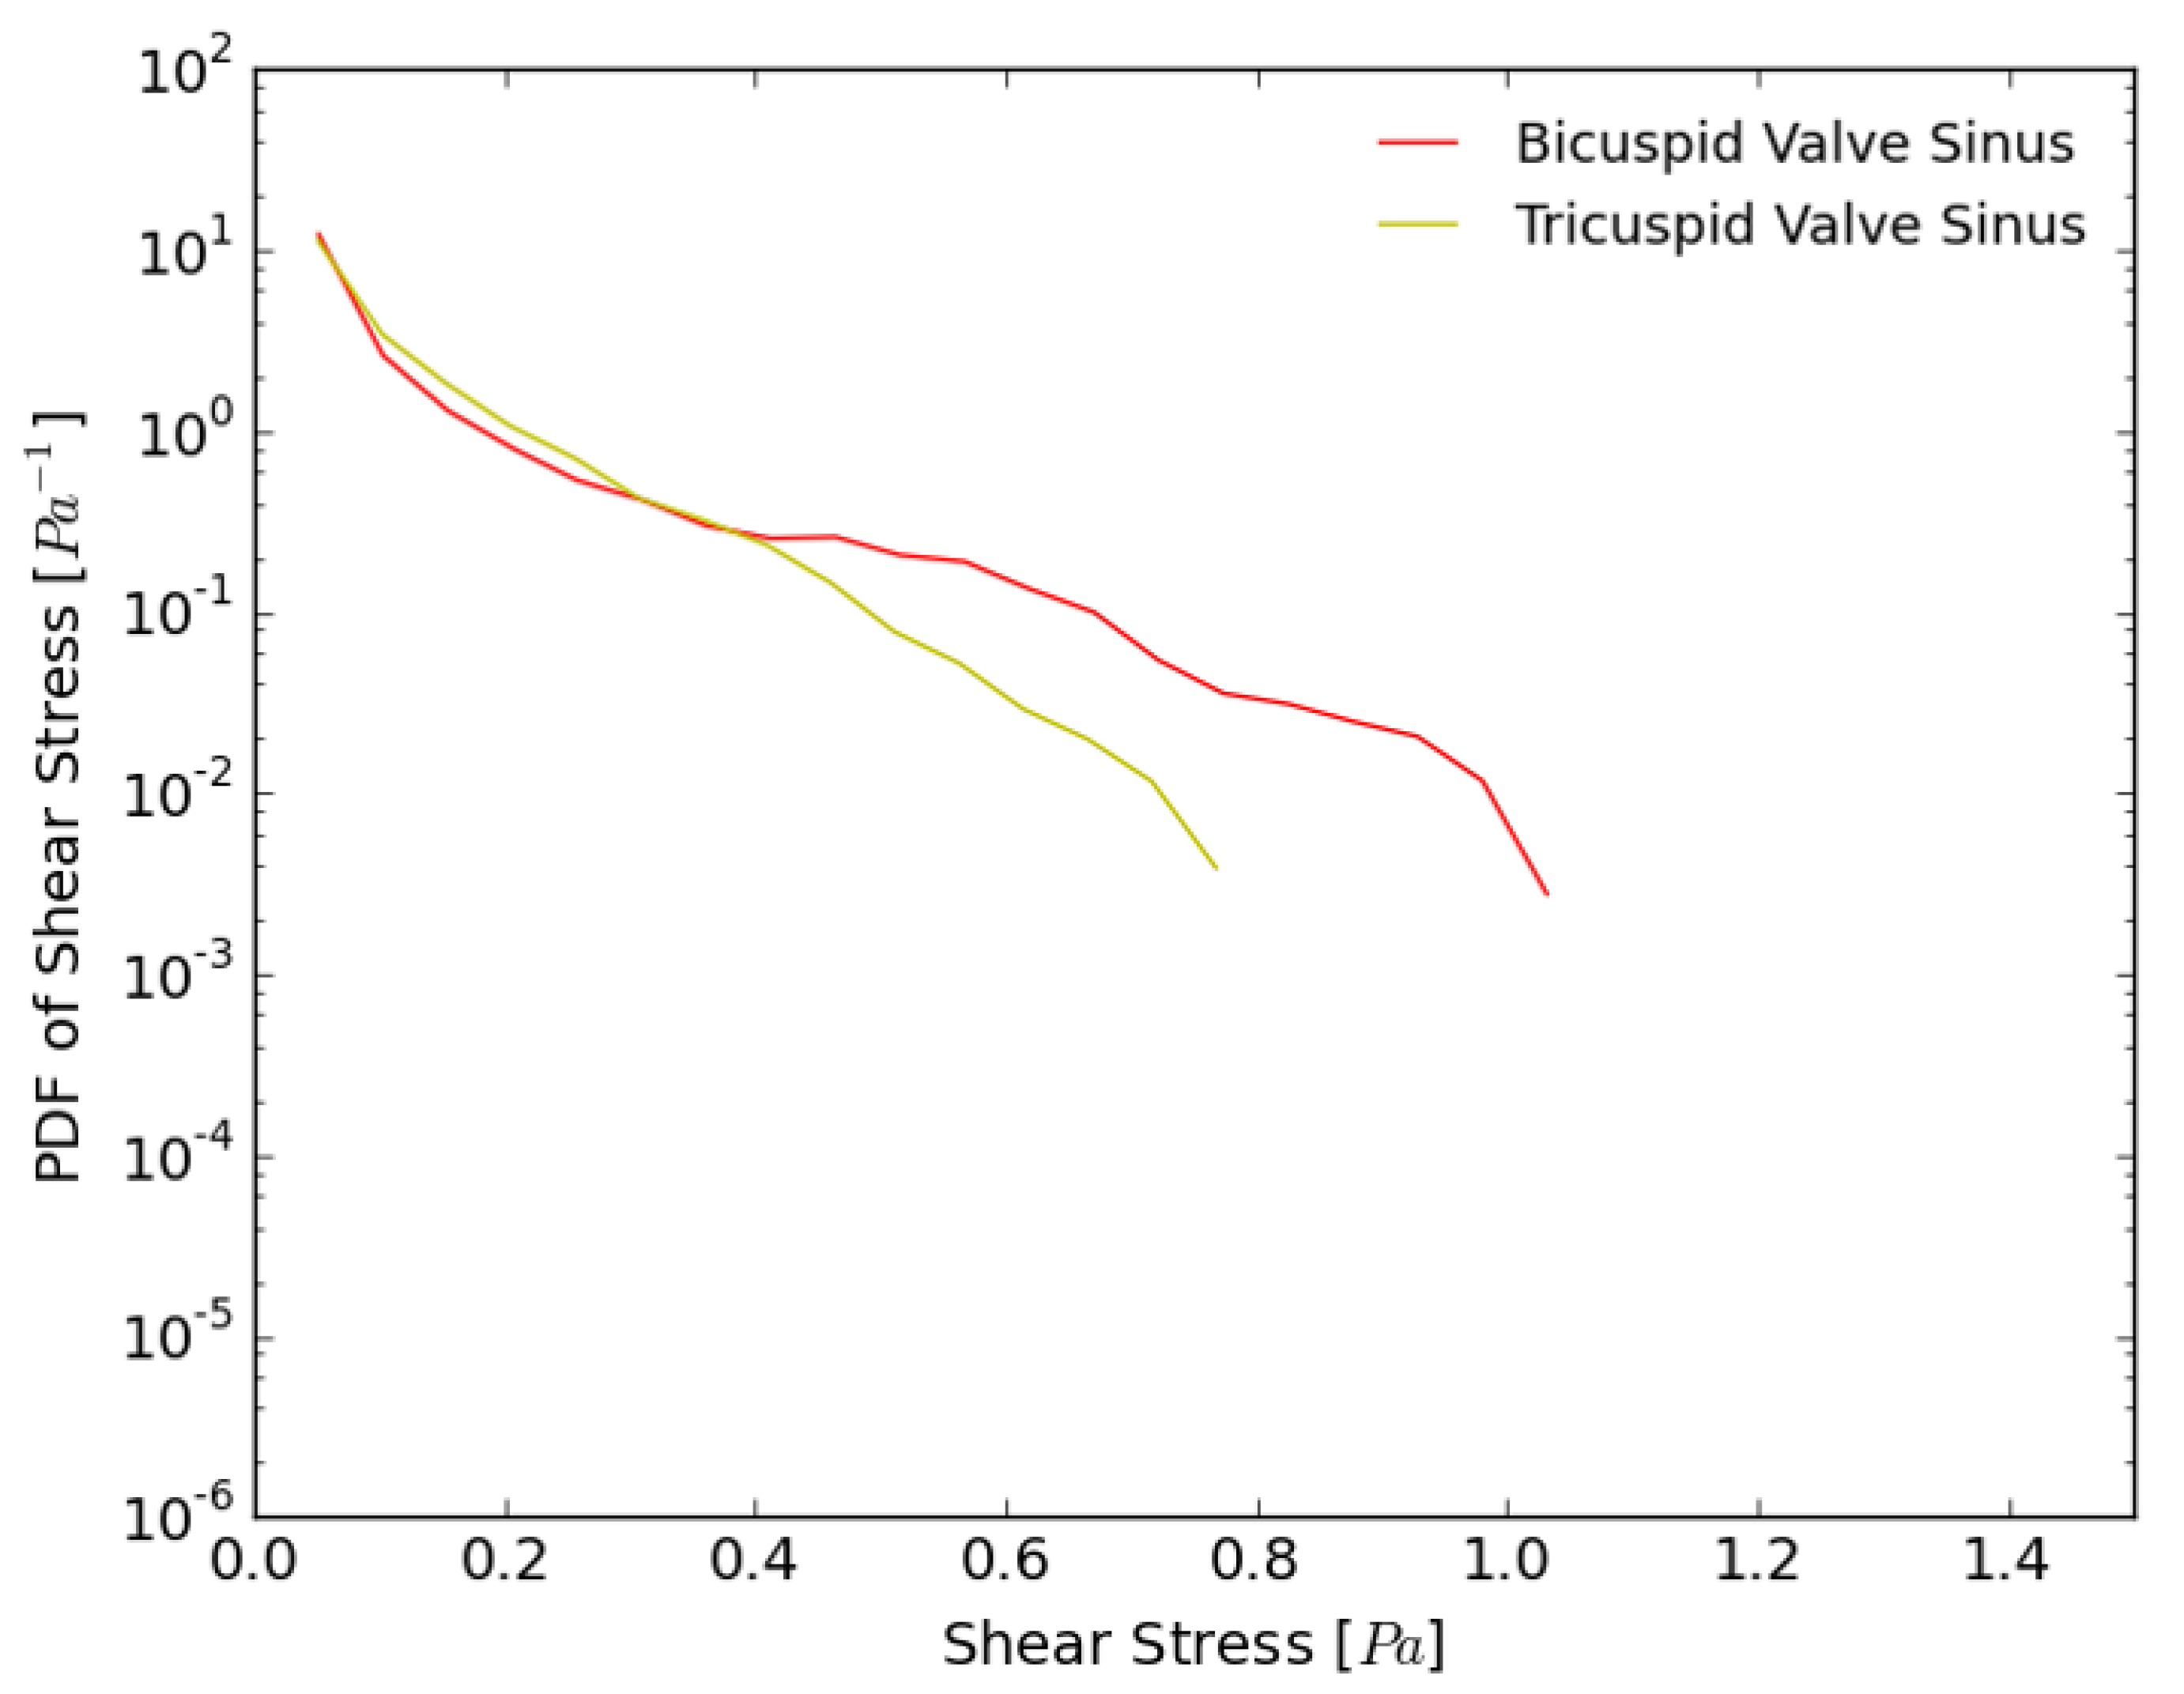
Figure 3 shows the probability density function (PDF) of flow shear stress magnitude in the sub-region adjacent to the leaflets during systole. As is clearly evident in the figure, shear stresses in the BAV exceed those calculated in the TrAV. The maximum shear stress limit found in the BAV was 1.05 Pa compared to 0.8 Pa in the TrAV valve during systole. Also, the BAV shows lower probabilities of low shear stress (<0.4 Pa) compared with the TrAV.
3.4. Sinus Washout
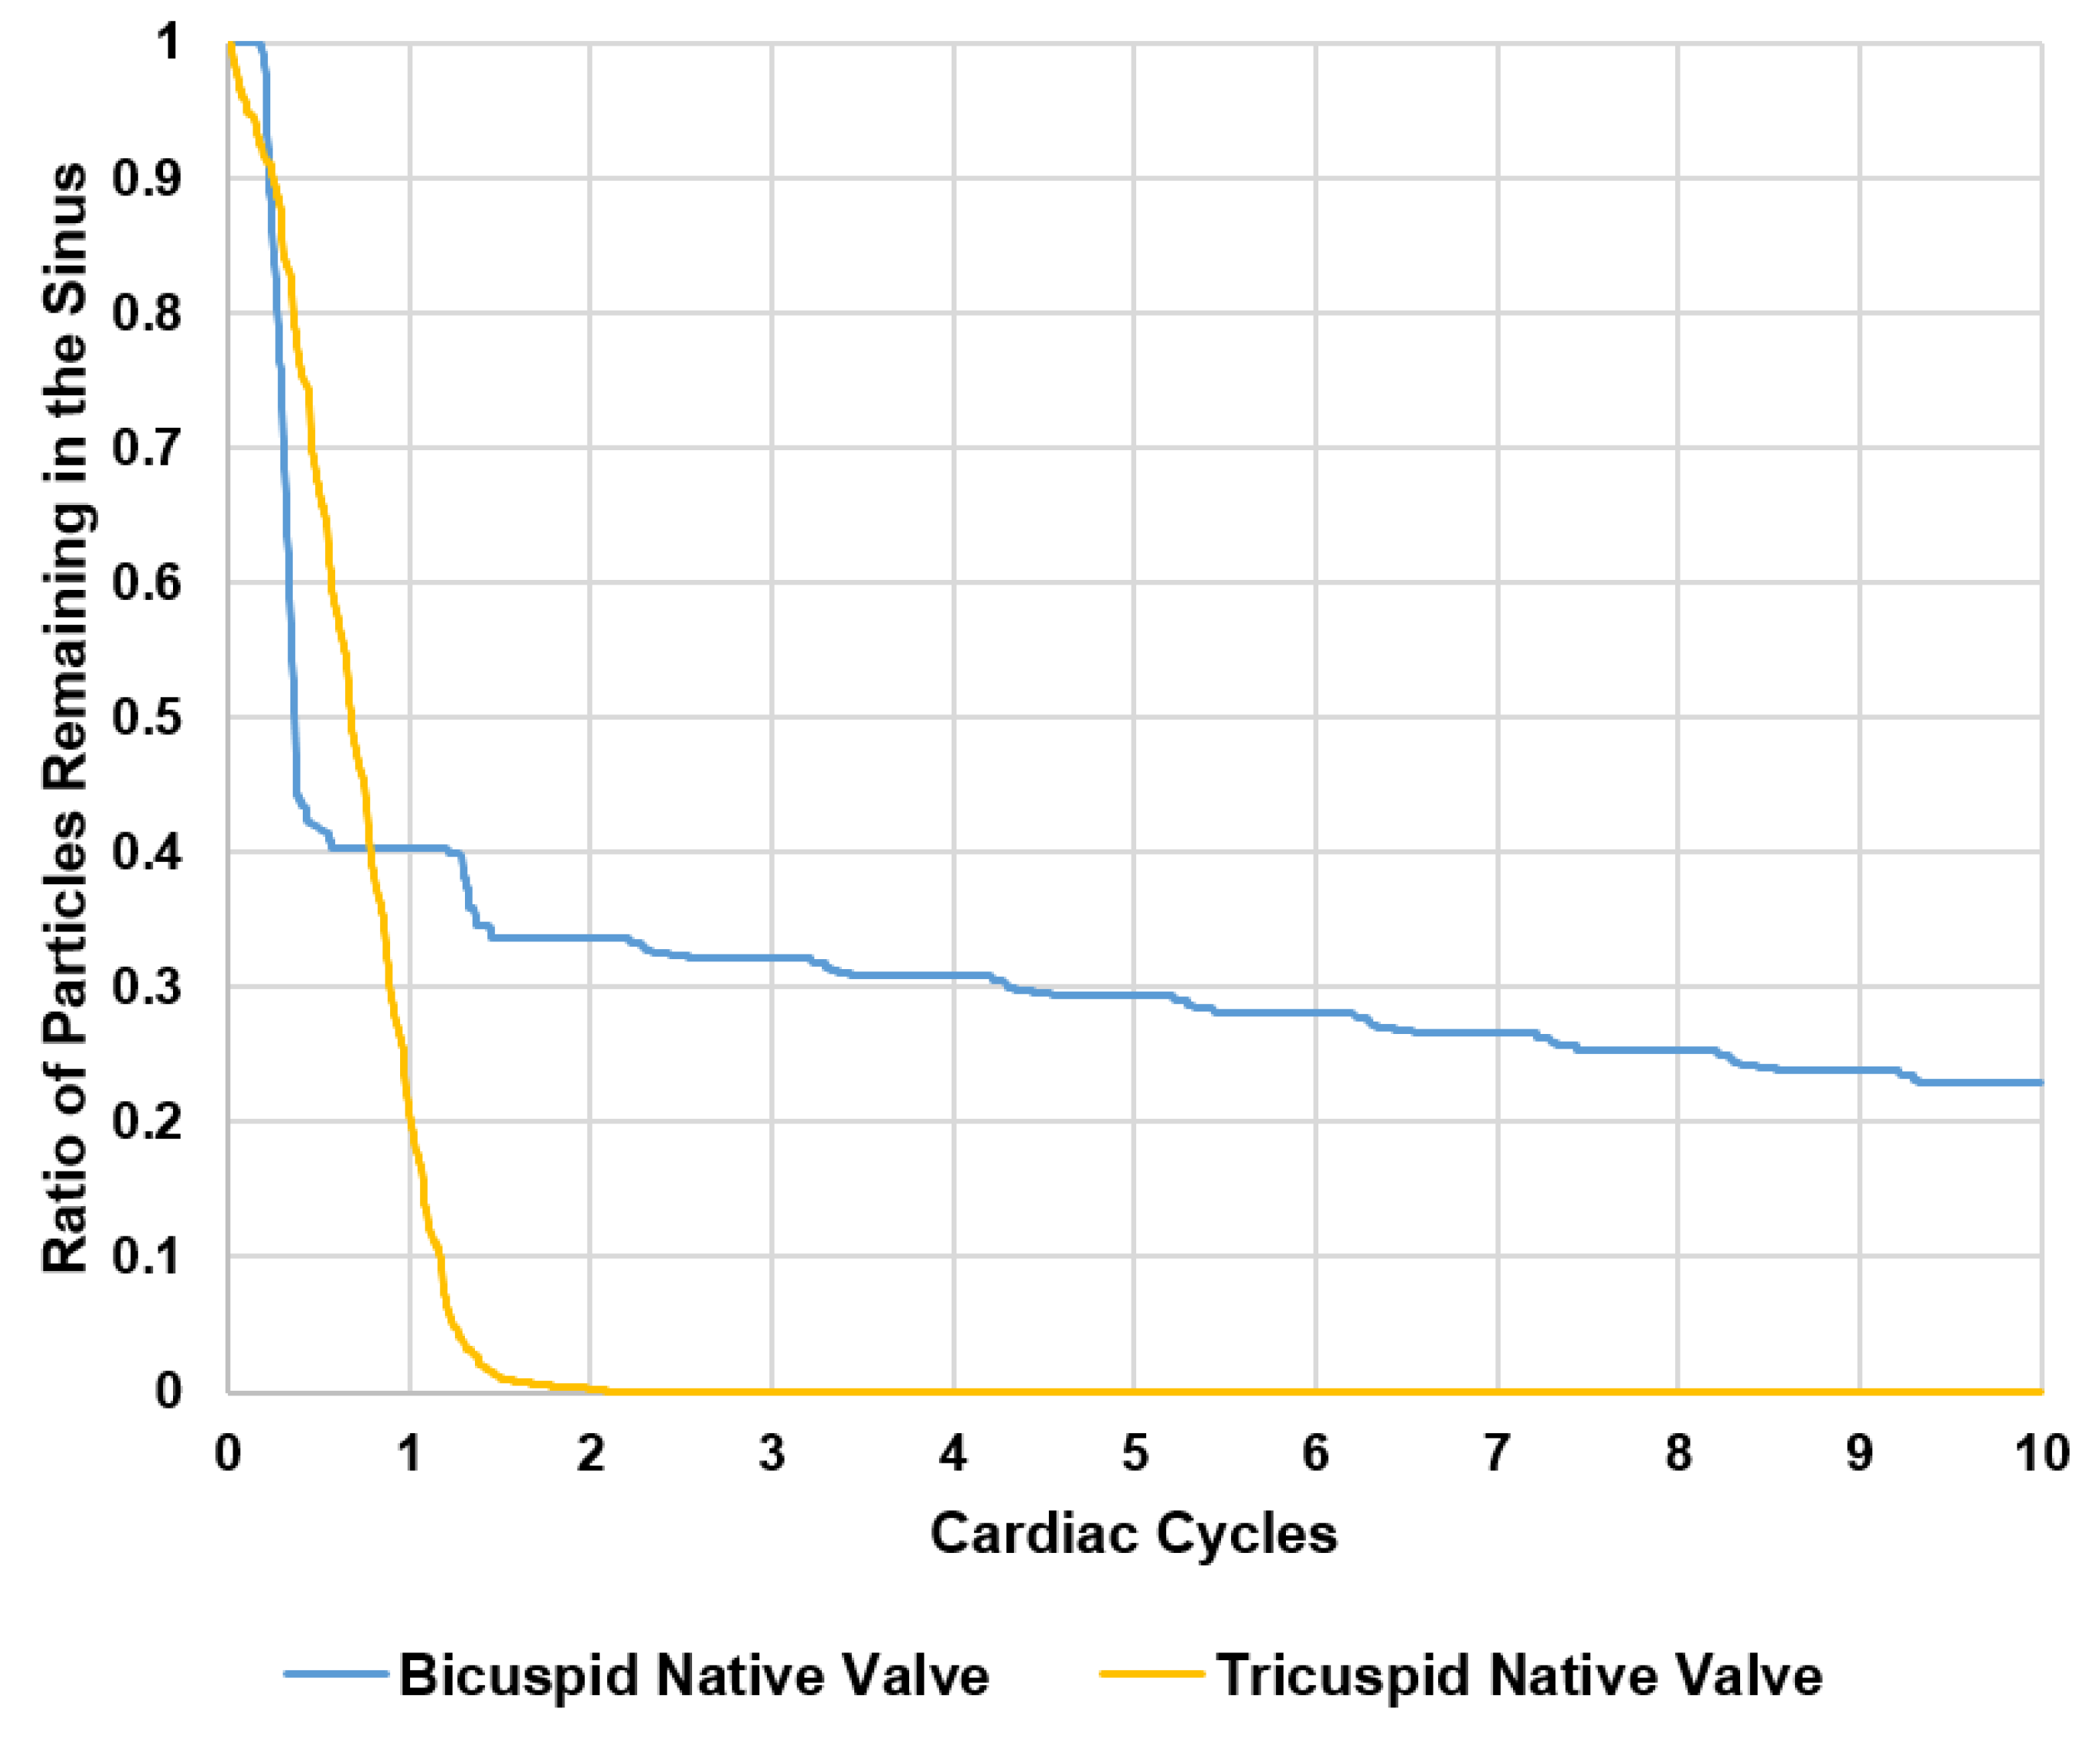
Figure 4 shows the survival probability curve of particles remaining in the sinus of the BAV and TrAV with different valve combinations. In the bicuspid native valve, after 1 cycle, 40% of the particles exit the sinus (60% remain), and by the second cycle, 5% additionally follow. After 10 cycles, 22.8% of the particles remain so the total washout is 77.2%. In the tricuspid native valve, 100% of the particles exit the sinus immediately after the first one and a half cardiac cycles.
4. Discussion
Unsteady time-dependent post-valvular velocity and vorticity fields are studied, and emphasis is placed on flow visualization, specifically instantaneous velocity maps and vorticity contours from which shear stress and sinus washout calculations are performed. Analysis of vortex formation and characteristics provide a comprehensive characterization of the differences in dynamics between the two distinct valves, qualitatively and quantitatively.
4.1. Flow Velocity and Vorticity Fields and Hemodynamics
While a constantly appearing starting vortex is observed in the native sinus of the BAV and TrAV, the development of this vortex between the two cases is starkly different. One reason behind this difference is the morphology of the sinuses. Vortices are characterized by a conic tendency which means that they prefer circular or spherical shapes for optimal propagation over obstacles and irregularities [24,25]. The bicuspid valve sinus is close to being spherical, thus less obstructive compared with the tricuspid sinus. Additionally, the distance between the sinus ridge (tip near the sinotubular junction, STJ) and the tip of the leaflet can affect the vortex. The narrow distance in the BAV case allows for the vortex to stay entrapped inside the sinus region, as long as the flow is ongoing from one side, and to experience a delay in formation and propagation during early acceleration and acceleration phases from another side. Additionally, the leaflet morphology also plays a role. As a result of the unique anatomy of the bicuspid valve that forces the aortic jet to be skewed in the anterolateral directions [26], more resistance to have the aortic leaflets fully open, compared to the tri-leaflet aortic valve, is experienced, which may explain the reason behind the delay in vortex formation at the very first stages of systole. This can be inferred from pressure gradient results, where the BAV yielded around a 1.55 times higher pressure gradient compared to the tricuspid valve for the same interval of Reynold’s number (4078 for BAV and 3891 for TrAV).
4.2. Shear Stress Distribution
Thrombosis is most likely to occur in low-flow or stasis regions with reduced shear stresses [6,7,8,27,28]. In healthy blood vessels, shear stress values range from 1.5 to 2 Pa [6,7,29]. Usually shear stress varies with the local conditions and the flow rate. Very low values of shear stress change the behavior of some cells, for example, platelets, and can lead to thrombus formation [30]. It is the shear-dependent mass transport that is responsible for atheroma growth, and thus, higher risk of thrombosis. Furthermore, the endothelium has been shown to become atherogenic when exposed to low wall shear stress [30,31]. Several studies have reported and classified shear stress values in grafts as “high” and “low” [32], and suggested low values of shear stress to be 0.25 Pa and 0.31 Pa, while the high values were 1.54 Pa and 1.71 Pa. Another study of vascular shear stress by Cuningham et al. [33] and Saw et al. [34] showed that vascular shear stress of large conduit arteries typically varies between 5 and 20 dynes/cm2 (0.5 to 2.0 Pa). Another study by Casa et al. [35] reported a normal value of 1000 s−1 for shear rate that corresponds to 3.5 Pa in arteries, and a value of 500 s−1 corresponding to 1.75 Pa in coronary arteries. A study by Bark et al. [36] has reported physiological arterial shear rates below 400 s−1 equivalent to 1.4 Pa. Having said this, high likelihood of high shear stress near the leaflet is desirable, while lower likelihood of high shear stress is not favorable, as low shear stress is associated with higher likelihoods of developing thrombus.
As anticipated, the different flow patterns and magnitudes and vorticity concentration—which does not differ between pure shearing motions and the actual swirling motion of a vortex [37]—obtained in the sinus regions between the bicuspid and the tricuspid native valves, would lead to different shear stress magnitudes and distributions, particularly near the leaflets. The intense rotation adjacent to the leaflet, due to the continuous rotation of the entrapped main vortex in the bicuspid valve sinus and to the concentration of vorticity, leads to velocity gradients near the leaflets, and enhances fluid shearing, thus leading to the development of high shear stress magnitudes compared to the tricuspid valve sinus. The vorticity extraction of the bicuspid sinus aortic vortex is slower than that of the tricuspid sinus, allowing for a stronger vortex core and a persistent rotation throughout systole without forming counter rotating vortices. This can be due to the geometry of the aortic sinus as previously explained: the aortic sinus is circular in the bicuspid valve case, while it is a little flattened for the tricuspid case.
4.3. Sinus Washout
Washout curves are also tremendously different between both sinuses. Having a vortex that persists throughout systole (particularly in the second half) along with backflow due to valvular leak and regurgitation throughout all diastole, entraps particles in the sinus in an endless rotational motion. This makes it difficult to exit the region, and reduces overall sinus washout in the bicuspid aortic sinus.
Unlike the BAV sinus, the TrAV sinus is not characterized by a vortex that encompasses the whole sinus during systole as previously explained. The particle turnover rate is high. This leads to having the blood flow inside the sinus exit the sinus region due to the interaction between the vortex and the fluid inside the TrAV sinus, as clearly shown in Figure 2 at peak systole. That may be one reason why there is a significant difference in washout between the TrAV and BAV native sinuses, confirmed in in vivo and in-vitro studies, where bicuspid valves are always more prone to diseases where recirculation zones and stasis are the main causes [6,38].
4.4. Comparison between Idealized and Anatomical Sinus Geometries
This study is one of the first studies that investigated sinus flow and aortic sinus vortex complexity in a personalized native bicuspid with fusion of the left and right coronary cusps and native tricuspid aortic valve. Previous in-vitro studies [39,40] adopted rigid axisymmetric aortic sinus chambers (without the three sinuses). In this study, as previously discussed, the diverse anatomical geometries led to tremendously different dynamics, such as different initiation and evolution of the sinus vortex along with their characteristics regarding entrapment and dissipation. Having these different mechanisms contributed to different sinus washout, spatiotemporal velocity, and shear stress characteristics in the region adjacent to the leaflets. Stasis regions are highly influenced by sinus vortex dynamics. This relationship emphasizes, consequently, the importance of patient characteristics.
Finally, the intricate patient-specific and valve-specific flow patterns in the sinus lead to mechanical forces at levels that can cause blood cell damage and stasis, thus, most likely, thrombosis. This may trigger pathways for various valvular heart diseases [6,11,19]. Specifically, turbulence is characterized by a tremendous rise in spatial and temporal velocity fluctuations [19,21]. These turbulent fluctuations in velocity cause non-physiological shear stresses that blood cells and platelets experience [41,42,43] and are dependent on the valve geometry (smoothness of inflow, calcification distribution, etc.), leaflet performance (opening, closing, calcium buildup), and distal diameter of the aorta relative to the valve orifice area. Reynolds shear stresses (turbulent stresses have been correlated in literature with hemolysis and platelet activation [19,21,44,45,46]. Turbulent non-physiological flow (that happens due to valve deterioration) was connected with blood damage, such as platelet activation, thrombus formation and hemolysis [47,48,49,50,51]. In-vitro studies investigated the risk of platelet activation highlighting 10 to 100 Pa as the beginning of platelet activation [52]. Some in-vitro studies have highlighted the importance of exposure time. We mention the following: Williams et al. found that platelet activation begins at 130 dynes/cm2 under an exposure time of 1023 s [53]; Hung et al. reported platelet damage at 100–165 dynes/cm2 with an exposure time of 102 s [54]; Ramstack et al. reported that platelet activation starts at 300–1000 dynes/cm2 at an exposure time of 10 s [55]. Therefore, investigating the blood damage in stenotic native aortic valve models is essential to understand the complexity of blood-stenotic valve interaction. From a comprehensive perspective, understanding and establishing a connection between valve hemodynamics and disease pathogenesis and complications necessitates integrated multimodality approaches in order to associate and correlate mechanics to biological cascades [11]. This study assesses sinus hemodynamics through studying the relevant flow fields.
4.5. Limitations
The bicuspid valve model used in this study represents one with fusion of right and left coronary sinus leaflets, and accordingly, these results cannot be extrapolated to all BAV morphologies. In addition, 2D fluid mechanics analysis may not be sufficient to comprehensively evaluate the flow feature in the sinus, and further, more elaborate experimental and computational studies are needed to investigate these flow features in more details.
5. Conclusions
This study constitutes a first detailed in-vitro investigation (to our knowledge) of patient specific representative native aortic sinus hemodynamics as regulated by a having a BAV and a TrAV. Novel methodology was developed to simulate in-vitro conditions as closely as possible to the physiological ones, through usage of patient-specific aortic valve roots. Sinus flow patterns were greatly different between the native valves. Vortex formation and propagation mechanisms, shear stress near the leaflets, and sinus washout curves were also distinct and largely dependent on the patient-specific surrounding geometry interaction with the leaflets of the valve. All these factors could help elucidate the impact of different native aortic valve types and sinus morphologies on the engendered sinus hemodynamics. Aortic sinus flow is highly dependent on anatomical, hemodynamic, and leaflet properties. From this patient-specific study, we conclude that aortic sinus flow cannot be generalized always to be a predictable singular vortex system, for instance, but rather the result of a highly rich and complex interaction. This study can constitute the basis that may potentially lead to future exhaustive studies on large cohorts of patients or systemic digitally manipulated models to explore the parameter space defined by anatomic, hemodynamic, and leaflet properties.
Supplementary Materials
The following are available online at https://www.mdpi.com/2311-5521/3/3/56/s1, Video S1: Sinus flow streak visualization of the bicuspid valve sinus and the tricuspid valve sinus. Note that the flow goes from right to left in the BAV while it goes from left to right in TrAV.
Author Contributions
Conceptualization, H.H. and L.P.D.; Methodology, H.H. and L.P.D.; Software, H.H.; Validation, H.H. and L.P.D.; Formal Analysis, H.H. and L.P.D.; Investigation, H.H. and L.P.D.; Resources, L.P.D.; Data Curation, H.H. and L.P.D.; Writing-Original Draft Preparation, H.H.; Writing-Review & Editing, H.H. and L.P.D.; Visualization, H.H. and L.P.D.; Supervision, L.P.D.; Project Administration, L.P.D.; Funding Acquisition, L.P.D.
Funding
This research was funded by the National Institutes of Health grant number R01HL119824.
Conflicts of Interest
The authors declare no conflict of interest.
References
- Verma, S.; Siu, S.C. Aortic dilatation in patients with bicuspid aortic valve. N. Engl. J. Med. 2014, 370, 1920–1929. [Google Scholar] [CrossRef] [PubMed]
- Reddy, G.; Wang, Z.; Nishimura, R.A.; Greason, K.L.; Yoon, S.H.; Makkar, R.R.; Holmes, D.R., Jr. Transcatheter aortic valve replacement for stenotic bicuspid aortic valves: S ystematic review and meta analyses of observational studies. Catheter. Cardiovasc. Interv. 2018, 91, 975–983. [Google Scholar] [CrossRef] [PubMed]
- Yoon, S.-H.; Ahn, J.-M.; Hayashida, K.; Watanabe, Y.; Shirai, S.; Kao, H.-L.; Yin, W.-H.; Lee, M.K.-Y.; Tay, E.; Araki, M. Clinical outcomes following transcatheter aortic valve replacement in Asian population. JACC Cardiovasc. Interv. 2016, 9, 926–933. [Google Scholar] [CrossRef] [PubMed]
- Mack, M.J.; Brennan, J.M.; Brindis, R.; Carroll, J.; Edwards, F.; Grover, F.; Shahian, D.; Tuzcu, E.M.; Peterson, E.D.; Rumsfeld, J.S. Outcomes following transcatheter aortic valve replacement in the United States. Jama 2013, 310, 2069–2077. [Google Scholar] [CrossRef] [PubMed]
- Makkar, R.R.; Fontana, G.; Jilaihawi, H.; Chakravarty, T.; Kofoed, K.F.; De Backer, O.; Asch, F.M.; Ruiz, C.E.; Olsen, N.T.; Trento, A.; et al. Possible subclinical leaflet thrombosis in bioprosthetic aortic valves. N. Engl. J. Med. 2015, 373, 2015–2024. [Google Scholar] [CrossRef] [PubMed]
- Hatoum, H.; Dollery, J.; Lilly, S.M.; Crestanello, J.; Dasi, L.P. Impact of Patient Morphologies on Sinus Flow Stasis in Transcatheter Aortic Valve Replacement: An in-vitro study. J. Thorac. Cardiovasc. Surg. 2018. [Google Scholar] [CrossRef] [PubMed]
- Hatoum, H.; Dollery, J.; Lilly, S.M.; Crestanello, J.; Dasi, L.P. Implantation Depth and Rotational Orientation Effect on Valve-in-Valve Hemodynamics and Sinus Flow. Ann. Thorac. Surg. 2018, 106, 70–78. [Google Scholar] [CrossRef] [PubMed]
- Hatoum, H.; Moore, B.L.; Maureira, P.; Dollery, J.; Crestanello, J.A.; Dasi, L.P. Aortic sinus flow stasis likely in valve-in-valve transcatheter aortic valve implantation. J. Thorac. Cardiovasc. Surg. 2017, 154, 32–43. [Google Scholar] [CrossRef] [PubMed]
- Freeman, R.V.; Otto, C.M. Spectrum of calcific aortic valve disease: Pathogenesis, disease progression, and treatment strategies. Circulation 2005, 111, 3316–3326. [Google Scholar] [CrossRef] [PubMed]
- Wallby, L.; Janerot-Sjöberg, B.; Steffensen, T.; Broqvist, M. T lymphocyte infiltration in non-rheumatic aortic stenosis: A comparative descriptive study between tricuspid and bicuspid aortic valves. Heart 2002, 88, 348–351. [Google Scholar] [CrossRef] [PubMed]
- Sotiropoulos, F.; Le, T.B.; Gilmanov, A. Fluid mechanics of heart valves and their replacements. Ann. Rev. Fluid Mech. 2016, 48, 259–283. [Google Scholar] [CrossRef]
- Moore, B.L.; Dasi, L.P. Coronary flow impacts aortic leaflet mechanics and aortic sinus hemodynamics. Ann. Biomed. Eng. 2015, 43, 2231–2241. [Google Scholar] [CrossRef] [PubMed]
- Hatoum, H.; Crestanello, J.; Dasi, L.P. Possible Subclinical Leaflet Thrombosis in Bioprosthetic Aortic Valves. N. Engl. J. Med. 2016, 374, 1591. [Google Scholar] [PubMed]
- Toninato, R.; Salmon, J.; Susin, F.M.; Ducci, A.; Burriesci, G. Physiological vortices in the sinuses of Valsalva: An in vitro approach for bio-prosthetic valves. J. Biomech. 2016, 49, 2635–2643. [Google Scholar] [CrossRef] [PubMed]
- Moore, B.; Dasi, L.P. Spatiotemporal complexity of the aortic sinus vortex. Exp. Fluids 2014, 55, 1770. [Google Scholar] [CrossRef] [PubMed]
- Peacock, J.A. An in vitro study of the onset of turbulence in the sinus of Valsalva. Circ. Res. 1990, 67, 448–460. [Google Scholar] [CrossRef] [PubMed]
- Kheradvar, A.; Groves, E.M.; Falahatpisheh, A.; Mofrad, M.K.; Alavi, S.H.; Tranquillo, R.; Dasi, L.P.; Simmons, C.A.; Grande-Allen, K.J.; Goergen, C.J. Emerging trends in heart valve engineering: Part IV. Computational modeling and experimental studies. Ann. Biomed. Eng. 2015, 43, 2314–2333. [Google Scholar] [CrossRef] [PubMed]
- Maragiannis, D.; Jackson, M.S.; Igo, S.R.; Schutt, R.C.; Connell, P.; Grande-Allen, J.; Barker, C.M.; Chang, S.M.; Reardon, M.J.; Zoghbi, W.A. Replicating patient-specific severe aortic valve stenosis with functional 3D modeling. Circ. Cardiovasc. Imaging 2015, 8, e003626. [Google Scholar] [CrossRef] [PubMed]
- Hatoum, H.; Yousefi, A.; Lilly, S.; Maureira, P.; Crestanello, J.; Dasi, L.P. An In-Vitro Evaluation of Turbulence after Transcatheter Aortic Valve Implantation. J. Thorac. Cardiovasc. Surg. 2018. [Google Scholar] [CrossRef] [PubMed]
- Hatoum, H.; Dollery, J.; Lilly, S.M.; Crestanello, J.A.; Dasi, L.P. Effect of severe bioprosthetic valve tissue ingrowth and inflow calcification on valve-in-valve performance. J. Biomech. 2018, 74, 171–179. [Google Scholar] [CrossRef] [PubMed]
- Hatoum, H.; Heim, F.; Dasi, L.P. Stented valve dynamic behavior induced by polyester fiber leaflet material in transcatheter aortic valve devices. J. Mech. Behav. Biomed. Mater. 2018, 86, 232–239. [Google Scholar] [CrossRef] [PubMed]
- Hatoum, H.; Moore, B.L.; Dasi, L.P. On the Significance of Systolic Flow Waveform on Aortic Valve Energy Loss. Ann. Biomed. Eng. 2018. [Google Scholar] [CrossRef] [PubMed]
- Kumar, G.; Raghav, V.; Lerakis, S.; Yoganathan, A.P. High transcatheter valve replacement may reduce washout in the aortic sinuses: An in-vitro study. J. Heart Valve Disease 2015, 24, 22–29. [Google Scholar]
- Gustafson, K.E.; Sethian, J.A. Vortex Methods and Vortex Motion; SIAM: Philadelphia, PA, USA, 1991; ISBN 978-0-89871-258-2. [Google Scholar]
- Reynolds, O. On the resistance encountered by vortex rings, and the relation between the vortex rings and streamlines of a disk. Nature 1876, 14, 477–479. [Google Scholar]
- Hope, M.D.; Hope, T.A.; Meadows, A.K.; Ordovas, K.G.; Urbania, T.H.; Alley, M.T.; Higgins, C.B. Bicuspid aortic valve: Four-dimensional MR evaluation of ascending aortic systolic flow patterns. Radiology 2010, 255, 53–61. [Google Scholar] [CrossRef] [PubMed]
- Chandra, S.; Rajamannan, N.M.; Sucosky, P. Computational assessment of bicuspid aortic valve wall-shear stress: Implications for calcific aortic valve disease. Biomech. Model. Mechanobiol. 2012, 11, 1085–1096. [Google Scholar] [CrossRef] [PubMed]
- Dasi, L.P.; Hatoum, H.; Kheradvar, A.; Zareian, R.; Alavi, S.H.; Sun, W.; Martin, C.; Pham, T.; Wang, Q.; Midha, P.A. On the mechanics of transcatheter aortic valve replacement. Ann. Biomed. Eng. 2017, 45, 310–331. [Google Scholar] [CrossRef] [PubMed]
- Yap, C.H.; Liu, X.; Pekkan, K. Characterizaton of the vessel geometry, flow mechanics and wall shear stress in the great arteries of wildtype prenatal mouse. PLoS ONE 2014, 9, e86878. [Google Scholar] [CrossRef] [PubMed] [Green Version]
- Traub, O.; Berk, B.C. Laminar shear stress: Mechanisms by which endothelial cells transduce an atheroprotective force. Arterioscler. Thromb. Vasc. Biol. 1998, 18, 677–685. [Google Scholar] [CrossRef] [PubMed]
- Berk, B.C.; ABE, J.I.; Min, W.; Surapisitchat, J.; Yan, C. Endothelial atheroprotective and anti-inflammatory mechanisms. Ann. N. Y. Acad. Sci. 2001, 947, 93–111. [Google Scholar] [CrossRef] [PubMed]
- Wu, M.H.-D.; Kouchi, Y.; Onuki, Y.; Shi, Q.; Yoshida, H.; Kaplan, S.; Viggers, R.F.; Ghali, R.; Sauvage, L.R. Effect of differential shear stress on platelet aggregation, surface thrombosis, and endothelialization of bilateral carotid-femoral grafts in the dog. J. Vasc. Surg. 1995, 22, 382–392. [Google Scholar] [CrossRef]
- Cunningham, K.S.; Gotlieb, A.I. The role of shear stress in the pathogenesis of atherosclerosis. Lab. Investig. 2005, 85, 9. [Google Scholar] [CrossRef] [PubMed]
- Saw, S.N.; Dawn, C.; Biswas, A.; Mattar, C.N.Z.; Yap, C.H. Characterization of the in vivo wall shear stress environment of human fetus umbilical arteries and veins. Biomech. Model. Mechanobiol. 2017, 16, 197–211. [Google Scholar] [CrossRef] [PubMed]
- Casa, L.D.; Deaton, D.H.; Ku, D.N. Role of high shear rate in thrombosis. J. Vasc. Surg. 2015, 61, 1068–1080. [Google Scholar] [CrossRef] [PubMed]
- Bark, D.L., Jr.; Para, A.N.; Ku, D.N. Correlation of thrombosis growth rate to pathological wall shear rate during platelet accumulation. Biotechnol. Bioeng. 2012, 109, 2642–2650. [Google Scholar] [CrossRef] [PubMed]
- Kolář, V. Vortex identification: New requirements and limitations. Int. J. Heat Fluid Flow 2007, 28, 638–652. [Google Scholar] [CrossRef]
- Fedak, P.W.; Verma, S.; David, T.E.; Leask, R.L.; Weisel, R.D.; Butany, J. Clinical and pathophysiological implications of a bicuspid aortic valve. Circulation 2002, 106, 900–904. [Google Scholar] [CrossRef] [PubMed]
- Saikrishnan, N.; Yap, C.-H.; Milligan, N.C.; Vasilyev, N.V.; Yoganathan, A.P. In vitro characterization of bicuspid aortic valve hemodynamics using particle image velocimetry. Ann. Biomed. Eng. 2012, 40, 1760–1775. [Google Scholar] [CrossRef] [PubMed]
- Yoganathan, A.; Woo, Y.; Sung, H.; Williams, F.; Franch, R.; Jones, M. In vitro hemodynamic characteristics of tissue bioprostheses in the aortic position. J. Thorac. Cardiovasc. Surg. 1986, 92, 198–209. [Google Scholar] [PubMed]
- Morshed, K.N.; Bark, D., Jr.; Forleo, M.; Dasi, L.P. Theory to predict shear stress on cells in turbulent blood flow. PLoS ONE 2014, 9, e105357. [Google Scholar] [CrossRef] [PubMed]
- Yun, B.M.; Dasi, L.; Aidun, C.; Yoganathan, A. Highly resolved pulsatile flows through prosthetic heart valves using the entropic lattice-Boltzmann method. J. Fluid Mech. 2014, 754, 122–160. [Google Scholar] [CrossRef]
- Dasi, L.P.; Morshed, K.N.; Forleo, M. Phenomenology of Hemolysis in Turbulent Flows. In Proceedings of the ASME 2013 Summer Bioengineering Conference, Sunriver, OR, USA, 26–29 June 2013. [Google Scholar]
- Hedayat, M.; Asgharzadeh, H.; Borazjani, I. Platelet activation of mechanical versus bioprosthetic heart valves during systole. J. Biomech. 2017, 56, 111–116. [Google Scholar] [CrossRef] [PubMed]
- Yun, B.M.; Aidun, C.K.; Yoganathan, A.P. Blood damage through a bileaflet mechanical heart valve: A quantitative computational study using a multiscale suspension flow solver. J. Biomech. Eng. 2014, 136, 101009. [Google Scholar] [CrossRef] [PubMed]
- Khalili, F.; Gamage, P.; Mansy, H.A. The Influence of the Aortic Root Geometry on Flow Characteristics of a Bileaflet Mechanical Heart Valve. arXiv, 2018; arXiv:1803.03362. [Google Scholar] [Green Version]
- Giersiepen, M.; Wurzinger, L.; Opitz, R.; Reul, H. Estimation of shear stress-related blood damage in heart valve prostheses-in vitro comparison of 25 aortic valves. Int. J. Artif. Organs 1990, 13, 300–306. [Google Scholar] [CrossRef] [PubMed]
- Nygaard, H.; Giersiepen, M.; Hasenkam, J.; Reul, H.; Paulsen, P.; Rovsing, P.; Westphal, D. Two-dimensional color-mapping of turbulent shear stress distribution downstream of two aortic bioprosthetic valves in vitro. J. Biomech. 1992, 25, 437–440. [Google Scholar] [CrossRef]
- Hanle, D.; Harrison, E.; Yoganathan, A.; Corcoran, W. Turbulence downstream from the Ionescu-Shiley bioprosthesis in steady and pulsatile flow. Med. Biol. Eng. Comput. 1987, 25, 645–649. [Google Scholar] [CrossRef] [PubMed]
- Schoephoerster, R.T.; Chandran, K.B. Velocity and turbulence measurements past mitrial valve prostheses in a model left ventricle. J. Biomech. 1991, 24, 549–562. [Google Scholar] [CrossRef]
- Jones, S.A. A relationship between Reynolds stresses and viscous dissipation: Implications to red cell damage. Ann. Biomed. Eng. 1995, 23, 21–28. [Google Scholar] [CrossRef] [PubMed]
- Dasi, L.P.; Simon, H.A.; Sucosky, P.; Yoganathan, A.P. Fluid mechanics of artificial heart valves. Clin. Exp. Pharmacol. Physiol. 2009, 36, 225–237. [Google Scholar] [CrossRef] [PubMed]
- Williams, A. Release of serotonin from human platelets by acoustic microstreaming. J. Acoust. Soc. Am. 1974, 56, 1640–1643. [Google Scholar] [CrossRef] [PubMed]
- Hung, T.; Hochmuth, R.; Joist, J.; Sutera, S. Shear-induced aggregation and lysis of platelets. ASAIO J. 1976, 22, 285–290. [Google Scholar]
- Ramstack, J.; Zuckerman, L.; Mockros, L. Shear-induced activation of platelets. J. Biomech. 1979, 12, 113–125. [Google Scholar] [CrossRef]
Figure 1.
Steps followed to construct the 3D patient-specific models. (a) CT image segmentation; (b) aortic view of the aortic valve with leaflet calcification; (c) long axis view of the digital model; (d) 3D printed model; (e) aortic view of the 3D printed model; and (f) left heart simulator flow loop where the valves are tested.
Figure 2.
Velocity vectors and vorticity contours within the native bicuspid and native tricuspid valve sinuses at selected time points throughout the cardiac cycle. STJ denotes sinotubular junction.
Figure 2.
Velocity vectors and vorticity contours within the native bicuspid and native tricuspid valve sinuses at selected time points throughout the cardiac cycle. STJ denotes sinotubular junction.

Figure 3.
Probability density function in log scale of varying shear stress distribution values along a sub-region near the valve leaflets during systole for the bicuspid and the tricuspid valve sinuses.
Figure 3.
Probability density function in log scale of varying shear stress distribution values along a sub-region near the valve leaflets during systole for the bicuspid and the tricuspid valve sinuses.

Figure 4.
Survival probability curve of particles remaining in the bicuspid valve sinus and the tricuspid valve sinus.
Figure 4.
Survival probability curve of particles remaining in the bicuspid valve sinus and the tricuspid valve sinus.


Table 1.
Hemodynamic parameters of the representative native valves.
| Stenosed Valves | BAV | TrAV |
|---|---|---|
| CO (L/min) | 4.2 | 5.15 |
| HR (BPM) | 81 | 81 |
| Pressures (mmHg) | 98/68 | 100/61 |
| ∆P (mmHg) | 76.25 ± 0.98 | 49.47 ± 2.62 |
| EOA (cm2) | 0.55 ± 0.01 | 1.12 ± 0.06 |
| Qmax (L/min) | 25.4 ± 0.48 | 37.62 ± 1.92 |
CO: cardiac output, ∆P: pressure gradient, EOA: effective orifice area, Qmax: maximum flow rate.
© 2018 by the authors. Licensee MDPI, Basel, Switzerland. This article is an open access article distributed under the terms and conditions of the Creative Commons Attribution (CC BY) license (http://creativecommons.org/licenses/by/4.0/).
Share and Cite
MDPI and ACS Style
Hatoum, H.; Dasi, L.P. Sinus Hemodynamics in Representative Stenotic Native Bicuspid and Tricuspid Aortic Valves: An In-Vitro Study. Fluids 2018, 3, 56. https://doi.org/10.3390/fluids3030056
AMA Style
Hatoum H, Dasi LP. Sinus Hemodynamics in Representative Stenotic Native Bicuspid and Tricuspid Aortic Valves: An In-Vitro Study. Fluids. 2018; 3(3):56. https://doi.org/10.3390/fluids3030056
Chicago/Turabian StyleHatoum, Hoda, and Lakshmi Prasad Dasi. 2018. "Sinus Hemodynamics in Representative Stenotic Native Bicuspid and Tricuspid Aortic Valves: An In-Vitro Study" Fluids 3, no. 3: 56. https://doi.org/10.3390/fluids3030056