Genetic Algorithm Based Optimization of Wing Rotation in Hover


1
Department of Mechanical Engineering, Institute of Fluid Mechanics, University of Kassel, 34125 Kassel, Germany
2
École polytechnique fédérale de Lausanne, Institute of Mechanical Engineering, Unsteady Flow Diagnostics Laboratory, 1015 Lausanne, Switzerland
*
Author to whom correspondence should be addressed.
Fluids 2018, 3(3), 59; https://doi.org/10.3390/fluids3030059
Submission received: 5 July 2018
/
Revised: 6 August 2018
/
Accepted: 11 August 2018
/
Published: 15 August 2018
(This article belongs to the Special Issue Bio-inspired Flow)
Abstract
:The pitching kinematics of an experimental hovering flapping wing setup are optimized by means of a genetic algorithm. The pitching kinematics of the setup are parameterized with seven degrees of freedom to allow for complex non-linear and non-harmonic pitching motions. Two optimization objectives are considered. The first objective is maximum stroke average efficiency, and the second objective is maximum stroke average lift. The solutions for both optimization scenarios converge within less than 30 generations based on the evaluation of their fitness. The pitching kinematics of the best individual of the initial and final population closely resemble each other for both optimization scenarios, but the optimal kinematics differ substantially between the two scenarios. The most efficient pitching motion is smoother and closer to a sinusoidal pitching motion, whereas the highest lift-generating pitching motion has sharper edges and is closer to a trapezoidal motion. In both solutions, the rotation or pitching motion is advanced with respect to the sinusoidal stroke motion. Velocity field measurements at selected phases during the flapping motions highlight why the obtained solutions are optimal for the two different optimization objectives. The most efficient pitching motion is characterized by a nearly constant and relatively low effective angle of attack at the start of the half stroke, which supports the formation of a leading edge vortex close to the airfoil surface, which remains bound for most of the half stroke. The highest lift-generating pitching motion has a larger effective angle of attack, which leads to the generation of a stronger leading edge vortex and higher lift coefficient than in the efficiency optimized scenario.
1. Introduction
The aerodynamics of small natural flyers such as insects and birds have been a research topic of interest in the past decades [1,2,3,4]. The abilities of natural flyers to perform different tasks under varying flight conditions with high maneuverability are a source of inspiration for the development of micro air vehicles [5,6,7,8,9]. At low Reynolds numbers (), flapping wings can operate more efficiently than rotating wings while also providing a higher average lift coefficient [10,11]. Flapping wings have the capability to increase the lift and thrust production with respect to fixed wings by creating and controlling large-scale unsteady vortical flow structures. The unsteady aerodynamic phenomena that give rise to the exceptional flight characteristics of flapping wing flyers are very susceptible to slight changes of the kinematics within the flapping cycle. Previous studies have captured and mapped the wing kinematics of low Reynolds number flyers in order to replicate the complex motion of the wings and getting a better understanding of the resulting aerodynamic forces [12,13,14].
Several lift- and thrust-producing mechanisms in flapping wing flight utilizing the formation and shedding of vortices have been identified. The delayed stall and the formation of the leading edge vortex are the main contributors to the remarkable performance of nature’s flyers. Due to the high angle of attack of the wings during the wing stroke, a shear layer separates at the leading edge, which feeds a leading edge coherent vortex that stays attached to the wing for a substantial portion of the wing’s flapping cycle [15,16]. This bound vortex creates a stable low pressure region atop the suction side of the wing, contributing to the wing’s lift, but also inducing a drag penalty. Once the vortex has accumulated its maximum circulation, it separates from the shear layer and moves away from the wing, and its influence on the aerodynamic loads diminishes quickly. In hovering fight, the wings move back and forth in a symmetric way. At the end of a half stroke, front- or back-stroke, the wing rotates and can move back into the wake it created on the previous half stroke. This wing-wake interaction, commonly referred to as wake capture, is another unsteady mechanism that flapping wing insects rely on to recuperate some of the wake energy from the previously shed vorticity to increase their efficiency and lift performance [1,17,18,19].
Human-made flapping wing devices might aspire to a larger flight envelope than their natural counterparts and request adapted optimal kinematics for different flight conditions. Robust strategies for optimizing complex flapping wing kinematics with a large numbers of degrees of freedom, interacting parameters and multiple fitness criteria are desirable. Genetic or evolutionary algorithms are meta-heuristic optimization procedures based on the mechanics of natural selection that fit these requirements [20]. Genetic algorithms search through the solution space of a process or function by applying artificial evolution, also known as a survival of the fittest strategy. Analogous to evolution in nature, the fittest individuals of a population reproduce through mutation and combination to ensure advancement of the following generations. The genetic algorithms repeatedly test individuals of a generation to identify the best according to a predefined fitness function and produce new generations based on these fittest individuals until a convergence is reached or the optimization ends, when one or more termination conditions are met. Genetic algorithms select the best individuals across the most recent populations and not with respect to the initial population. This property in combination with their derivative-free and non-deterministic nature make genetic algorithms less susceptible to measurement outliers and experimental fluctuations in time. For this reason, genetic algorithms are selected for the experimental optimization presented in this paper, even though classical derivative-based optimization schemes can be found that are equally or more performant in terms of convergence time.
By probing the solution space, genetic algorithms are capable of identifying optimal solutions, even in vast and highly non-linear design spaces. Milano and Gharib [21] were among the first to apply genetic algorithm optimization to flapping wing kinematics in an experimental environment. For a system with two degrees of freedom, wing translation and rotation, the solution achieving the highest amount of lift in hovering flight was linked to the production of leading edge vortices of maximum circulation. A similar approach was used by Margerie et al. [22] to optimize the kinematics of a bird-like micro air vehicle with twelve degrees of freedom in forward flight through artificial evolution. Their computational fluid dynamics coupled optimization method achieved results closely resembling the kinematics of a gull in cruising flight. Alternative approaches use gradient-based optimization methods for the flapping wing system [23,24]. Tuncer and Kaya [23] evolved the kinematics of a plunging and pitching airfoil with a steepest ascent method in a numerical study to demonstrate that high propulsive capabilities could be achieved at the cost of efficiency. For a flapping wing in forward flight with active shape morphing, Stanford and Beran [24] focused on the propulsive efficiency under certain lift and thrust constraints by utilizing an inviscid three-dimensional unsteady vortex-lattice method.
Optimizing flapping wing geometry or kinematics in hovering flight is usually done with two main objectives in mind, to produce maximum lift or to achieve the highest hovering efficiency. Chaudhuri et al. [25] introduced a new standard of uncertainty quantification for experimental optimizations, which they used to design a high lift flapping wing micro air vehicle. A final design was reached fast and consistently by a genetic algorithm, including different sampling criteria and multiple surrogates in the gene evolution process, despite noisy data measurements and small manufacturing inaccuracies. The combined optimization of wing shape and kinematics by Ke and Zhang [26] led to solutions with lower flapping frequency, larger wing geometries and lower power density in comparison to the solutions from the individual optimization of shape and kinematics. Very recently, Lee and Lua [27] focused on the pitching motion of a hawk moth in hovering flight and used a two-stage optimization method to identity the influence of the pitch angle evolution to the flapping wing performance of complex, insect-like motion profiles. After an initial exploration of the parameter space with a semi-empirical quasi-steady model, they used a computational fluid dynamics simplex optimization method to demonstrate the potential aerodynamic performance gain of more advanced pitching kinematics for flapping wing micro air vehicles.
In this study, we parameterize the pitching kinematics of a hovering flapping wing to allow for complex non-linear and non-harmonic pitching motions. A genetic algorithm is used to identify the optimal solutions of the parameterized pitching motion given a fixed sinusoidal stroke motion in an experimental setting. Our interest here goes beyond finding the optimal solution. We are interested in studying the evolutionary development to further explore the idea of evolution-mimicking, which bears great potential for advancing human-engineered flying devices in addition to the classical bio-mimicking approach. In this paper, two optimization objectives are considered. The first objective is maximum stroke average efficiency, and the second objective is maximum stroke average lift. The solutions for both optimization scenarios will be compared, and the evolution of the best individuals in subsequent generations will be discussed, based on aerodynamic force and power measurements. Additionally, velocity field measurements at selected phases during the flapping motions will be analyzed to understand why the obtained solutions are optimal for the two different optimization objectives.
2. Materials and Methods
2.1. Wing Model and Kinematics
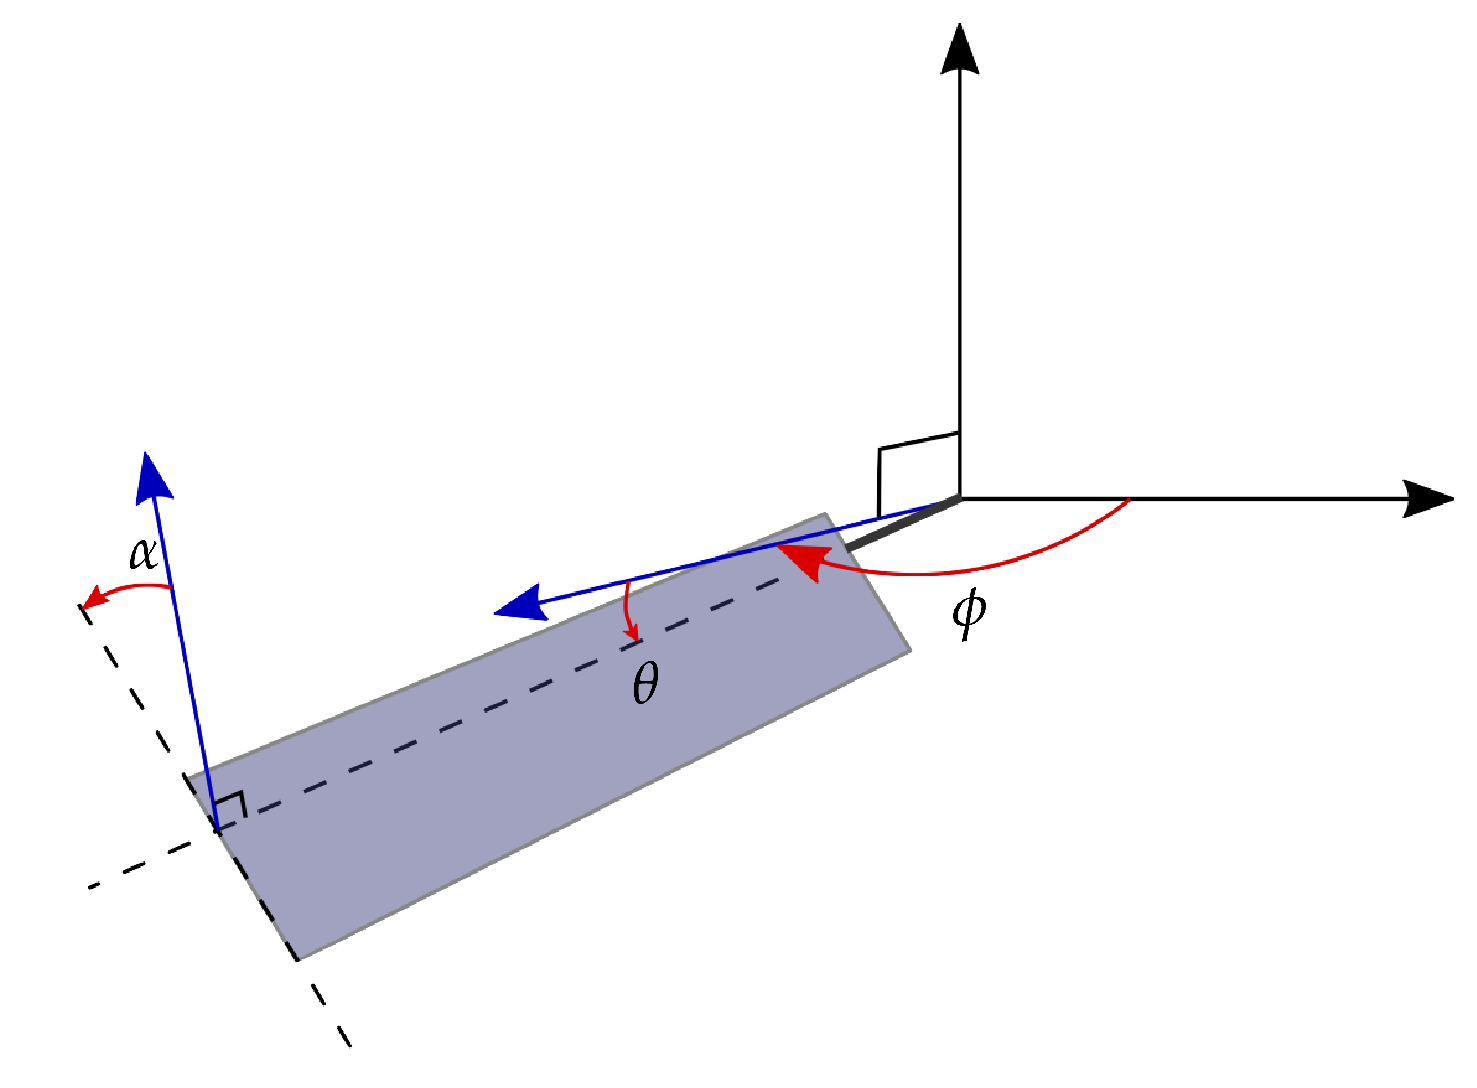
The kinematics of an insect wing in hovering flight are parameterized by the temporal evolution of the angles of the wings with respect to the three rotational axes (Figure 1). The stroke angle describes the sweeping motion of the wing on the horizontal plane and accounts for most of the kinetic energy of the wing. The pitching angle is the geometric angle between the wing’s chord and the vertical axis. The elevation angle describes the motion normal to the stroke plane. The amplitude of the elevation angle during hovering is small compared to the stroke or the pitch angle amplitudes, and the contribution of the elevation to the lift production is negligible [28]. The elevation is not considered in this study.
The aerodynamics of flapping wings in hovering flight can be characterized using two non-dimensional parameters, the reduced frequency k and Reynolds number . To assume similar aerodynamics both k and should be of the same order of magnitude (Table 1).
The reduced frequency k is defined by:
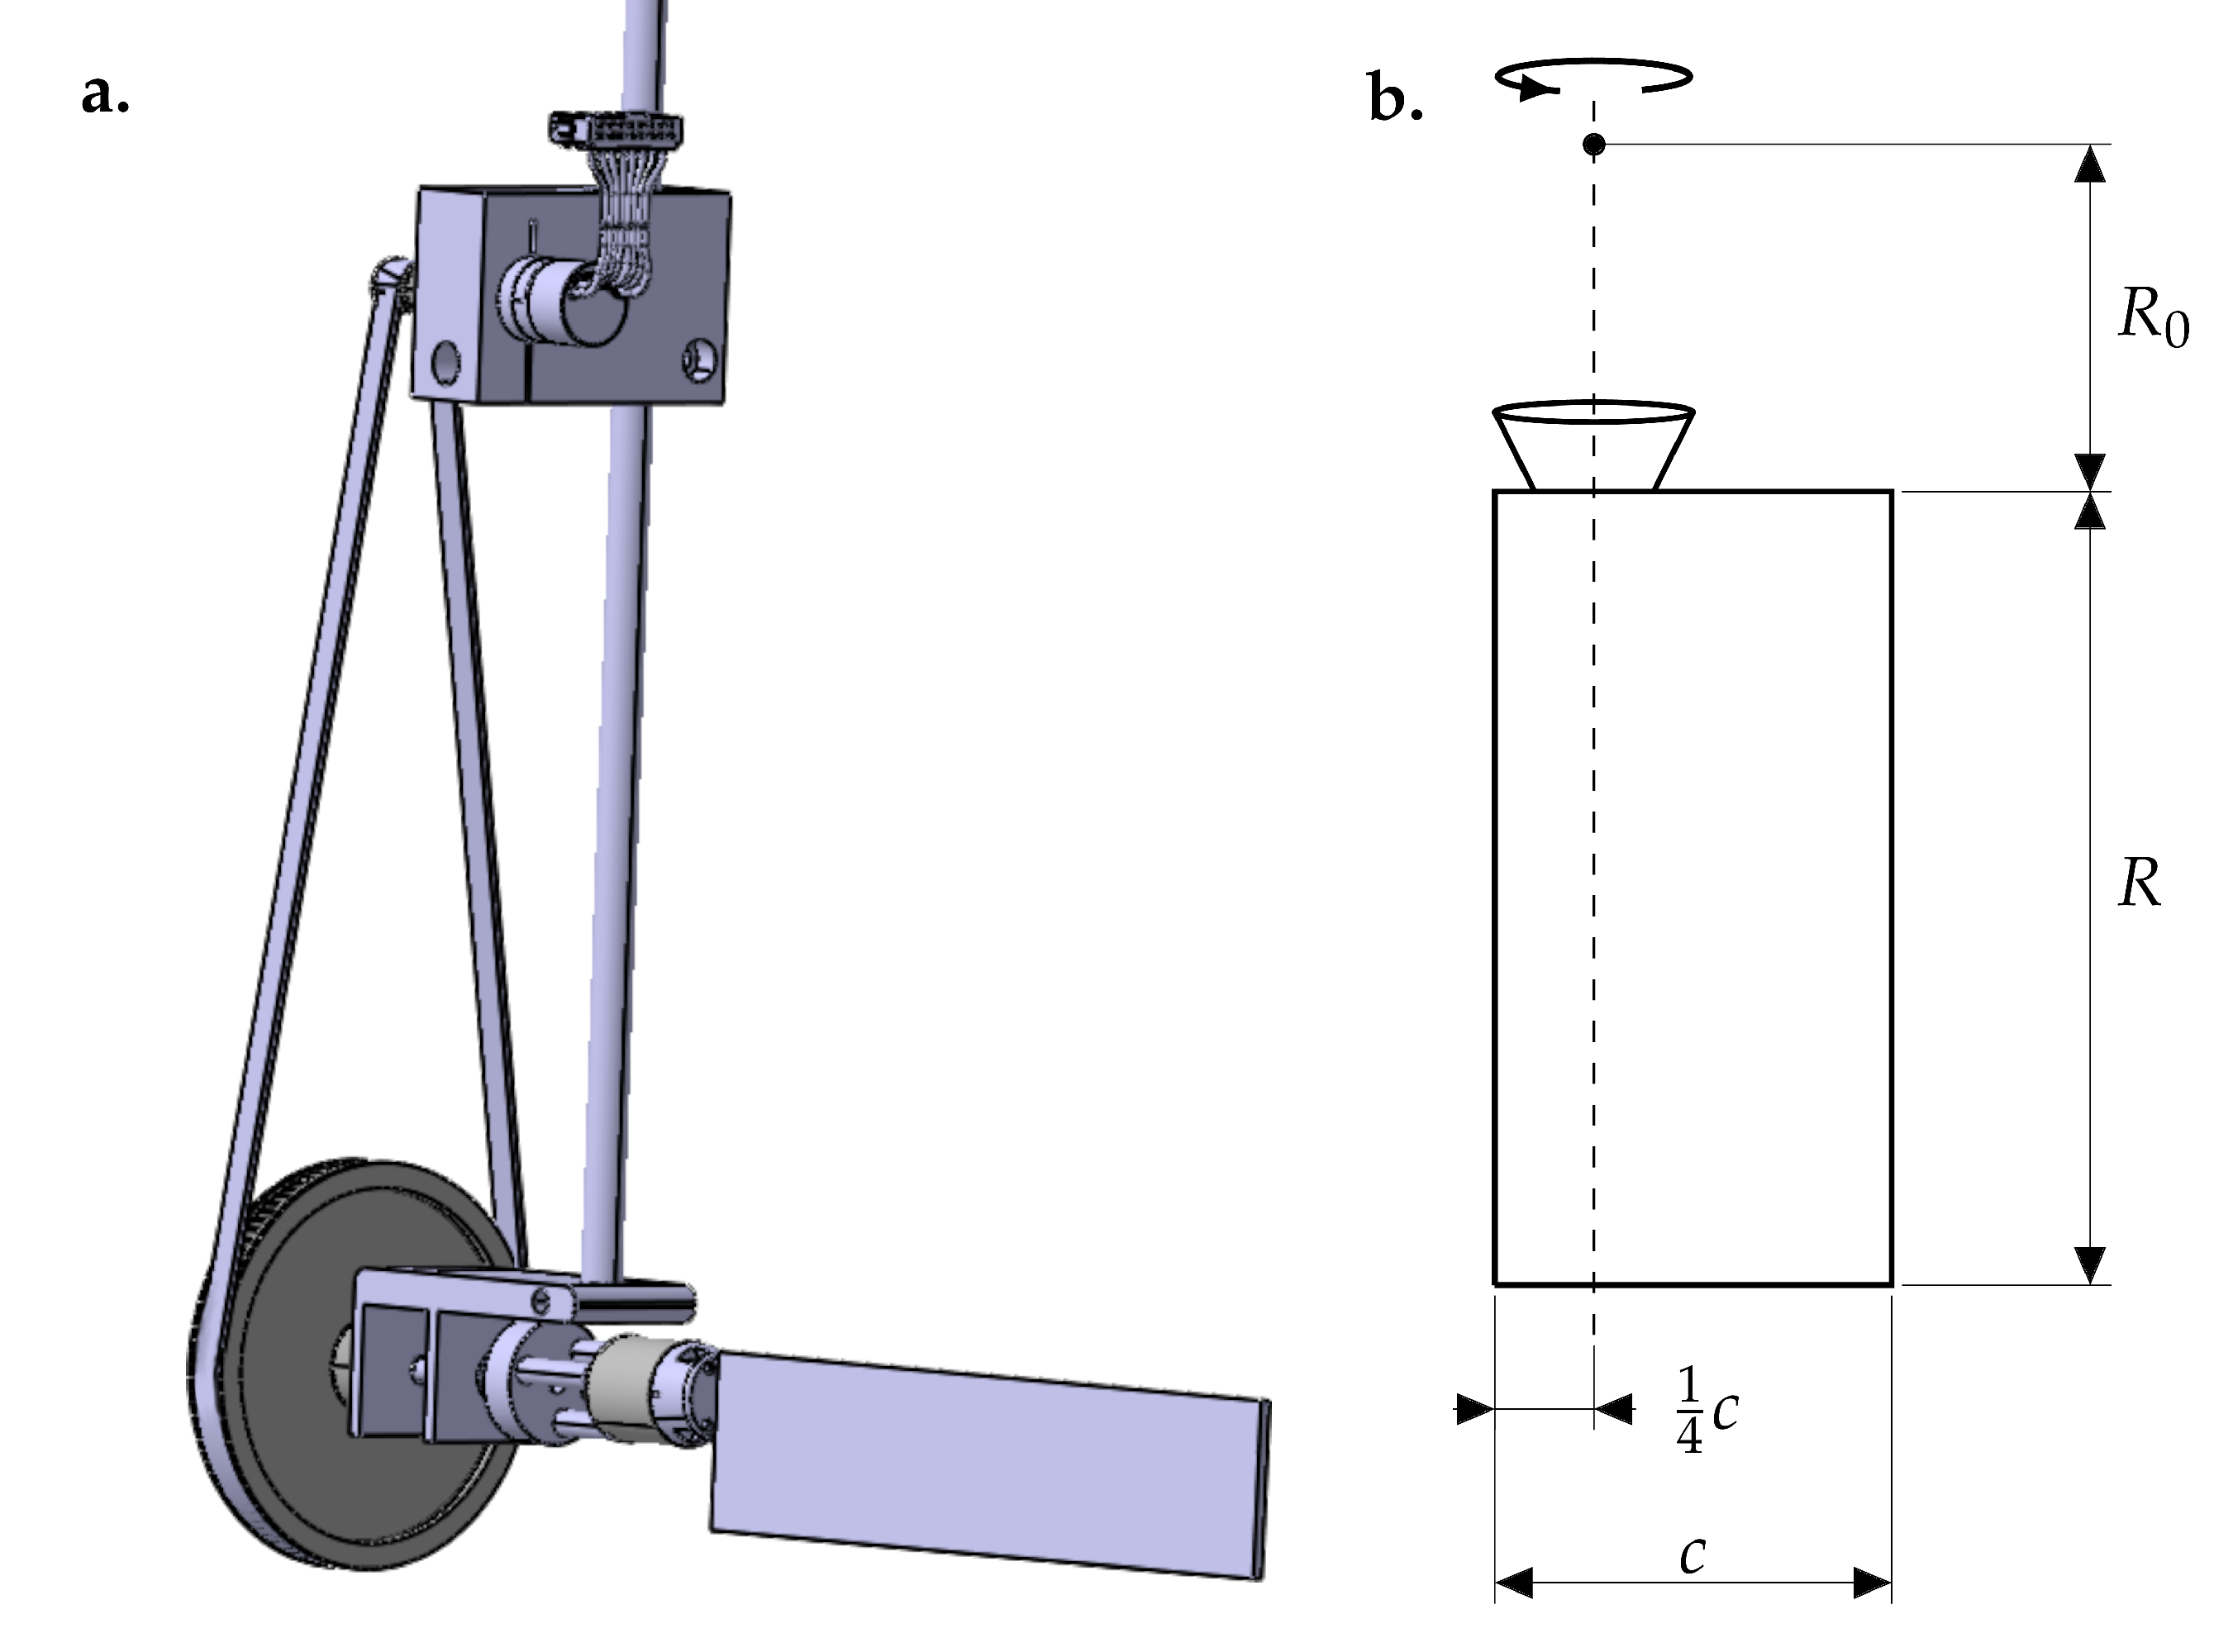
with c the wing’s chord length, the stroke amplitude and the radius of the wing’s second moment of area [29,30]. Here, is the root-cut out, which is the distance between the stroke axis and the root of the wing as indicated in Figure 2. The reduced frequency quantifies the unsteadiness of the flow by comparing the spatial wavelength of the flow disturbance to the chord length. It strongly influences the relative contributions of acceleration reaction versus circulatory forces.
The Reynolds number is defined by:
with the kinematic viscosity of the fluid and the stroke average velocity at the second moment of area.
The model wing shown in Figure 2 is similar to the one used by Krishna et al. [31]. The associated Reynolds number and reduced frequency are in the range of flying insects of the size of bees (Table 1).
The stroke motion of many birds and insects in hovering flight closely resembles a harmonic function [19,28]. The pitching angle profile tends to be more complex and has a stronger impact on the aerodynamic performance. This makes the pitching angle a promising target for optimization. A genetic algorithm will be used to optimize a parameterized pitching angle function in an experimental environment. By analyzing pitching angle profiles exercised by several different species of flying insects [19,28,33], a function is proposed that can mimic various existing pitching angle profiles including non-linear and non-harmonic motions.
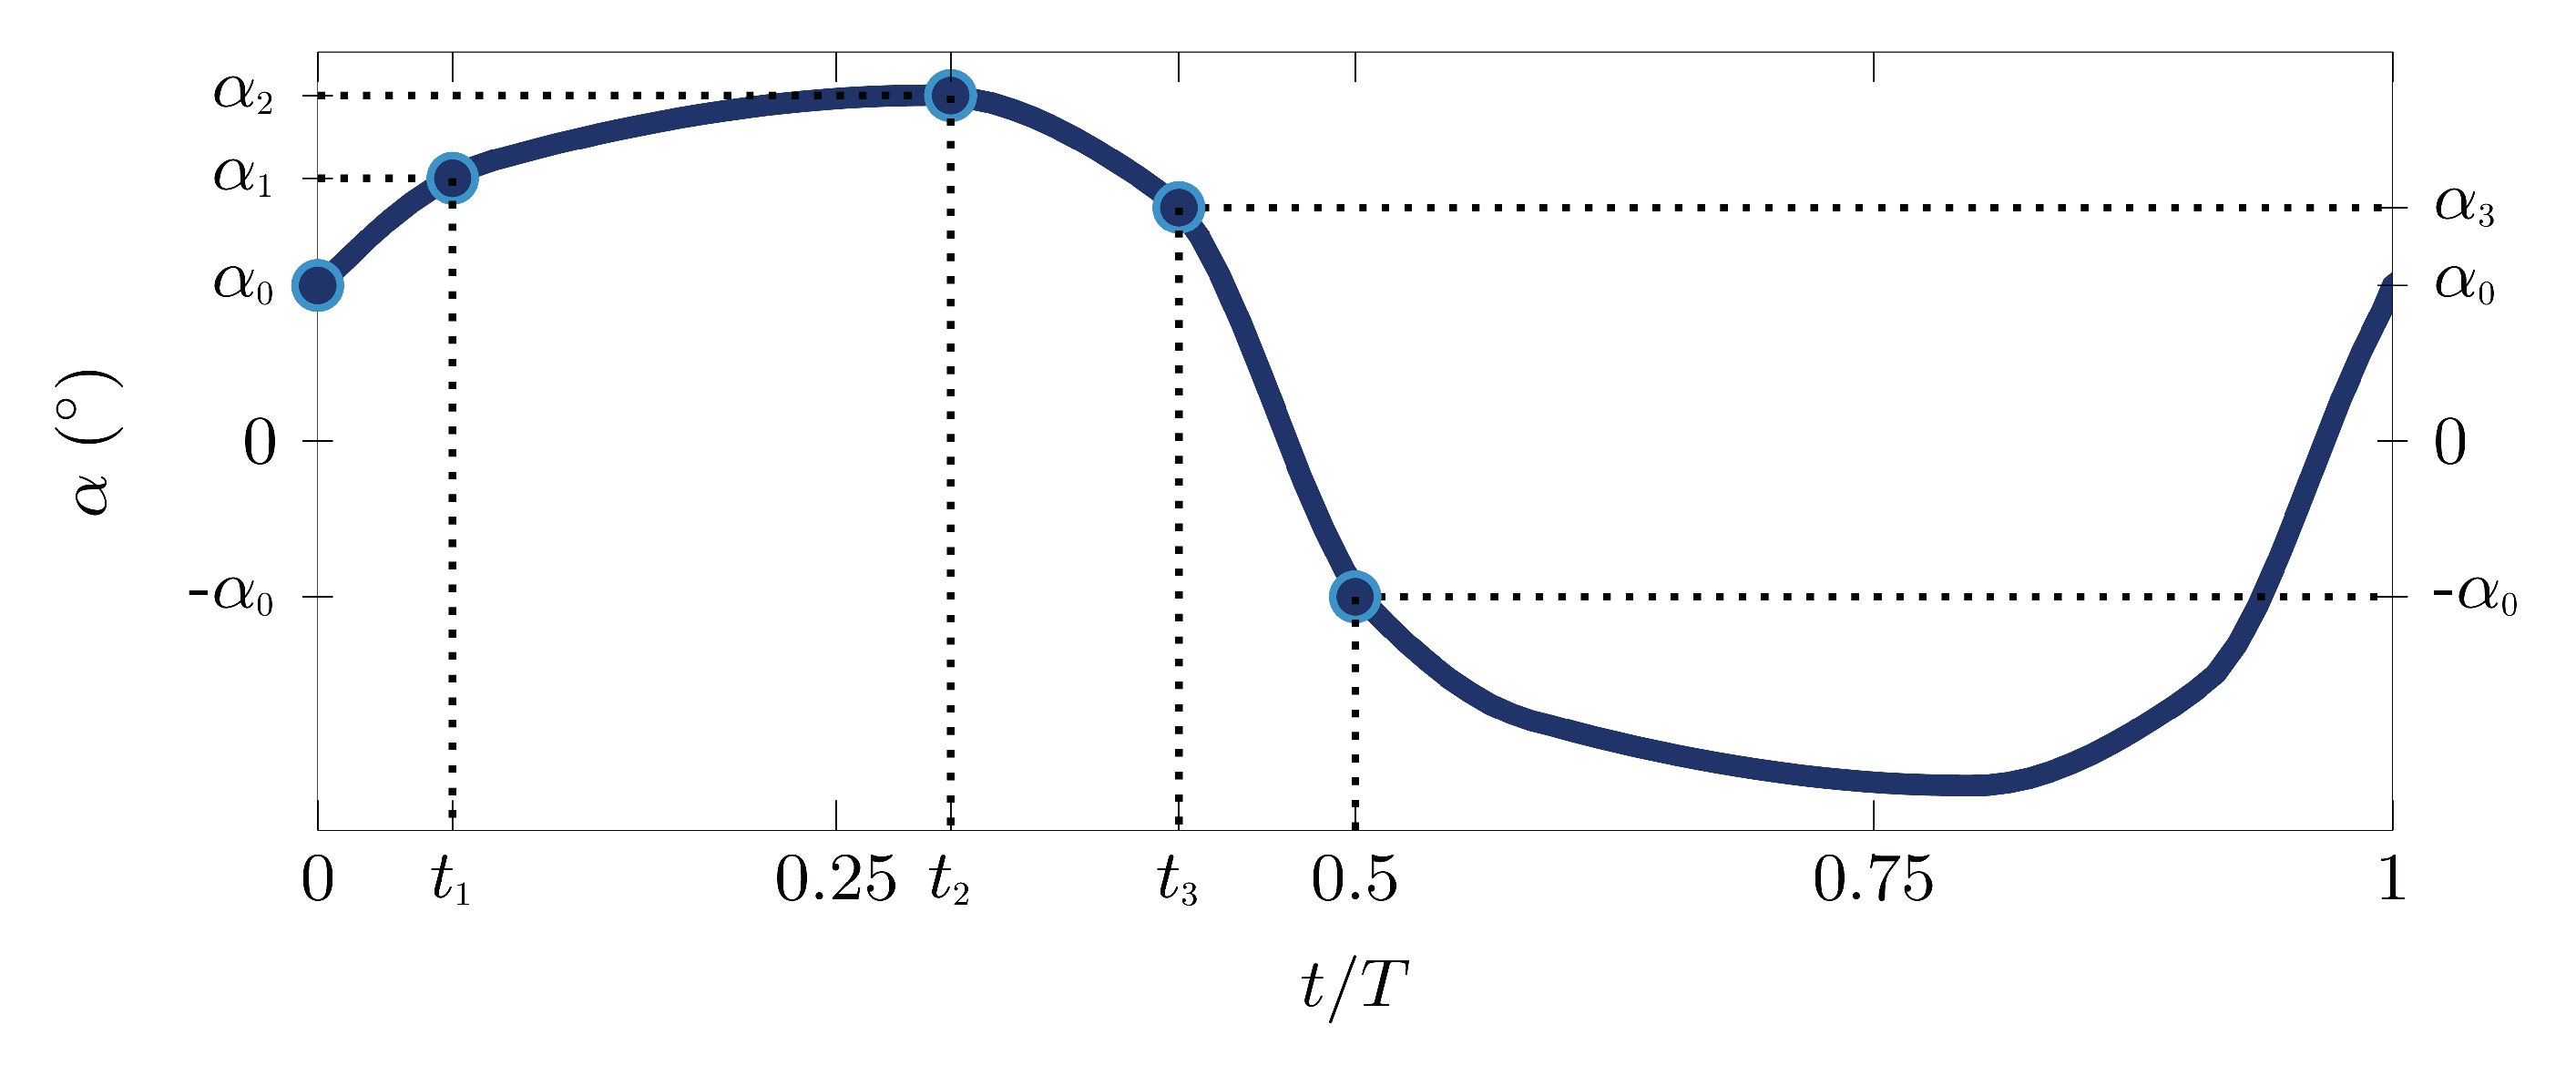
The parameterized pitching angle function displayed in Figure 3 has four control points characterizing one half stroke, amounting to a total of seven degrees of freedom. The pitching angle at the start and end of the half stroke is defined by and , respectively. Three additional control points are added at times with angles . All control points are connected through monotonic cubic interpolation, with periodicity and symmetry constraints. This procedure leads to complex non-linear and non-harmonic pitching motions.
2.2. Experimental Setup
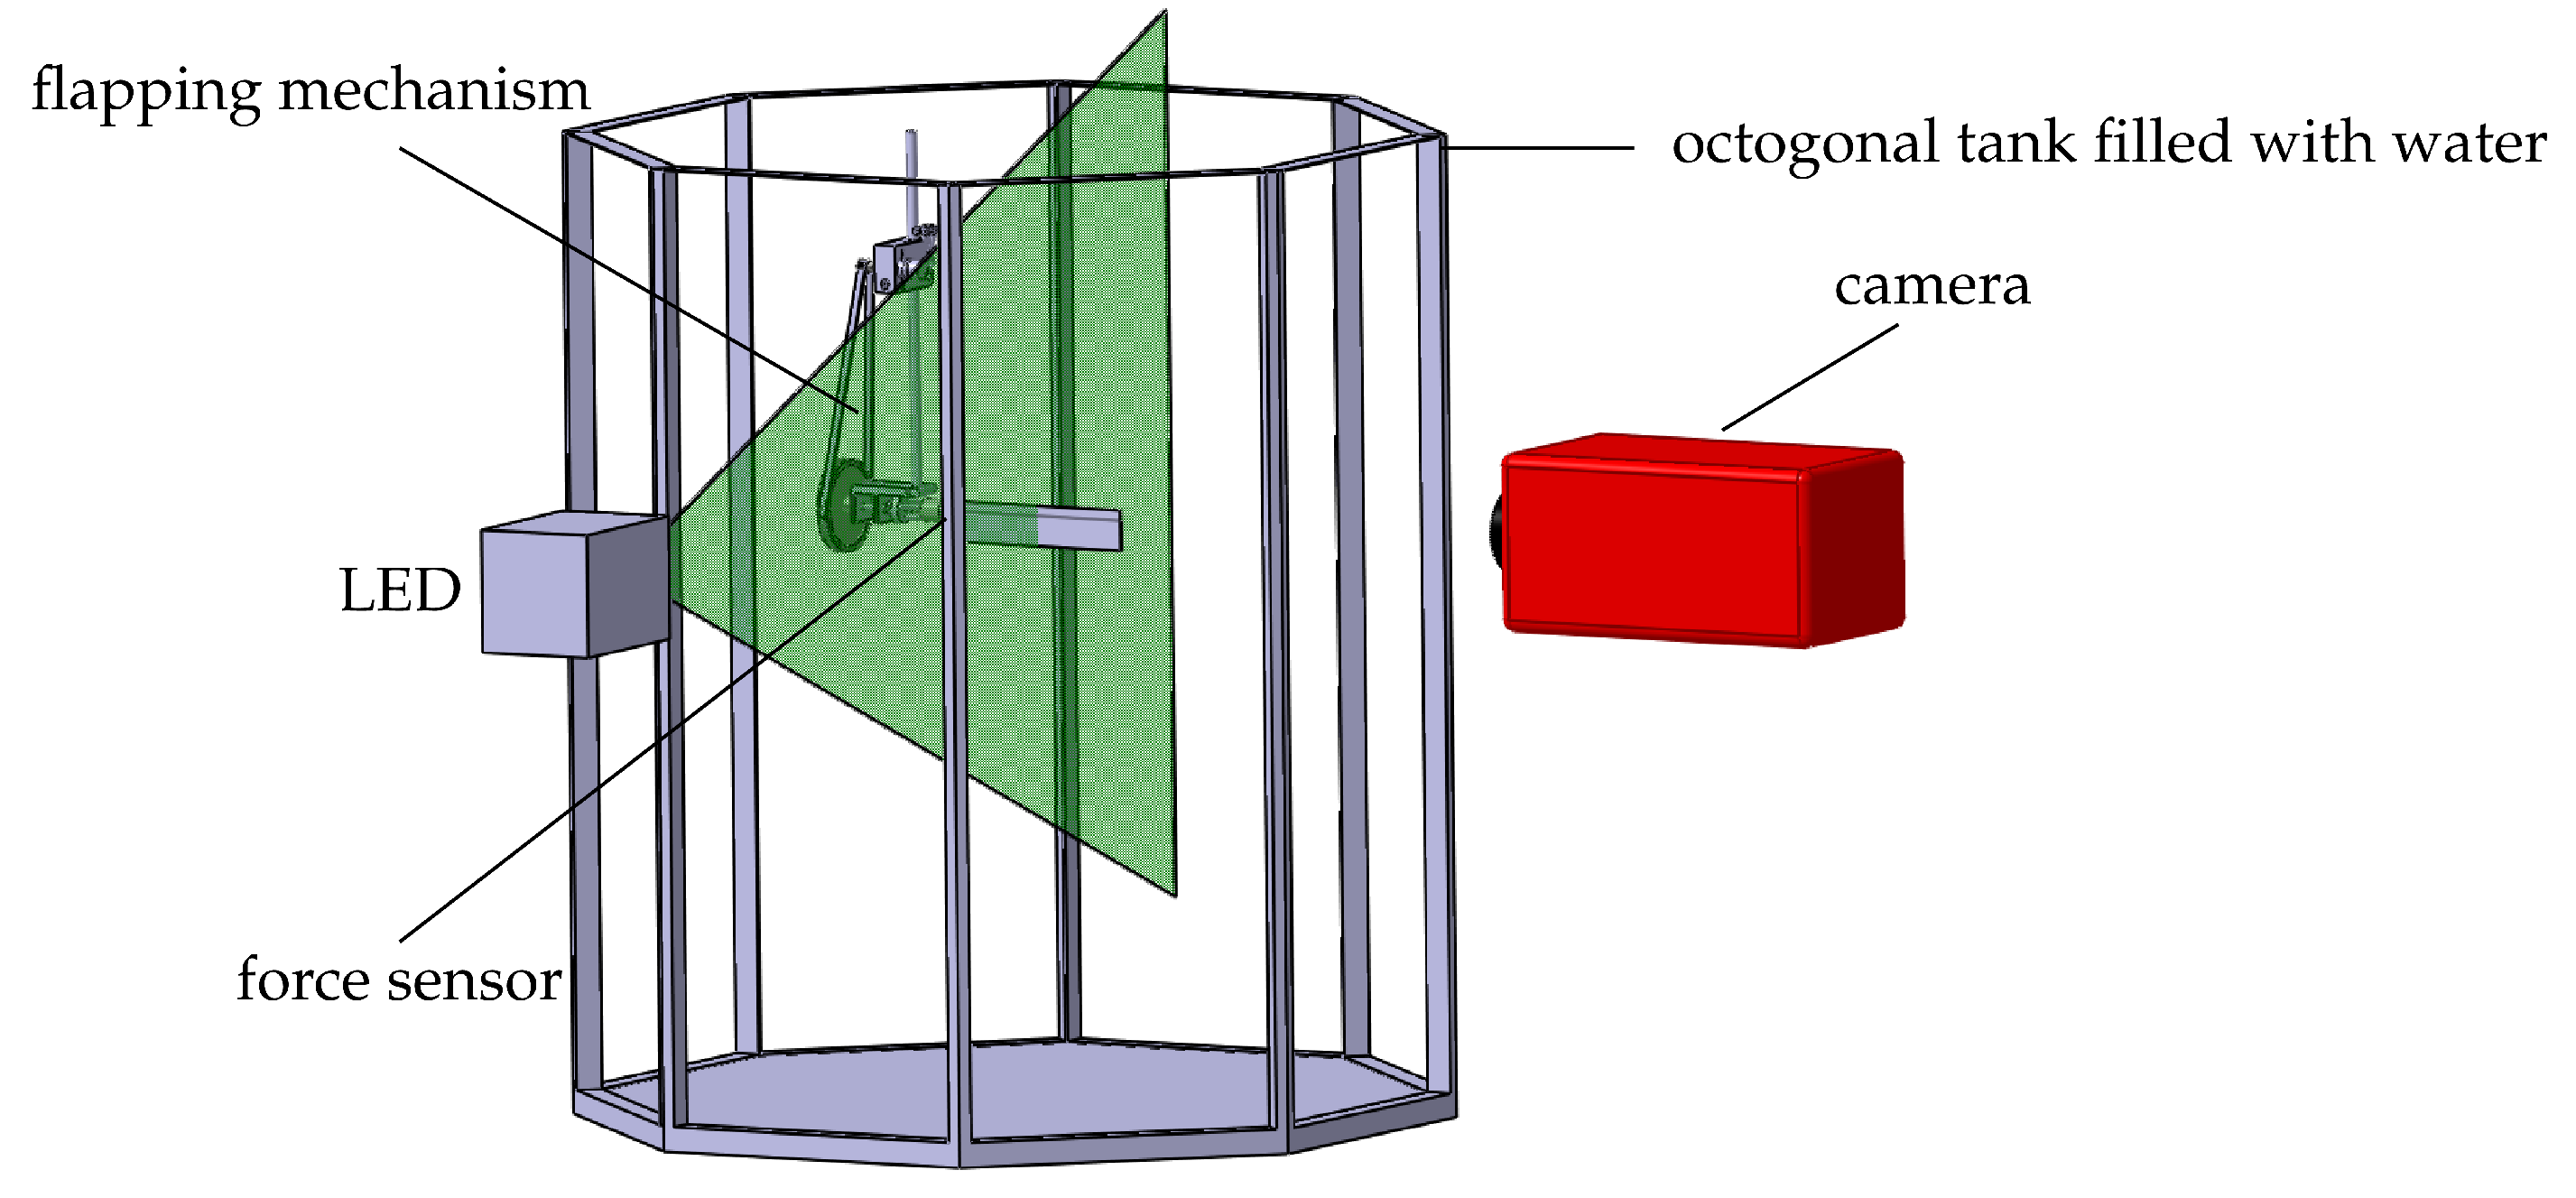
A schematic of the experimental setup is presented in Figure 4. The stroke motion is performed by a Maxon motor EC40 ( 120 , 100 torque, Sachseln, Switzerland) and the pitching motion by a Maxon motor EC22 ( 100 , 49 torque). The motors are controlled via a Galil DMC-40 motion controller (Galil Motion Control, Rocklin, CA, USA). Forces are recorded at the wing root by a six-axis Nano17 IP68 force-torque transducer with a resolution of for force and for torque measurements. The recording is performed at a sampling frequency of 1000 with a National Instruments data acquisition card.
The flapping mechanism is immersed in an octagonal tank filled with water and an outer diameter of . A 4 -thick light-sheet is generated by a high-power light-emitting diode (LED) (LED Pulsed System, ILA_5150 GmbH, Aachen, Germany) and a cylindrical lens [34]. A field of view is recorded by a pco pixelfly camera ( px resolution). Phase-locked particle image velocimetry (PIV) is carried out by triggering the LED and the camera synchronously to get a single image pair for a selected stroke angle. By rotating the initial stroke position relative to the light-sheet, the wing gets captured at different phase angles. A total of 24 flapping cycles are captured and averaged for 13 different stroke angles. The raw images are processed with a multi-grid algorithm and a final interrogation window size of px with an overlap of 50%. This leads to a physical resolution of 1 or c.
To better understand the lift-enhancing and power-reducing unsteady flow effects, a series of PIV images for the best individuals of the genetic algorithm optimization was taken.
2.3. Optimization
To quantify the performance of the pitching angle evolution, force and power coefficients are computed from the force and torque measurements. The lift, drag and power coefficients are given by:
In the present coordinate system, the drag is negative during the upstroke and positive during the downstroke. The aerodynamic power P is the sum of the pitching power and the stroke power . The pitching power is calculated as , with the pitching torque measured by the load cell and the pitch angular velocity. The stroke power is estimated by , with the torque induced by the measured drag and the stroke angular velocity. To calculate the drag-induced torque we estimated the radial location where the drag acts such that . By assuming a span-wise uniform distribution of the drag, we obtain . For the presented experiments, the stroke power accounts for approximately 90% of the total aerodynamic power. The wing inertia for the pitch and the stroke motions is estimated to account for less than 1% of the aerodynamic power and has not been subtracted in the presented results. The hovering efficiency can be expressed as the ratio between the stroke average lift coefficient and the stroke average power coefficient :
This simple expression of efficiency gives us a measure for the lift to effort ratio. More complex definitions consider the dimensionless aerodynamic power to support a unit weight to define a hovering efficiency [35]. The use of a more complex efficiency expression would require the weight of the flying insect or vehicle to be specified.
A genetic algorithm-based optimization of the pitching kinematics using experimental data is implemented using the MATLAB Global Optimization Toolbox (The MathWorks, Inc., Natick, MA, USA) [36]. The two objectives considered for the optimization of the parameterized pitching angle evolution are presented in Figure 3. The first objective is to maximize the hovering efficiency of the flapping system, while the second objective is to achieve the highest stroke average lift coefficient .
The seven parameters are bounded by the values listed in Table 2. These bounds are chosen to cover a broad range of insect wing kinematics [28]. The fitness function evaluation is conducted over 4 consecutive flapping cycles. Genetic algorithms are based on the mechanics of natural selection and start by selecting the best potential solutions or individuals among a randomly-generated selection or population according to their fitness value. The populations in this paper are composed of 70 individuals, each being a vector of the 7 design function parameters. The initial population is created through a random uniform distribution constrained by the lower and upper bounds indicated in Table 2. At the end of a generation, each individual is ranked according to its performance and receives a score based on the inverse square root of its rank. The best individuals are randomly mutated and recombined with other fit individuals to create a new generation of offspring. This new generation includes: individuals that are clones of the previous generation’s elite (5%), individuals that are a crossover of two parents (60%) and mutated individuals from the previous generation (35%). The crossover process is guided by the following rule: , with a random number between 0 and 1. After calculating the fitness of the offspring generation, the best individuals of the new and the previous generation are kept, and the process of mutation and recombination is repeated until a termination condition has been reached. Convergence of the optimization process was achieved respectively in 21 and 28 generations for the lift and efficiency evolution, which were conducted in a total of 24 h of experimental runs. The genetic algorithm was terminated once the average fitness over the last 10 generations did not improve by more than 5%.
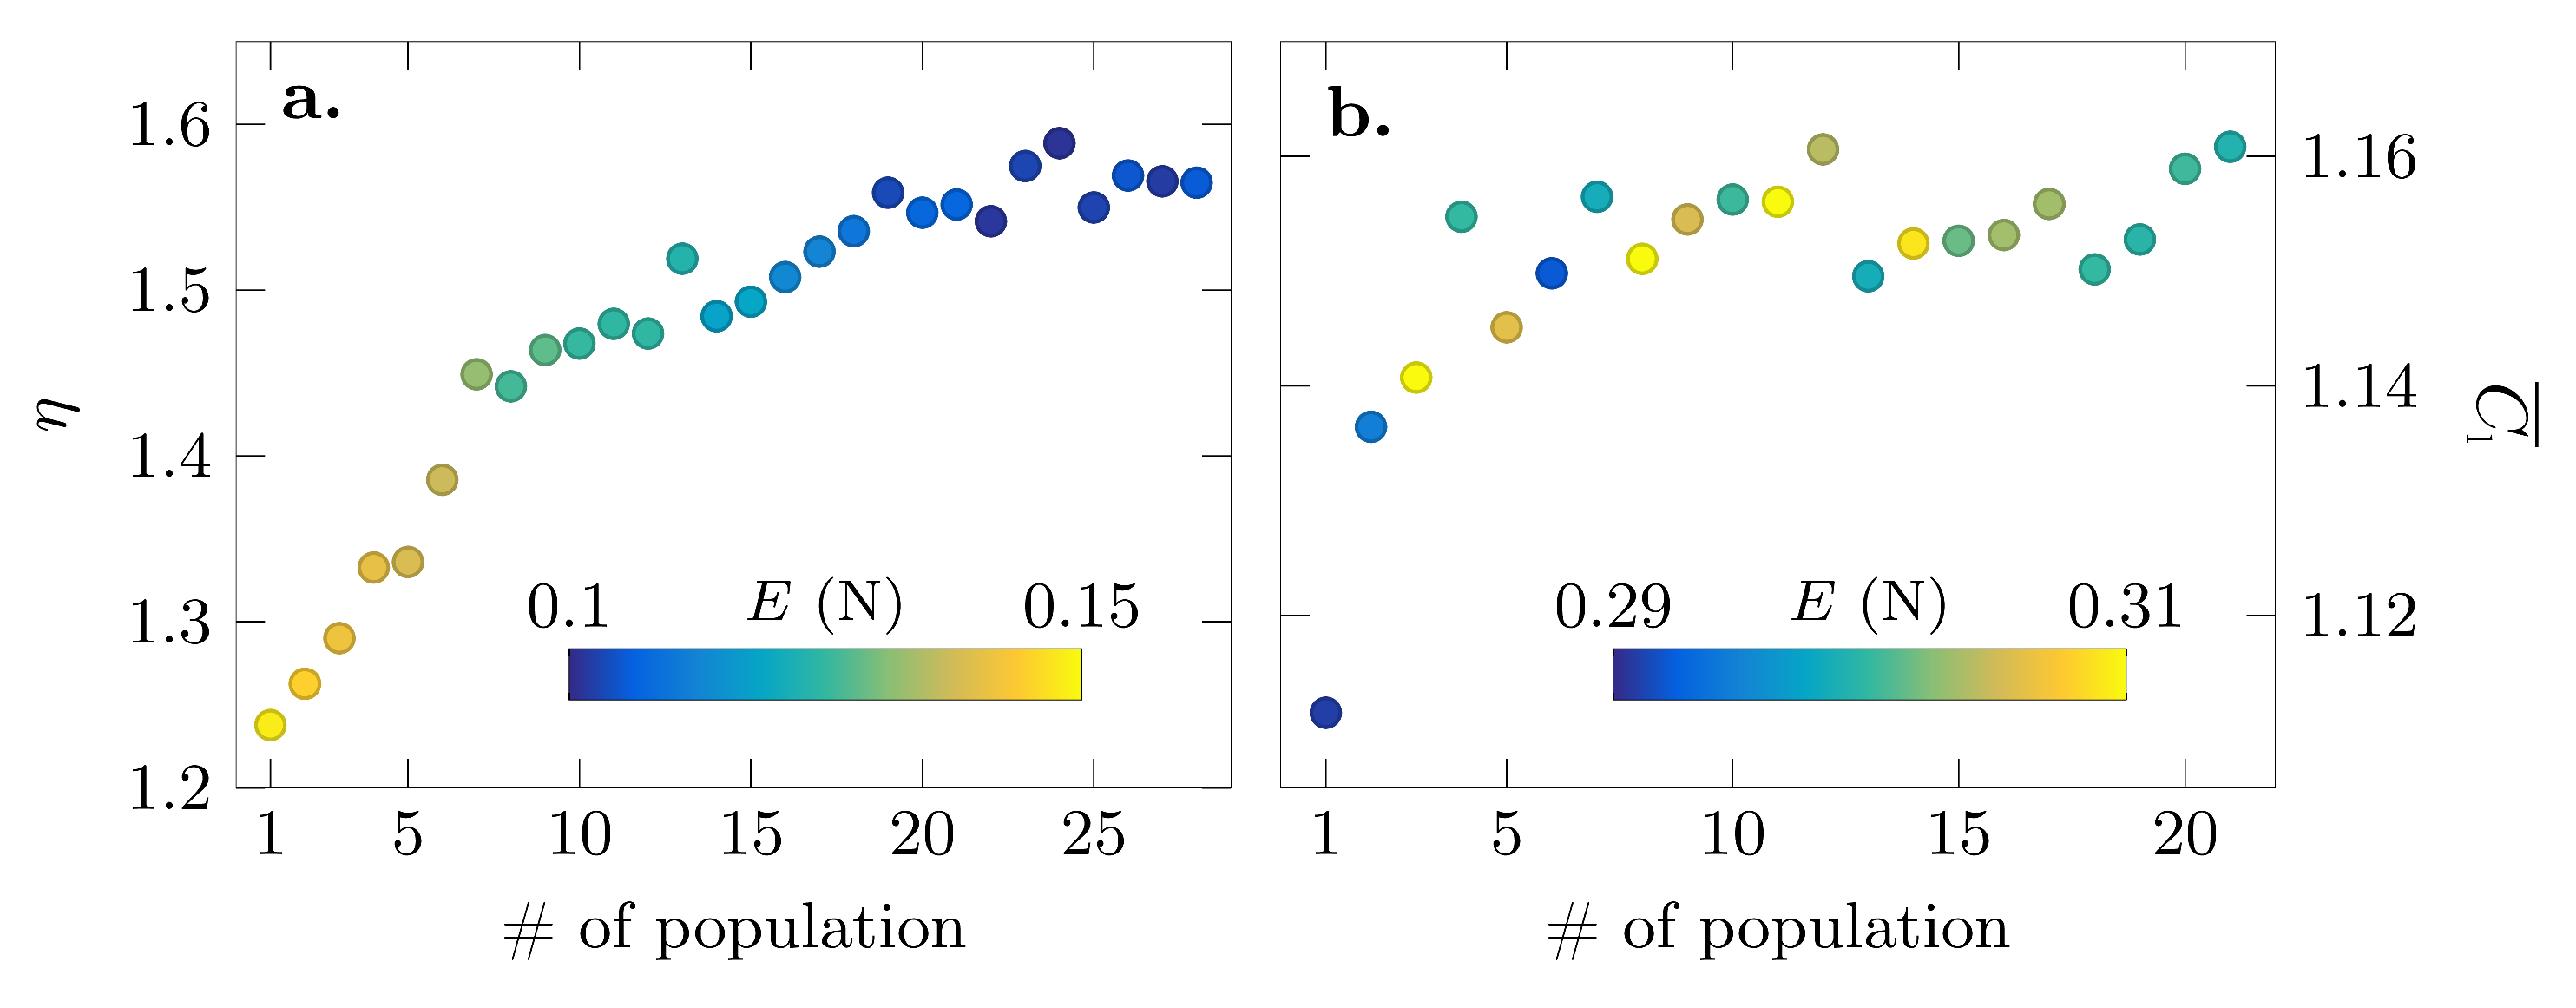
The convergence towards the most efficient lift production and highest lift production is presented in Figure 5. The initial efficiency started at a value of and improved continuously until it reached a plateau after approximately 20 generations. In later generations, there were some fluctuations around the asymptotic value of ; however, no additional improvement was achieved, and the optimization was terminated after 27 generations.
The lift optimization converged even faster, and the difference between the initial and the final value of the stroke average lift was barely 0.03. The values of fluctuated between 1.15 and 1.16 after approximately 10 generations, and the optimization was terminated after 21 generations.
3. Results and Discussion
The pitching kinematics for a flapping wing with a sinusoidally-varying stroke velocity were optimized by combining experimental measurements of the aerodynamic forces and a genetic algorithm. Two different objective functions were considered. The first objective was maximum stroke average efficiency, and the second objective was maximum stroke average lift.
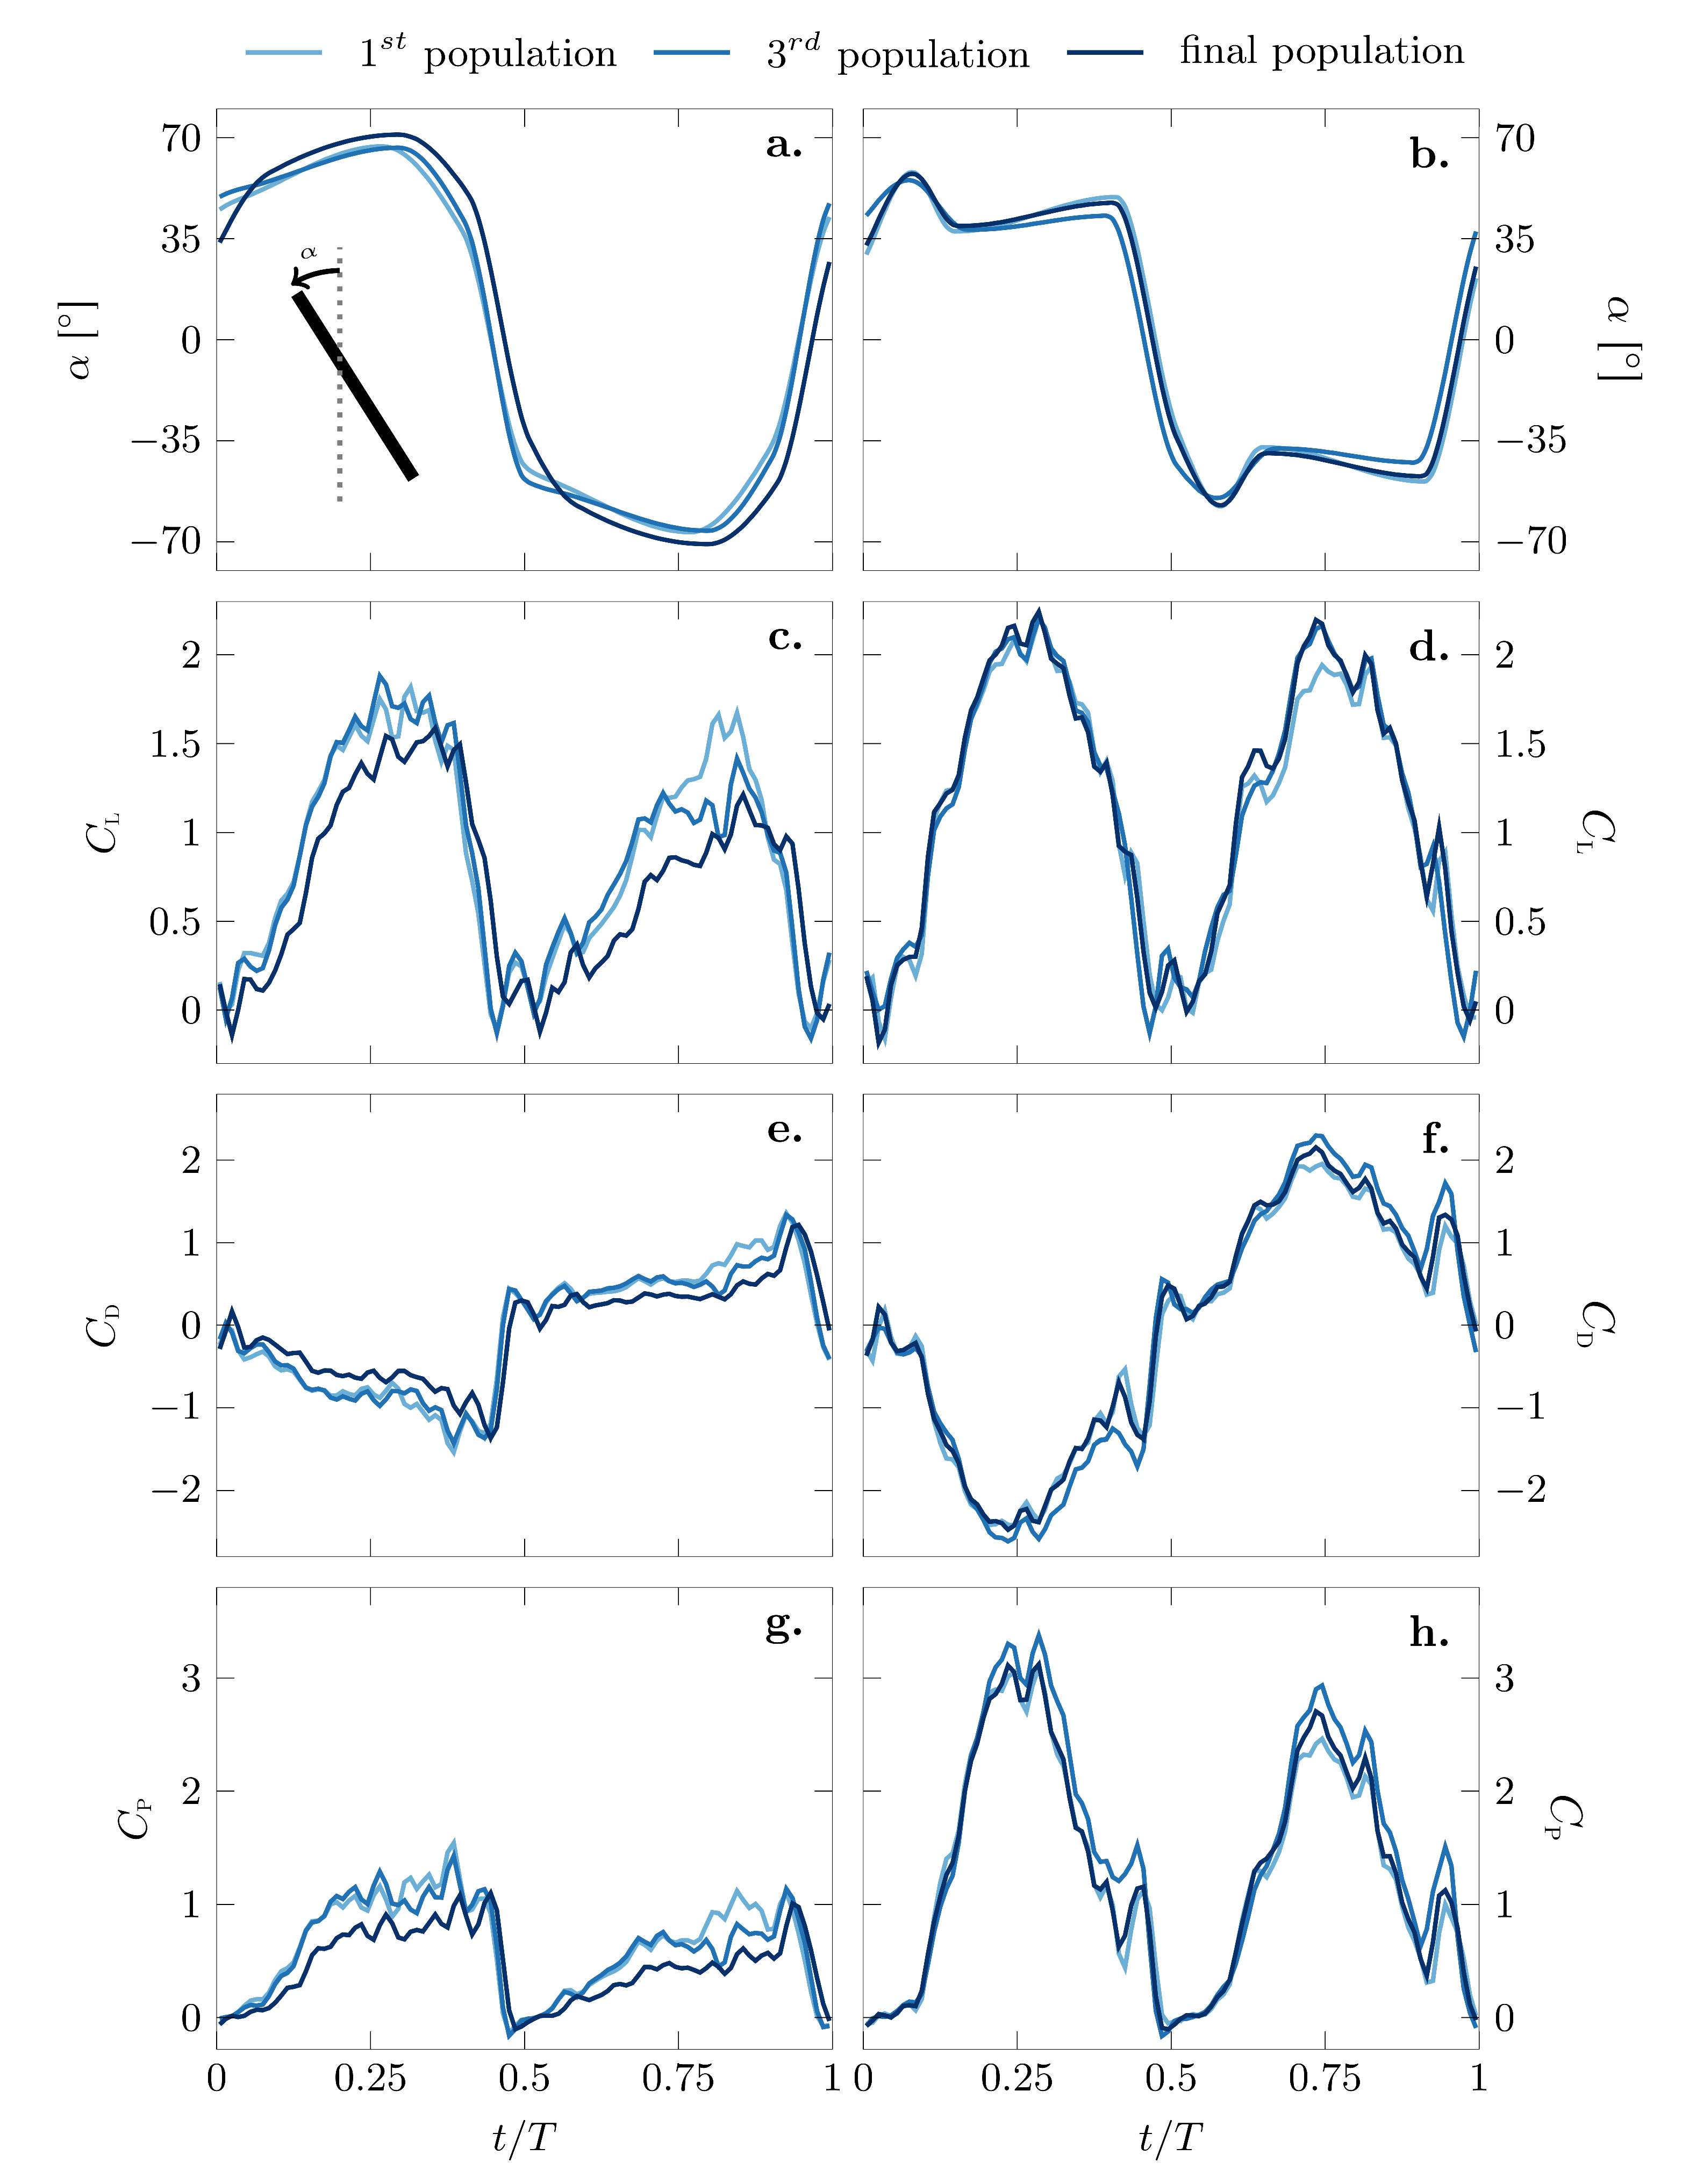
The optimal pitching kinematics of the best individuals of the first, the third and the final generation for both objectives are presented in Figure 6a,b, and the parameters describing the motions according to Figure 3 are listed in Table 3. The angle is the geometric angle between the wing chord and the vertical axis. During the first half period or half stroke, the wing was considered to move from left to right such that positive values of for indicate a positive effective angle of attack between the wing and the flow velocity relative to the wing. The effective angle of attack during the first half stroke is given by .
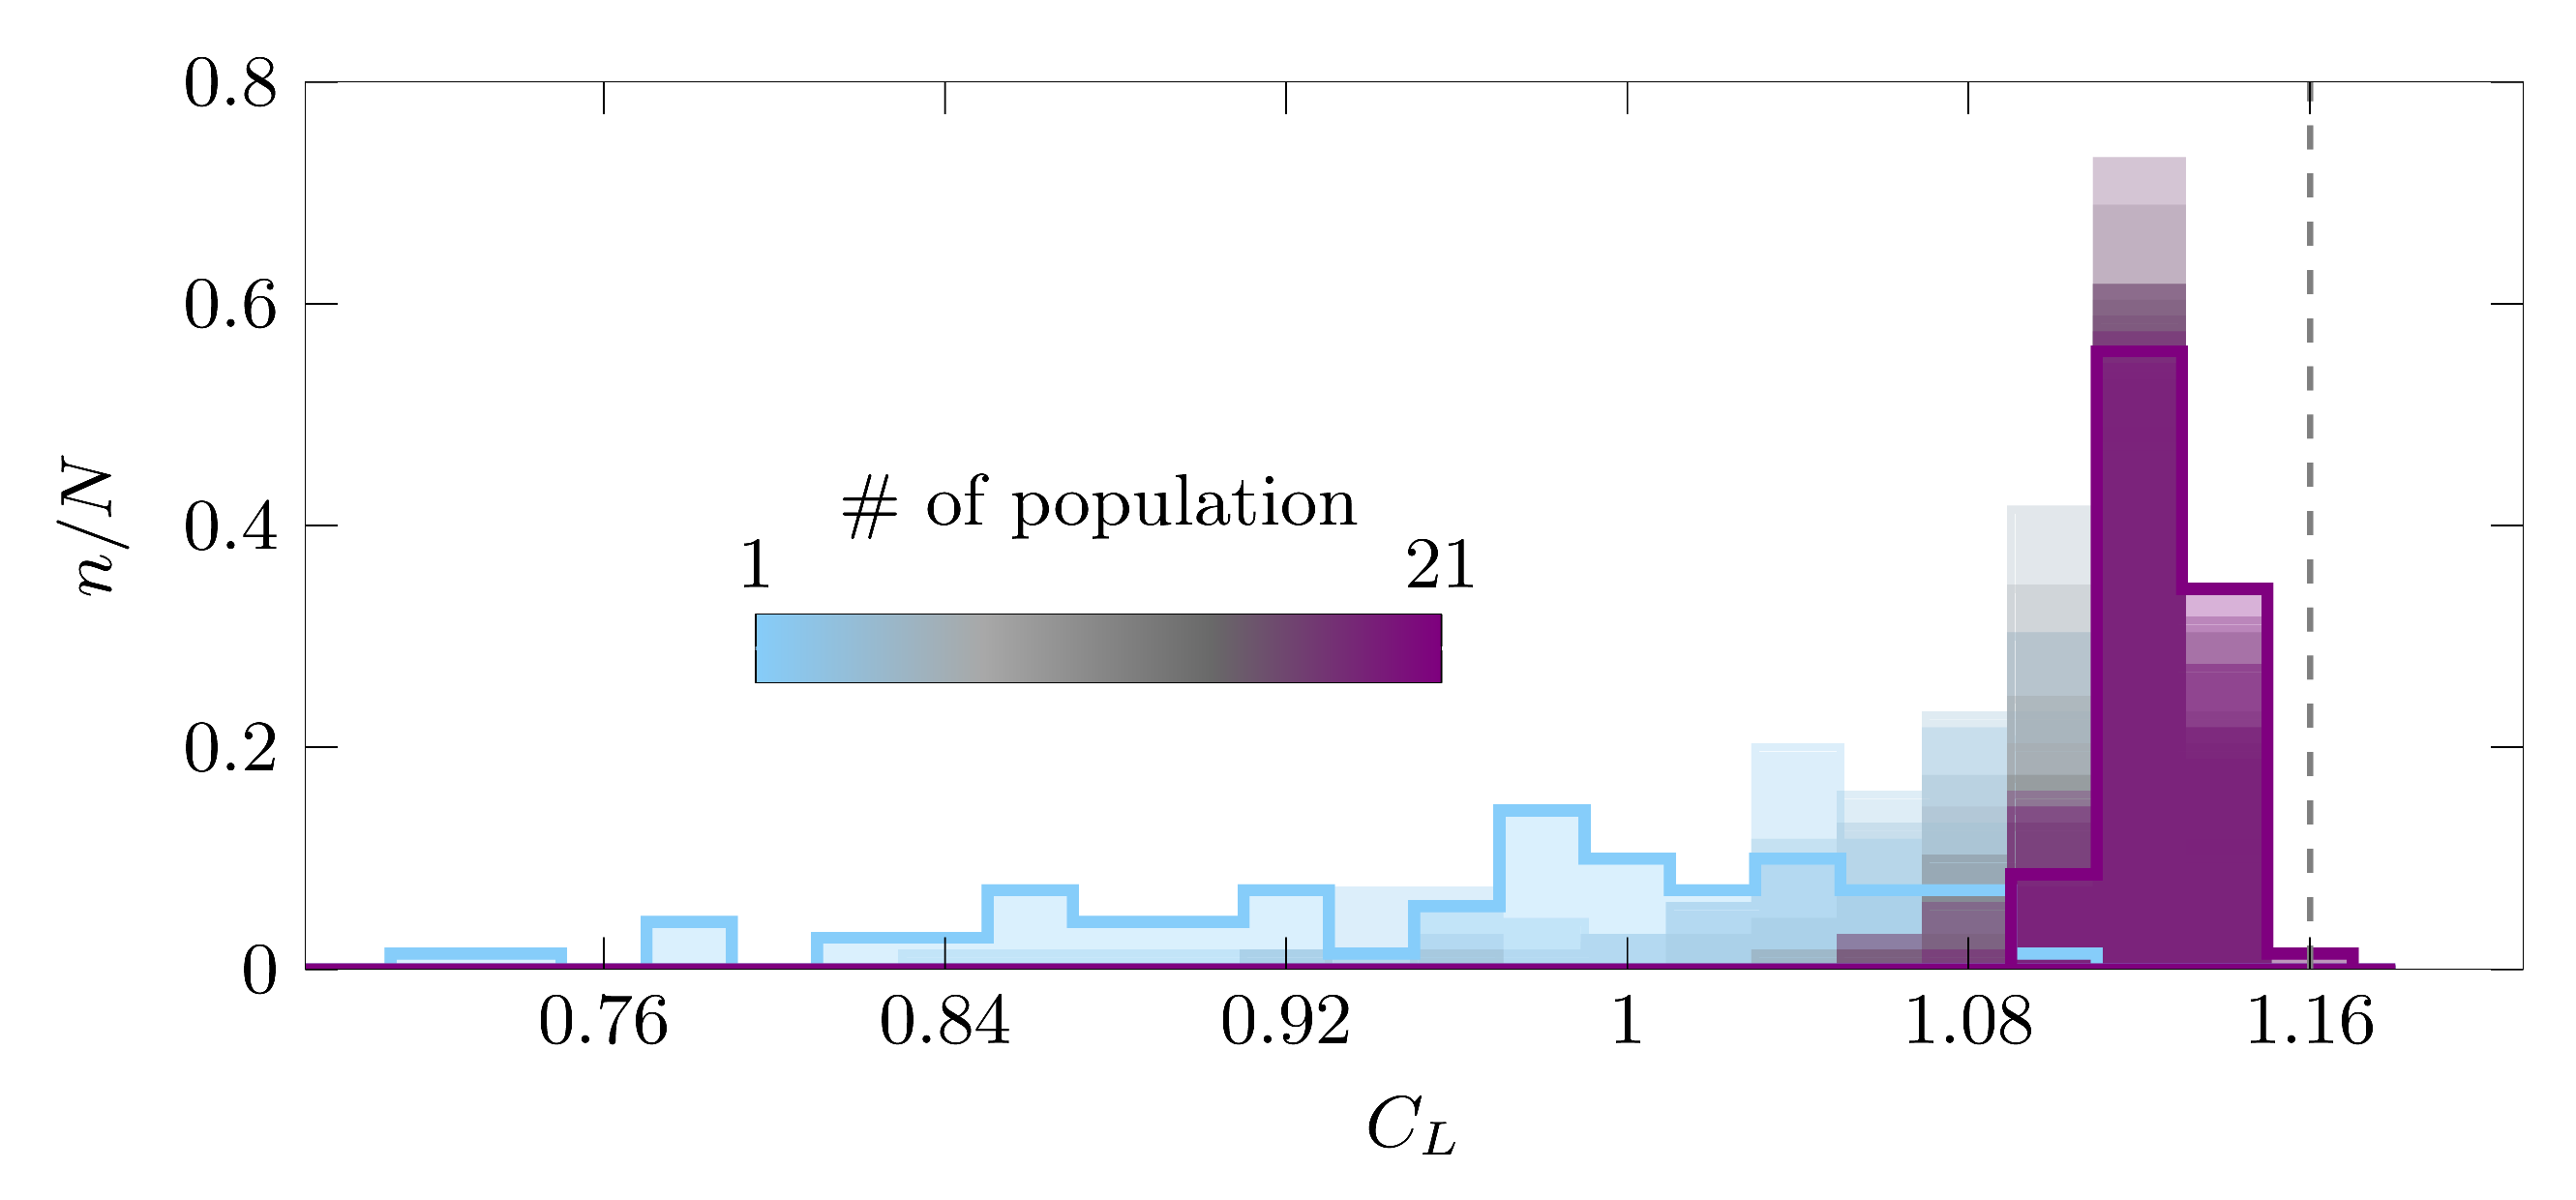
The optimization algorithm was terminated after 28 generations for the most efficient kinematics and after 21 generations for the highest lift kinematics. Surprisingly, the kinematics of the best individual of the initial random population were already very close to the final optimal solution for both optimization objectives. The distribution of the phase average lift coefficient values for all 21 populations of the maximal lift optimization scenario is presented in Figure 7 where the colors indicate the number of the population. The values of ranged from 0.72–1.11 for the initial population and from 1.10–1.16 for the final population. The optimization potential for by modifying the pitching motion for a given sinusoidal stroke motion was limited by the fact that the stroke motion dominated the inflow velocity encountered by the wing and the lift generation. Nevertheless, the evolution of the distribution of the fitness values over the successive generations presented in Figure 7 suggests an initially unbiased exploration of the solution space and demonstrates a rapid and successful convergence of the optimization algorithm.
The two optimization objectives considered yielded different final solutions for optimal kinematics. The most efficient pitching motion (Figure 6a) was smoother and closer to a sinusoidal pitching motion, whereas the highest lift generating pitching motion (Figure 6b) had sharper edges and was closer to a trapezoidal motion. The most efficient pitch angle profile closely resembled the crane fly kinematics observed by Ishihara et al. [37] in their experimental and three-dimensional computational study on the aerodynamic contribution to passive pitching motions. Recent results of a numerical-based optimization from Lee and Lua [27] showed similar kinematics for a hawk moth in hovering flight. The lift optimized solution matched the shape of the pitch angle profiles of hovering fruit flies observed experimentally by [38], who inferred that insects rely heavily on passive mechanisms for their wing rotation. From an aeromechanics point of view, the wing hinge acts as a torsional spring that allows for a wing rotation with minimal active actuation in response to the aerodynamic and inertial forces [37,38]. Mechanical wing models that mimic the passive rotational mechanisms of insects can be designed using artificial wings with torsional compliance [39] or wing hinges equipped with damped torsional springs [40]. These passive rotational dynamics have the potential to increase the pitching efficiency even further and decrease the mechanical complexity and mass of the system [37,39].
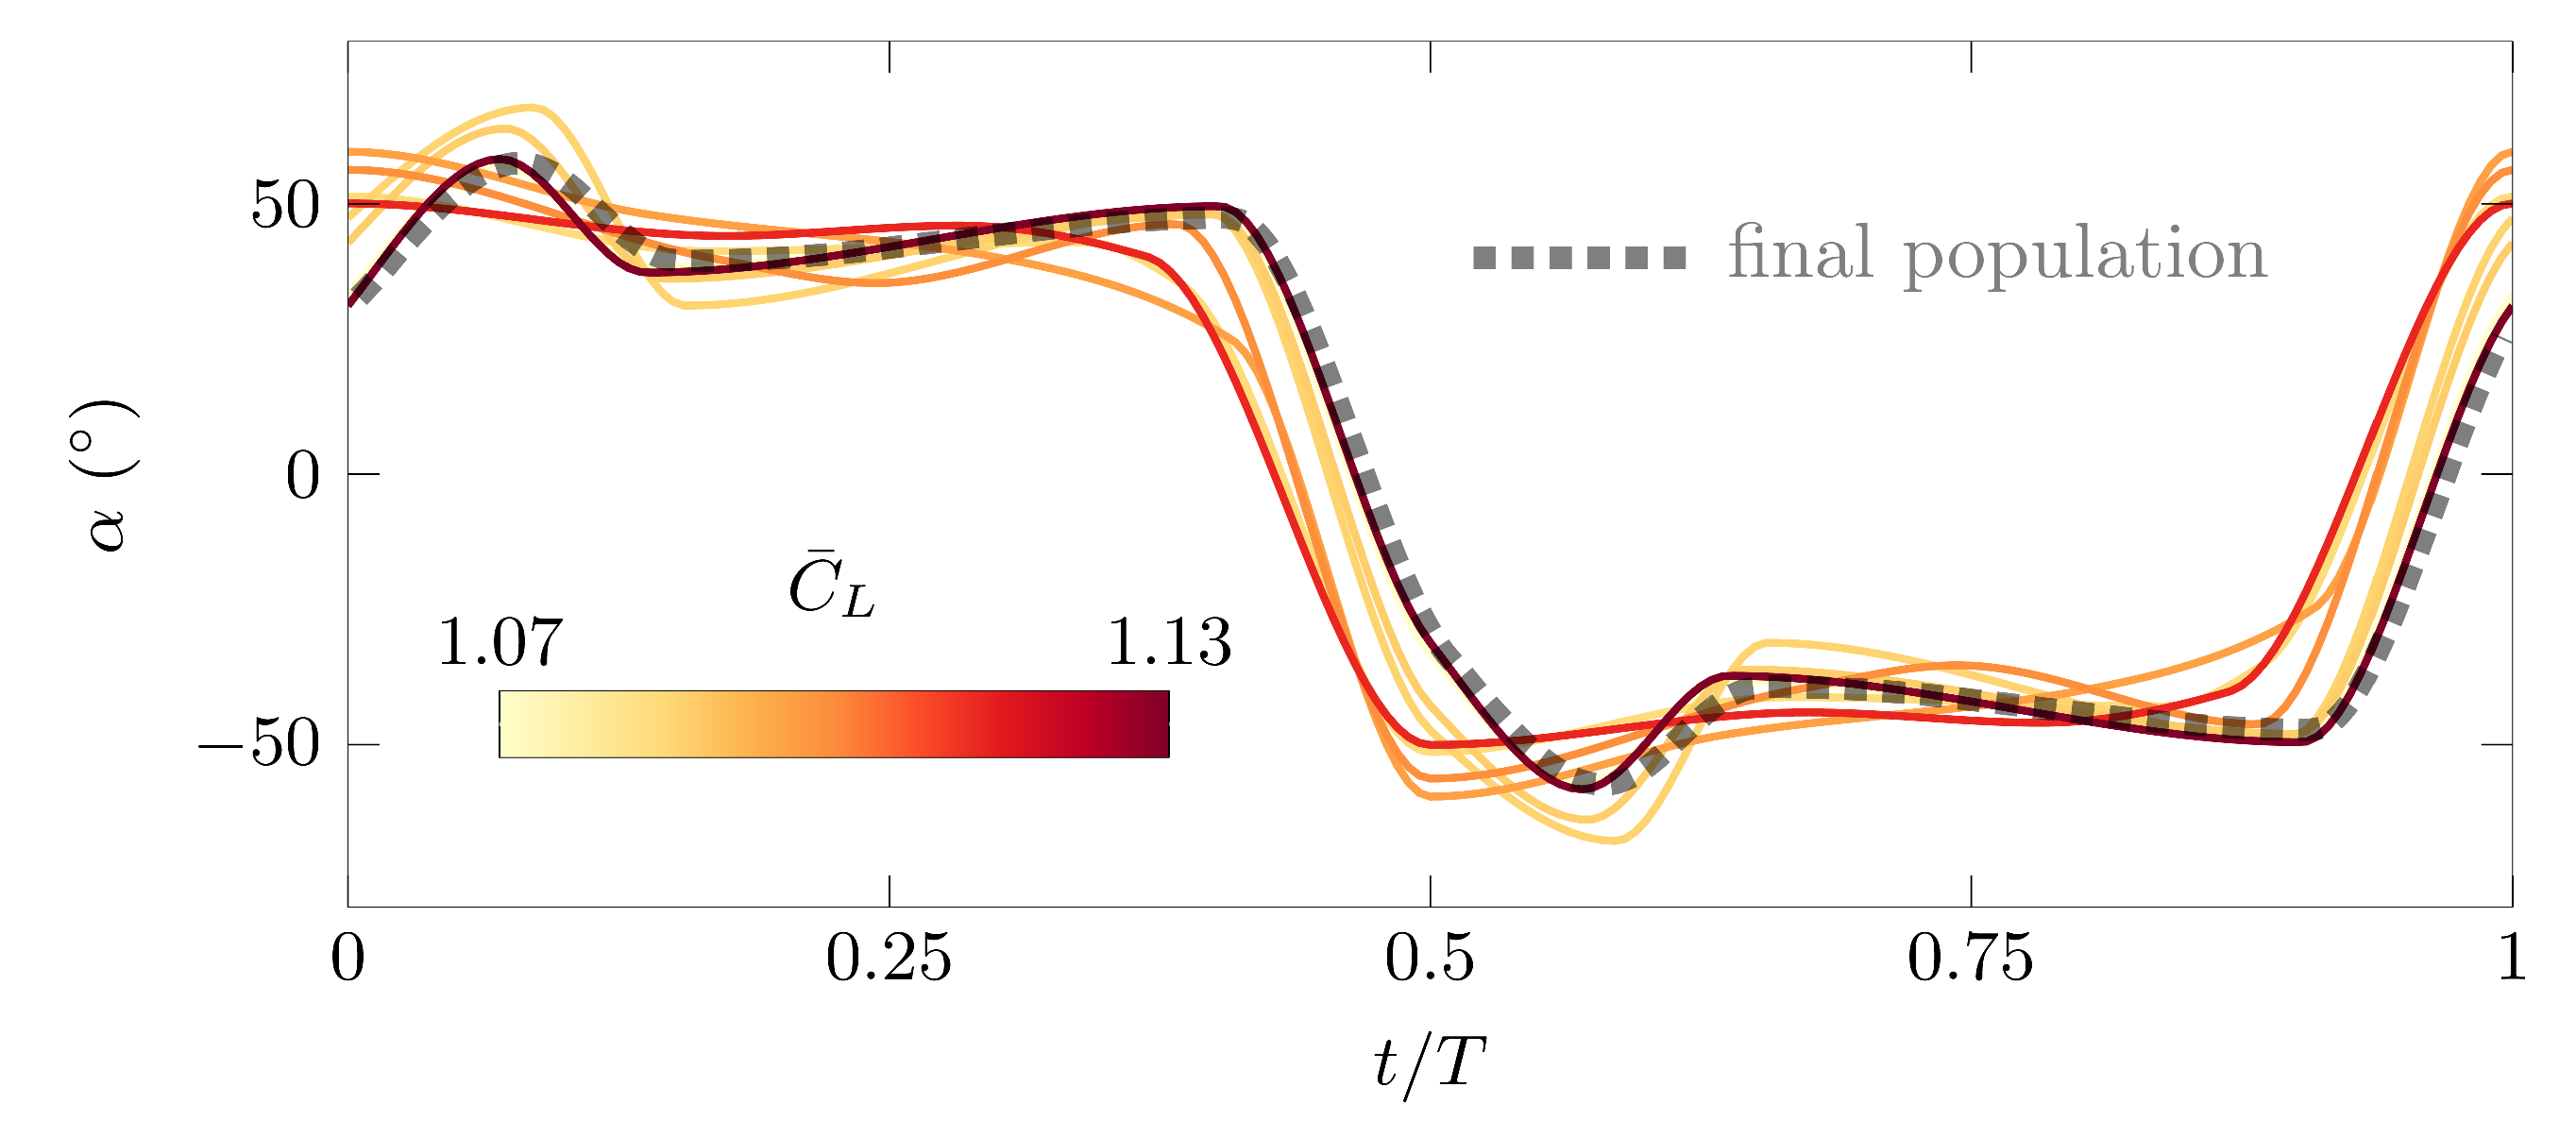
To highlight the independence of the solutions from the initial population, the best individuals from eight different initial populations for the high lift optimization objective are presented in Figure 8. The solution of the final population of the converged optimization experiment is included in Figure 8 by the dotted line. All eight solutions display a common tendency towards a trapezoidal pitch angle variation, which is the characteristic feature of the optimal high lift solution. The closer the initial solutions of resemble the final solution of the converged optimization, the higher the stroke average lift coefficient, underlining the repeatability and reliability of the obtained solution.
In both final solutions for the different optimization objectives, the rotation or pitching motion was advanced with respect to the sinusoidal stroke motion. This was observed by the positive geometric angle at the start of the stroke motion (). The rotation was advanced if the wing had completed most of its rotation at the end of each half stroke. This advanced rotation led to several lift and efficiency enhancing unsteady flow effects, which have been described previously by Lua et al. and Krishna [41,42]. When the pitching angle relative to the stroke velocity becomes negative in advanced rotation, it yields a positive effective angle of attack due to the induced velocity of wake vortices produced in the previous stroke. The effective angle of attack at the beginning of the half strokes when the wing’s stroke velocity starts to increase is more favorable in the case of advanced rotation than in the case of a symmetric pitching motion, where the wing is vertical at stroke reversal. In general, advanced rotational motions induce stronger leading edge vortices, which are directly linked to a higher force production [41,43,44,45]. The genetic algorithm found optimal solutions with advanced rotation as of the first generation, and the timing of the rotation with respect to the stroke motion varied only slightly from the first to the final generation. The most efficient pitching kinematics had a phase shift between the wing rotation and the wing stroke of in the first generation of the optimization and became slightly less advanced for the final generation where . The phase shift was determined as the non-dimensional time at which passes through zero. The phase shift of the highest lift-generating pitching kinematics decreased slightly from for the first generation to for the final generation.
The main difference between the most efficient and the highest lift-generating pitching motion was created by differences in the second control point and its timing . The timing and angle of the first and third control point did not vary substantially between subsequent generations or between the optimization scenarios (Table 3). The different coordinates of the second control point of the pitching motion led to a local maximum in at the beginning of the half strokes for the highest lift pitching kinematics, which was not present in the most efficient pitching kinematics. The maximum in corresponds to a local minimum in the effective angle of attack . The local extremum and its timing remained virtually constant between the first and the final generation. After the initial peak, the wing’s angle remained relatively constant for approximately 40% of the half stroke. The highest value of , which corresponds to the lowest effective angle of attack, was reached in the efficiency optimized scenario around T, after the maximum stroke velocity was reached at T. This minimum effective angle of attack decreased from 32.9° to 28.8° between the first and the final generation. Its timing varied marginally between generations. The most efficient pitch evolution had larger extreme values, but varied more smoothly than the highest lift generating pitch variation such that the maximum pitch rate in both cases was approximately .
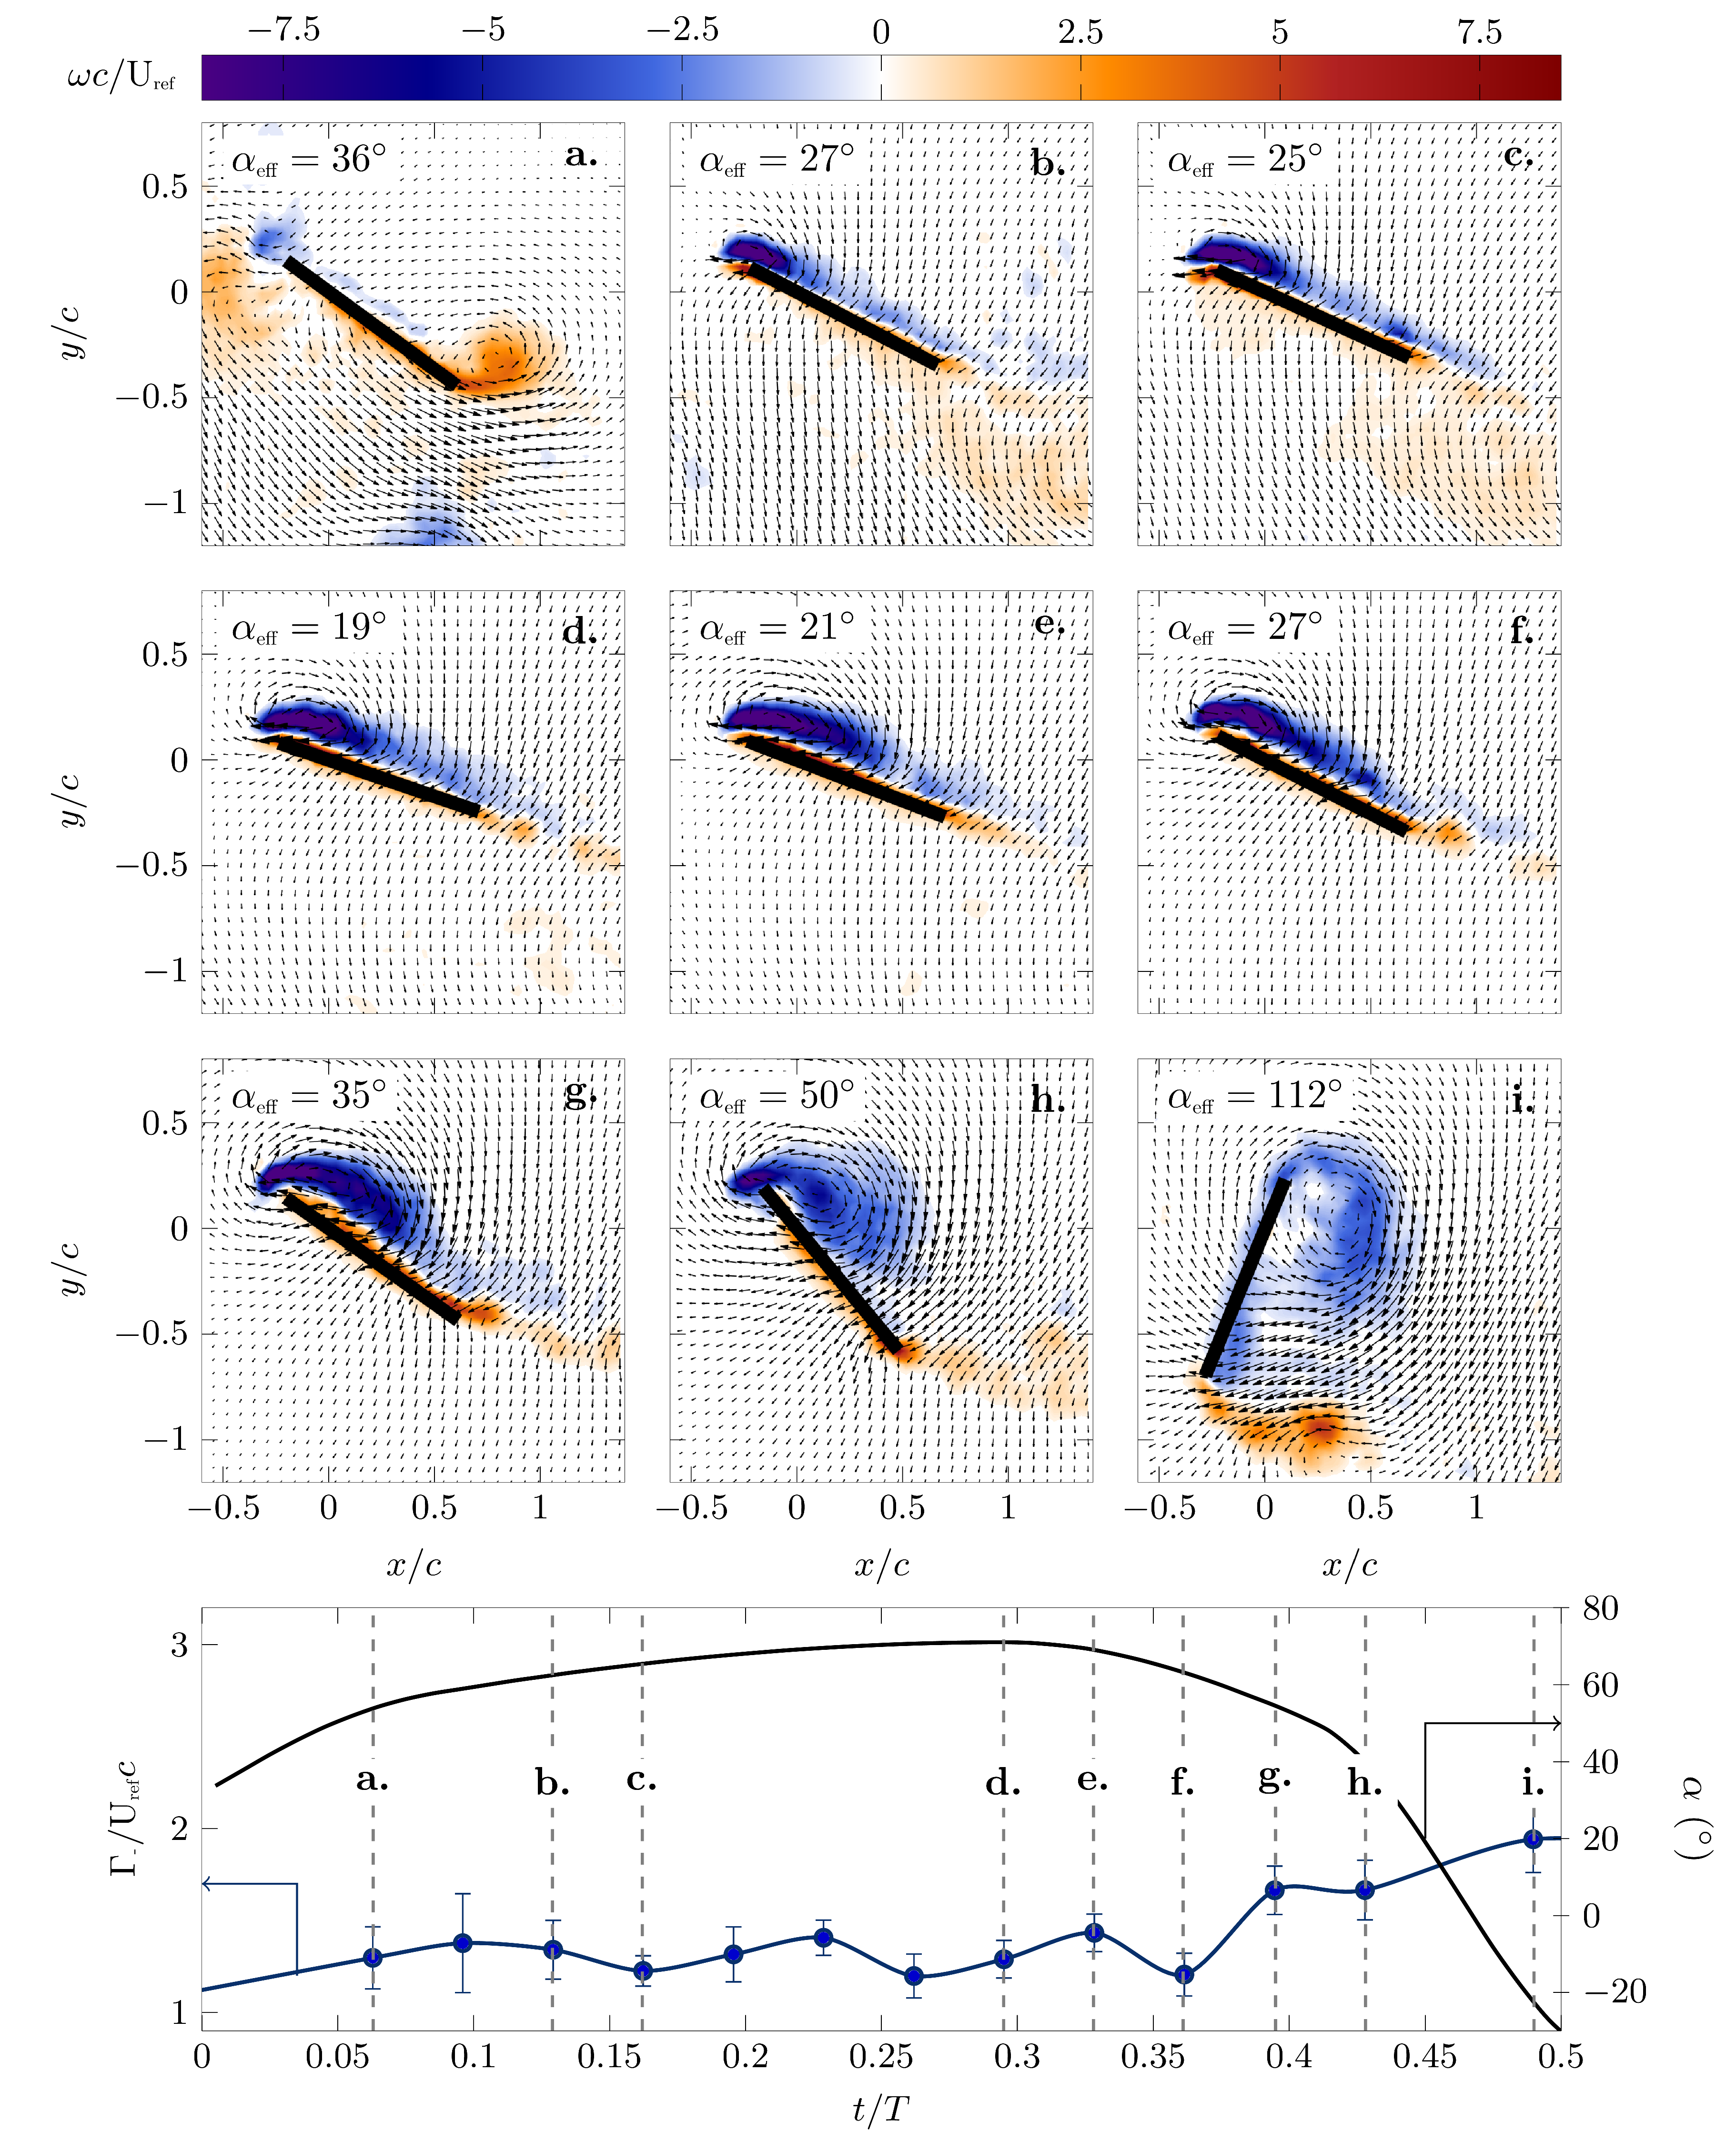
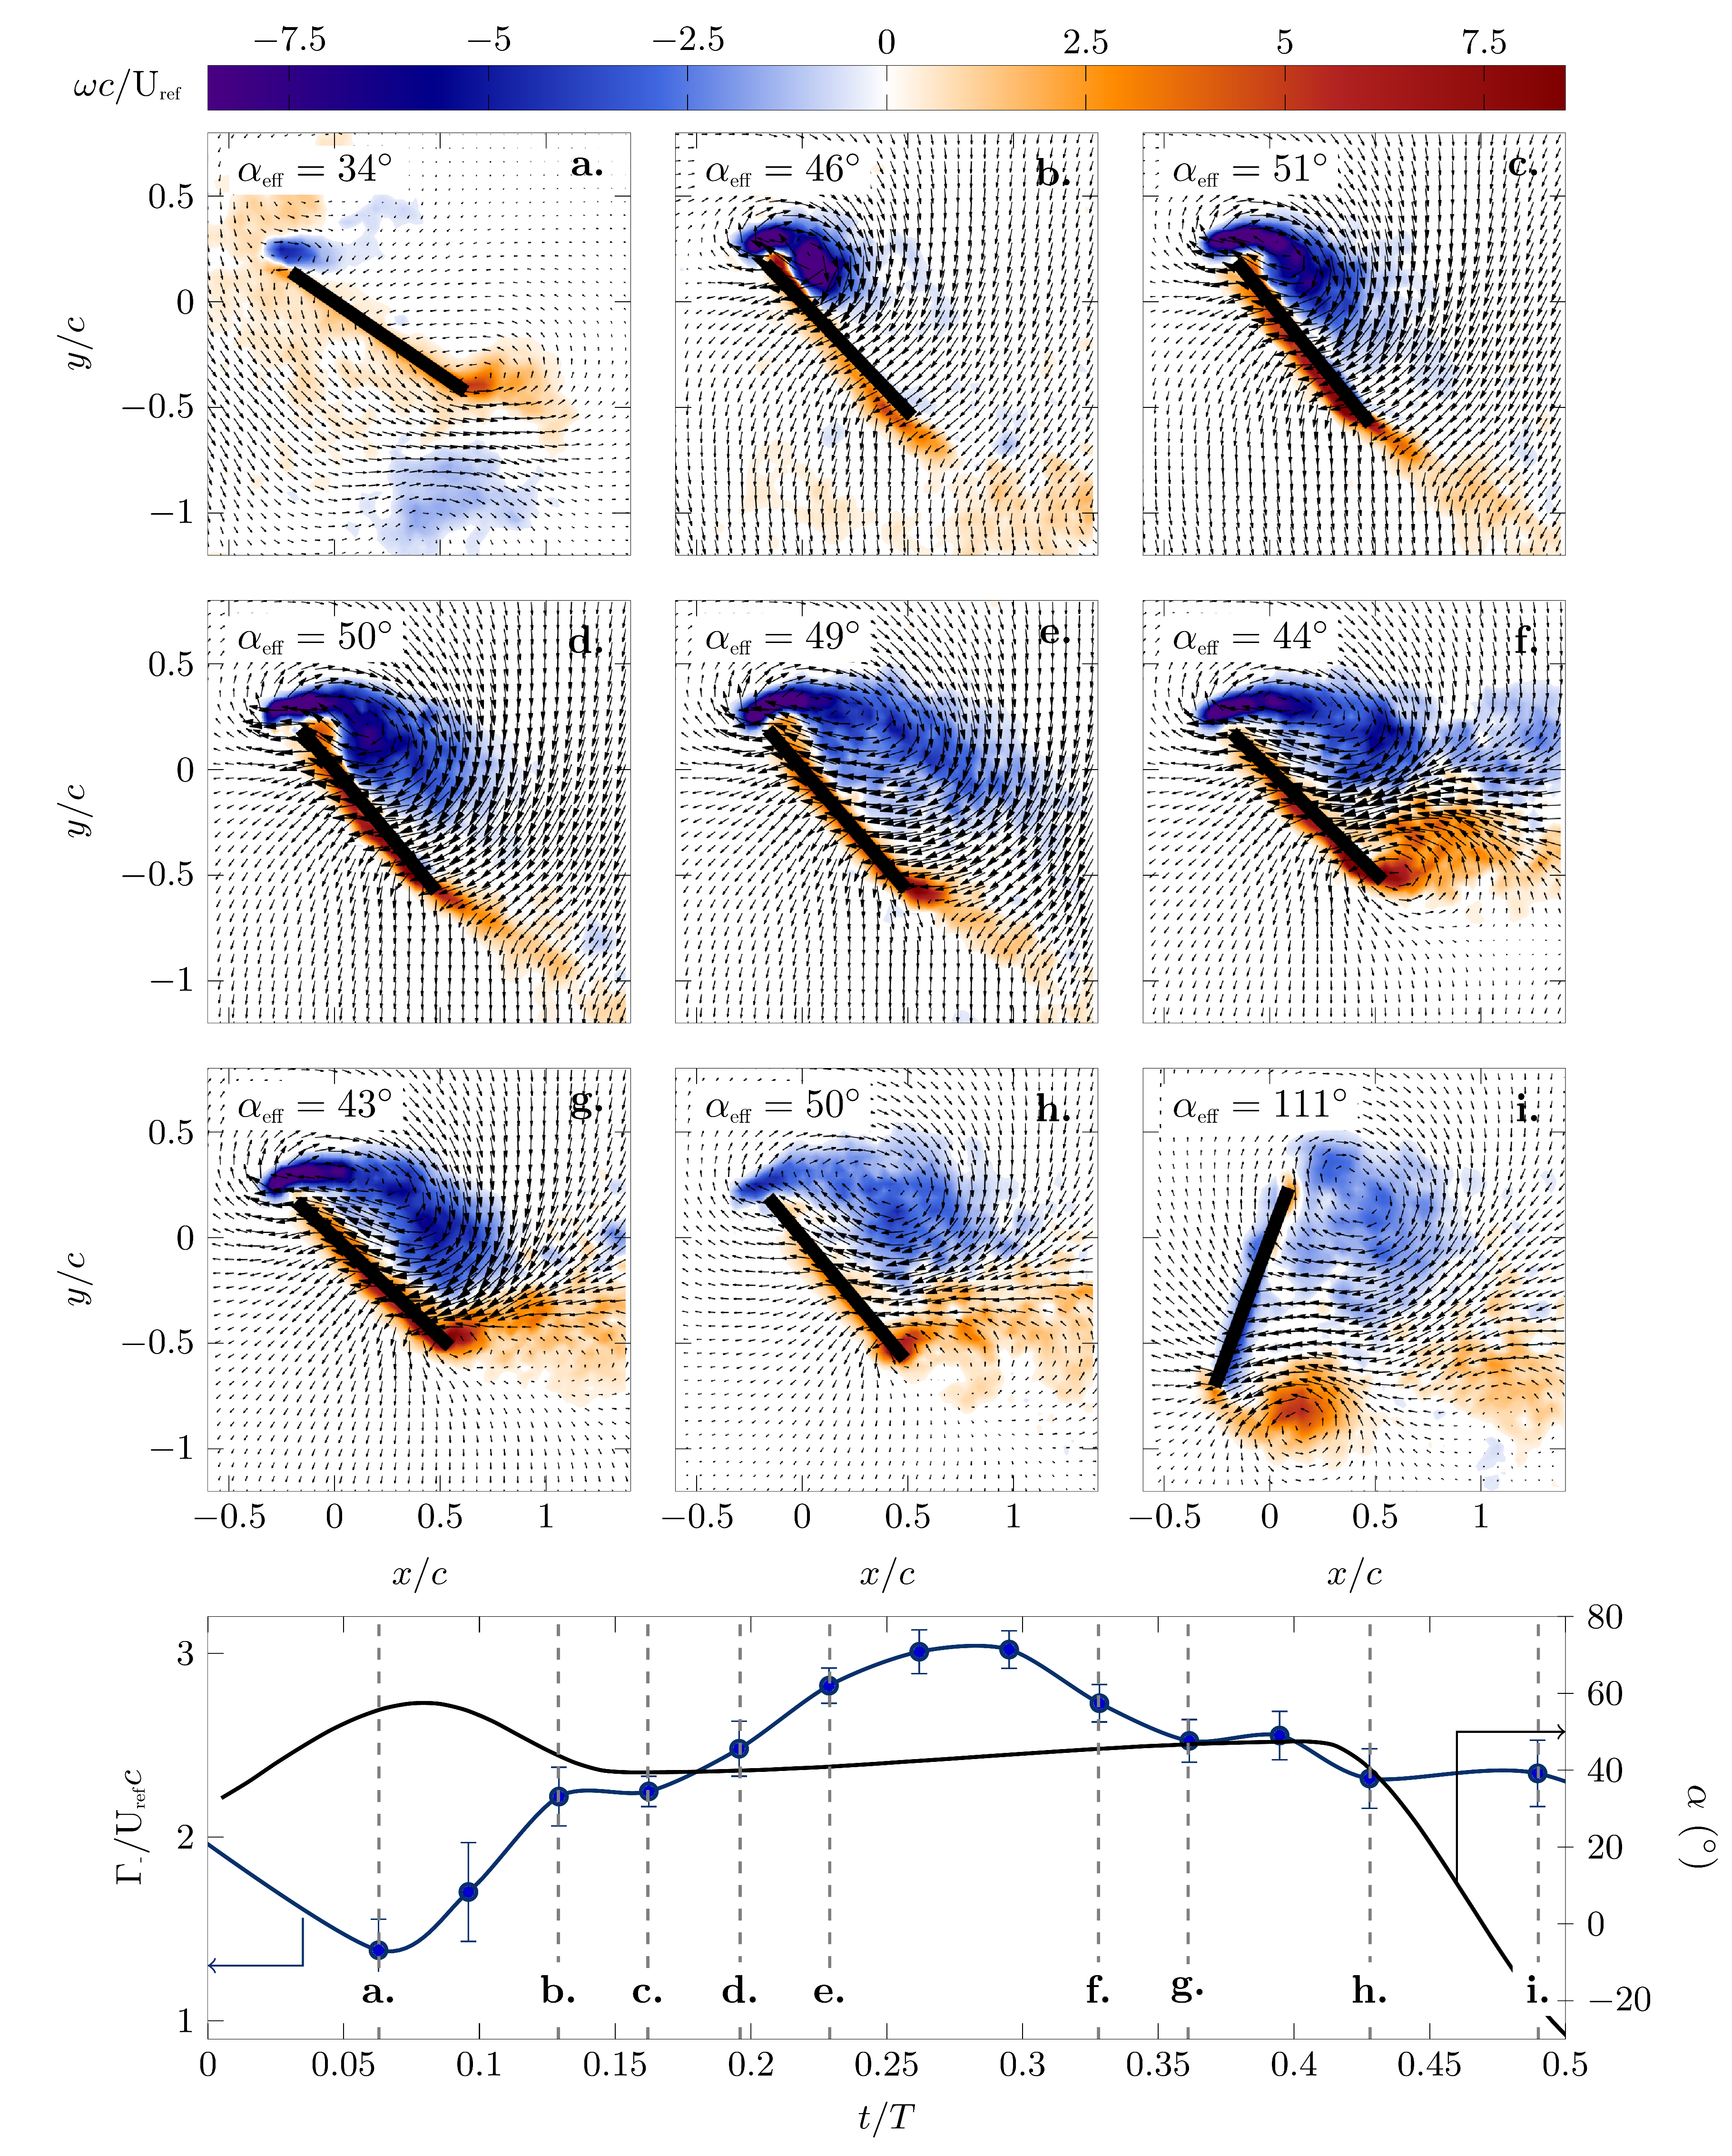
The evolution of the phase-averaged lift, drag and power coefficients corresponding to the different pitching kinematics is presented in Figure 6c–h. To describe the connection between the pitching kinematics and the aerodynamic forces, selected phase-averaged snapshots of the flow field around the wing at the mid-span are presented in Figure 9 and Figure 10 for the optimal efficiency and optimal lift kinematics, respectively. The phase angle and the effective angle of attack corresponding to the individual panels are indicated, and the evolution of during the first half stroke is repeated in the bottom panel.
In general, the lift coefficient primarily followed the sinusoidal stroke motion. This general evolution of the lift coefficient for simulated flapping wing hovering flight has been reported in the past by various experimental and numerical studies [19,27,29,31].
The initial increase in the lift coefficient was associated with a chord-wise growth of a bound coherent leading edge vortex (Figure 9b–f and Figure 10a–d). The maximum lift coefficient for the efficiency optimized scenario was reached at and for the lift optimized scenario at when the maximum stroke velocity was reached. The maximum lift coefficient for the optimal lift scenario was versus for the most efficient scenario. In both scenarios, the maximum lift coefficient was reached when the leading edge vortex started to move in the chord-normal direction away from the wing (Figure 9g,h and Figure 10e–h). The leading edge vortex was most efficient in increasing lift when it remained bound to the airfoil’s surface, and it increased the lift enhancement the stronger it became.
The most efficient pitching motion was characterized by a nearly constant and relatively low effective angle of attack at the start of the half stroke, which allowed for the formation of a leading edge vortex close to the airfoil surface, which remained bound for up to 60% of the half stroke. The highest lift-generating pitching motion had a larger effective angle of attack, which led to the generation of a stronger leading edge vortex and higher lift coefficient than in the efficiency optimized scenario. Early in the stroke cycle, the stronger leading edge vortex started to move in a chord-normal direction allowing a thin layer of reverse flow to form between the leading edge vortex and the wing surface. This reverse flow layer decreased the efficiency of the vortex to increase the lift. To provide a rough estimate of the strength of the leading edge vortex, a phase-averaged circulation value was calculated by integrating all the negative vorticity in the fields of view. The evolution of the leading edge vortex signed circulation within the first half stroke is presented at the bottom of Figure 9 and Figure 10 for the two optimization scenarios. The maximum circulation associated with the high lift kinematics was more than double the circulation that was generated during the most efficient kinematics.
In the efficiency optimized scenario, the leading edge vortex spanned almost the entire chord at quarter stroke leaving little room for a strong trailing edge vortex to form (Figure 9f). In the lift optimized scenario, the leading edge vortex grew closer to the leading edge, allowing a trailing edge vortex to roll up around the trailing edge (Figure 10f). This trailing edge vortex did not only grow closer to the wing, but due to a higher effective angle of attack, it was also stronger than for the more efficient motion.
The strong coherent leading and trailing edge vortices for the high lift kinematics induced a jet motion towards the wing (Figure 10f–i), which increased the drag coefficient (Figure 6f vs. Figure 6e). Overall, the drag coefficient was substantially lower for the most efficient motion compared to the high lift motion. The peak values were for the most efficient motion and for the highest lift motion. In the efficiency optimized scenario, the local maximum absolute drag was reached during the wing rotation and was attributed to the added mass effect [33,43]. The same peak shortly before was observed in the lift optimized scenario, but here, there was also a strong circulatory drag component due to the induced jet motion by the leading and trailing edge vortex pair.
The hovering efficiency was defined as the ratio between the stroke average lift coefficient and the stroke average power coefficient (Equation (4)). The form of the evolution of the power coefficient (Figure 6g–h) was similar to the evolution of the lift coefficient, and maximum values were reached around . The maximum lift coefficient in the lift optimized scenario was approximately 40% higher than in the efficiency optimized scenario, but its maximum power coefficient was about 65% lower (Table 4). The stroke average efficiency for the efficiency optimized motion was versus for the lift optimized motion (Table 4).
4. Conclusions
An experimental procedure to optimize the pitching kinematics of a flapping wing is presented. The optimization is based on a genetic algorithm. The pitching motion is parameterized using four control points, which are connected through monotonic cubic interpolation. The first control point is located at the start of the stroke, and the time and angle coordinates of the other three points can be varied within defined parameter ranges. This leads to a complex seven degrees of freedom motion that can be non-linear and non-harmonic.
Two optimization scenarios are studied, one where the stroke average efficiency is maximized and one where the stroke average lift is maximized. The solutions for both optimization scenarios converge within less than 30 generations based on the evaluation of their fitness. This corresponds to a total measurement time of 24 h and demonstrates the feasibility of a genetic optimization based on experimental data. The pitching kinematics of the best individual of the initial and the final population closely resemble each other for both optimization scenarios. The optimal kinematics in both scenarios differ substantially. The most efficient pitching motion is smoother and closer to a sinusoidal pitching motion, whereas the highest lift-generating pitching motion has sharper edges and is closer to a trapezoidal motion. In both solutions, the rotation or pitching motion is advanced with respect to the sinusoidal stroke motion. In general, the lift and power coefficient primarily follow the sinusoidal stroke motion, but their maximum values are strongly influenced by the pitching motion. The lift optimized pitching motion yields a maximum lift coefficient around the quarter stroke, which is approximately 40% higher than the efficiency optimized solution. The efficiency optimized solution has a 65% higher maximum power coefficient. The stroke average efficiency for the efficiency optimized motion is versus for the lift optimized motion.
Velocity field measurements at selected phases during the flapping motions highlight why the obtained solutions are optimal for the two different optimization objectives. The lift coefficient is most efficiently increased by a bound coherent leading edge vortex that spans most of the chord, whereas a higher lift increase is obtained by a creating a stronger, but not necessarily bound, leading edge vortex. The pitch angle variation in the efficiency optimized scenario supports the formation of a leading edge vortex that remains bound to the airfoil surface for most of the half stroke. The pitch angle variation in the lift optimized scenario rather promotes the formation of a stronger leading edge vortex, which will lead to a higher lift coefficient than in the efficiency optimized scenario.
Author Contributions
A.G. implemented the genetic algorithm-based optimization and conceived of the experiments. G.d.G.-C. performed the experiments. K.M. processed the velocity data. All authors contributed to the writing of the manuscript and to the analysis of the results.
Funding
This research was conducted in preparation of the Swiss National Science Foundation grant number 200021_175792. Alexander Gehrke’s stay at the unsteady flow diagnostics laboratory (UNFoLD) of École polytechnique fédérale de Lausanne (EPFL) was supported by the Programm zur Steigerung der Mobilität von Studierenden deutscher Hochschulen (PROMOS) of the German academic exchange service (DAAD).
Conflicts of Interest
The authors declare no conflict of interest.
Abbreviations
The following abbreviations are used in this manuscript:
| PIV | particle image velocimetry |
| LED | light-emitting diode |
| The following symbols are used in this manuscript: | |
| c | chord length |
| L | lift force |
| D | drag force |
| stroke torque | |
| pitch torque | |
| stroke power | |
| pitch power | |
| P | aerodynamic power |
| lift coefficient | |
| drag coefficient | |
| power coefficient | |
| f | wing stroke frequency |
| k | reduced frequency |
| distance between the stroke axis and the wing’s root | |
| R | wingspan |
| radius of the wing’s second moment of area | |
| radius of the drag’s point of application | |
| Reynolds number | |
| average wing tip velocity | |
| geometric angle between the wing’s chord and the vertical axis | |
| pitching rate | |
| efficiency | |
| kinematic viscosity | |
| density | |
| stroke amplitude | |
| stroke angular velocity | |
References
- Dickinson, M.H. Wing rotation and the aerodynamic basis of insect flight. Science 1999, 284, 1954–1960. [Google Scholar] [CrossRef] [PubMed]
- Ho, S.; Nassef, H.; Pornsinsirirak, N.; Tai, Y.C.; Ho, C.M. Unsteady aerodynamics and flow control for flapping wing flyers. Prog. Aerosp. Sci. 2003, 39, 635–681. [Google Scholar] [CrossRef]
- Shyy, W.; Aono, H.; Chimakurthi, S.; Trizila, P.; Kang, C.K.; Cesnik, C.; Liu, H. Recent progress in flapping wing aerodynamics and aeroelasticity. Prog. Aerosp. Sci. 2010, 46, 284–327. [Google Scholar] [CrossRef]
- Ma, K.Y.; Chirarattananon, P.; Fuller, S.B.; Wood, R.J. Controlled flight of a biologically inspired, insect-scale robot. Science 2013, 340, 603–607. [Google Scholar] [CrossRef] [PubMed]
- Nakata, T.; Liu, H.; Tanaka, Y.; Nishihashi, N.; Wang, X.; Sato, A. Aerodynamics of a bio-inspired flexible flapping-wing micro air vehicle. Bioinspir. Biomim. 2011, 6, 045002. [Google Scholar] [CrossRef] [PubMed]
- Keennon, M.; Klingebiel, K.; Won, H. Development of the Nano Hummingbird: A Tailless Flapping Wing Micro Air Vehicle. In Proceedings of the 50th AIAA Aerospace Sciences Meeting including the New Horizons Forum and Aerospace Exposition, Nashville, TN, USA, 9–12 January 2012. [Google Scholar] [CrossRef]
- De Croon, G.C.H.E.; Groen, M.A.; De Wagter, C.; Remes, B.; Ruijsink, R.; van Oudheusden, B.W. Design, aerodynamics and autonomy of the DelFly. Bioinspir. Biomim. 2012, 7, 025003. [Google Scholar] [CrossRef] [PubMed]
- Floreano, D.; Wood, R.J. Science, technology and the future of small autonomous drones. Nature 2015, 521, 460–466. [Google Scholar] [CrossRef] [PubMed] [Green Version]
- Stafford, N. Spy in the sky. Nature 2007, 445, 808–809. [Google Scholar] [PubMed]
- Hawkes, E.W.; Lentink, D. Fruit fly scale robots can hover longer with flapping wings than with spinning wings. J. R. Soc. Interface 2016, 13, 20160730. [Google Scholar] [CrossRef] [PubMed] [Green Version]
- Bayiz, Y.; Ghanaatpishe, M.; Fathy, H.; Cheng, B. Hovering efficiency comparison of rotary and flapping flight for rigid rectangular wings via dimensionless multi-objective optimization. Bioinspir. Biomim. 2018, 13, 046002. [Google Scholar] [CrossRef] [PubMed] [Green Version]
- Willmott, A.P.; Ellington, C.P. The mechanics of flight in the hawkmoth Manduca sexta. I. Kinematics of hovering and forward flight. J. Exp. Biol. 1997, 200, 2705–2722. [Google Scholar] [PubMed]
- Lehmann, F.O.; Dickinson, M.H. The control of wing kinematics and flight forces in fruit flies (Drosophila spp.). J. Exp. Biol. 1998, 201, 385–401. [Google Scholar] [PubMed]
- Liu, Y.; Sun, M. Wing kinematics measurement and aerodynamics of hovering droneflies. J. Exp. Biol. 2008, 211, 2014–2025. [Google Scholar] [CrossRef] [PubMed] [Green Version]
- Ellington, C.P.; van den Berg, C.; Willmott, A.P.; Thomas, A.L.R. Leading-edge vortices in insect flight. Nature 1996, 384, 626. [Google Scholar] [CrossRef]
- Sane, S.P.; Dickinson, M.H. The control of flight force by a flapping wing: Lift and drag production. J. Exp. Biol. 2001, 204, 2607. [Google Scholar] [PubMed]
- Lehmann, F.O.; Sane, S.P.; Dickinson, M.H. The aerodynamic effects of wing-wing interaction in flapping insect wings. J. Exp. Biol. 2005, 208, 3075–3092. [Google Scholar] [CrossRef] [PubMed] [Green Version]
- Lua, K.B.; Lim, T.T.; Yeo, K.S. Effect of wing–wake interaction on aerodynamic force generation on a 2D flapping wing. Exp. Fluids 2011, 51, 177–195. [Google Scholar] [CrossRef]
- Bomphrey, R.J.; Nakata, T.; Phillips, N.; Walker, S.M. Smart wing rotation and trailing-edge vortices enable high frequency mosquito flight. Nature 2017, 544, 92–95. [Google Scholar] [CrossRef] [PubMed] [Green Version]
- Goldberg, D.E. Genetic Algorithms in Search, Optimization & Machine Learning; Addison-Wesley Longman Publishing Co., Inc.: Boston, MA, USA, 1989. [Google Scholar]
- Milano, M.; Gharib, M. Uncovering the physics of flapping flat plates with artificial evolution. J. Fluid Mech. 2005, 534, 403–409. [Google Scholar] [CrossRef] [Green Version]
- Margerie, E.; Mouret, J.B.; Doncieux, S.; Meyer, J.A.; Ravasi, T.; Martinelli, P.; Grand, C. Flapping-wing flight in bird-sized UAVs for the ROBUR project: From an evolutionary optimization to a real flapping-wing mechanism. In Proceedings of the 3rd US-European Competition and Workshop on Micro Air Vehicle Systems (MAV07), Toulouse, France, 17–21 September 2007. [Google Scholar]
- Tuncer, I.H.; Kaya, M. Optimization of flapping airfoils for maximum thrust and propulsive efficiency. AIAA J. 2005, 43, 2329–2336. [Google Scholar] [CrossRef]
- Stanford, B.K.; Beran, P.S. Analytical sensitivity analysis of an unsteady vortex-lattice method for flapping-wing optimization. J. Aircr. 2010, 47, 647–662. [Google Scholar] [CrossRef]
- Chaudhuri, A.; Haftka, R.T.; Ifju, P.; Chang, K.; Tyler, C.; Schmitz, T. Experimental flapping wing optimization and uncertainty quantification using limited samples. Struct. Multidiscip. Optim. 2015, 51, 957–970. [Google Scholar] [CrossRef]
- Ke, X.; Zhang, W. Wing geometry and kinematic parameters optimization of flapping wing hovering flight. Appl. Sci. 2016, 6, 390. [Google Scholar] [CrossRef]
- Lee, Y.J.; Lua, K.B. Optimization of simple and complex pitching motions for flapping wings in hover. AIAA J. 2018, 56, 2466–2470. [Google Scholar] [CrossRef]
- Liu, H.; Aono, H. Size effects on insect hovering aerodynamics: An integrated computational study. Bioinspir. Biomim. 2009, 4, 015002. [Google Scholar] [CrossRef] [PubMed]
- Lua, K.B.; Lim, T.T.; Yeo, K.S. Scaling of aerodynamic forces of three-dimensional flapping wings. AIAA J. 2014, 52, 1095–1101. [Google Scholar] [CrossRef]
- Luo, G.; Sun, M. The effects of corrugation and wing planform on the aerodynamic force production of sweeping model insect wings. Acta Mech. Sin. 2005, 21, 531–541. [Google Scholar] [CrossRef]
- Krishna, S.; Green, M.A.; Mulleners, K. Flowfield and force evolution for a symmetric hovering flat-plate wing. AIAA J. 2018, 56, 1360–1371. [Google Scholar] [CrossRef]
- Liu, Y.; Sun, M. Wing Kinematics Measurement and Aerodynamic Force and Moments Computation of Hovering Hoverfly. In Proceedings of the 1st International Conference on Bioinformatics and Biomedical Engineering, Wuhan, China, 6–8 July 2007; pp. 452–455. [Google Scholar] [CrossRef]
- Fry, S.N.; Sayaman, R.; Dickinson, M.H. The aerodynamics of hovering flight in Drosophila. J. Exp. Biol. 2005, 208, 2303–2318. [Google Scholar] [CrossRef] [PubMed]
- Willert, C.; Stasicki, B.; Klinner, J.; Moessner, S. Pulsed operation of high-power light emitting diodes for imaging flow velocimetry. Meas. Sci. Technol. 2010, 21, 075402. [Google Scholar] [CrossRef] [Green Version]
- Wang, Z.J. Aerodynamic efficiency of flapping flight: Analysis of a two-stroke model. J. Exp. Biol. 2008, 211, 234–238. [Google Scholar] [CrossRef] [PubMed]
- Chipperfield, A.; Fleming, P.J. The MATLAB Genetic Algorithm Toolbox. In Proceedings of the IEE Colloquium on Applied Control Techniques Using MATLAB, London, UK, 26 January 1995. [Google Scholar] [CrossRef]
- Ishihara, D.; Horie, T.; Niho, T. An experimental and three-dimensional computational study on the aerodynamic contribution to the passive pitching motion of flapping wings in hovering flies. Bioinspir. Biomim. 2014, 9, 046009. [Google Scholar] [CrossRef] [PubMed]
- Bergou, A.J.; Ristroph, L.; Guckenheimer, J.; Cohen, I.; Wang, Z.J. Fruit flies modulate passive wing pitching to generate in-flight turns. Phys. Rev. Lett. 2010, 104. [Google Scholar] [CrossRef] [PubMed]
- Whitney, J.P.; Wood, R.J. Aeromechanics of passive rotation in flapping flight. J. Fluid Mech. 2010, 660, 197–220. [Google Scholar] [CrossRef]
- Beatus, T.; Cohen, I. Wing-pitch modulation in maneuvering fruit flies is explained by an interplay between aerodynamics and a torsional spring. Phys. Rev. E 2015, 92. [Google Scholar] [CrossRef] [PubMed] [Green Version]
- Lua, K.B.; Zhang, X.H.; Lim, T.T.; Yeo, K.S. Effects of pitching phase angle and amplitude on a two-dimensional flapping wing in hovering mode. Exp. Fluids 2015, 56. [Google Scholar] [CrossRef]
- Krishna, S. Unsteady Fluid Dynamics Around a Hovering Flat Plate Wing. Ph.D. Thesis, École polytechnique fédérale de Lausanne (EPFL), Lausanne, Switzerland, 2017. [Google Scholar] [CrossRef]
- Sane, S.P.; Dickinson, M.H. The aerodynamic effects of wing rotation and a revised quasi-steady model of flapping flight. J. Exp. Biol. 2002, 205, 1087. [Google Scholar] [PubMed]
- Sun, M.; Tang, J. Unsteady aerodynamic force generation by a model fruit fly wing in flapping motion. J. Exp. Biol. 2002, 205, 55–70. [Google Scholar] [PubMed]
- Krishna, S.B.; Green, M.A.; Mulleners, K. Effect of wing rotation on the flow behaviour around a hovering wing. 2018; in preparation. [Google Scholar]
Figure 1.
Schematic of the three rotational axis and angles describing the flapping wing kinematics: stroke , elevation and pitching .
Figure 1.
Schematic of the three rotational axis and angles describing the flapping wing kinematics: stroke , elevation and pitching .

Figure 2.
(a) Flapping wing mechanism. The main shaft controls the stroke motion. Through a belt transmission, the pitching motion is controlled at the bottom of the main shaft. (b) Wing model with chord c, span R, root cutout and a rotational axis at quarter chord indicated by the dotted line.
Figure 2.
(a) Flapping wing mechanism. The main shaft controls the stroke motion. Through a belt transmission, the pitching motion is controlled at the bottom of the main shaft. (b) Wing model with chord c, span R, root cutout and a rotational axis at quarter chord indicated by the dotted line.

Figure 3.
Control points , , , and for the pitching angle optimization function.

Figure 4.
Schematic of the experimental setup displaying the flapping mechanism inside an octagonal tank filled with water, the particle image velocimetry (PIV) light-sheet and PIV camera.
Figure 4.
Schematic of the experimental setup displaying the flapping mechanism inside an octagonal tank filled with water, the particle image velocimetry (PIV) light-sheet and PIV camera.

Figure 5.
Convergence of the fitness functions for (a) the maximum stroke average efficiency objective and (b) the maximum stroke average lift objective. The color of the markers indicates the aerodynamic energy associated with the pitching motion solutions.
Figure 5.
Convergence of the fitness functions for (a) the maximum stroke average efficiency objective and (b) the maximum stroke average lift objective. The color of the markers indicates the aerodynamic energy associated with the pitching motion solutions.

Figure 6.
Phase averaged pitching angle , lift coefficient , drag coefficient and power coefficient evolution for an entire flapping cycle for the best individuals from the initial, third and final population of the genetic algorithm efficiency optimization (left column) and lift optimization (right column).

Figure 7.
Distribution of the stroke average lift coefficient for the 21 populations tested in the lift optimization scenario. The colors indicate the number of the population, which all included individuals. The vertical dotted line indicates the maximal stroke average lift coefficient reached by the final optimized solution. The distributions of the first and final population are highlighted by increased line thickness.

Figure 8.
Pitching kinematics of the best individual of the first population for eight repeated runs of the high lift optimization. The line color represents the value of the stroke average lift coefficient. The final solution from the final population is included by the dotted line.
Figure 8.
Pitching kinematics of the best individual of the first population for eight repeated runs of the high lift optimization. The line color represents the value of the stroke average lift coefficient. The final solution from the final population is included by the dotted line.

Figure 9.
Velocity and vorticity fields at selected phases within the flapping cycle for the final generation of the efficiency optimization of the pitch kinematics.
Figure 9.
Velocity and vorticity fields at selected phases within the flapping cycle for the final generation of the efficiency optimization of the pitch kinematics.

Figure 10.
Velocity and vorticity fields at selected phases within the flapping cycle for the final generation of the maximum lift optimization of the pitch kinematics.
Figure 10.
Velocity and vorticity fields at selected phases within the flapping cycle for the final generation of the maximum lift optimization of the pitch kinematics.


Table 1.
Wing parameters of three flying insects and the scaled model submerged in water with .
| Parameters | Honeybee [3] | Hawkmoth [3] | Hoverfly [32] | Model [31] | ||
|---|---|---|---|---|---|---|
| Wing stroke frequency | f | () | 232 | 26 | 166 | 0.25 |
| Wing chord | c | () | 3 | 18.3 | 2.4 | 34 |
| Wing span | R | () | 10 | 48.3 | 9.03 | 107 |
| Stroke amplitude | () | 91 | 115 | 148.2 | 180 | |
| Reduced frequency | k | 0.3 | 0.3 | 0.32 | 0.32 | |
| Reynolds number | 1412 | 5885 | 620 | 2510 |
Table 2.
Parameter ranges for the pitching motion.
| minimum | 20° | 30° | 30° | 20° | |||
| maximum | 60° | 80° | 80° | 60° |
Table 3.
Parameters describing the pitching motions of the best individuals of the first, third and final generation for the genetic algorithm efficiency and lift optimization.
Table 3.
Parameters describing the pitching motions of the best individuals of the first, third and final generation for the genetic algorithm efficiency and lift optimization.
| efficiency optimization | |||||||
| initial population | |||||||
| third population | |||||||
| final population | |||||||
| lift optimization | |||||||
| initial population | |||||||
| third population | |||||||
| final population | |||||||
Table 4.
Phase-averaged lift and efficiency measured for the pitching motions of the best individuals of the first, third and final population for the genetic algorithm efficiency and lift optimization.
Table 4.
Phase-averaged lift and efficiency measured for the pitching motions of the best individuals of the first, third and final population for the genetic algorithm efficiency and lift optimization.
| efficiency optimization | ||
| initial population | ||
| third population | ||
| final population | ||
| lift optimization | ||
| initial population | ||
| third population | ||
| final population | ||
© 2018 by the authors. Licensee MDPI, Basel, Switzerland. This article is an open access article distributed under the terms and conditions of the Creative Commons Attribution (CC BY) license (http://creativecommons.org/licenses/by/4.0/).
Share and Cite
MDPI and ACS Style
Gehrke, A.; De Guyon-Crozier, G.; Mulleners, K. Genetic Algorithm Based Optimization of Wing Rotation in Hover. Fluids 2018, 3, 59. https://doi.org/10.3390/fluids3030059
AMA Style
Gehrke A, De Guyon-Crozier G, Mulleners K. Genetic Algorithm Based Optimization of Wing Rotation in Hover. Fluids. 2018; 3(3):59. https://doi.org/10.3390/fluids3030059
Chicago/Turabian StyleGehrke, Alexander, Guillaume De Guyon-Crozier, and Karen Mulleners. 2018. "Genetic Algorithm Based Optimization of Wing Rotation in Hover" Fluids 3, no. 3: 59. https://doi.org/10.3390/fluids3030059