1. Introduction
CO
2 capture and storage is an effective method for the substantial reduction of CO
2 emissions produced from the utilization of fossil fuels such as in power generation. Primary approaches aimed at CO
2 separation from flue gas currently available are: absorption (including chemical and physical absorption), adsorption, use of membranes, chemical looping and cryogenic processes [
1]. CO
2 capture by cryogenics is a unique separation method which requires a low temperature to cool, condense and purify CO
2 from a gas stream. This technique is a vapor liquid separation (CO
2-rich liquid phase) namely cryogenic condensation, vapor solid separation namely the hydrate precipitation, and a combination of both such as in CO
2 slurry separation. For hydrate precipitation, clathrate hydrates are crystalline solid compounds in which gaseous CO
2 molecules (guest) are trapped in water cavities (host) by hydrogen bonds under appropriate thermodynamic conditions (such as high pressure and/or low temperature). Hydrate-based CO
2 capture (HBCC) has been receiving attention due to its moderate operating temperature range, the ease of recycling for aqueous solution containing additives, the capability for continuous operation which allows large-scale treatment and its unique separation mechanism.
For cryogenic condensation, flue gas under high pressure is cooled to sub-zero temperatures which allow only CO
2 to condense. The process of liquefying CO
2 can provide two types of product conditions: one is liquid CO
2 for pipeline transport, and the other is liquid CO
2 for ship transport. Many researchers have conducted experiments based on this method and have accomplished significant results. For example, Zhang et al. studied a liquefied natural gas-fueled quasi-combined power plant using supercritical CO
2 Rankine-like and Brayton cycles [
2,
3,
4]. Zanganeh et al. introduced and discussed the challenges, development stages, and commissioning of a pilot-scale CO
2 capture and compression unit, which can separate CO
2 as a liquid phase from the flue gas of oxy-fuel combustion [
5]. Amann et al. evaluated the technical performance of a natural gas combined cycle converted for oxy-fuel combustion using a O
2/CO
2 cycle with a cryogenic CO
2 recovery process [
6]. Hart et al. developed a cryogenic CO
2 separation process, in which CO
2 is cooled into a three-phase mixture and the solid CO
2 is melted by a heater, and then separated with the liquid [
7].
CO
2 capture by cryogenic condensation and expansion possesses several economic and technological advantages such as:
- (1)
Liquid CO2 is directly produced at a relatively low pressure, avoiding huge energy consumption in compressing gaseous CO2 to a very high pressure to reach the supercritical state.
- (2)
The cryogenic separation method is based on relatively mature industrial processes, such as compression and refrigeration, indicating easy expansion to industrial-scale utilization.
- (3)
In cryogenic processes, CO2 can be handled in the liquid phase, making it easy to pump to the high pressures required for pipeline transportation and sequestration with a minimum energy requirement.
However, to achieve CO2 condensation, the mixture requires a reduction to a very low temperature, which requires substantial energy consumption for refrigeration, leading to a high energy penalty for CO2 capture, and it requires CO2 solidification at low temperatures, which causes several operational problems, such as the blockage of pipes or heaters. Therefore, the key point in improving the cryogenic method lies in how to achieve CO2 liquefaction at relatively higher temperatures above −55 °C.
1.1. Improvement of the Cryogenic Separation Method
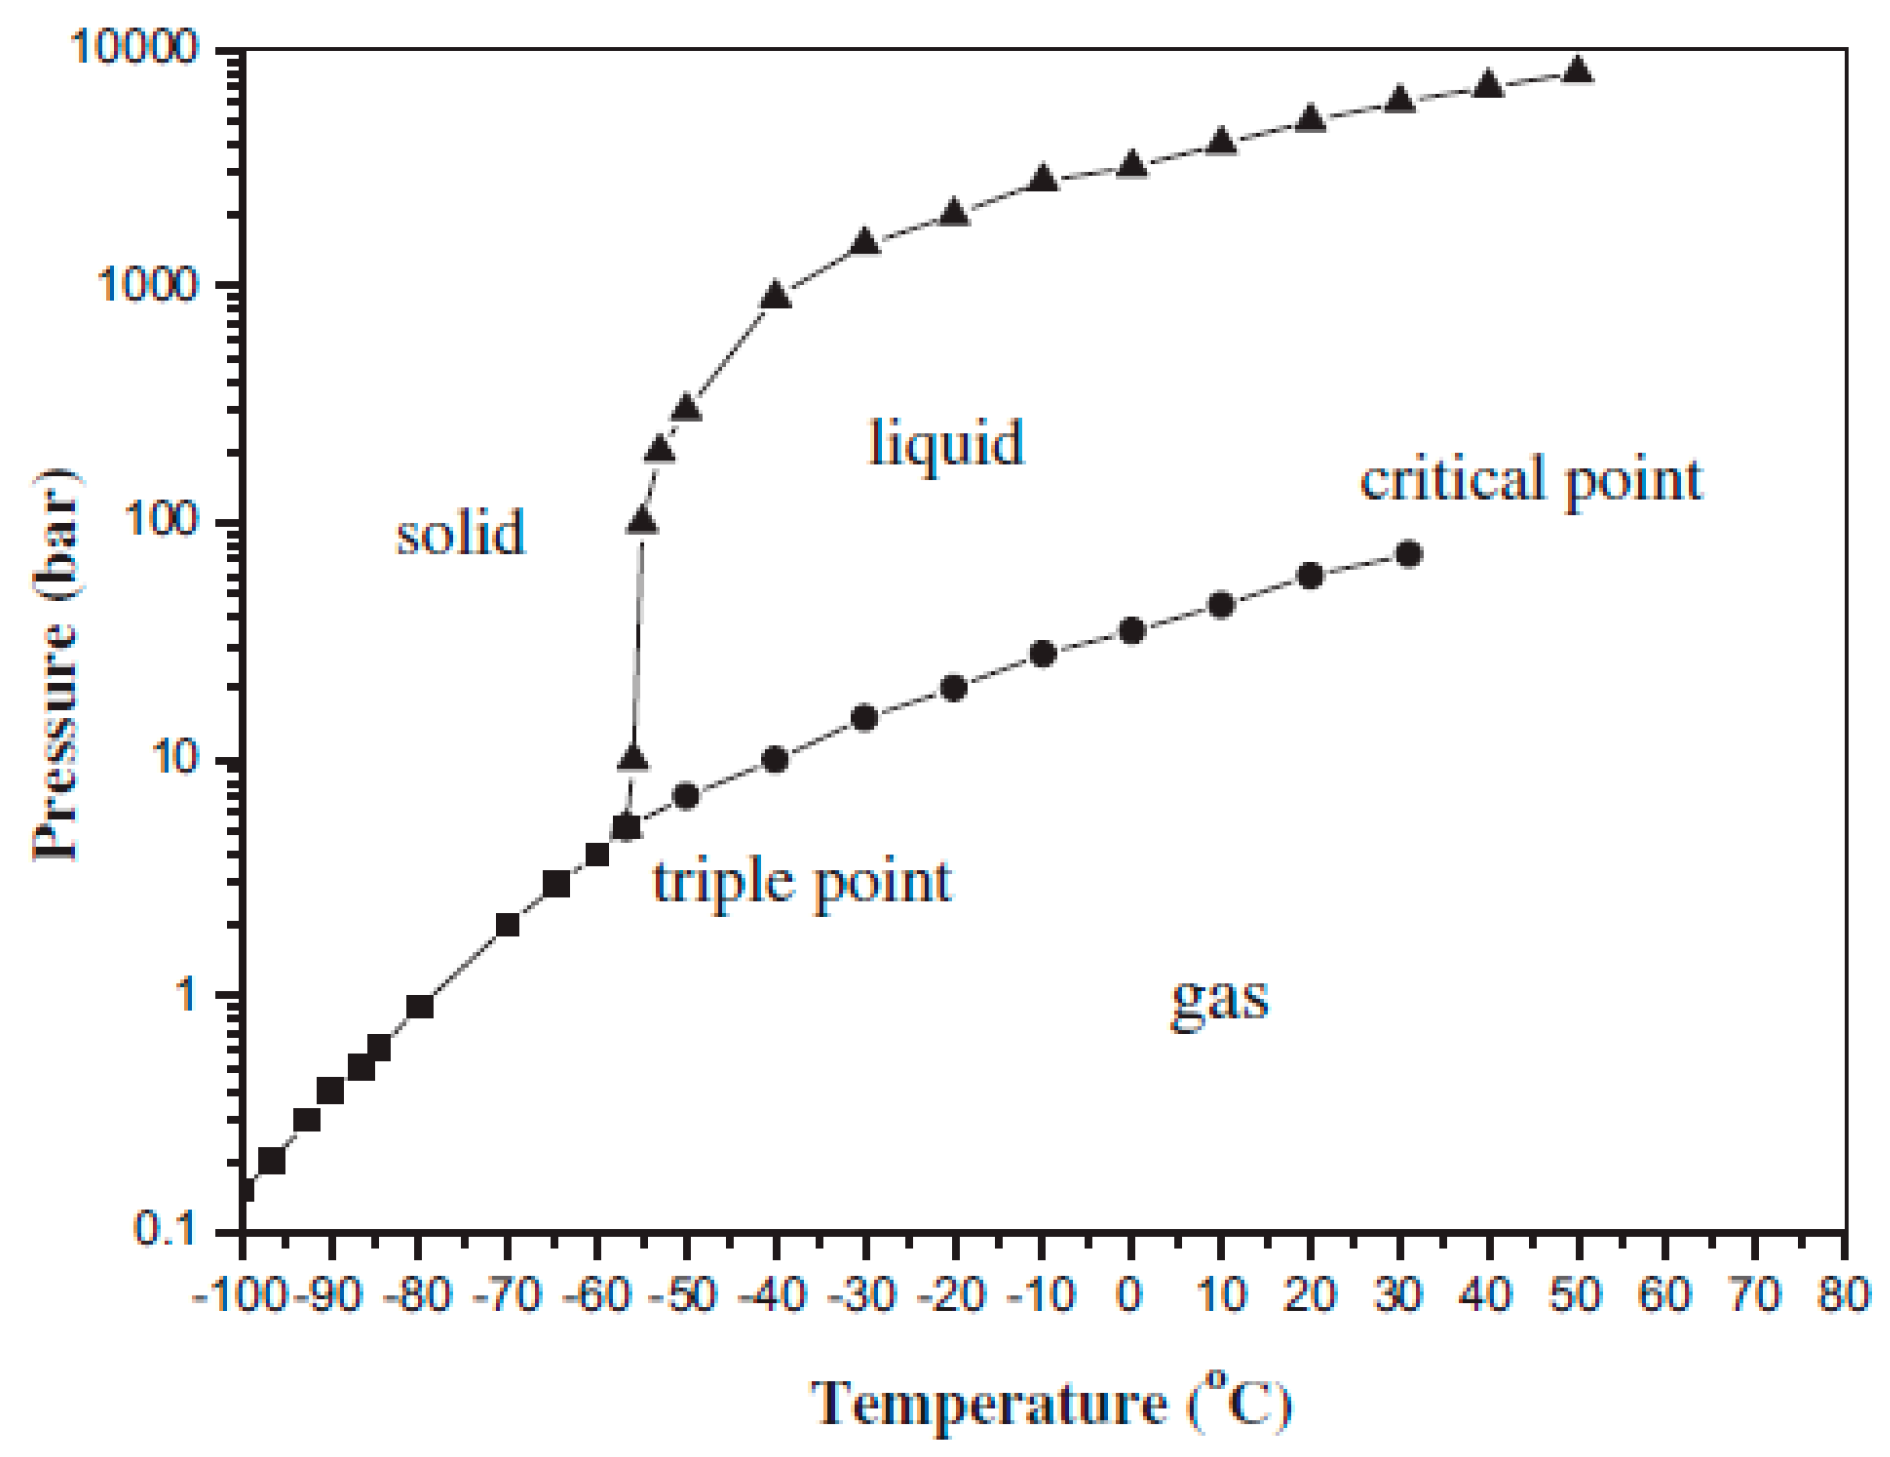
Figure 1 shows the three-phase diagram of CO
2. The liquefaction temperature of CO
2 is determined by its pressure. The increase in the CO
2 pressure enhances its liquefaction temperature, which can lower the energy consumption in the refrigeration and prevent it from freezing. Thus, the increase in CO
2 pressure can be an improvement technique for the cryogenic separation method. In general, two factors can directly affect the CO
2 pressure in a gas mixture: one is the CO
2 concentration, and the other is the total pressure of the gas mixture.
Xu et al. conducted the experiments that gave all the data as shown in
Figure 2,
Figure 3 and
Figure 4 [
8].
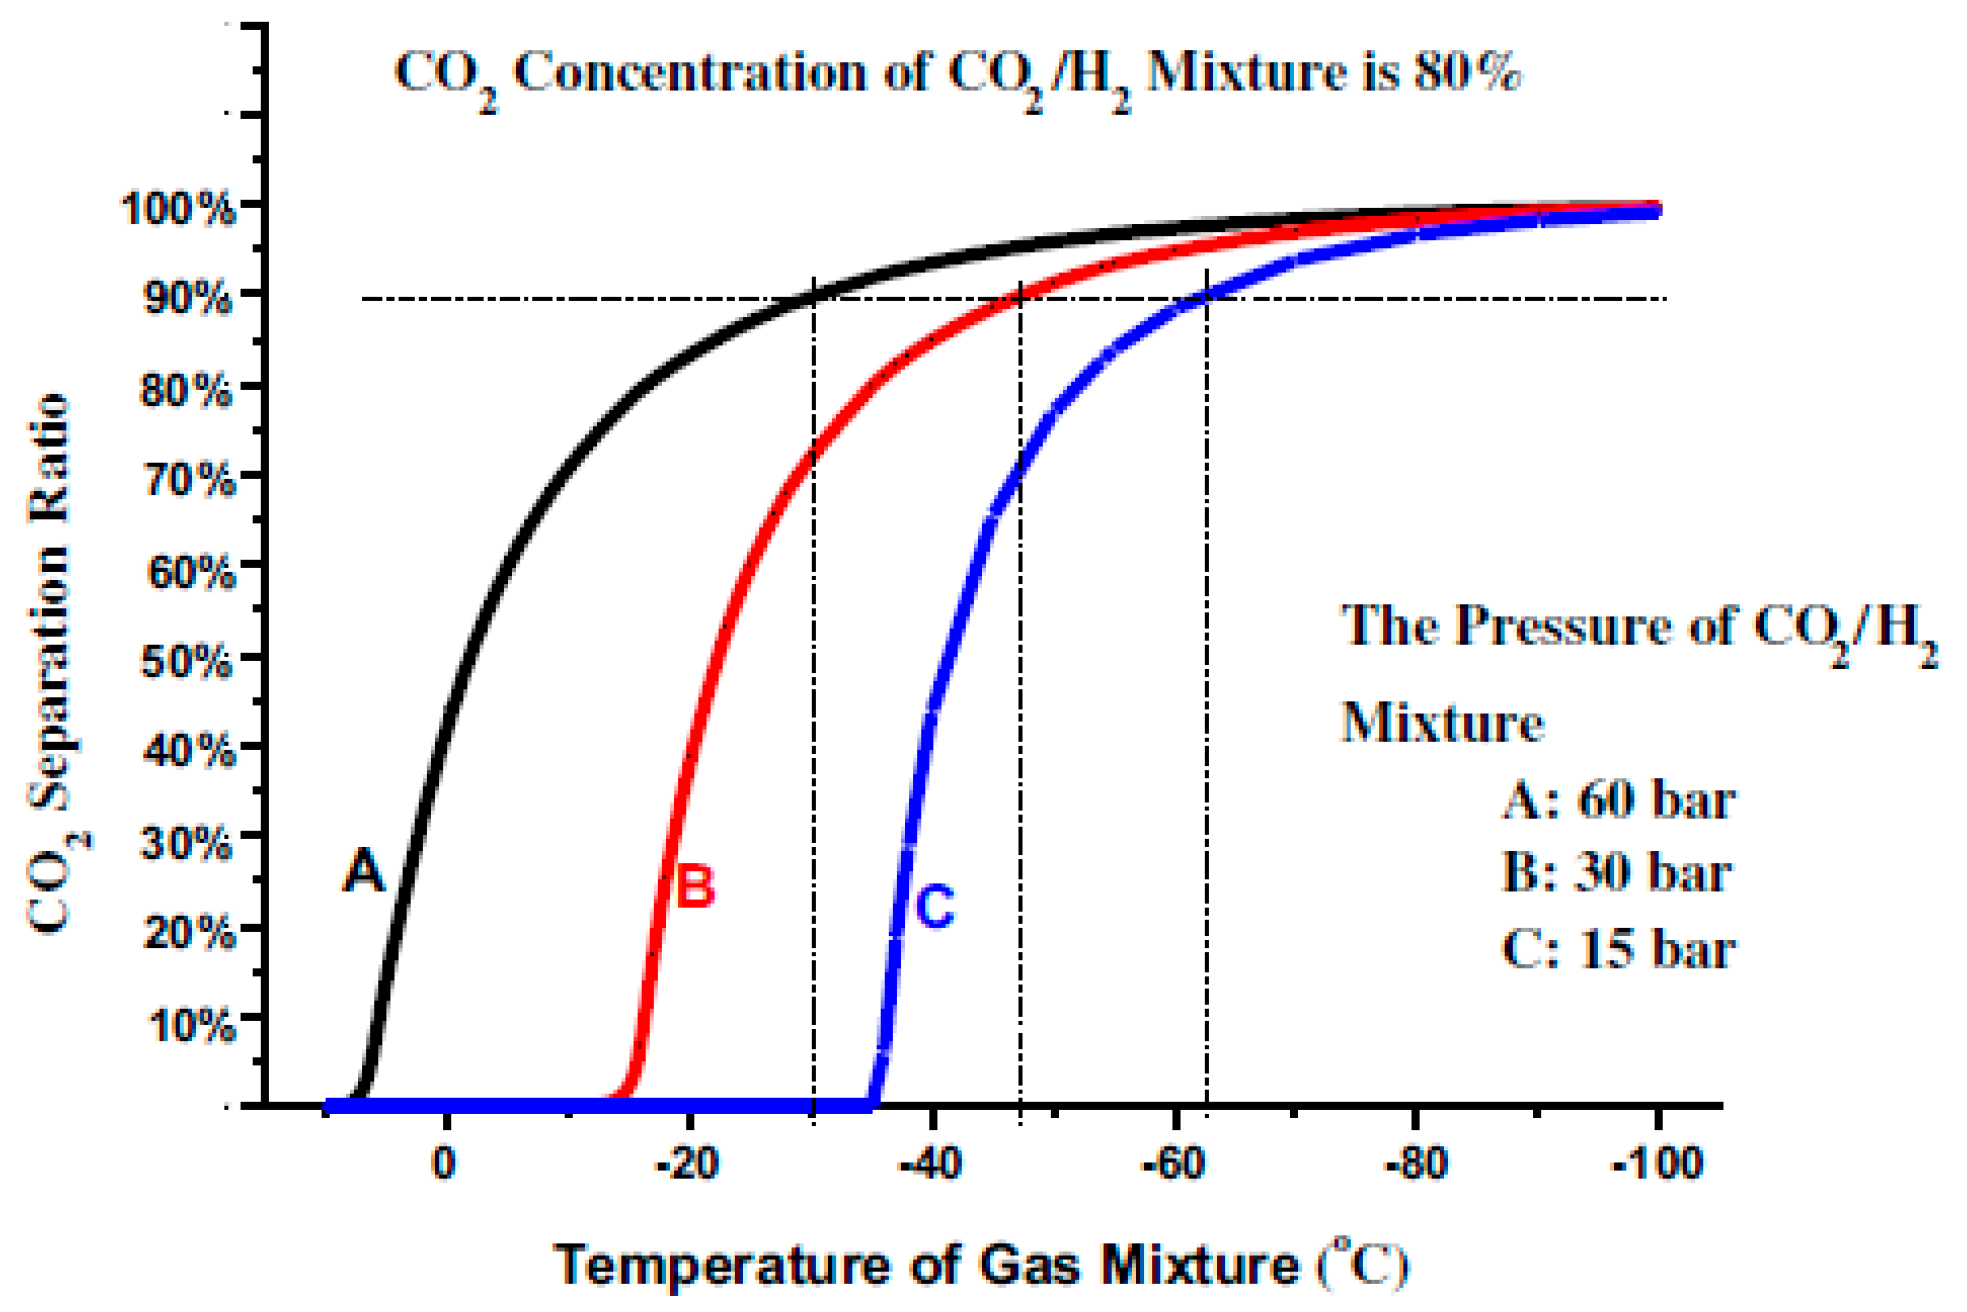
Figure 2 shows that increasing the CO
2 concentration in the mixture to 80 mol % or higher before initiating the separation process prevents CO
2 solidification and decreases cryogenic energy consumption. Effectively increasing the CO
2 concentration in the gas mixture significantly improves the performance of the cryogenic separation method.
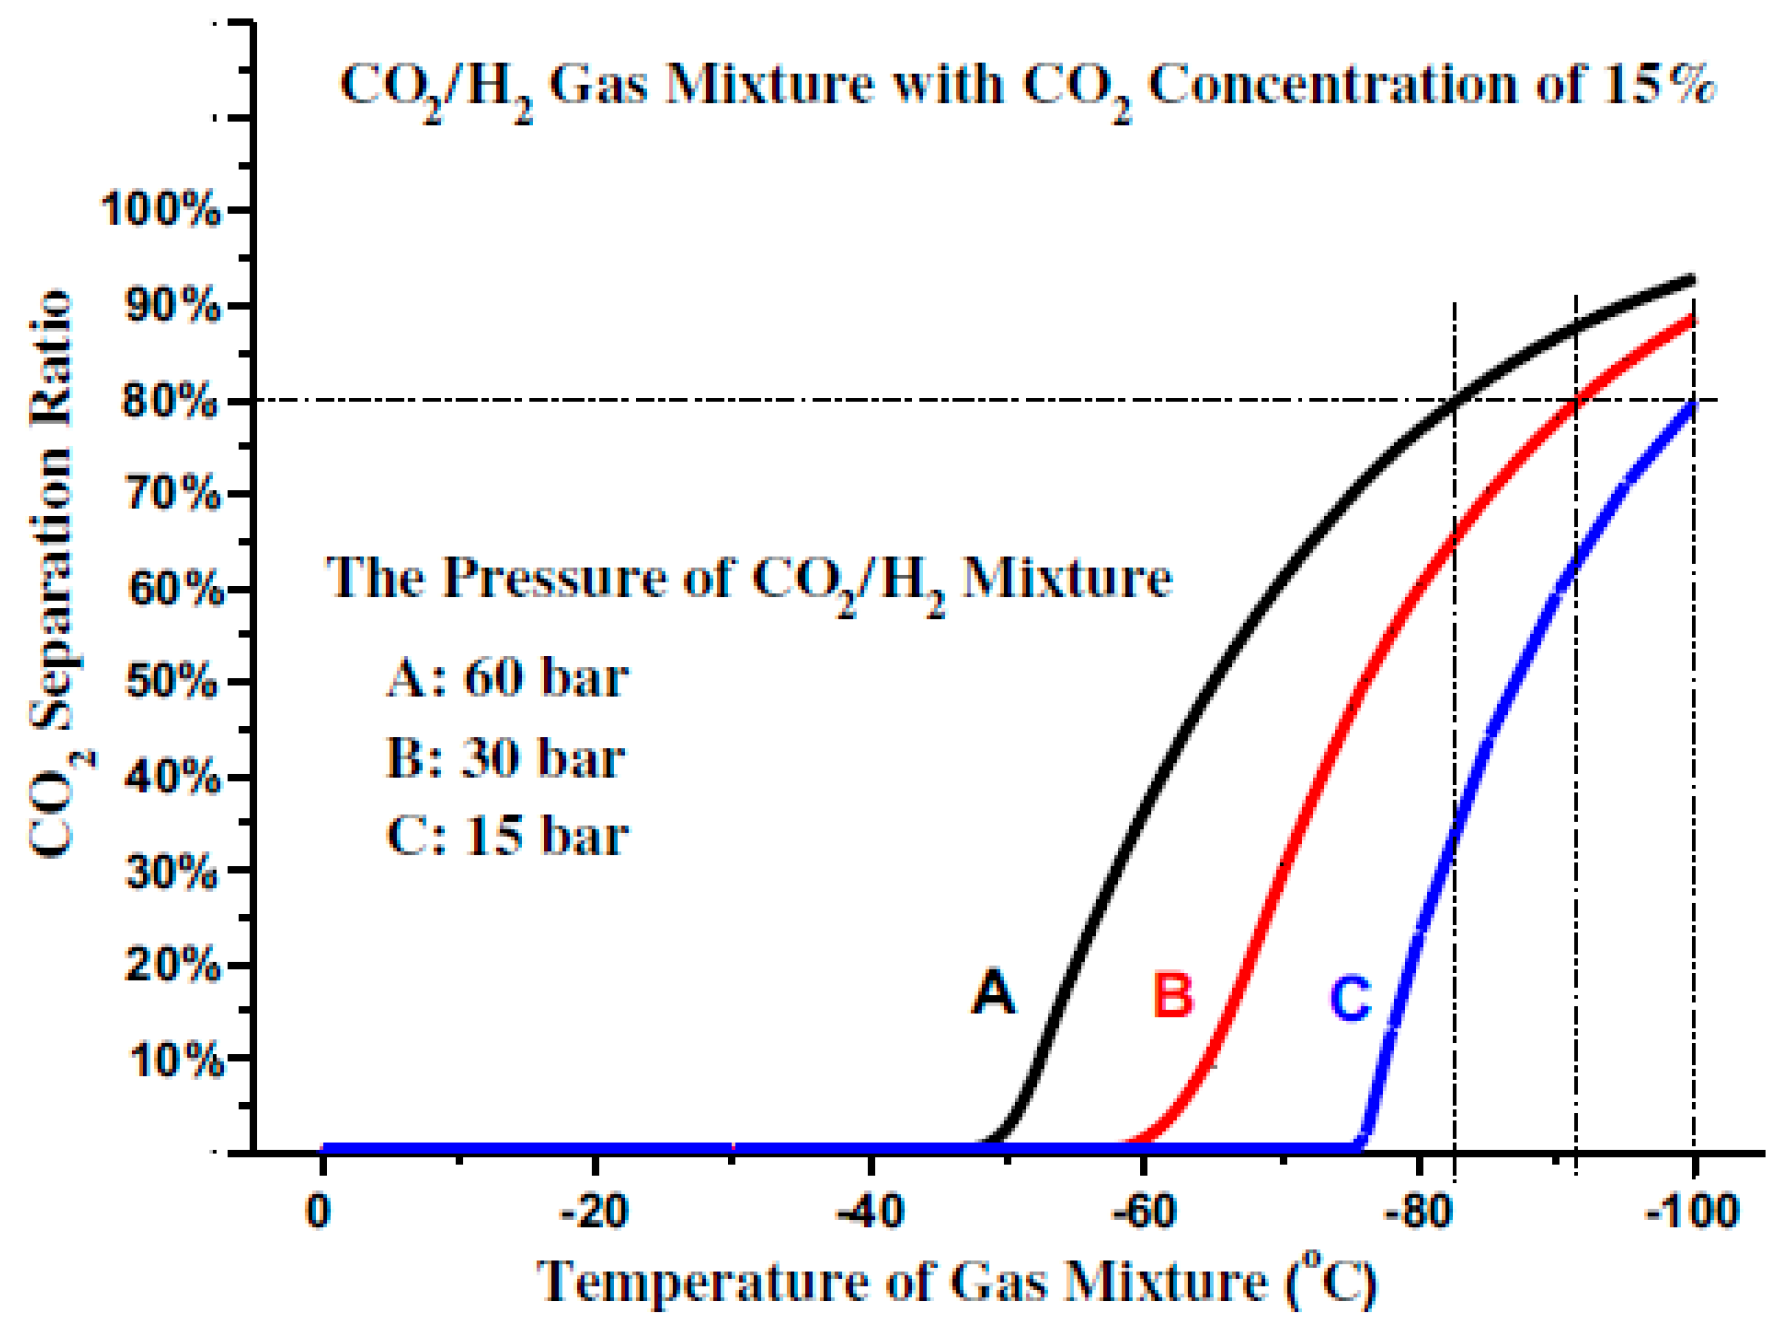
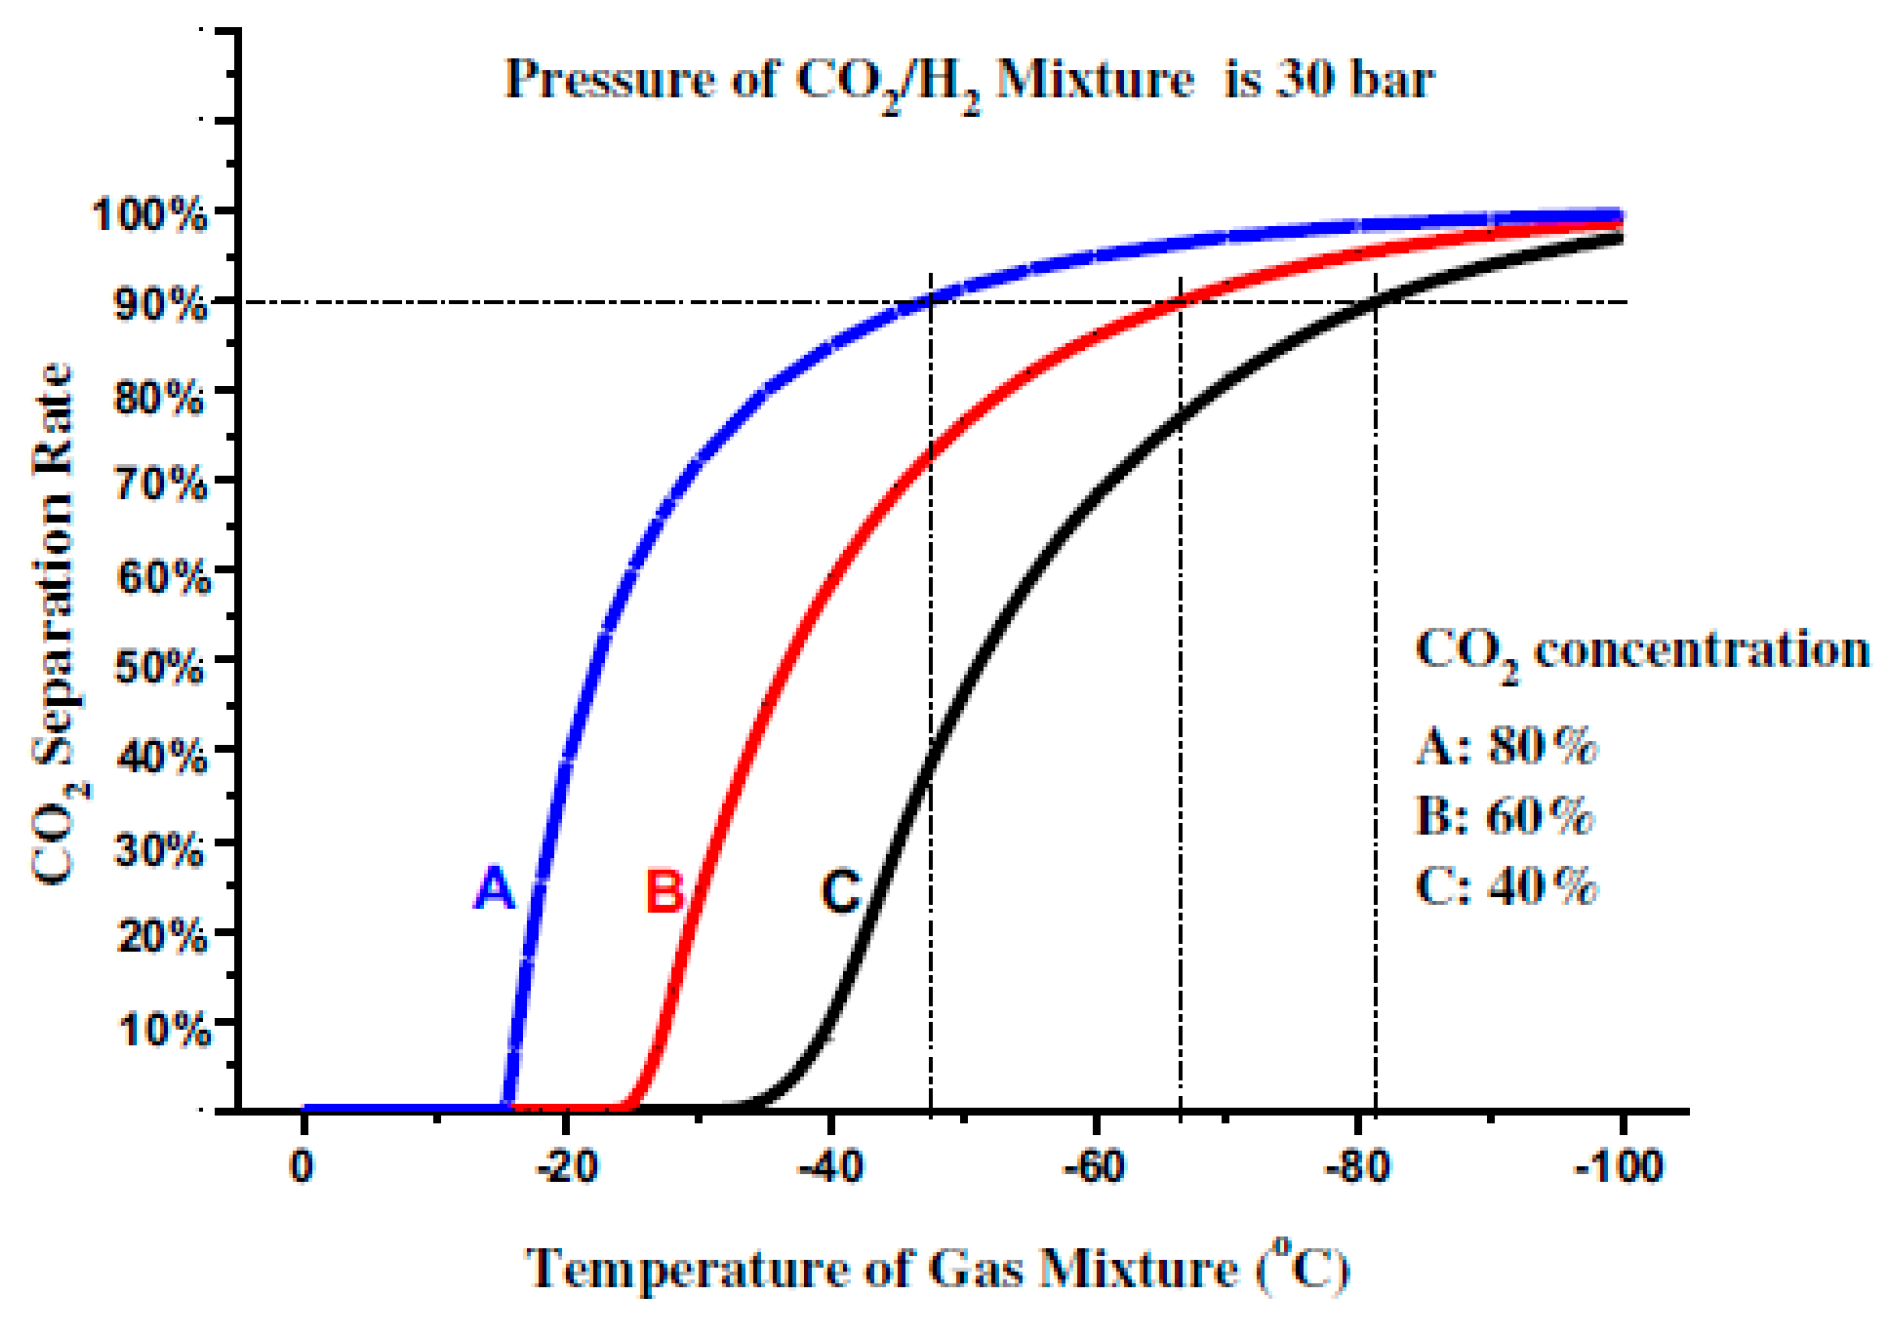
The relationship between the CO
2 separation ratio and the temperature of the CO
2/H
2 mixture under different pressures, at a CO
2 concentration of 80 mol %, is shown in
Figure 3. Under the mixture pressures of 15, 30, and 60 bar, the temperature should be lowered to about −63 °C, −48 °C, and 30 °C, respectively, to separate 90% of the CO
2 from the mixture. In other words, enhancing the mixture pressure can also effectively increase the separation temperature of CO
2, thereby improving the performance of the CO
2 cryogenic method.
If the concentration of the CO
2 in the gas mixture is very low, the increase in the CO
2 liquefaction temperature will be constrained by the enhancement of the gas mixture pressure as shown in
Figure 4.
1.2. CO2 Capture from IGCC GE Process Gases by Expansion after Cryogenic Separation
Cryogenics and hydrate techniques can be used for CO
2 capture from process streams containing mainly CO
2 and hydrogen. The baseline approach for the cryogenic process is to cool down the gas under pressure to temperatures where CO
2 can be condensed and removed in liquid form at an elevated pressure while the hydrogen stays in the gas phase. Under the project funded by The Cooperative Research Centre for Greenhouse Gas Technologies (CO2CRC), a laboratory pilot plant was designed in 2007 and built in 2008 at the Clean Gas Technology Australia of Curtin University to capture CO
2 by a combined cryogenic-hydrate method. Experimental results using this method have verified that 79% of CO
2 can be captured by cryogenics, plus another 11% by hydrates using a newly identified promoter for the IGCC GE process gas [
9]. Another more efficient method of capturing 11% CO
2 after the cryogenic section was proposed by expanding the depleted gas overhead of the separator to 24 bar, which will be described in this paper, including an energy-saving scheme.
This work is to show and discuss the experimental results obtained from a series of tests carried out using the laboratory pilot plant in order to achieve the CO
2 capture rates by expansion after the cryogenics section using nozzles with various sizes of orifices. The IGCC GE gas compositions, as shown in
Table 1 below, were originally prepared according to the design report [
10].
The objective of this work is to perform a modification of the existing laboratory pilot plant so that the energy available in the system at high pressure can be used to capture another 11% of CO
2 from the outlet gas of the cryogenics section containing 12–15 mol % CO
2 to achieve an overall CO
2 capture rate of 90 mol %. An energy-saving scheme was also developed for the combined capture/recovery scheme using HYSYS simulation software for the IGCC GE power plant with a gross power generation of 740 MW [
12]. The mechanism and potential of the energy-saving scheme in other cryogenic CO
2 capture processes for a coal-based hydrogen production process were also presented by Xu et al. [
8]. They proposed that the total energy penalty in the CO
2 capture process via the novel CO
2 cryogenic liquefaction and separation method for a gas mixture composed of 80% CO
2 and 20% H
2 is 35.81 MW. However, this cryogenic energy-saving scheme will not be discussed in this work.
2. Materials and Methods
2.1. Flow Scheme, Equipment and Material Used
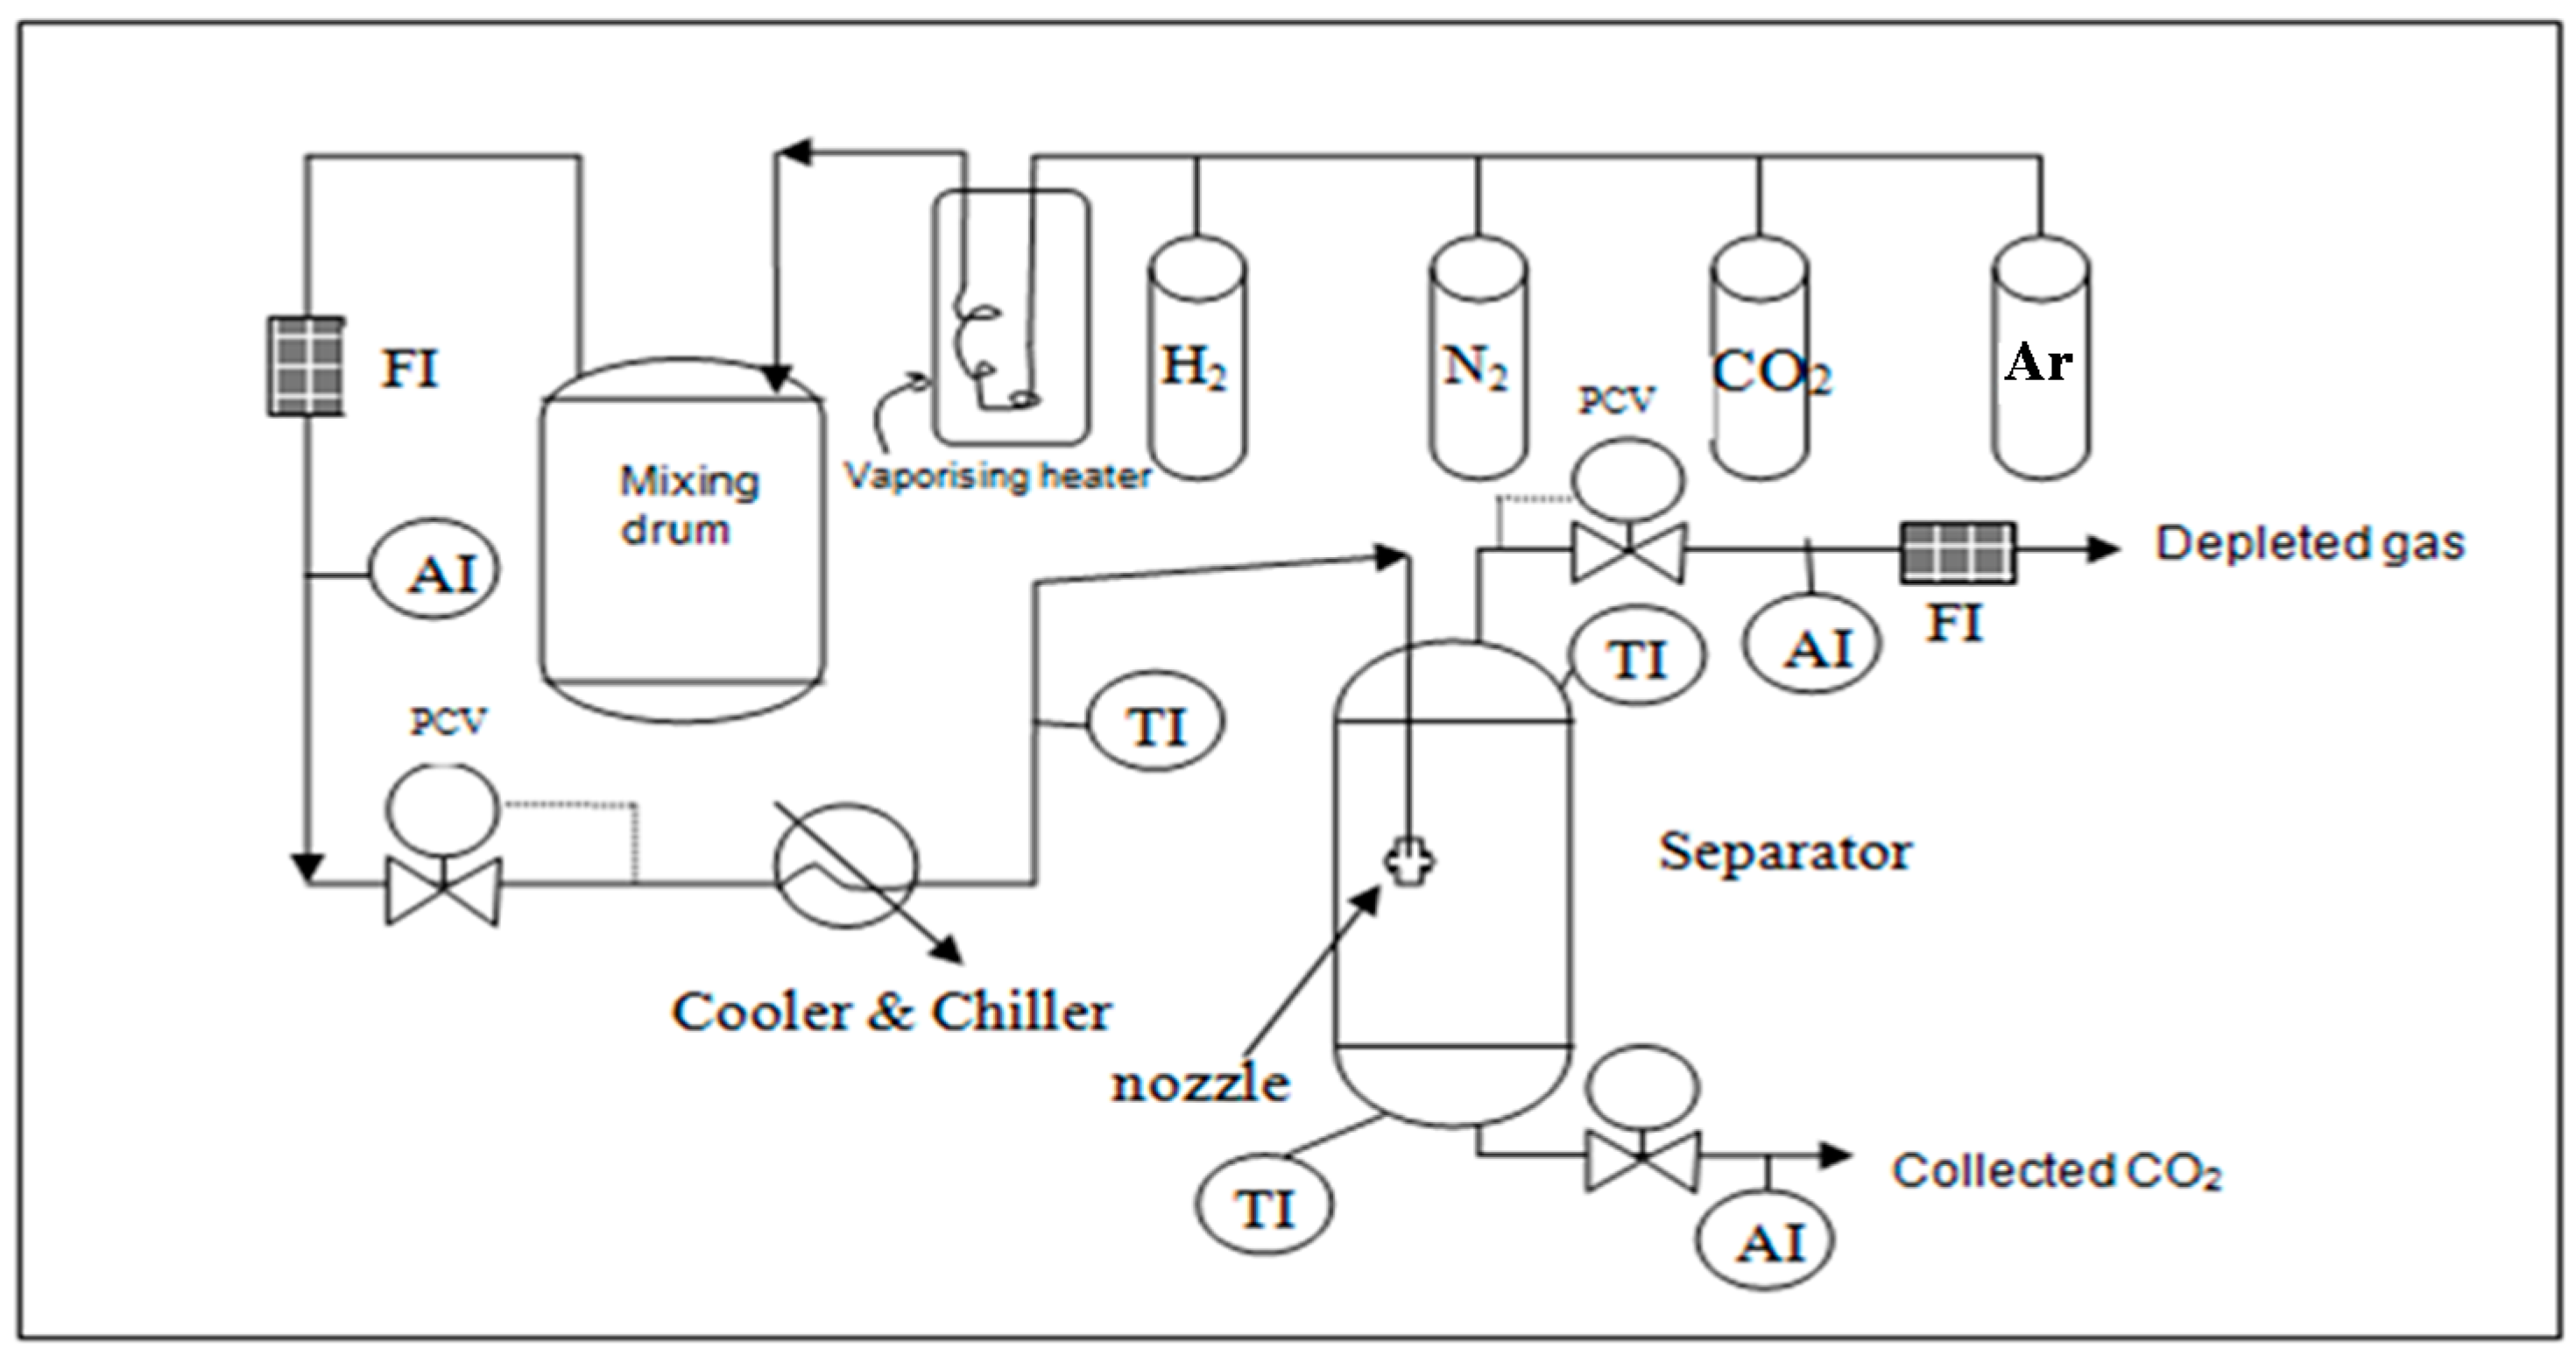
Figure 5 shows the flow scheme for capture of CO
2 from the IGCC GE process gases by expansion that was investigated in this work.
First, the nozzle with a particular size of orifice was installed at the inlet line of the separator in order that the inlet pressure of the separator could be reduced to 24 bar or lower as designed by CO2CRC. In each experiment, a nozzle with one orifice size was selected from a range of 0.1, 0.2, 0.3 and 0.4 mm. The process gases were then prepared using the pressure regulators at the gas cylinders. The mix drum was filled by gas mixed to a composition of the IGCC GE process gases outlet overhead of the separator (after cryogenics section at 57 bar) which equaled 15 mol % CO
2 approximately [
11]. The pressure of the gas mixture in the mix drum was filled to about 110 bar thereby ensuring that sufficient gas at the fixed composition was available throughout the experiment. The required composition of the gas mixture (at the IGCC GE process gas composition of 15 mol % CO
2 approximately as shown in Table 3) was verified using a CO
2 analyzer after the gases were mixed in the mixing drum.
The gas mixture was fed to the heat exchanger which was simulated by chilling coils submerged in methanol with dry ice bath. The feed pressure was controlled at an operating pressure (57 bar) and an operating temperature of −55 °C which was achieved before entry to the separator. At these conditions, the condensed CO2 was separated from the overhead gas stream. The liquid CO2 composition was analyzed at the exit. The lean CO2 overhead gas was also analyzed at the exit from the separator. Flash calculations to estimate effectiveness of cryogenic separation of CO2 were performed in HYSYS process simulation environment using Peng-Robinson equation of state.
The temperature of each stream was measured by inline sensors and monitored using a 6 channel Shimaden controller with an accuracy of ±0.1 °C. The cold methanol-ice bath used as a heat exchanger was monitored by a Deluxe Dual Input Thermometer with an accuracy ±0.1 °C. The inlet pressure was controlled by Swagelok high pressure regulators. Swagelok pressure transmitters with 0–120 bar range connected to a Shimaden controller were used for monitoring pressure with an accuracy of ±0.1 bar. An Elster RVG G16 flow meter was used to measure and control gas flow with an accuracy of ±1. A gas alarm CO
2 analyzer (online MSR Polygard (R) analyzer) was installed on the venting line after the flow meter. All measurements were carried out after reaching steady flow and operating conditions for 15 min. All vessels used for experimental set-up were made of carbon steel (CS) and stainless steel (SS) of vertical orientation having the design pressure of 110 bar. Dimension of the vessels are given in
Table 2.
2.2. Operating Procedure
Gas mixtures with a composition of 15 mol % CO
2 approximately were prepared in a separate pressure vessel referred to as the mixing drum (shown in
Figure 5). Mixtures were prepared on a pressure basis using industrial grade gases supplied by BOC Australia. CO
2 was passed through a hot water bath in order to ensure that all of it was in the gas phase. Pressure of each gas to be added was calculated in terms of the desired composition taking into account compressibility factor. Hydrogen, argon, and nitrogen were first mixed together. After that, CO
2 was added slowly allowing for faster stabilization to the total pressure of 110 bar. The mixture was left for 2–3 h to reach equilibrium.
The actual compositions of the gas mixtures were verified using the gas alarm CO2 analyzer by taking two samples, from top and bottom respectively, of the prepared mixture were taken to ensure even distribution of CO2 concentration along the mixing drum. Dry ice was constantly added into the methanol chilling bath, and temperature was controlled at about −55 °C. Hydrogen from a gas cylinder was passed through the chilling coils and separator at a flow rate of about 0.1 m3/h at supplying pressure of 57 bar in order to bring the temperature of the entire system to the desired level. The separator; with two temperature indicators located at the inlet and bottom lines, was gradually chilled to below −50 °C by pouring liquid nitrogen on the outer shell of the vessel inside the insulation. Once the required equilibrium temperature (−55 °C) for the separator was reached, the hydrogen feed was immediately switched to the synthetic gas from the mixing drum at 57 bar. The pressure of the separator was controlled to be at about 24 bar or lower by adjusting the regulator valve of the vent system. Liquid CO2 bottom product was frequently drained to a collecting vessel in order to prevent an overflow of CO2 from the inner separator. The concentration of CO2 in the liquid was analyzed after the equilibrium condition was reached. Lean CO2 overhead gas was passed through the analyzer at near atmospheric pressure (vent system). The actual equilibrium condition in the separator could then be observed when a stable CO2 composition was reached; as measured by the CO2 analyzer, was obtained at the overhead gas off the separator. The inlet separator temperature, at which the CO2 composition became stable was recorded. This value was used in a HYSYS simulation to estimate the amount of CO2 captured at the specified pressure and temperature of the separator.
The quantity of mixture prepared in the mixing drum was sufficient to run the cryogenic experiment for 20–30 min of each run.
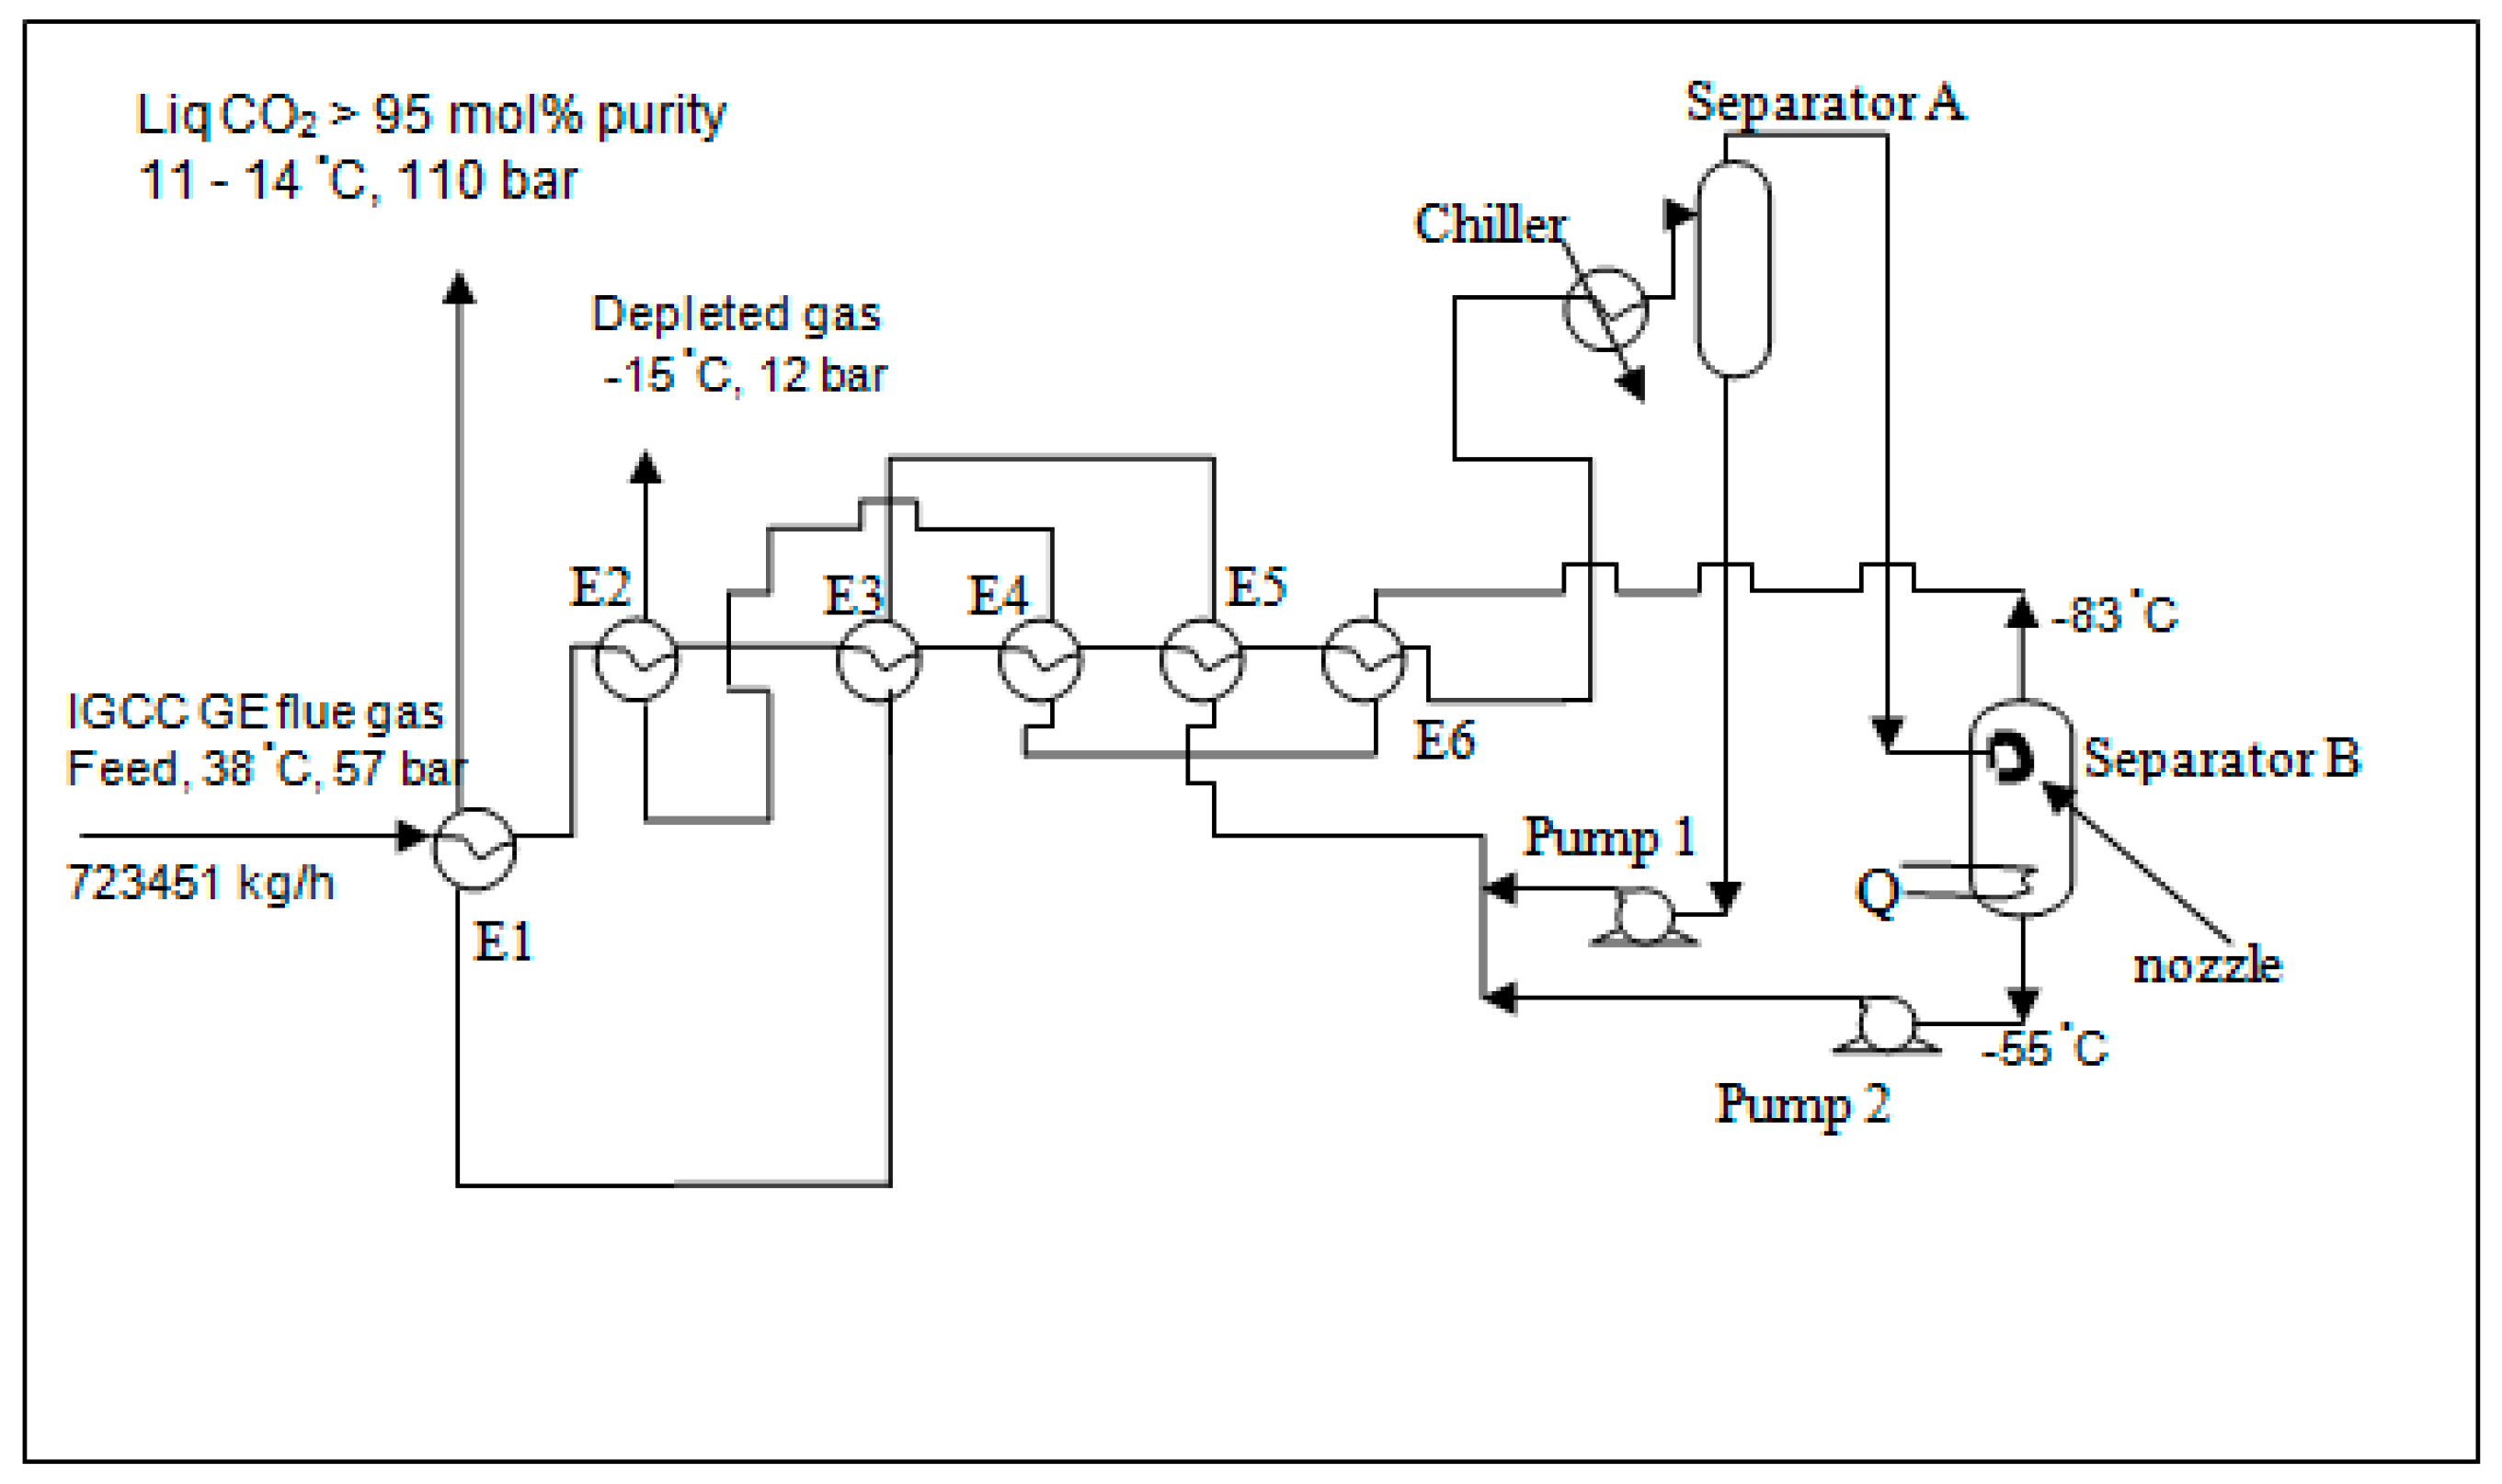
2.3. Energy-Saving scheme for the Capture and Recovery Scheme of CO2 from a 740 MW IGCC GE Combustion Power plant
The HYSYS software was used to simulate the IGCC GE power plant. Consider an energy saving scheme for CO
2 capture by cryogenics for the IGCC GE power plant having a gross power generation of 740 MW as shown in
Figure 6.
The scheme as shown in
Figure 6 is based on the feed gas chilling at 57 bar to −55 °C (subject to the conditions attained from the experiments) causing separation and capture of about 75%–80% of the CO
2 contained in the feed. The captured CO
2 in the form of liquid is then pumped by Pump 1 at −55 °C to 110 bar causing the temperature to rise to about −50 °C which is used to chill the feed gas in the recovery exchangers E5, E3 and E1.
The uncondensed part of the gas composing mainly of hydrogen is then expanded to a lower pressure (supposedly 24 bar) using the nozzles installed at the inlet line of the Separator B which causes solidification of more CO2 at the bottom and chilling to a temperature below −55 °C which could be down to −83 °C approximately. The vent gas mainly comprising of hydrogen is used to chill the feed in the recovery exchangers E6, E4 and E2. The solid CO2 is then heated at the bottom of Separation B to a temperature of −55 °C by an exchanger providing heat load Q. Liquid CO2 is then pumped by Pump 2 to 110 bar causing a temperature rise to about −50 °C. Liquid CO2 from Pumps 1 and 2 are combined and used to chill the feed gas in exchangers E5, E3 and E1.
The total energy consumption for achieving liquid CO2 at about 11 °C and 110 bar is the sum of: Chiller + Pump 1 + Pump 2 + heat supplied at the bottom of Separator B (represented by Q) as shown in Table 4.
Conditions of data used in the simulations are as follows:
The operating temperature of Separator B = the temperature measured at the inlet of the separator in the experiments.
The operating pressure of Separator B = the pressure measured at the vent system of the separator in the experiments.
In the actual experiments, nozzles were used as described earlier in this paper to reduce the pressure in Separator B. However, an expander was positioned at the inlet Separator B in each simulation for the same purpose in using nozzles due to no nozzles installation scheme available in HYSYS simulations.
The efficiency of the chiller was assumed to be 75%.
The simulation data for each operating condition used and the equivalent power consumption for each process unit in
Figure 6 are shown in Table 4.
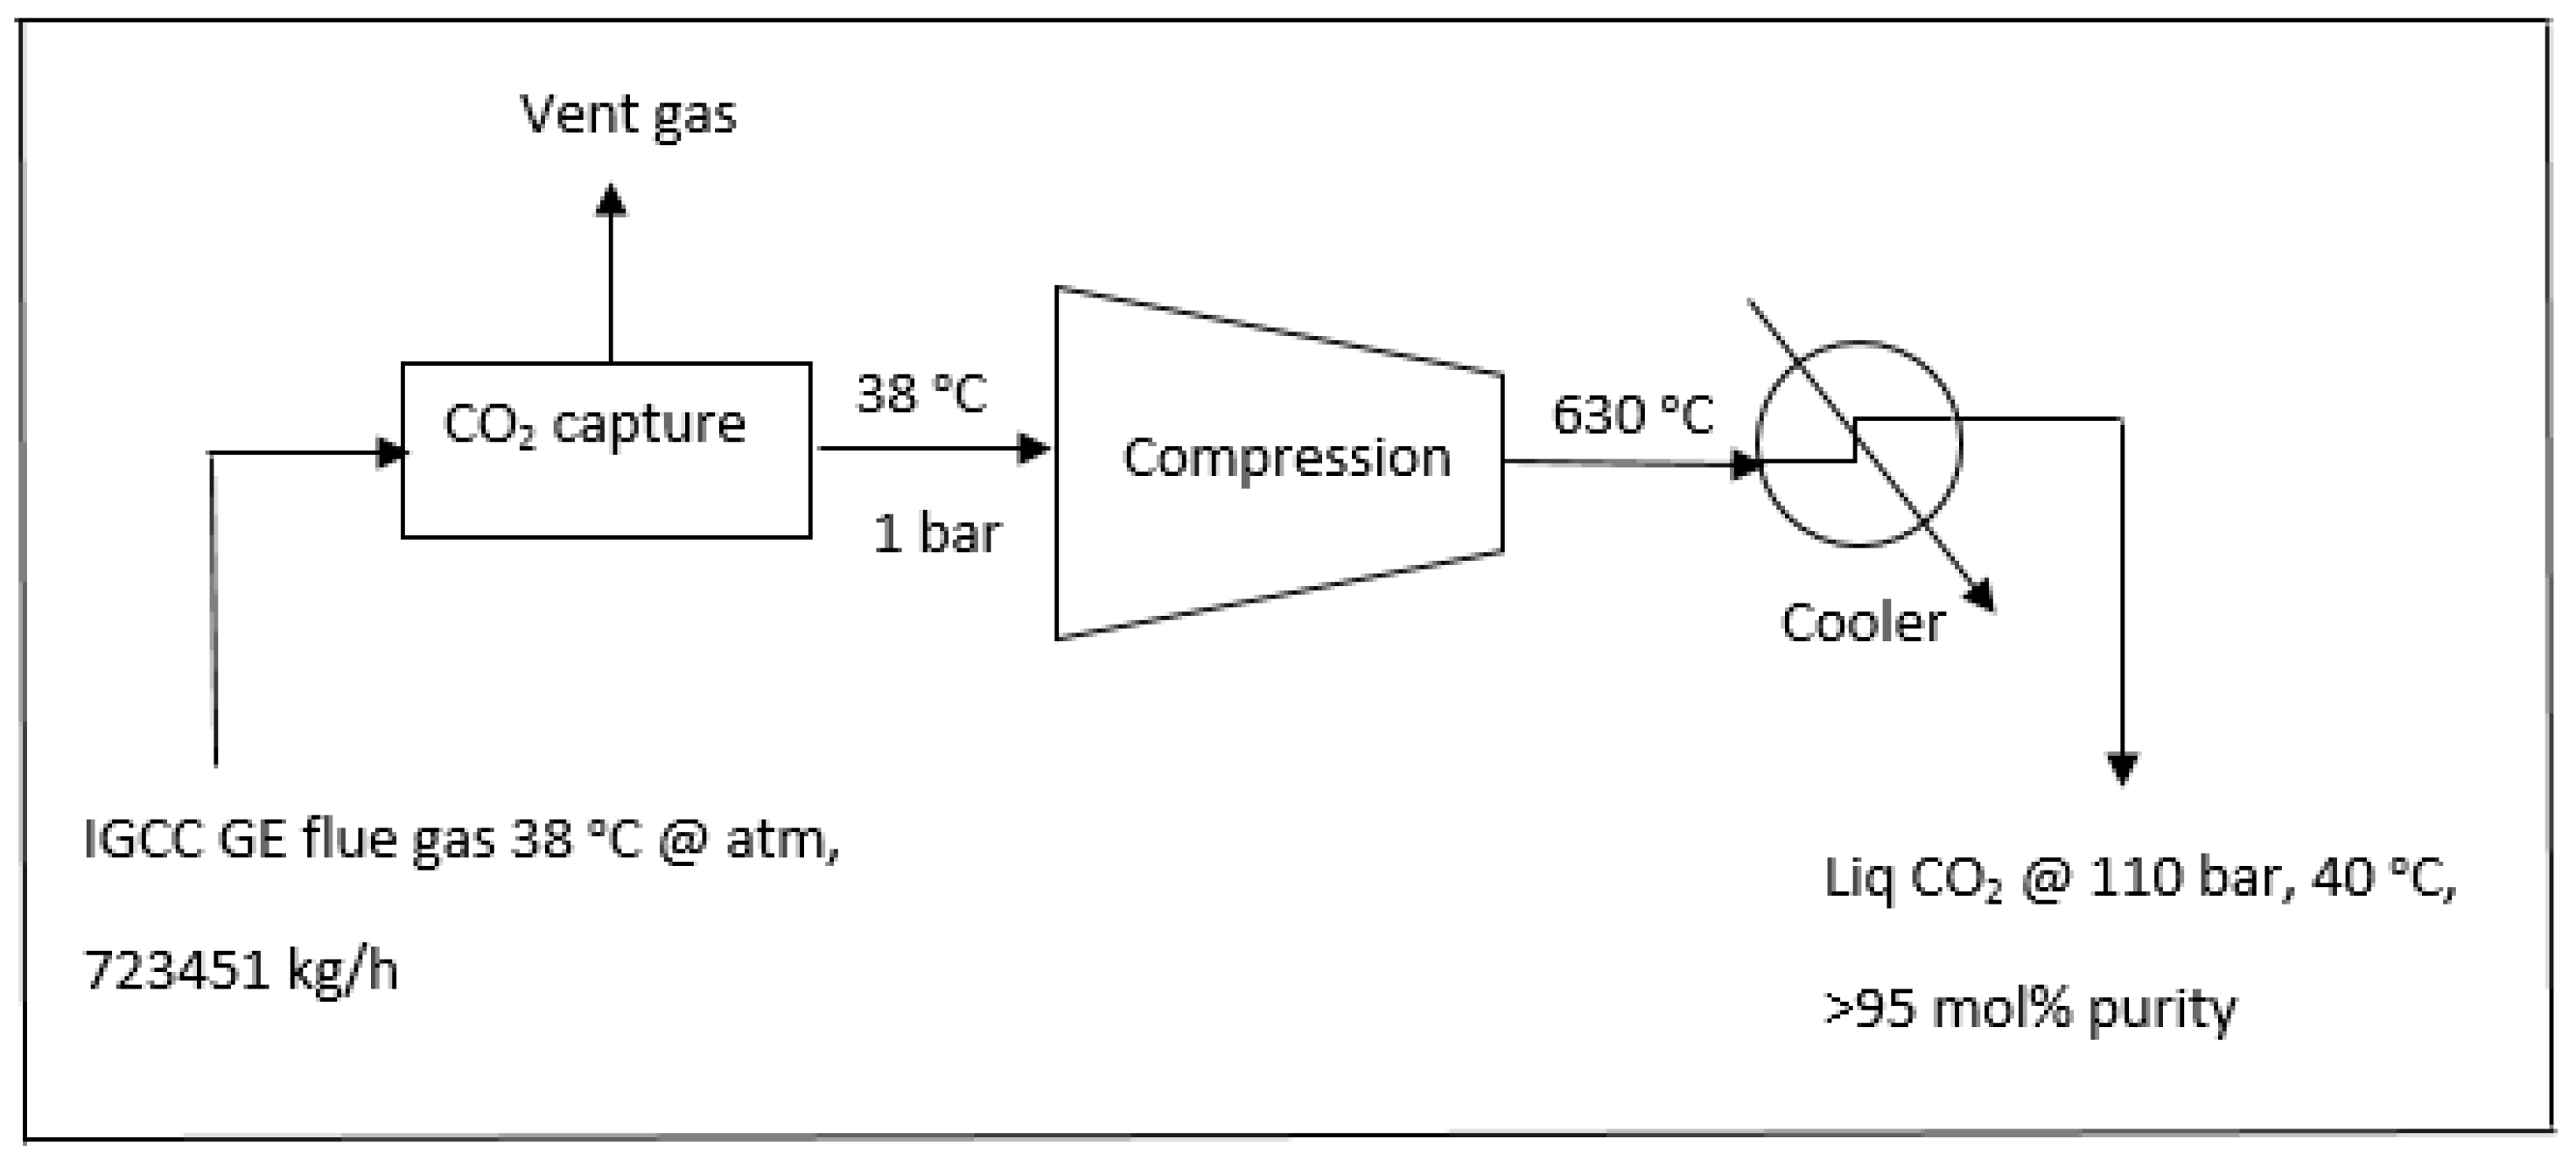
2.4. The Capture Scheme of CO2 from a 740 MW IGCC GE Combustion Power Plant without the Enegy-Saving Scheme
In comparison with
Section 2.3 where the energy saving scheme was performed, the typical 740 MW IGCC GE combustion power plant without process integration was modeled and simulated as shown in
Figure 7.
The energy required for production of CO
2 in a dense phase (110 bar, 40 °C) would be
Compression (single stage): 122.75 MW;
Cooling from 630 °C to 40 °C: 159.31 MW;
Total energy = compression + cooling = 122.75 MW + 159.31 MW = 282.06 MW = 38% of 740 MW
Therefore the total energy to be consumed for the compression and cooling stages would be 38% of the total power generated. The simulation data for operating compressor and cooler in association with the equivalent power consumption for the process in
Figure 7 are also shown in Table 4.
3. Results and Discussion
As shown in
Table 3, the operating pressures at the outlet separator were not obviously related to the nozzle sizes. It was due to the fact that there was a valve installed at the vent system of the separator. Apart from the nozzles, this valve played an important role in the pressure control of the system.
Experimentally, the IGCC GE gas mixtures with up to 15 mol % CO2 were tested using four different sizes of nozzles (0.1, 0.2, 0.3 and 0.4 mm) at the same operating conditions of pressure (57 bar), temperature (−55 °C) and feed flow rate (0.1 m3/hr). Using the orifice nozzle sized 0.1 mm resulted in up to 61% of CO2 captured. The overhead stream contained 6 mol % CO2 and the liquefied CO2 obtained in this case was characterized by a 92 mol % purity on average. As can be observed, there was no confirmed impact of the orifice nozzle size on the concentration of CO2 in the liquid phase. With the various sizes of the orifice nozzles, between 23% and 65% of CO2 was captured from the depleted gas. The nozzle sized 0.3 mm was tested twice by varying the outlet separator pressures. The liquid bottom product contained between 92 and 97 mol % CO2. The best CO2 capture rate, i.e., 65%, was achieved with the use of the 0.2 mm nozzle.
As indicated before, all the experimental results were simulated using HYSYS software for the energy-saving scheme for the capture and recovery of CO
2 from a 740 MW IGCC GE combustion power plant. The details of the flowsheet and the parameters for the simulation are presented above in
Section 2.3. The simulated results are shown in
Table 4 and described as follows.
With the energy-saving scheme, as shown in
Figure 6, the feed gases were gradually cooled down by a series of heat exchangers (E1 to E6) and finally chilled to −55 °C by a chiller before entering separator A. The overhead stream of separator A flowed to separator B with a nozzle installed inside for the purpose of expansion. Additional heat supplied was also installed to the bottom of separator B due to the ultra-cooled bottom liquid. The liquid products off the bottom of both separators were transferred through E5, E3 and E1 by pumps 1 and 2 while the overhead off separator B flowed through E6, E4 and E2 to chill the feed stream. The liquid CO
2 product was obtained at a more than 95 mol % CO
2 concentration at about 110 bar and 11–14 °C.
Based on the simulated results, the CO2 capture rates at the expansion section were likely to drop along with the increasing size of the nozzles. The trial with the 0.3 mm nozzle was done twice, first at 13 bar giving the CO2 capture rate of 9.3%, while the second was done at 17 bar giving a lower CO2 capture rate at 7.8%. The operating pressure of 11 bar at −54 °C using a 0.2 mm nozzle was obviously the best condition for the purpose of CO2 capture as it gave up to 13.6% of CO2 captured by expansion, resulting in a total 92.6% capture rate for the entire cryogenic section. In terms of the total energy required for the process, using 0.1 and 0.2 mm nozzles could capture more than 90% of CO2 in the total cryogenic section. However, the process using the 0.2 mm nozzle required slightly less energy, 7.6 MW. The simulated typical scheme required a total energy of 282 MW which was the highest energy required compared to all the other schemes.
5. Conclusions
For the IGCC GE process gas scheme, an efficient method for capturing 11% CO2 after the cryogenic section was proposed by expanding the depleted gas overhead of the separator to 24 bar (or less) using nozzles with various sizes of orifices (0.1–0.4 mm) at low temperatures (−55 °C). The experimental results obtained using the lab pilot plant showed that the best CO2 capture rate (65%) was achieved with the use of a 0.2-mm-orifice nozzle, resulting in the overall CO2 capture rate obtained by cryogenics and expansion at 92.6%.
Using the HYSYS software to simulate the typical flow schemes and the energy-saving scheme at 10, 11, 13, 16 and 17 bar showed that the energy-saving scheme consumed between 54 and 58 MW. The equivalent power consumption for the energy-saving scheme varied between 7.4%–7.8% of the total power generated at 740 MW.


