Evaluation of Carbon-Coated Graphite as a Negative Electrode Material for Li-Ion Batteries
by
 and
and
Varvara Sharova
1,2, 
Arianna Moretti
1,2,*,
Guinevere A. Giffin
1,2,
Diogo Vieira Carvalho
1,2 and
Stefano Passerini
1,2,* 1
Helmholtz Institute Ulm (HIU), Helmholtzstrasse 11, 89081 Ulm, Germany
2
Karlsruhe Institute of Technology (KIT), P.O. Box 3640, 76021 Eggenstein-Leopoldshafen, Germany
*
Authors to whom correspondence should be addressed.
C 2017, 3(3), 22; https://doi.org/10.3390/c3030022
Submission received: 12 June 2017
/
Revised: 26 June 2017
/
Accepted: 28 June 2017
/
Published: 4 July 2017
(This article belongs to the Special Issue Batteries: Recent Advances in Carbon Materials 2017)
Abstract
:Low-cost and environmentally-friendly materials are investigated as carbon-coating precursors to modify the surface of commercial graphite for Li-ion battery anodes. The coating procedure and final carbon content are tuned to study the influence of the precursors on the electrochemical performance of graphite. Thermogravimetric analysis (TGA) and Brunauer–Emmett–Teller (BET) surface area analysis are used to characterize the carbon coating content and the surface area, respectively, whereas X-ray diffraction (XRD) and Raman spectroscopy allow tracking of the graphite’s structural changes and surface amorphization. In general, the coating reduces the first cycle coulombic efficiency by 3%–10% compared to pristine graphite due to the increase of the surface area available for the continuous electrolyte decomposition. However, the use of citric acid as a carbon source (5 wt %) improves the rate capability of graphite, resulting in the specific delithiation capacity at 3C of 228 mAh g−1 vs. 211 mAh g−1 for the uncoated graphite. The attempt to reduce the coating amount from 5 wt % to 2 wt % results in a lower rate capability, but the first cycle coulombic efficiency is similar to that of pristine graphite.
1. Introduction
Graphite is the anode material of commercial Li-ion batteries because it offers low working potential, prolonged cycle life, and relatively low cost. However, during the cell formation a portion of the lithium made available from the positive electrode is consumed (irreversibly lost) to form a stable solid electrolyte interphase (or SEI) on the graphite surface [1]. Therefore, the coulombic efficiency only reaches about 90% in the first cycle, thus resulting in a permanent capacity loss of the cell. To address the irreversible losses during the first cycle, graphite with low surface area (i.e., below 10 m2g−1) is generally preferred due to the lower extent of electrolyte decomposition reactions. Another limitation of graphite is its poor rate performance, especially at reduced (sub-ambient) temperatures where lithium metal deposition may occur. For this, reduced graphite particle size would positively affect the solid-state lithium diffusion, leading to higher delivered capacity at high rates [2]. However, the corresponding higher surface area would result in higher SEI formation and, thus, higher first cycle irreversible capacity loss. Other factors such as particle morphology, electrode thickness, porosity, choice of binder, and electrolyte composition affect the rate capability of graphite as well [3,4,5]. Furthermore, surface properties (e.g., presence of defects and resistivity of the passivation layer) are also important as a fast charge transfer at the interface of graphite with the electrolyte, and the current collector is a key factor for high rate performance.
These considerations drive the interest in graphite surface modification via polymers [6], metals [7], and carbon coatings [8,9,10,11]. Focusing on this latter case, it has been reported that amorphous carbon, being isotropic, allows random Li+ intercalation, which may lead to a better rate capability of carbon-coated graphite [11]. Improved cycling performance of carbon-coated graphite in the electrolytes containing propylene carbonate (PC) has also been reported to show the protective effect of the coating towards solvent co-intercalation [12].
Several research groups have been working on the use of different polymers as carbon precursors. For example, Wang et al. [11] coated artificial graphite with a thin carbon layer derived from glucose. They concluded that the coating could increase the specific capacity and initial coulombic efficiency. The best results were obtained using an aqueous solution (5 wt %) of glucose. Nozaki et al. [10] rationalized the use of different thermoplastic polymers as carbon sources, dividing them into three categories, based on the amount of carbon residue, which directly influences the irreversible capacity loss during the first charge (lithiation) and cycling performance.
Based on the literature survey, the expected performance improvement upon carbon coating is not always observed as it strongly depends on the amount and nature of the carbon layer, the graphite characteristics, and the electrolyte composition [5,12,13]. This makes data comparison very difficult, and thus each case has to be evaluated individually via a systematic investigation. In addition, the coating process should be cost competitive and not detrimental to the environmental. Thus, the carbon precursor should be readily available and the process should employ a relatively low temperature and reduced organic solvent amounts.
Along these lines, we systematically investigated the effect of different carbon precursors on the electrochemical performance of graphite anodes, focusing on non-toxic, cheap, and abundant compounds. The influence of the material preparation and the amount of carbon residue was evaluated as well. The electrochemical tests were conducted using graphite electrodes with loadings, appropriate for application in lithium-ion batteries (2.4–2.7 mAh cm−2).
2. Results
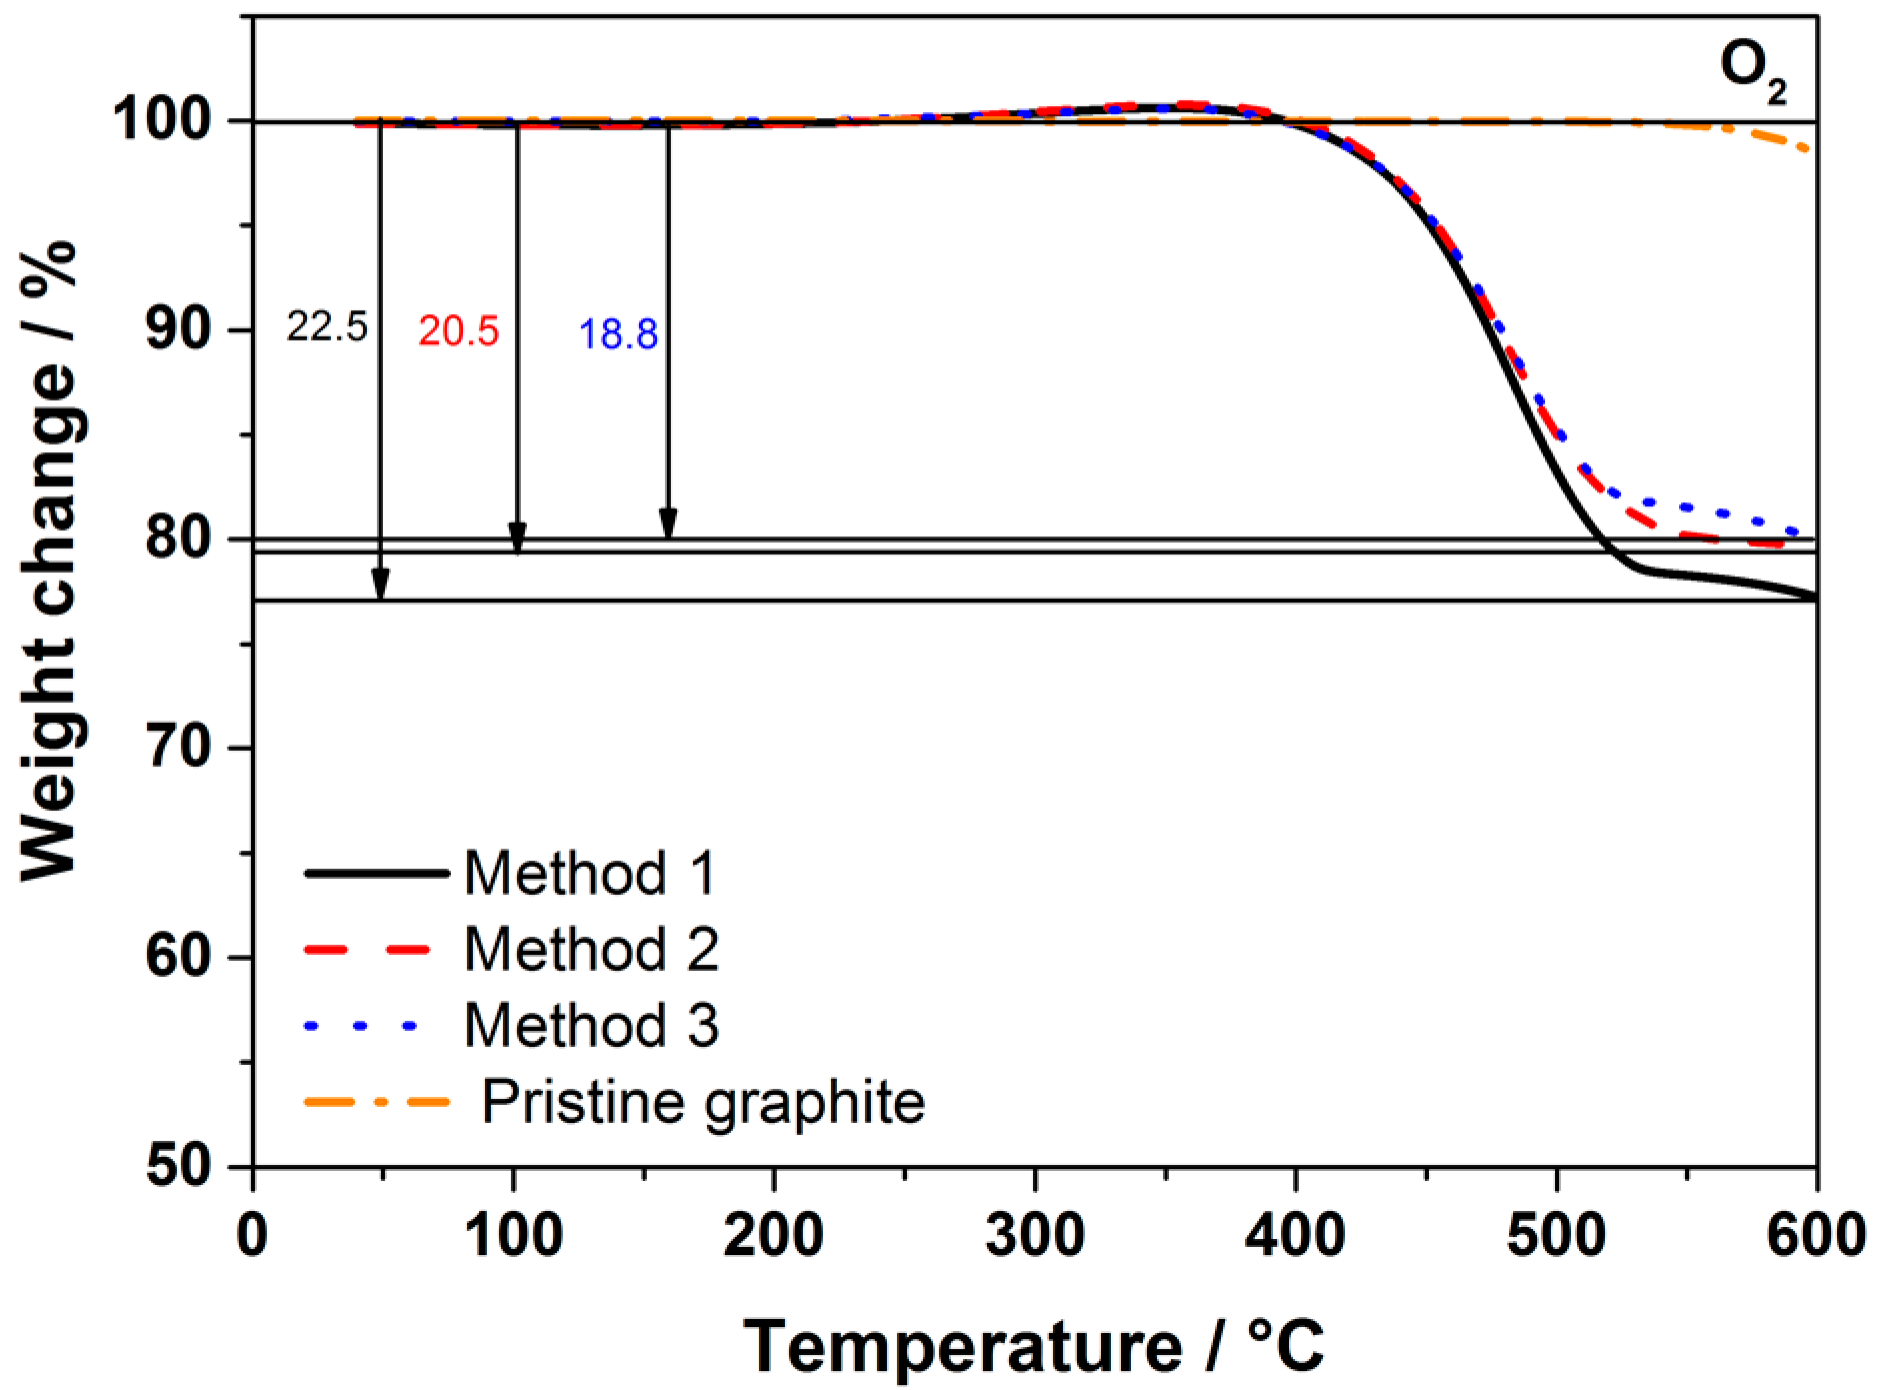
The choice of carbon precursors was based on the goal of limiting the environmental impact associated with the coating process. Therefore, precursors requiring processing in organic solvents or releasing toxic compounds during the thermal treatment (e.g., poly(vinyl chloride)) [10] were not considered. Glucose, sucrose, and citric acid (CA) have been extensively studied as carbon sources for positive and negative electrode coatings [14,15,16,17]. Polymer-type precursors, such as poly(acrylic acid) (PAA) and poly(vinyl alcohol) (PVA), which possibly form a more homogeneous network around the graphite particles, thus leading to a better dispersion of carbon on the surface, were also investigated [10,18,19]. For the selection of the most suitable coating method, sucrose was used as a carbon source and the graphite:sucrose weight ratio was set to 1:1. Figure 1 shows the Thermogravimetric analysis (TGA) traces of the carbon-coated graphite obtained using the three methods, which are described in the experimental section and summarized in Table 1. Pristine graphite is stable up to 550 °C; therefore, the weight loss at lower temperatures is mainly attributed to the carbon coating. TGA results of the coated graphite using sucrose via three synthesis routes revealed that the coating accounts for about 20 wt % of the total mass, independent of the mixing method.
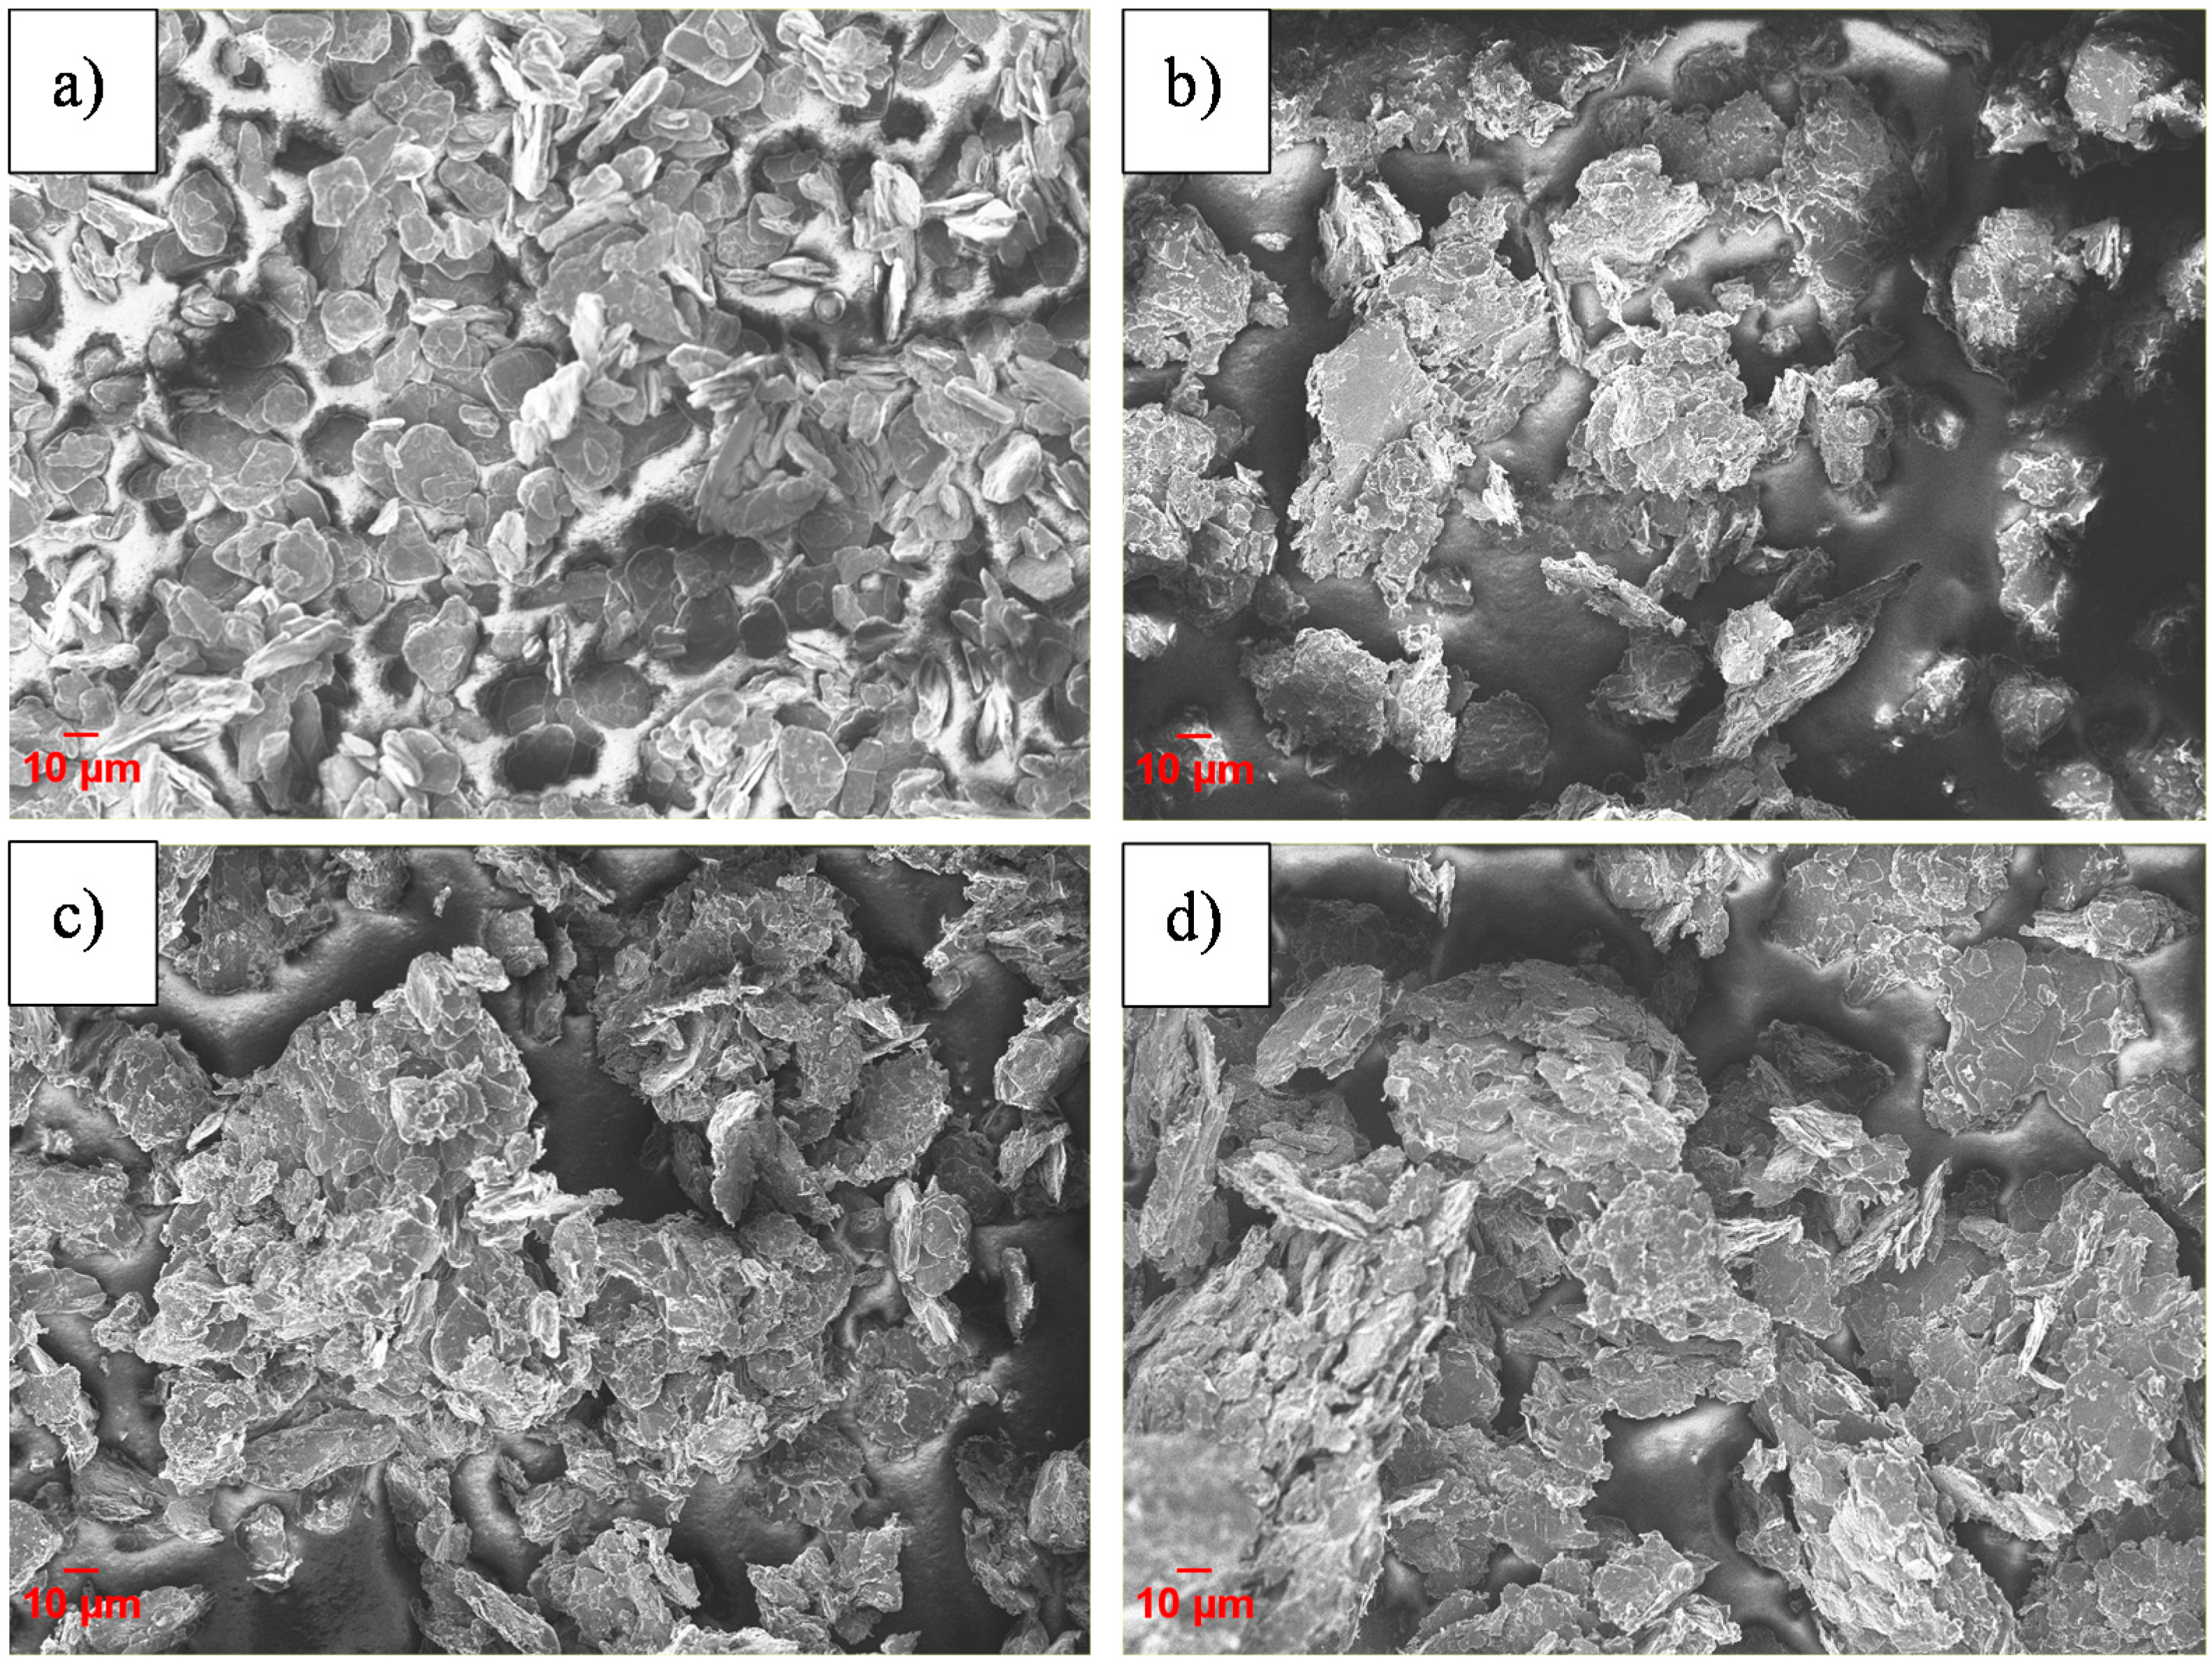
Figure 2 shows the scanning electron microscopy (SEM) images of the pristine and coated graphite materials. In all coated samples, but especially in those obtained via methods 2 and 3, the graphite particles are agglomerated. Method 1 was selected for further investigations since “wet” coating methods yield more homogeneous coating layers with respect to “dry” methods [14], and the introduction of the ball milling step (method 3) did not lead to any clear advantage. SEM images of the carbon-coated samples show that all synthesis procedures resulted in the modification of the graphite surface, which appears rougher than that of pristine graphite. This indicates the presence of a coating layer, which is, however, difficult to visualize by SEM.
Method 1 was then extended to glucose and PAA as carbon sources, while maintaining the 1:1 graphite:precursor weight ratio. The carbon yield obtained with glucose was similar to that of sucrose (~20 wt %), whereas the use of PAA as a precursor yielded a lower amount of carbon (about 13 wt %, result not shown here). Since a high content of amorphous carbon can exacerbate the irreversible reactions taking place at the anode/electrolyte interface [9,10], 5 wt % of residual carbon was targeted for the coatings using all precursors. The characteristics of the coated samples are reported in Table 2. It is interesting to note that, although the amount of carbon coating is almost the same when employing water solutions of glucose and citric acid, the Brunauer-Emmett-Teller (BET) surface area of the coated samples increases with respect to that of pristine graphite. In the case of sucrose, the surface area of the final product is three times higher. An inverse effect is obtained with the polymeric precursors, leading to comparable or smaller surface areas of the coated samples with respect to pristine graphite.
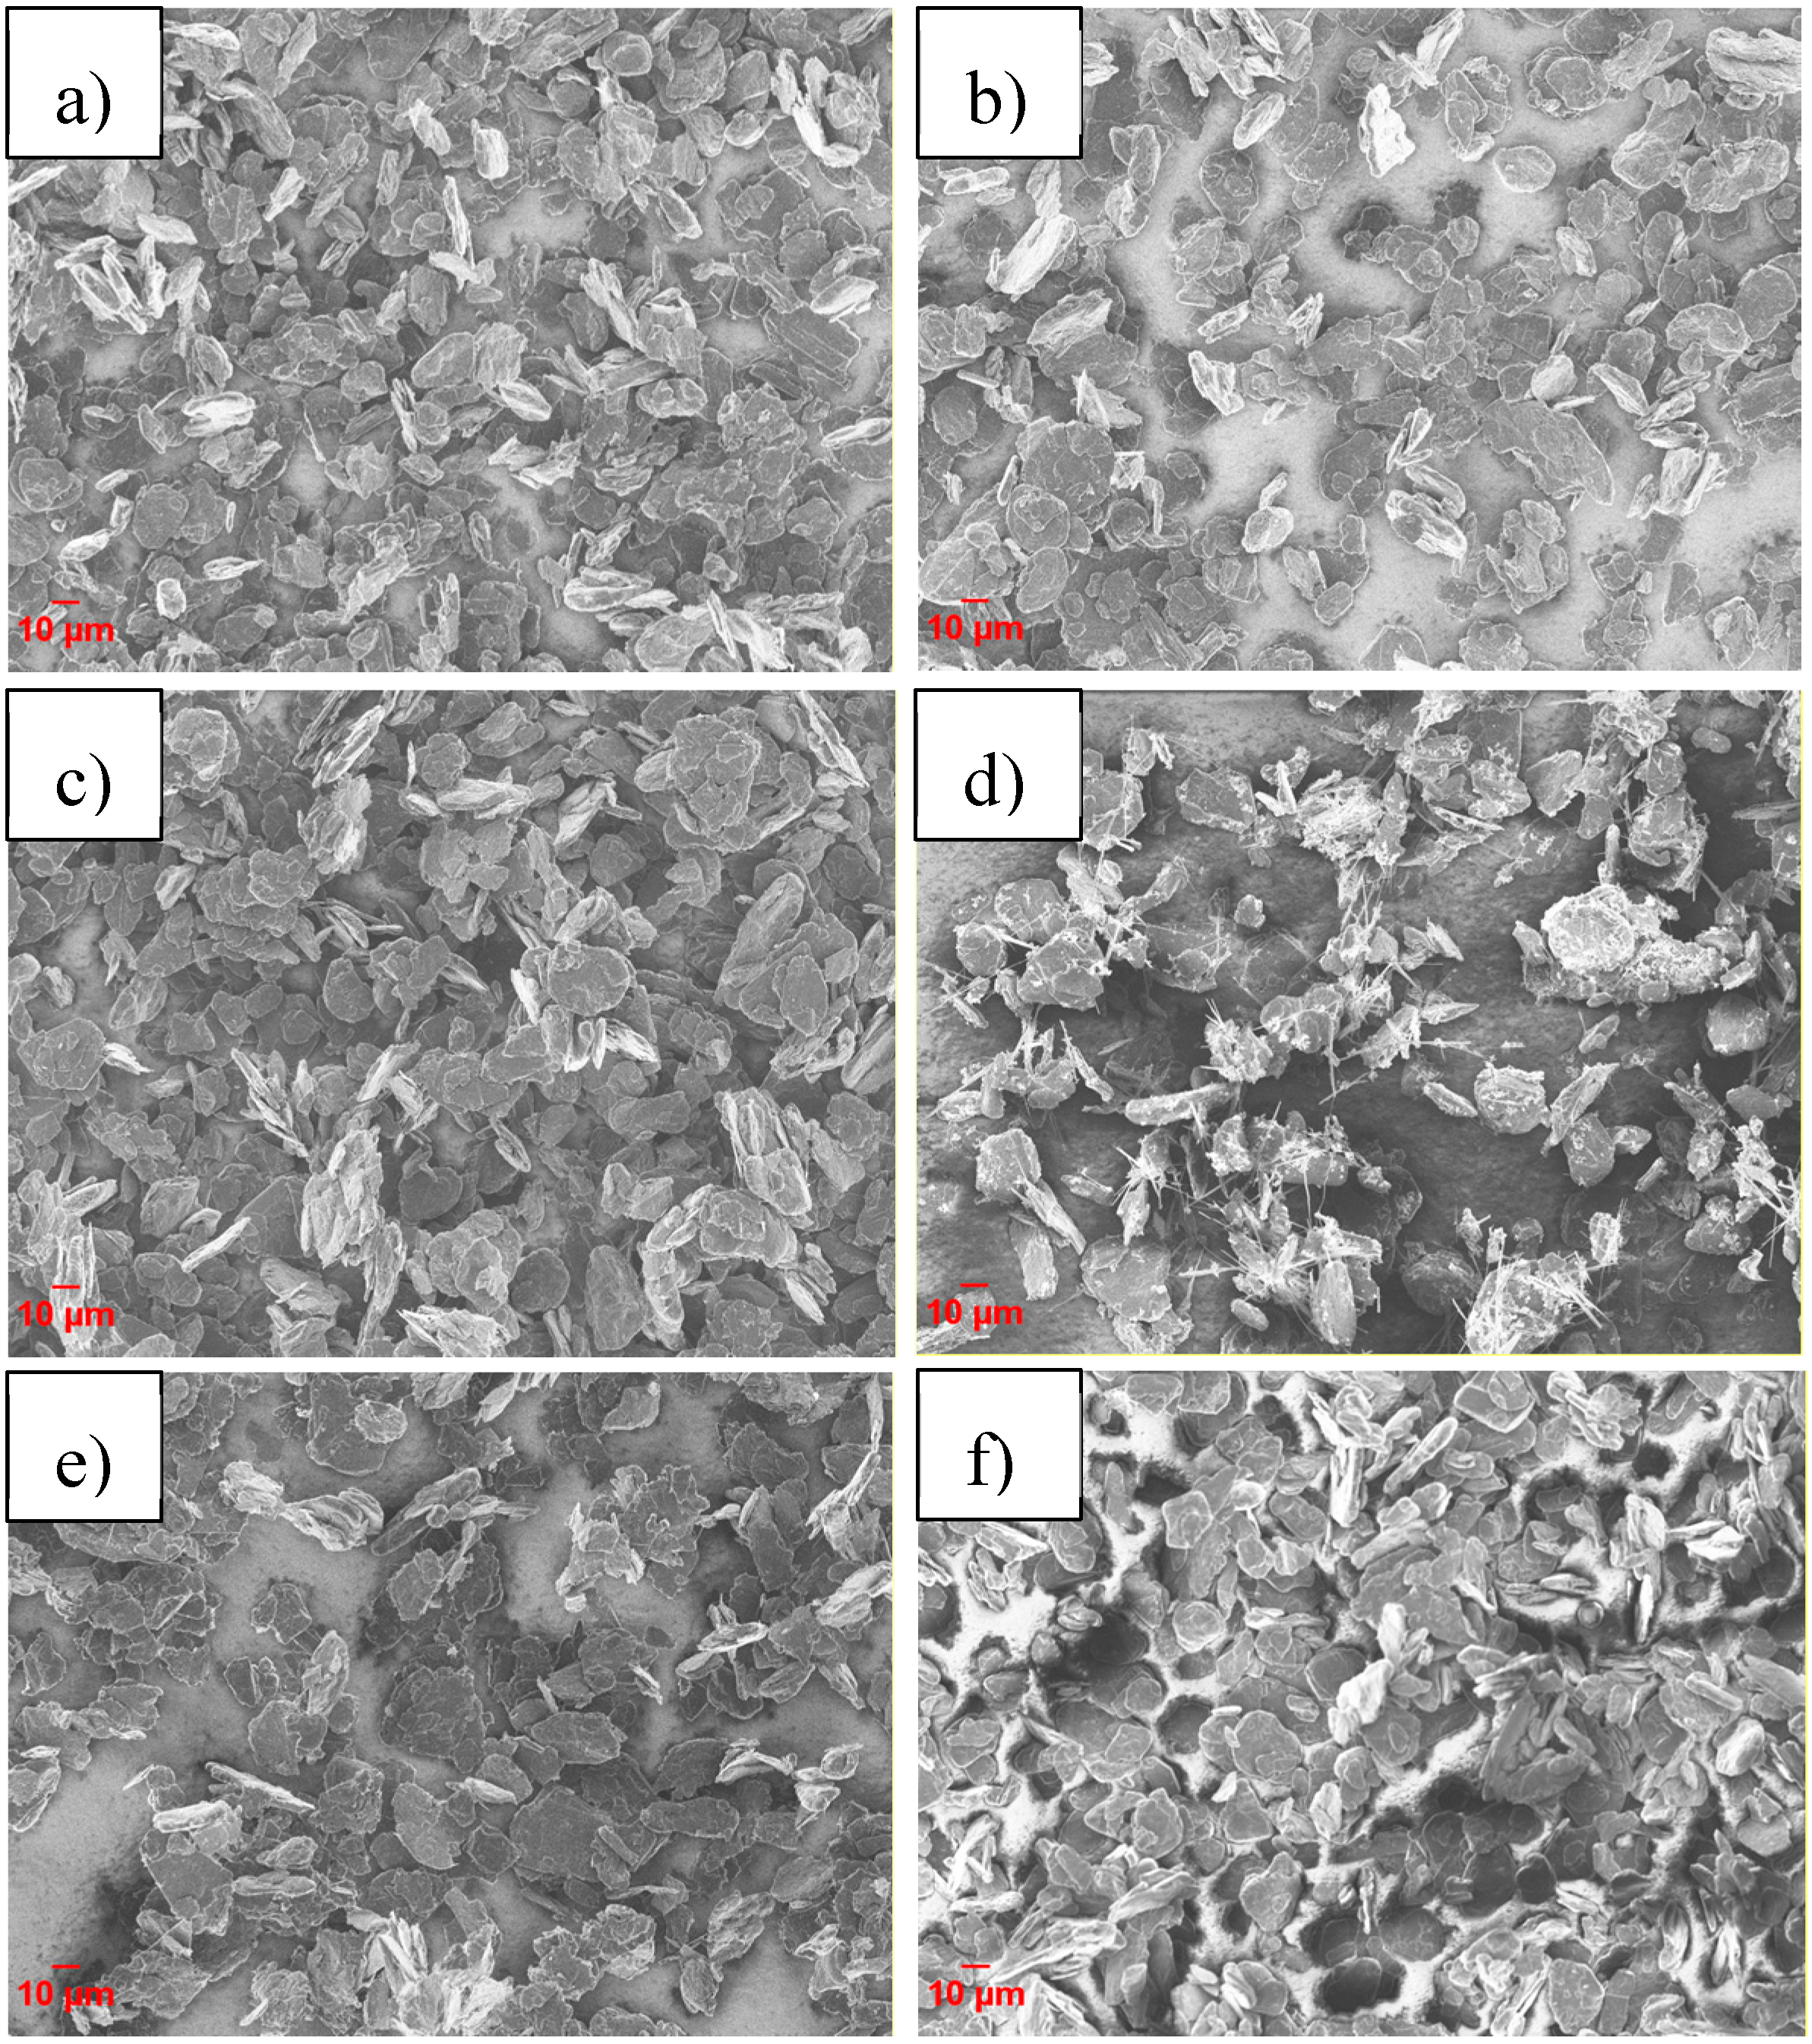
As it can be seen from the SEM images in Figure 3, the 5 wt % carbon-coated samples appear to be less agglomerated than those in Figure 2. The coated graphite particles have a similar morphology except for the sample coated using PAA, which displays the additional formation of needle-like carbon particles.
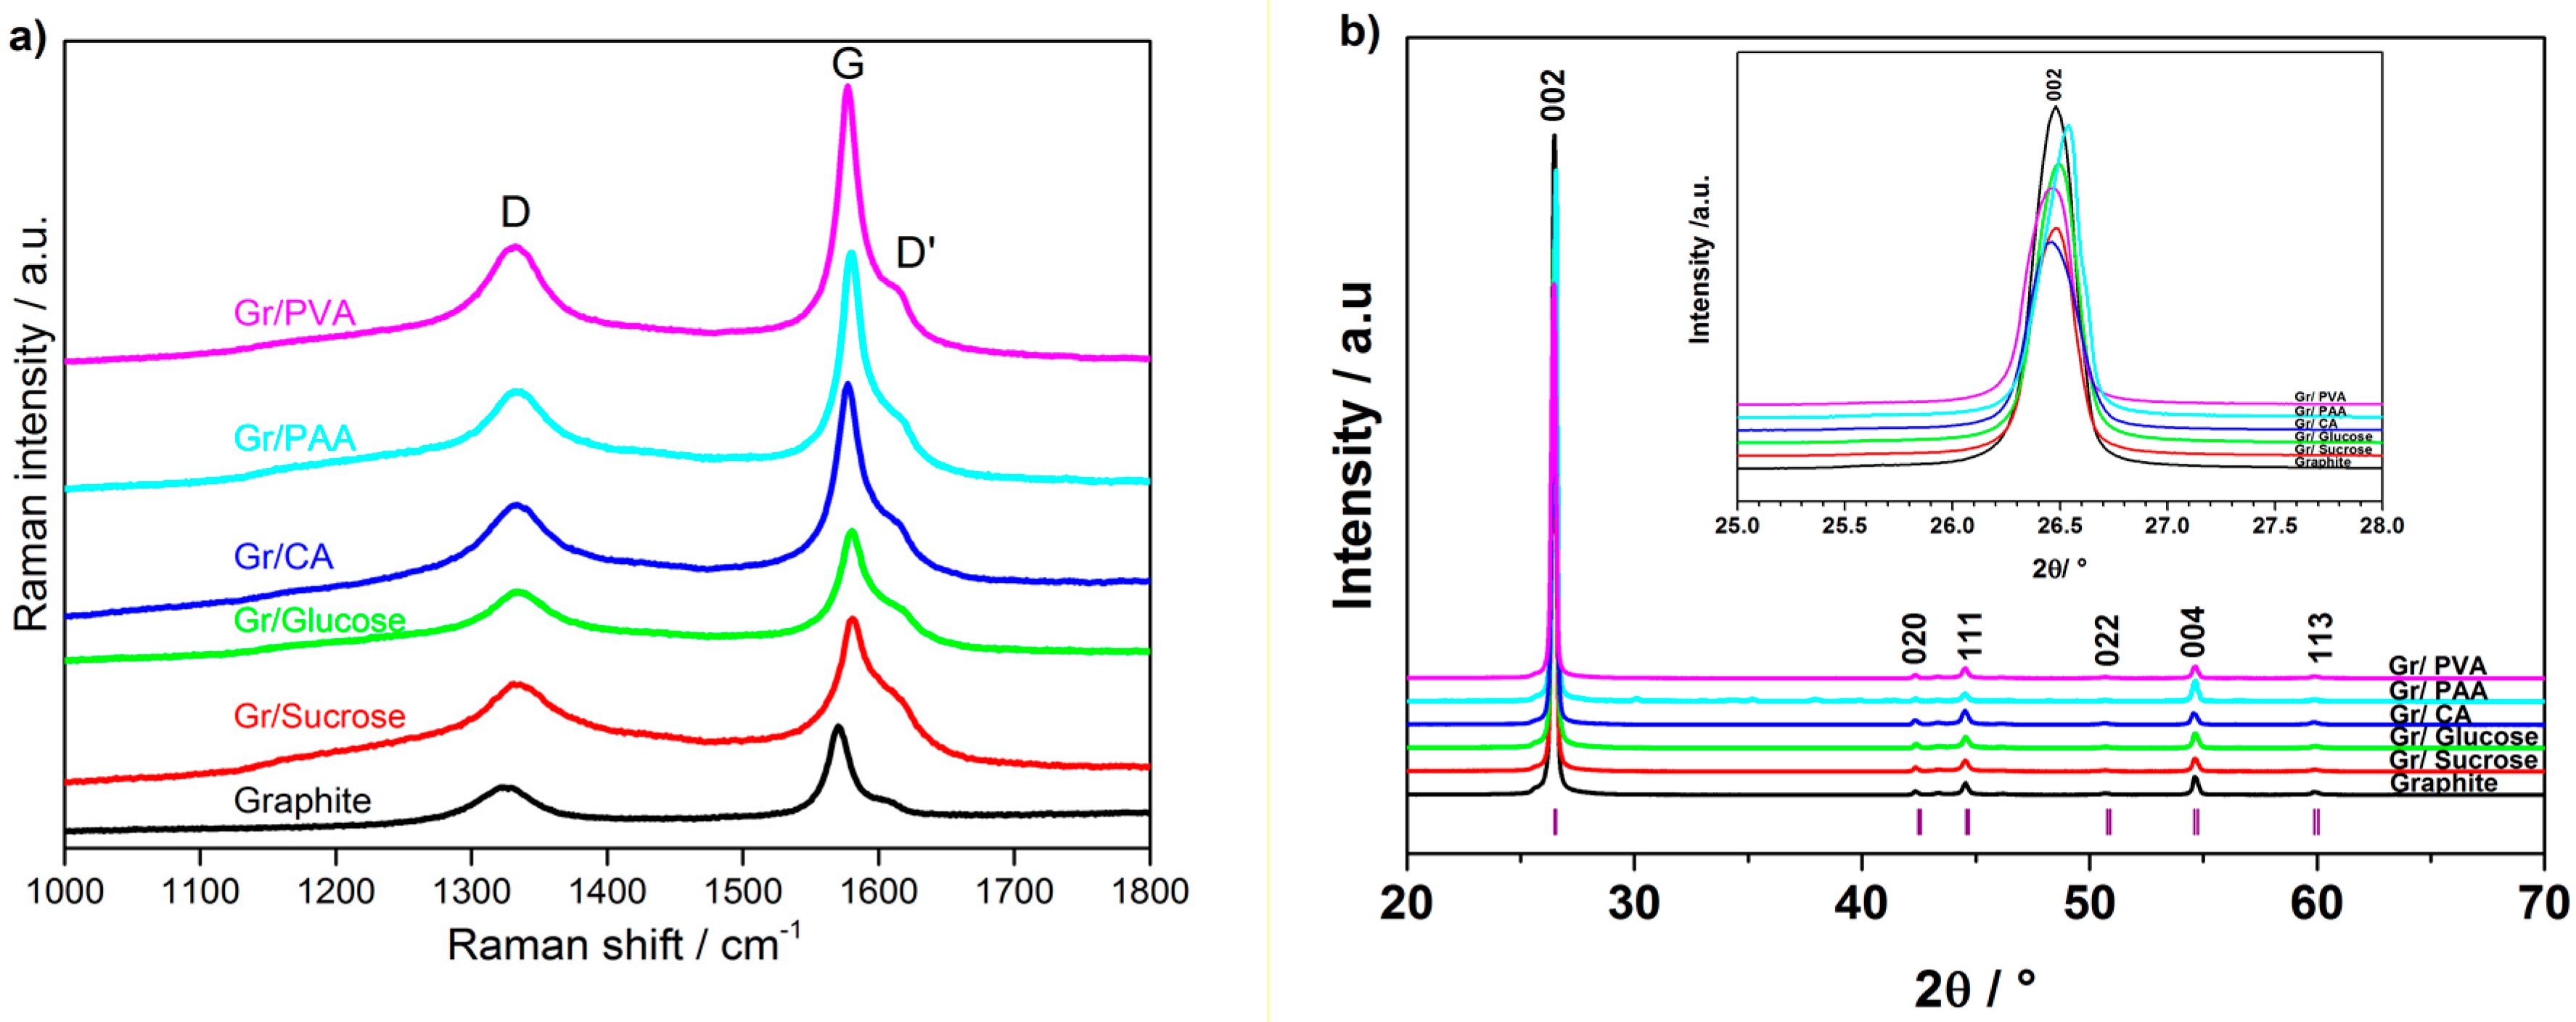
The change of the graphite crystallinity due to the formation of the amorphous carbon layer on its surface was evaluated using Raman spectroscopy. The Raman spectra of the pristine and carbon-coated graphite materials are shown in Figure 4a. The spectrum of pristine graphite exhibits an intense peak at 1572 cm−1, marked with G, which is associated with sp2 carbon bonds stretching in the basal plane of graphite. The smaller peak at 1325 cm−1, marked with D, is attributed to the breathing mode of sp3 atoms at the edge sites of graphite [20,21]. The small shoulder at 1603 cm−1, marked as D′, is also indicative of defects in the crystalline structure of graphite [22]. The D/G area ratio obtained from Raman spectroscopy is commonly used as an indicator of the extent of surface disorder in carbonaceous materials [8]. The coated samples, except that derived from PVA, have higher D/G ratios than graphite, thus confirming the surface modification due to the carbon coating.
Figure 4b reports the X-ray diffraction (XRD) patterns of pristine and carbon-coated graphite samples. The carbon coating does not change the graphite structure. However, a shift towards higher angles is observed for the materials prepared using citric acid and PAA, as shown in the inset of Figure 4b.
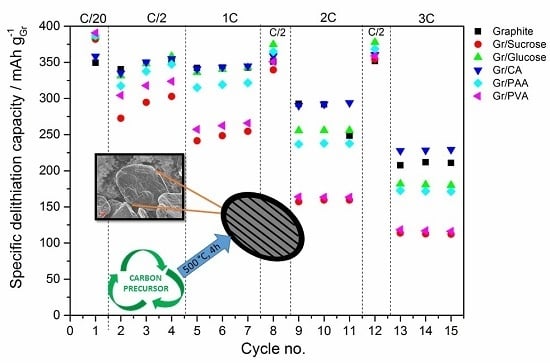
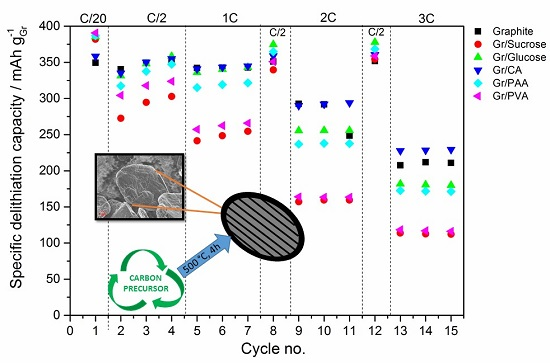
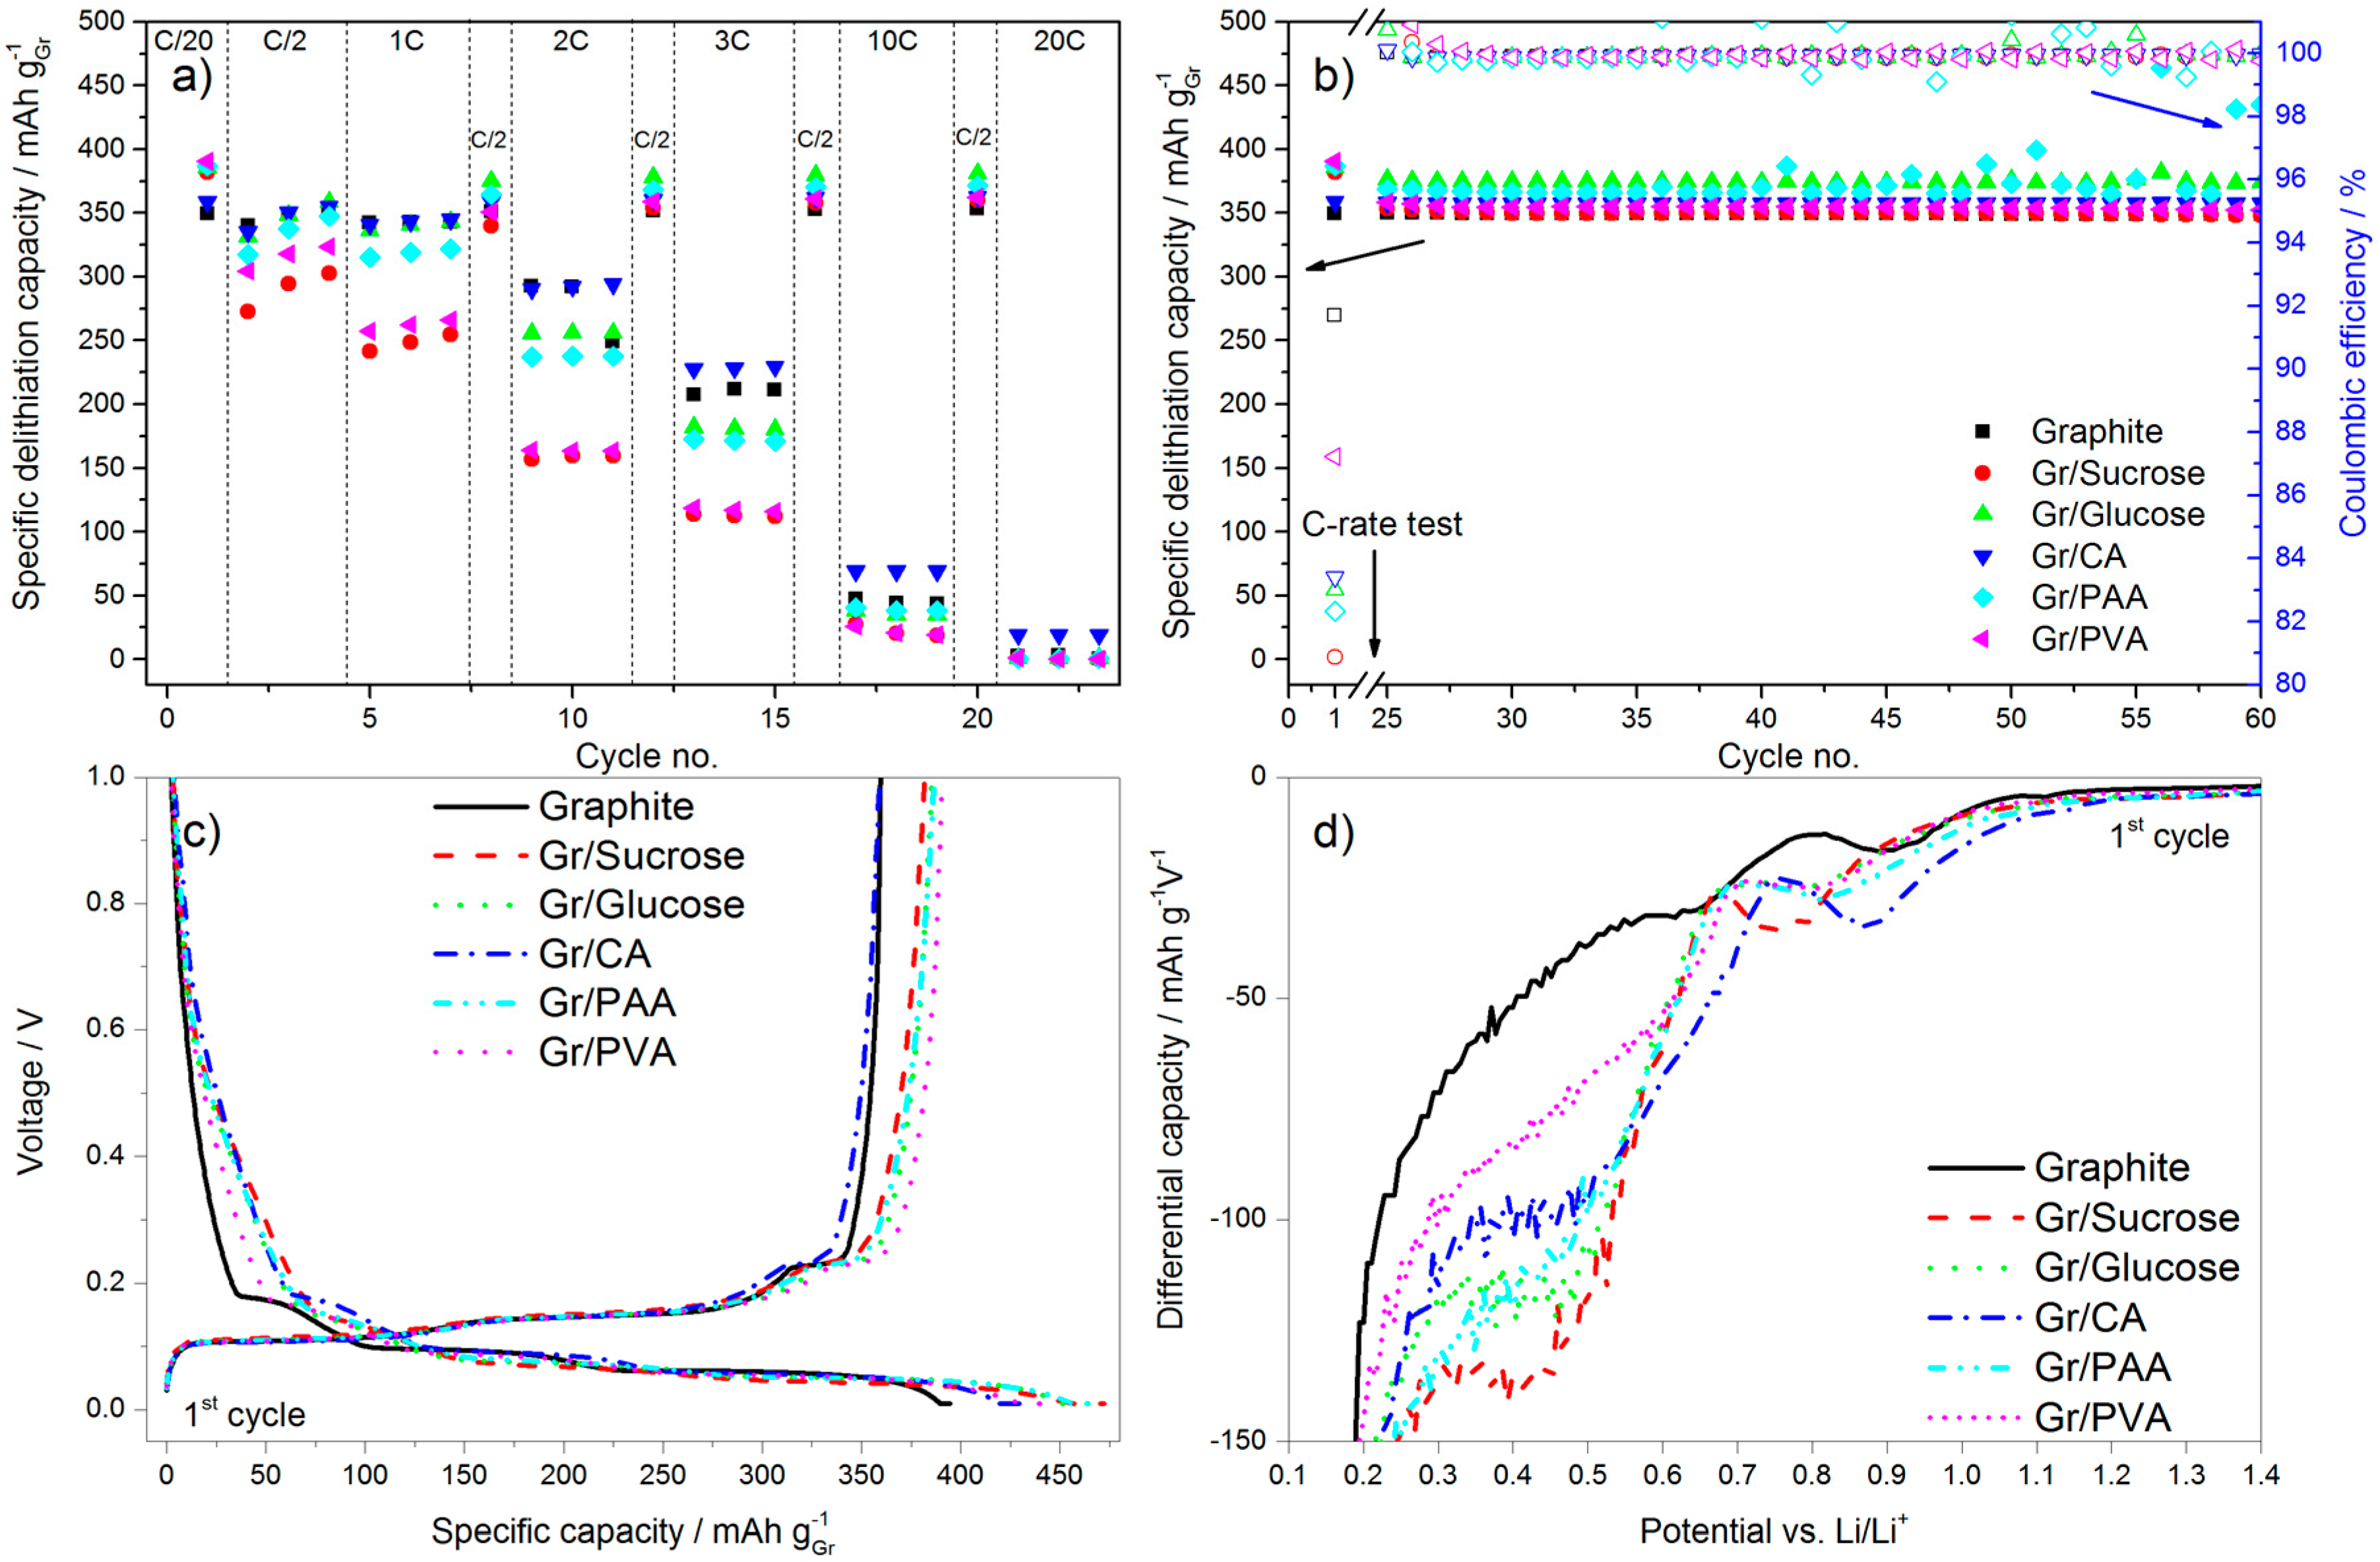
In terms of electrochemical performance, the effect of the carbon coating (~5 wt %) from the various precursors on the discharge rate of graphite is reported in Figure 5. The galvanostatic charge rate was kept constant (C/2) with the addition of the constant voltage step at the end of the galvanostatic charge to accomplish the full lithiation of the anode. In Figure 5a the results of the C-rate test are reported, while Figure 5b shows the subsequent cycling at C/2. Figure 5c,d reports, respectively, the first cycle voltage profile and a portion of the relative differential capacity plot.
During the first delithiation (discharge) the carbon-coated graphite electrodes deliver a higher capacity than the pristine material. However, the values of the first cycle coulombic efficiency (calculated as the ratio of the capacity delivered during delithiation divided by the capacity taken up during lithiation in the same cycle) obtained for the former electrodes are lower than that of pristine graphite, especially for the samples with the higher surface area (i.e., Gr/Sucrose, Gr/Glucose and Gr/CA). This is due to extended SEI formation occurring in the voltage region between 1.0 and 0.2 V. As shown in Figure 5c,d, below 1.0 V the decomposition of fluoroethylene carbonate (FEC) takes place [23], the extent of which is larger for the carbon-coated materials as indicated by the relative peaks in Figure 5d being more intense. The reduction peak just below 0.7 V in graphite is related to the decomposition of the electrolyte solvents (mainly EC), which is not completely prevented by the addition of FEC [24]. For the carbon-coated graphite electrodes, the electrolyte reduction peak is shifted to a lower voltage (~0.5 V) and its intensity is higher for the samples that have higher surface area than pristine graphite such as Gr/Glucose, Gr/Sucrose, and Gr/PAA.
In terms of rate capability improvement, citric acid seems to be the most appropriate carbon precursor. In an attempt to further improve the performance, the amount of carbon coating was reduced from 5 to 2 wt %. This corresponds to the surface area reduction of 50% and, in fact, the first cycle coulombic efficiency increases (from 83.4% to 88.6%), as shown in Figure 6a. This can be univocally attributed to the lower surface area available for the SEI formation as confirmed by the voltage profile and differential capacity plots in Figure 6b. However, this approach leads to a decrease of the rate capability, as the discharge capacity at 3C for the sample with 2 wt % carbon-coating is 30% lower than that obtained using the 5 wt % carbon-coating. The higher capacity upon constant cycling at C/2 with 2 wt % carbon-coating is additionally contributed by the moderate variation of active material loading in the electrodes.
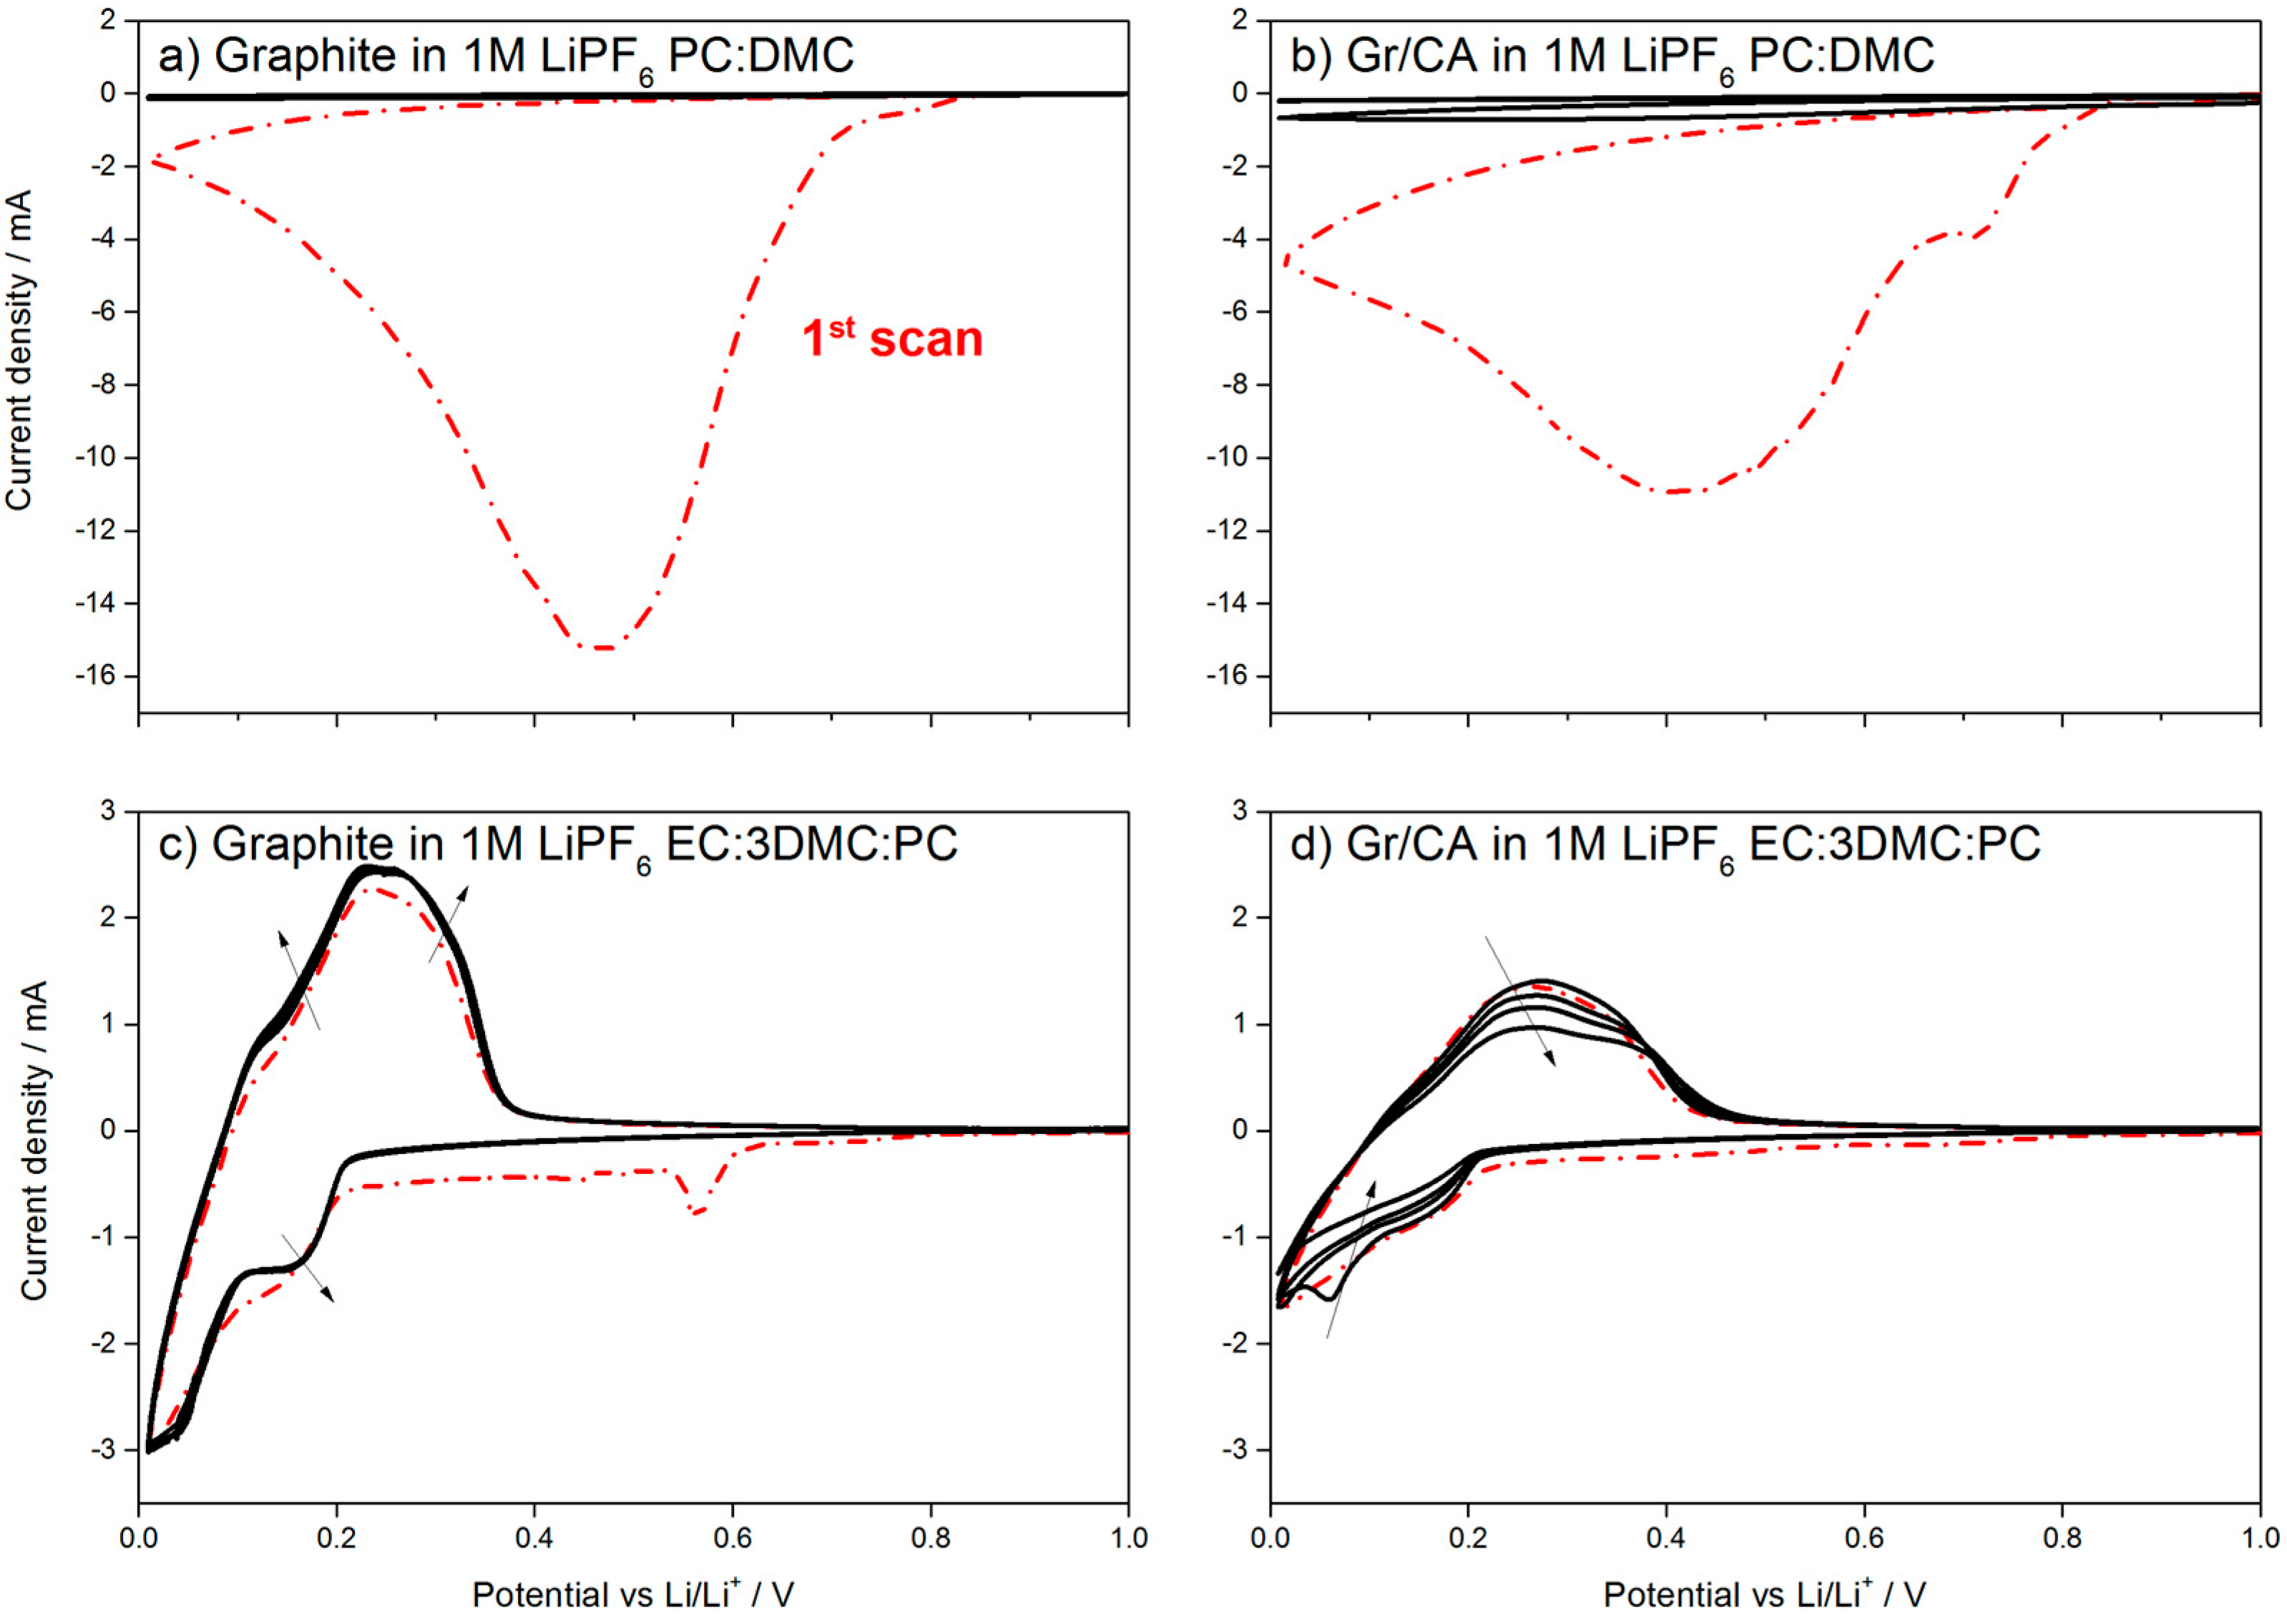
Carbon coating was reported to allow Li+ intercalation/deintercalation into graphite even in non-SEI forming electrolytes (i.e., without ethylene carbonate (EC)) [23]. Indeed, the possibility of using electrolytes with a high amount of PC in combination with dimethyl carbonate (DMC) would be beneficial for the low temperature performance as PC has a lower melting point than EC. However, the use of PC is commonly prevented by the occurrence of graphite exfoliation upon solvent co-intercalation, as shown in the cyclic voltammetry (CV) in Figure 7a, where 1M LiPF6 in PC:DMC was used as the electrolyte. Figure 7b shows that the presence of 5 wt % of carbon coating is not sufficient to protect graphite. When the test is repeated using a ternary solvents mixture containing 16.67 wt % of PC (EC:DMC:PC (1/3/1, w/w/w)), one peak in the cathodic sweep is observed at 0.6 V for the pristine graphite, as shown in Figure 7c. This peak indicates the formation of the protective SEI [24], which enables reversible cycling of the uncoated material. However, in the case of 5 wt % carbon-coating, no peak is seen until 0.2 V vs. Li/Li+. This results in the continuous Li+ consumption, as shown by the constant decrease of the peak intensity in Figure 7d.
3. Discussion
The change in the morphology and non-sp2 carbon content observed using different synthesis routes and carbon precursors confirms the successful formation of the carbon layer on the graphite surface. An increase in the surface disorder is supported by the broadening of D and D′ bands upon carbon coating, as indicated by Raman spectroscopy. The coated samples also have additional shoulders on both sides of the D band, which can be associated with coating-induced defects and/or the presence of heteroatoms on the graphite surface. The degree of surface “amorphization”, expressed by the D/G ratio, reaches a maximum with sucrose as the carbon precursor. Gr/Sucrose and Gr/PVA samples have rather different surface areas, highlighting the different impact of the carbon precursors on the final coated samples. The XRD patterns show that the carbon coating does not significantly change the graphite structure. However, the intensity decrease of the (002) diffraction peak and its broadening may indicate the reduced crystallinity of the coated materials with respect to the pristine graphite. Furthermore, the pattern of the sample using PAA contains additional peaks, which confirms the presence of crystalline impurities, i.e., needle-like particles, also observed in the SEM images, most likely arising from incomplete precursor decomposition.
The results of the cycling test in half-cells show that the presence of a high surface area amorphous carbon layer intensifies the electrolyte decomposition reactions during SEI formation, leading to lower values of first cycle coulombic efficiency. Indeed, for the sample coated with PVA, which has only half the surface area of pristine graphite, the coulombic efficiency also approaches that of the uncoated material. It should also be noted that the calculations of the current densities were only based on the graphite loading, although the carbon coating is also electrochemically active and contributes to the total delivered capacity values. This results in the slight capacity increase of 30 mAh g−1 upon first lithiation (charge) and 10 mAh g−1 upon the following cycling steps as compared to the pristine graphite. Upon increasing the cycling rates, only the sample coated with citric acid displays a slightly higher discharge capacity than pristine graphite. Surprisingly, the lowest capacity values are obtained from the graphite coated using sucrose and PVA, which have the highest and the lowest surface area, respectively. However, when the cycle rate is brought back to C/2, the Gr/PAA and Gr/Glucose electrodes deliver slightly higher capacities than pristine graphite, indicating that the carbon coating participates in the Li+ storage process [25]. This suggests that the amount of Li+ stored in the coating varies with the precursor and the final carbon nature, thickness, and homogeneity of the layer [9,15].
Upon decreasing the carbon coating amount from 5 to 2 wt % the increase of the first cycle coulombic efficiency is obtained, but at the expense of the decreased rate capability. Therefore, the amount of carbon in the coating needs to be optimized in order to achieve the best tradeoff between these two parameters.
As shown in the CV test, 5 wt % of carbon coating on graphite is not sufficient to protect it from exfoliation in PC-rich electrolyte, which is in line with other reports, highlighting that more than 10 wt % of carbon coating is necessary [12,23,25]. When the ternary electrolyte with EC is used, however, the carbon coating prevents the formation of the SEI on the graphite electrode, which leads to the continuous capacity fading upon cycling.
4. Materials and Methods
Commercial synthetic graphite, glucose (Sigma-Aldrich, St. Louis, MO, USA; purity ≥99.0%), sucrose (VWR Chemicals, Radnor, PA, USA; D(+) anhydrous), citric acid (Sigma-Aldrich, St. Louis, MO, USA; purity ≥99.5%), poly(acrylic acid) (PAA, Sigma-Aldrich, St. Louis, MO, USA; Mw~450,000), and poly(vinyl alcohol) (PVA, Sigma-Aldrich, St. Louis, MO, USA; Mw~130,000, purity ≥99.0% hydrolyzed) were used as received. Ethylene carbonate (EC), dimethyl carbonate (DMC), propylene carbonate (PC), fluoroethylene carbonate (FEC), were all obtained from UBE (Tokio, Japan), and lithium hexafluorophosphate (LiPF6, Sigma Aldrich, St. Louis, MO, USA) was also used as received. Electrolyte solutions were prepared in a glove-box (water and oxygen content below 0.1 ppm, MBraun, Stratham, NH, USA) by mixing the components and stirring them for 12 h.
Three different mixing methods of graphite and carbon precursor were investigated. In method 1, the precursor and graphite were mixed in ultra-pure water for 8 h. The resulting mixture was dried in an oven at 80 °C before thermal treatment. In method 2, dry mixing of the carbon precursor and graphite was performed using a mortar. In method 3, the two components were mixed in ultra-pure water, ball-milled (two periods of 45 min at 400 rpm with a 10-min rest step in between), followed by drying in the oven at 80 °C. In all three cases, the dry powders were ground and finally thermally treated at 500 °C for 4 h in an argon atmosphere [15].
Thermogravimetric analysis, (TGA, TA Instruments, New Castle, DE, USA), was performed to determine the amount of carbon residue. The samples were thermally equilibrated at 40 °C for 30 min and then heated to 800 °C at a rate of 5 °C/min under oxygen flow. The morphology of the samples was examined using a scanning electron microscope (Zeiss LEO 1550 VP Field Emission Scanning Electron Microscope, Oberkochen, Germany). The total surface area was measured by gas adsorption (N2) using the Brunauer–Emmett–Teller method (Autosorb-iQ, Quantachrome, Boynton Beach, FL, USA). Raman spectra were collected using a confocal InVia Raman microspectrometer (Renishaw, Wotton-under-Edge, UK) with a laser wavelength of 633 nm. X-ray diffraction (XRD) patterns were recorded using a Brucker D8 Advance (Cu Kα radiation source, Brucker, Billerica, MA, USA) diffractometer.
Pristine and carbon-coated electrodes were prepared by first mixing the conductive carbon (Super C45, Imerys, Paris, France) with sodium carboxymethyl cellulose (Walocel Na-CMC, Mw~30,000, degree of substitution 0.9, DOW, Midland, MI, USA) water solution for 2 h. Next, the active material (pristine or carbon-coated graphite) was stepwise added to the mixture. The slurry was stirred for two additional hours before adding styrene butadiene rubber (SBR). The dispersion was mixed for 10 min using a blade mixer (Dremel, Racine, WI, USA), and then casted on 20 µm thick Cu foil (Carl SCHLENK AG, Roth, Germany). The electrode tapes were dried for 12 h at 80 °C. Electrode disks (1.13 cm2) were cut and finally dried under vacuum at 120 °C for at least 4 h. The weight percentage of the components in the dry electrode was: active material 95%, Super C45 1%, CMC 2% and styrene-butadiene rubber (SBR) 2%. The average active material mass loading was 2.4–2.7 mAh cm−2.
Two-electrode coin cells (type 2032) were assembled in a glove-box using Li metal foil (Rockwood Lithium-ALBEMARLE, Charlotte, NC, USA) as the counter electrode. The separator (Whatman® GF/D, GE Healthcare, Chicago, IL, USA) was soaked with 100 µL of electrolyte (1M LiPF6 in EC:DMC (1:1 w/w) + 2 wt % FEC). The combined galvanostatic-potentiostatic cycling tests, including the rate capability, were conducted at 20 ± 1 °C in a climatic chamber (Binder, Tuttlingen, Germany) using a Maccor 4300 Series Battery Tester (Maccor, Inc., Tulsa, OK, USA). The cycling rate of 1C corresponded to a specific current of 372 mA g−1. The delivered capacity was calculated considering only the weight of graphite by subtracting the amount of carbon in the coating, determined by TGA. Here, the convention of graphite electrode for Li-ion batteries is used, i.e., lithiation is referred as charge and delithiation as discharge. The cells were initially equilibrated at 20 °C for 16 h, before the graphite electrodes were lithiated (charged) to 0.01 V at C/20 followed by a constant voltage step (or CV step) until the current reached a value corresponding to C/40. The subsequent graphite delithiation was conducted at C/20 to 1.00 V. The rate test was conducted by cycling the electrodes between 0.01 and 1.00 V. The charge rate was C/2 (followed by the CV step), while the discharge rate was varied from C/2 to 20 C. Before changing the discharge rate, a fingerprint cycle at C/2 was performed to check the material integrity. At the end of the rate test, the cells were left to cycle at C/2, including the CV step at the end of each lithiation (charge) step. The cyclic voltammetry tests were conducted, using three-electrode Swagelock cells with Li as a reference and counter electrode, by means of VMP-3 potentiostat (BioLogic, Inc., Cary, NC, USA). The same kind of separator was soaked with 120 µL of either 1M LiPF6 in PC:DMC (1/1, v/v) or 1M LiPF6 in EC:DMC:PC (1/3/1, w/w/w). The measurements were performed with a scan rate of 0.1 mV s−1 between 0.01 and 1.00 V vs. Li/Li+ for 10 cycles.
5. Conclusions
Carbon coating of graphite, derived from non-toxic and abundant materials using aqueous processing, has been investigated with a particular focus on the impact of the carbon source on the electrochemical properties. It has been shown that the use of monomer-type precursors resulted in higher surface areas as compared to the polymer-type ones. The Raman spectroscopy suggested the surface amorphization to occur in all carbon-coated materials except the one made using PVA. At the same time, the graphite structure remained unchanged for all coated materials, as confirmed by XRD. The decreased first cycle efficiency, with respect to pristine graphite, was ascribed to the higher surface area available for the electrolyte decomposition of the carbon-coated materials. In contrast, the use of citric acid as a carbon precursor resulted in the improved rate capability compared to pristine graphite. In an attempt to reduce the irreversible reactions at the anode/electrolyte interface and increase first cycle efficiency, a lower amount of carbon coating (from 5 to 2 wt %) was investigated. A higher coulombic efficiency was obtained, albeit at the expense of the rate capability. Although previous reports have shown that the carbon coating allows the use of graphite in combination with PC, the herein investigated amount of carbon coating (5 wt %) was not sufficient to protect the graphite from exfoliation.
Acknowledgments
This work is part of the “SPICY” project funded by the European Union’s Horizon 2020 research and innovation program under grant agreement No 653373. The authors kindly acknowledge Imerys and Rockwood Lithium for providing Super C45 and lithium foil, respectively.
Author Contributions
Arianna Moretti and Stefano Passerini conceived and designed the experiments. Varvara Sharova performed the experiments and together with Arianna Moretti and Stefano Passerini analyzed the data, except for Raman. Diogo Vieira Carvalho performed the Raman measurement, and Guinevere A. Giffin analyzed the obtained data. Arianna Moretti, Varvara Sharova, Guinevere A. Giffin and Stefano Passerini wrote the paper.
Conflicts of Interest
The authors declare no conflict of interest. The founding sponsors had no role in the design of the study; in the collection, analyses, or interpretation of data; in the writing of the manuscript, and in the decision to publish the results.
References
- Peled, E. The electrochemical behavior of alkali and alkaline earth metals in nonaqueous battery systems—The solid electrolyte interphase model. J. Electrochem. Soc. 1979, 126, 2047–2051. [Google Scholar] [CrossRef]
- Herstedt, M.; Fransson, L.; Edström, K. Rate capability of natural Swedish graphite as anode material in Li-ion batteries. J. Power Sources 2003, 124, 191–196. [Google Scholar] [CrossRef]
- Sivakkumar, S.R.; Nerkar, J.Y.; Pandolfo, A.G. Rate capability of graphite materials as negative electrodes in lithium-ion capacitors. Electrochim. Acta 2010, 55, 3330–3335. [Google Scholar] [CrossRef]
- Sawai, K.; Ohzuku, T. Factors affecting rate capability of graphite electrodes for lithium-ion batteries. J. Electrochem. Soc. 2003, 150, A674–A678. [Google Scholar] [CrossRef]
- Shim, J.; Striebel, K.A. Effect of electrode density on cycle performance and irreversible capacity loss for natural graphite anode in lithium-ion batteries. J. Power Sources 2003, 119–121, 934–937. [Google Scholar] [CrossRef]
- Li, F.-S.; Wu, Y.-S.; Chou, J.; Winter, M.; Wu, N.-L. A mechanically robust and highly ion-conductive polymer-blend coating for high-power and long-life lithium-ion battery anodes. Adv. Mater. 2015, 27, 130–137. [Google Scholar] [CrossRef] [PubMed]
- Nobili, F.; Mancini, M.; Stallworth, P.E.; Croce, F.; Greenbaum, S.G.; Marassi, R. Tin-Coated graphite electrodes as composite anodes for Li-ion batteries. Effects of tin coatings thickness toward intercalation behavior. J. Power Sources 2012, 198, 243–250. [Google Scholar] [CrossRef]
- Lee, H.-Y.; Baek, J.-K.; Jang, S.-W.; Lee, S.-M.; Hong, S.-T.; Lee, K.-Y.; Kim, M.-H. Characteristics of carbon-coated graphite prepared from mixture of graphite and polyvinylchloride as anode materials for lithium ion batteries. J. Power Sources 2001, 101, 206–212. [Google Scholar] [CrossRef]
- Ohta, N.; Nagaoka, K.; Hoshi, K.; Bitoh, S.; Inagaki, M. Carbon-Coated graphite for anode of lithium ion rechargeable batteries: Graphite substrates for carbon coating. J. Power Sources 2009, 194, 985–990. [Google Scholar] [CrossRef]
- Nozaki, H.; Nagaoka, K.; Hoshi, K.; Ohta, N.; Inagaki, M. Carbon-Coated graphite for anode of lithium ion rechargeable batteries: Carbon coating conditions and precursors. J. Power Sources 2009, 194, 486–493. [Google Scholar] [CrossRef]
- Wang, C.; Zhao, H.; Wang, J.; Wang, J.; Lv, P. Electrochemical performance of modified artificial graphite as anode material for lithium ion batteries. Ionics 2013, 19, 221–226. [Google Scholar] [CrossRef]
- Inagaki, M. Carbon coating for enhancing the functionalities of materials. Carbon 2012, 50, 3247–3266. [Google Scholar] [CrossRef]
- Striebel, K.A.; Sierra, A.; Shim, J.; Wang, C.W.; Sastry, A.M. The effect of compression on natural graphite anode performance and matrix conductivity. J. Power Sources 2004, 134, 241–251. [Google Scholar] [CrossRef]
- Li, H.; Zhou, H. Enhancing the performances of Li-ion batteries by carbon-coating: Present and future. Chem. Commun. 2012, 48, 1201–1217. [Google Scholar] [CrossRef] [PubMed]
- Mueller, F.; Bresser, D.; Paillard, E.; Winter, M.; Passerini, S. Influence of the carbonaceous conductive network on the electrochemical performance of ZnFe2O4 nanoparticles. J. Power Sources 2013, 236, 87–94. [Google Scholar] [CrossRef]
- Fu, L.J.; Yang, L.C.; Shi, Y.; Wang, B.; Wu, Y.P. Synthesis of carbon coated nanoporous microcomposite and its rate capability for lithium ion battery. Microporous Mesoporous Mater. 2009, 117, 515–518. [Google Scholar] [CrossRef]
- Zhang, W.-M.; Wu, X.-L.; Hu, J.-S.; Guo, Y.-G.; Wan, L.-J. Carbon coated Fe3O4 nanospindles as a superior anode material for lithium-ion batteries. Adv. Funct. Mater. 2008, 18, 3941–3946. [Google Scholar] [CrossRef]
- Komaba, S.; Ozeki, T.; Okushi, K. Functional interface of polymer modified graphite anode. J. Power Sources 2009, 189, 197–203. [Google Scholar] [CrossRef]
- Fang, W.; Cheng, X.; Zuo, P.; Ma, Y.; Yin, G. A facile strategy to prepare nano-crystalline Li4Ti5O12/C anode material via polyvinyl alcohol as carbon source for high-rate rechargeable Li-ion batteries. Electrochim. Acta 2013, 93, 173–178. [Google Scholar] [CrossRef]
- Ferrari, A.C.; Robertson, J. Interpretation of Raman spectra of disordered and amorphous carbon. Phys. Rev. B 2000, 61, 14095–14107. [Google Scholar] [CrossRef]
- Ferrari, A.C. Raman spectroscopy of graphene and graphite: Disorder, electron–phonon coupling, doping and nonadiabatic effects. Solid State Commun. 2007, 143, 47–57. [Google Scholar] [CrossRef]
- Pimenta, M.A.; Dresselhaus, G.; Dresselhaus, M.S.; Cancado, L.G.; Jorio, A.; Saito, R. Studying disorder in graphite-based systems by Raman spectroscopy. PCCP 2007, 9, 1276–1290. [Google Scholar] [CrossRef] [PubMed]
- Yoshio, M.; Wang, H.; Fukuda, K.; Hara, Y.; Adachi, Y. Effect of carbon coating on electrochemical performance of treated natural graphite as lithium-ion battery anode material. J. Electrochem. Soc. 2000, 147, 1245–1250. [Google Scholar] [CrossRef]
- Wang, H.; Yoshio, M. Carbon-coated natural graphite prepared by thermal vapor decomposition process, a candidate anode material for lithium-ion battery. J. Power Sources 2001, 93, 123–129. [Google Scholar] [CrossRef]
- Wang, H.; Yoshio, M.; Abe, T.; Ogumi, Z. Characterization of carbon-coated natural graphite as a lithium-ion battery anode material. J. Electrochem. Soc. 2002, 149, A499–A503. [Google Scholar] [CrossRef]
Figure 1.
Thermogravimetric analysis (TGA) traces in oxygen atmosphere of pristine and carbon-coated graphite. Sucrose was used as the carbon precursor for all synthesis routes.
Figure 1.
Thermogravimetric analysis (TGA) traces in oxygen atmosphere of pristine and carbon-coated graphite. Sucrose was used as the carbon precursor for all synthesis routes.

Figure 2.
Micrographs of (a) pristine and coated graphite materials obtained using (b) Method 1, (c) Method 2, and (d) Method 3. Sucrose was used as the carbon precursor.
Figure 2.
Micrographs of (a) pristine and coated graphite materials obtained using (b) Method 1, (c) Method 2, and (d) Method 3. Sucrose was used as the carbon precursor.

Figure 3.
Scanning electron microscopy (SEM) images of carbon-coated materials: (a) Gr/Sucrose; (b) Gr/Glucose; (c) Gr/CA; (d) Gr/PAA; (e) Gr/PVA; pristine graphite (f) is also shown for comparison.
Figure 3.
Scanning electron microscopy (SEM) images of carbon-coated materials: (a) Gr/Sucrose; (b) Gr/Glucose; (c) Gr/CA; (d) Gr/PAA; (e) Gr/PVA; pristine graphite (f) is also shown for comparison.

Figure 4.
(a) Raman spectra and (b) X-ray diffraction (XRD) patterns of pristine and coated graphite samples.
Figure 4.
(a) Raman spectra and (b) X-ray diffraction (XRD) patterns of pristine and coated graphite samples.

Figure 5.
Electrochemical performance of pristine graphite and the carbon-coated graphite electrodes. (a) C-rate test; (b) constant cycling at C/2 (the arrows point at the corresponding y axes, closed symbols represent delithiation capacity, open symbols—coulombic efficiency); (c) first cycle voltage profile; and (d) enlarged portion of differential capacity plot of the first cycle.

Figure 6.
Electrochemical performance of coated graphite electrodes with 5 wt % and 2 wt % carbon-coating made using citric acid as a precursor. (a) C-rate test and constant cycling at C/2 (the arrows point at the corresponding y axes, closed symbols represent capacity, open symbols–coulombic efficiency); (b) first cycle voltage profile (inset: differential capacity plot for the first cycle).
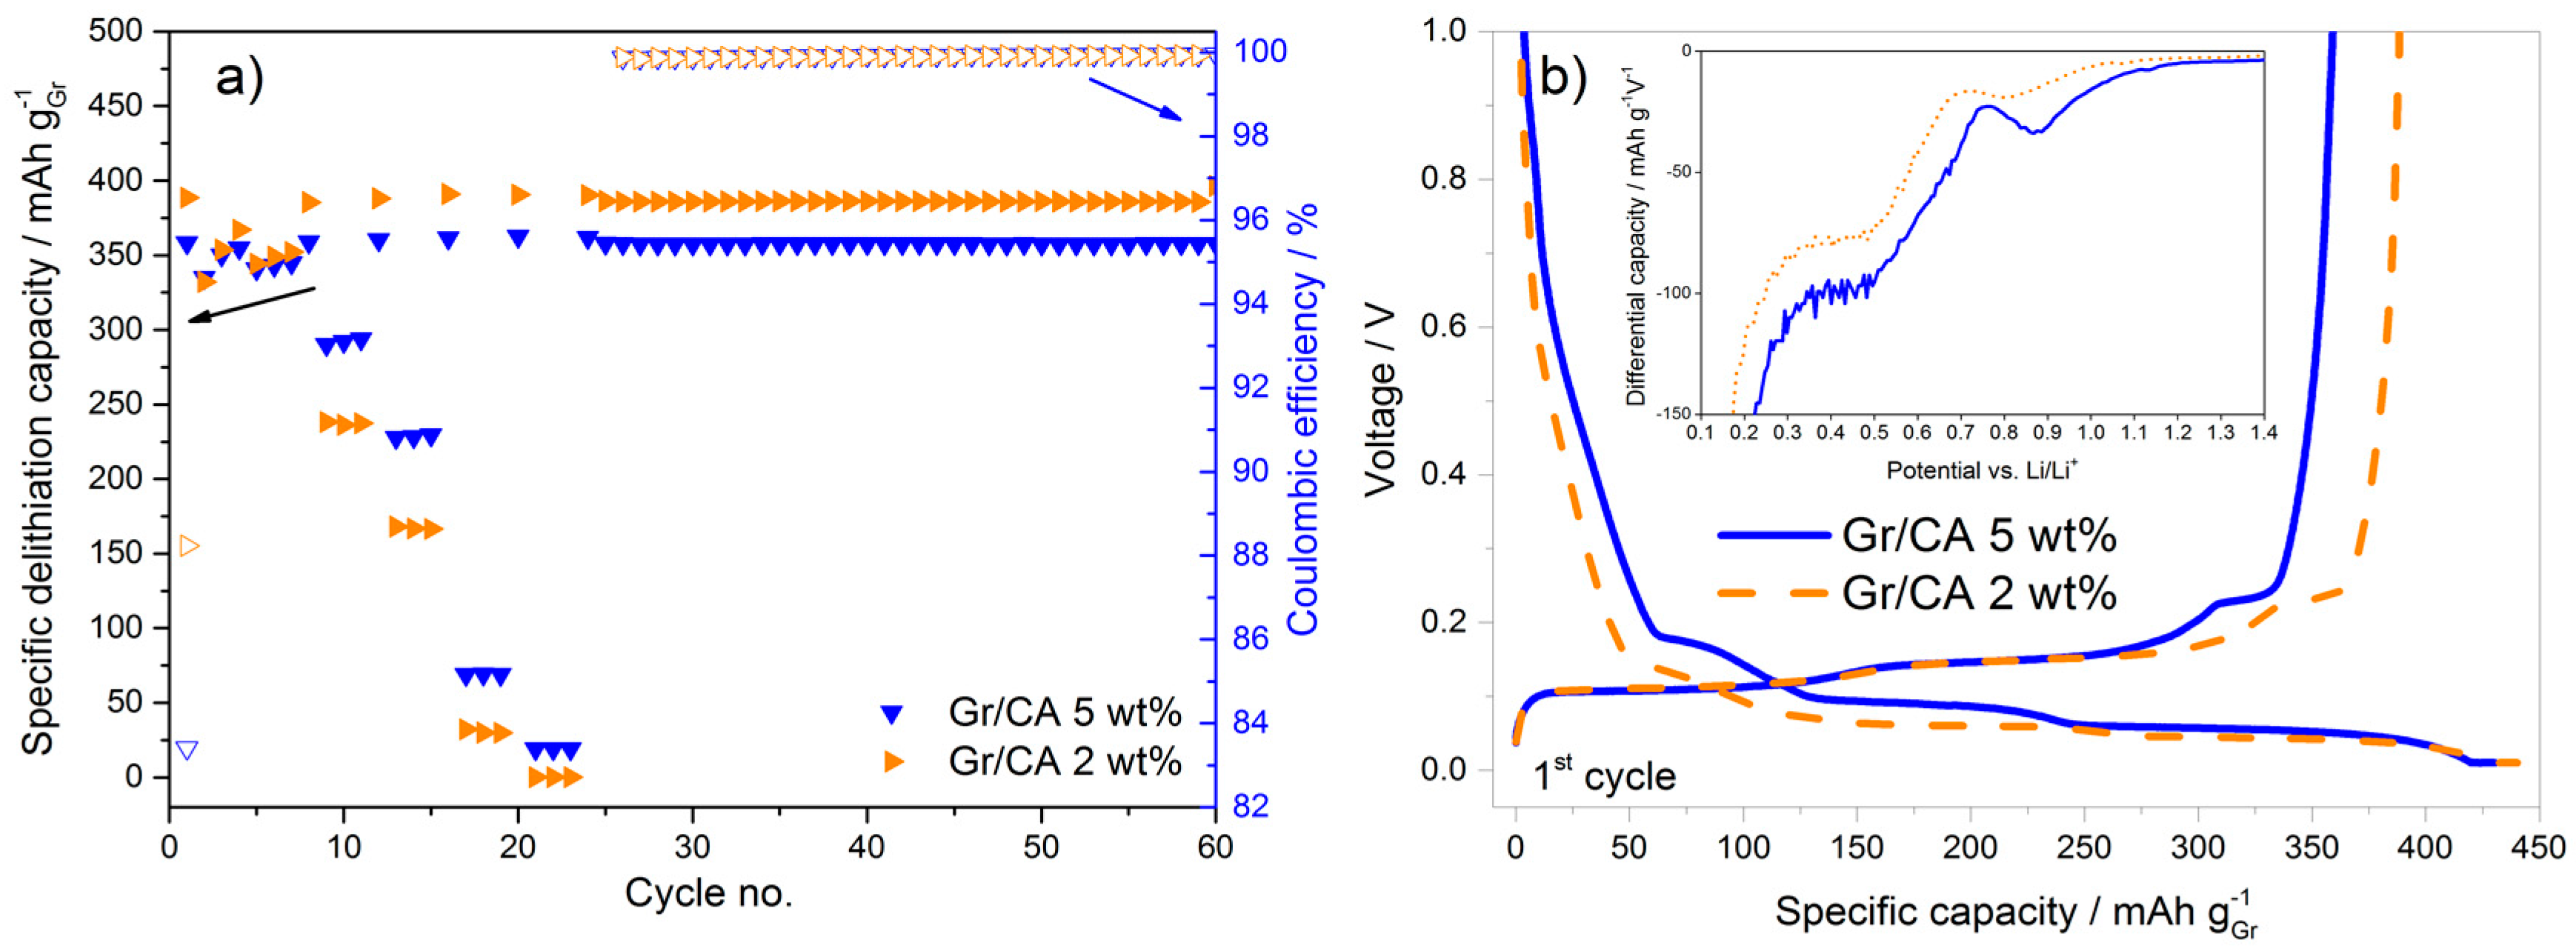
Figure 7.
Cyclic voltammetry (CV) of pristine and carbon-coated (5 wt % of carbon from citric acid) graphite samples in 1M LiPF6 PC:DMC electrolyte (panels a and b) and in EC:3DMC:PC 1M LiPF6 electrolyte (panels c and d). The arrows indicate the cycle increment. PC: propylene carbonate, DMC: dimethyl carbonate, EC: ethylene carbonate. Electrode area: 1.13 cm². Scan rate: 0.1 mV s−1.

Table 1.
Summary of the mixing methods.
| Method | Solvent | Mixing Device | Duration |
|---|---|---|---|
| 1 | Ultra-pure H2O | Magnetic plate | 8 h |
| 2 | – | Agate mortar | 10 min |
| 3 | Ultra-pure H2O | Magnetic plate | 1 h |
| Ball mill | 2 × 45 min at 400 rpm, 10 min rest |
Table 2.
Characteristic of pristine and coated samples and electrodes: graphite:precursor weight ratios, carbon coating fraction, surface area, D/G band ratio, first cycle efficiency and delivered discharge capacity at 3C.
Table 2.
Characteristic of pristine and coated samples and electrodes: graphite:precursor weight ratios, carbon coating fraction, surface area, D/G band ratio, first cycle efficiency and delivered discharge capacity at 3C.
| Sample | Graphite: Precursor Weight Ratio | Carbon Coating from TGA 1 [wt %] | Surface Area from BET 2 [m² g−1] | Ratio D/G Bands | First Cycle Efficiency [%] | Delithiation (Discharge) Capacity @ 3C [mAh g−1] |
|---|---|---|---|---|---|---|
| Graphite | – | – | 6.9 | 1.05 | 91.2 | 211 |
| Gr/Sucrose | 4:1 | 5.3 | 26.1 | 2.04 | 80.8 | 112 |
| Gr/Glucose | 4:1 | 4.7 | 18.2 | 1.11 | 83.0 | 180 |
| Gr/CA | 2:1 | 5.0 | 16.9 | 1.12 | 83.4 | 228 |
| Gr/PAA | 3:1 | 4.2 | 8.1 | 1.12 | 82.3 | 171 |
| Gr/PVA | 2.5:1 | 4.8 | 4.0 | 1.05 | 87.2 | 116 |
1 Thermogravimetric analysis (TGA) error: ±0.1%, 2 Brunauer–Emmett–Teller (BET) error: ±0.15%, Gr: graphite, CA: citric acid, PAA: poly(acrylic acid), PVA: poly(vinyl alcohol).
© 2017 by the authors. Licensee MDPI, Basel, Switzerland. This article is an open access article distributed under the terms and conditions of the Creative Commons Attribution (CC BY) license (http://creativecommons.org/licenses/by/4.0/).
Share and Cite
MDPI and ACS Style
Sharova, V.; Moretti, A.; Giffin, G.A.; Carvalho, D.V.; Passerini, S. Evaluation of Carbon-Coated Graphite as a Negative Electrode Material for Li-Ion Batteries. C 2017, 3, 22. https://doi.org/10.3390/c3030022
AMA Style
Sharova V, Moretti A, Giffin GA, Carvalho DV, Passerini S. Evaluation of Carbon-Coated Graphite as a Negative Electrode Material for Li-Ion Batteries. C. 2017; 3(3):22. https://doi.org/10.3390/c3030022
Chicago/Turabian StyleSharova, Varvara, Arianna Moretti, Guinevere A. Giffin, Diogo Vieira Carvalho, and Stefano Passerini. 2017. "Evaluation of Carbon-Coated Graphite as a Negative Electrode Material for Li-Ion Batteries" C 3, no. 3: 22. https://doi.org/10.3390/c3030022
Note that from the first issue of 2016, this journal uses article numbers instead of page numbers. See further details here.