Article

Functionalized Graphene–Polyoxometalate Nanodots Assembly as “Organic–Inorganic” Hybrid Supercapacitors and Insights into Electrode/Electrolyte Interfacial Processes

1
Department of Physics and Astronomy, Western Kentucky University, 1906 College Heights Blvd, Bowling Green, KY 42101, USA
2
Department of Chemistry, Western Kentucky University, 1906 College Heights Blvd, Bowling Green, KY 42101, USA
3
Department of Electrical Engineering, Western Kentucky University, 1906 College Heights Blvd, Bowling Green, KY 42101, USA
*
Author to whom correspondence should be addressed.
Submission received: 2 July 2017 / Revised: 15 July 2017 / Accepted: 24 July 2017 / Published: 28 July 2017
(This article belongs to the Special Issue Carbon Hybrid Materials)

Abstract

:
The stable high-performance electrochemical electrodes consisting of supercapacitive reduced graphene oxide (rGO) nanosheets decorated with pseudocapacitive polyoxometalates (phosphomolybdate acid-H3PMo12O40 (POM) and phosphotungstic acid-H3PW12O40 (POW)) nanodots/nanoclusters are hydrothermally synthesized. The interactions between rGO and POM (and POW) components create emergent “organic–inorganic” hybrids with desirable physicochemical properties (specific surface area, mechanical strength, diffusion, facile electron and ion transport) enabled by molecularly bridged (covalently and electrostatically) tailored interfaces for electrical energy storage. The synergistic hybridization between two electrochemical energy storage mechanisms, electrochemical double-layer from rGO and redox activity (faradaic) of nanoscale POM (and POW) nanodots, and the superior operating voltage due to high overpotential yielded converge yielding a significantly improved electrochemical performance. They include increase in specific capacitance from 70 F·g−1 for rGO to 350 F·g−1 for hybrid material with aqueous electrolyte (0.4 M sodium sulfate), higher current carrying capacity (>10 A·g−1) and excellent retention (94%) resulting higher specific energy and specific power density. We performed scanning electrochemical microscopy to gain insights into physicochemical processes and quantitatively determine associated parameters (diffusion coefficient (D) and heterogeneous electron transfer rate (kET)) at electrode/electrolyte interface besides mapping electrochemical (re)activity and electro-active site distribution. The experimental findings are attributed to: (1) mesoporous network and topologically multiplexed conductive pathways; (2) higher density of graphene edge plane sites; and (3) localized pockets of re-hybridized orbital engineered modulated band structure provided by polyoxometalates anchored chemically on functionalized graphene nanosheets, contribute toward higher interfacial charge transfer, rapid ion conduction, enhanced storage capacity and improved electroactivity.

1. Introduction

The increasing global demand for electric energy stimulated an intense research and development activities worldwide. Efficient energy storage solutions are required for the transition to sustainable energy sources. Each renewable energy source, be it geothermal, solar or wind, sets its own requirements for power density, energy density, size, cost and life-time. Among several renewable energy sources, electrochemical energy conversion and storage systems such as rechargeable secondary batteries, electrochemical supercapacitors, also known as ultra-capacitors or electrochemical capacitors, pseudocapacitors and their hybrids, known as supercapbatteries, represent the most efficient and environmentally benign technologies. The need for high-performance, stable and scalable electrochemical electrodes and architectures is the driving force while mitigating environmental pollution [1,2]. As a result, electrochemical and electrocatalytical research is rapidly developing into parallel tracks striving toward improved electrode materials and subsequent implementation from portable consumer electronics to automobile and grid scale energy devices [3,4,5,6]. While rechargeable Li-ion batteries take advantage of bulk charge storage and exhibit high specific energy density, they suffer from low specific power density and cyclability. On the other hand, supercapacitors and pseudocapacitors store charge through surface ion adsorption (non-faradaic) and surface redox reaction (faradaic), respectively. Electrochemical supercapacitors based on metal oxides and conducting polymers featuring voltage-changing redox processes, where faradaic and non-faradaic mechanisms take place concomitantly, are also known as hybrid supercapacitors [7,8,9].
The nanoscale hybrids which combine the supercapacitive nanocarbons (activated carbon, nanotubes, mesoporous carbon, and graphene-family nanomaterials) [10,11] and pseudocapacitive or redox active transition metal oxides [6] form “organic–inorganic” hybrid supercapacitors. Graphene, an atomic thin layer of carbon atoms bonded together in a hexagonal honeycomb lattice, has extraordinary physical-chemical properties (i.e., exceptionally high surface area, surface morphology, mesoscale structure, tunable electrical conductivity, and mechanical robustness) for fundamental and applied research [12]. Likewise, functionalized graphene (i.e., oxygenated-carboxyls (–COOH) and epoxides (–ROOH) groups at the edges and hydroxyls –OH group on the surface) such as graphene oxide (GO) [13,14] and reduced form (rGO) [15] is attracting a great deal of attention because of their tunable electrical conductivity, mechanical robustness and easy processability [16,17,18,19,20,21]. As a result of tailorable materials’ surface and functional groups, they can be maximized for speedy faradaic reactions at the surface, storing electrical energy in transient chemical bonds possessing high specific power and energy density and excellent cycling stability [22]. This new class of hybrid supercapacitors is continuously improving and blurring the boundaries between batteries and supercapacitors [23]. It is worth mentioning that it is also achieved by merging redox chemistry, either by combining conventional batteries and supercapacitor electrodes in a single device equivalent to a series combination (known as supercapabatteries) [24,25] or by integrating redox active materials (conducting polymers, transition metal oxides, mesoporous semiconducting oxides, etc.) typical of batteries and supercapacitive elements in the same electrode (equivalent to a parallel combination) [6,26,27,28,29,30,31,32]. Despite significant progress toward hybrid supercapacitors, the significant understanding of storage mechanism of transition metal oxides on graphene support with optimal loading and at molecular level is lacking which is one of the prime goals of this study [33,34,35].
Polyoxometalates (POMs) are a subset of transition metal oxides that represent a diverse range of molecular clusters and an ability to form dynamic structures. Therefore, POMs exist in various shapes, size and complex co-ordinations and, in fact, they are among the largest inorganic molecules known today [36]. They are classified into three broad subsets. Heteropolyanions (HPAs) are metal oxide clusters that include heteroanions such as SO42− and PO43− and they are the most reported and explored subset for electrochemical and catalytic properties due to reversible highly redox activities [37]. They possess Keggin [XM12O40]n and Wells–Dawson [X2M18O62]n anions structures (where M = Mo(VI), W(VI), Ta, Nb, or V(V); and X is a tetrahedral template) and have high charges and strongly acid oxygen surfaces, which means they are attractive units for building blocks. Secondly, isopolyanions are composed of a metal oxide framework, but without the internal heteroatom/heteroanion and therefore are less stable. Lastly, reduced POM clusters are related to molybdenum blue species and usually their composition is largely unknown with substantial ongoing research. The POM molecules that are central to this work are mostly symmetric HPAs including polyoxomolybdates (POMs) and polyoxotunstates (POWs), which consist of molybdenum (Mo) and tungsten (W) metals, respectively, and oxygen atoms in the form of metal oxide polyhedrons [38,39,40]. In POMs, all 12 MO6 (or WO6) units conforming to so-called Keggin structures are “outer” surface moieties. Therefore, no bulk environment exists in such molecules. Moreover, they are so small and heavily charged that they are soluble in many solvents and, in principle, useless as active electrochemical electrode materials by themselves. However, POMs contribute their water solubility and faradaic charge-storage mechanisms to well-known varied redox potentials leading to robust electrodes and electroanalytical platforms [41]. Therefore, integration of POMs with graphene will lead to the development of new concept hybrid materials where surface functional moieties on GO and rGO serve as chemical linkers and POMs clusters as molecular spacers for graphene sheets that allow excess to large specific surface enabling higher storage capacity otherwise inaccessible for ion adsorption due to self-aggregation. Nevertheless, the synthesis of graphene–POM and graphene–POW hybrids as high-performance electrochemical electrodes remain elusive and a fundamental understanding of interfacial capacitance with optimal loading and associated physicochemical properties are yet to be determined [42,43,44].
We propose to design and synthesize hydrothermally functional hybrid assembly composed of POM clusters and POW nanodots building blocks integrated with supercapacitive rGO as potential electrochemical electrodes [45]. The anchoring of HPAs on three-dimensional reduced graphene oxide network prevents their dissolution into the electrolyte, provides the necessary electrical conductivity for ion transport, greater active surface area and synergistic interactions due to smaller size nanodots. This approach offers the possibility of submonolayer coverages of HPAs even at high loading for fundamental understanding at single-molecule level. The other significance of anchoring HPA species for added energy storage is the widening of working potential window since energy density is equal to ½ CV2. They are anticipated to enhance energy density, improve current carrying capacity and stability, for renewable energy and electrocatalytic sensing applications. Although recent studies have shown that POMs bind partially to GO and rGO surfaces, the nature and strength of interaction has not been measured. In this work, we dedicate our efforts investigating the optimal addition of POM and POW redox-active species on rGO nanosheets, to quantify the diffusion and heterogeneous charge transfer kinetics through electrochemical properties and mapping electroactive sites distribution using scanning electrochemical microscopy at electrode/electrolyte interfaces [46,47,48].

2. Results and Discussion

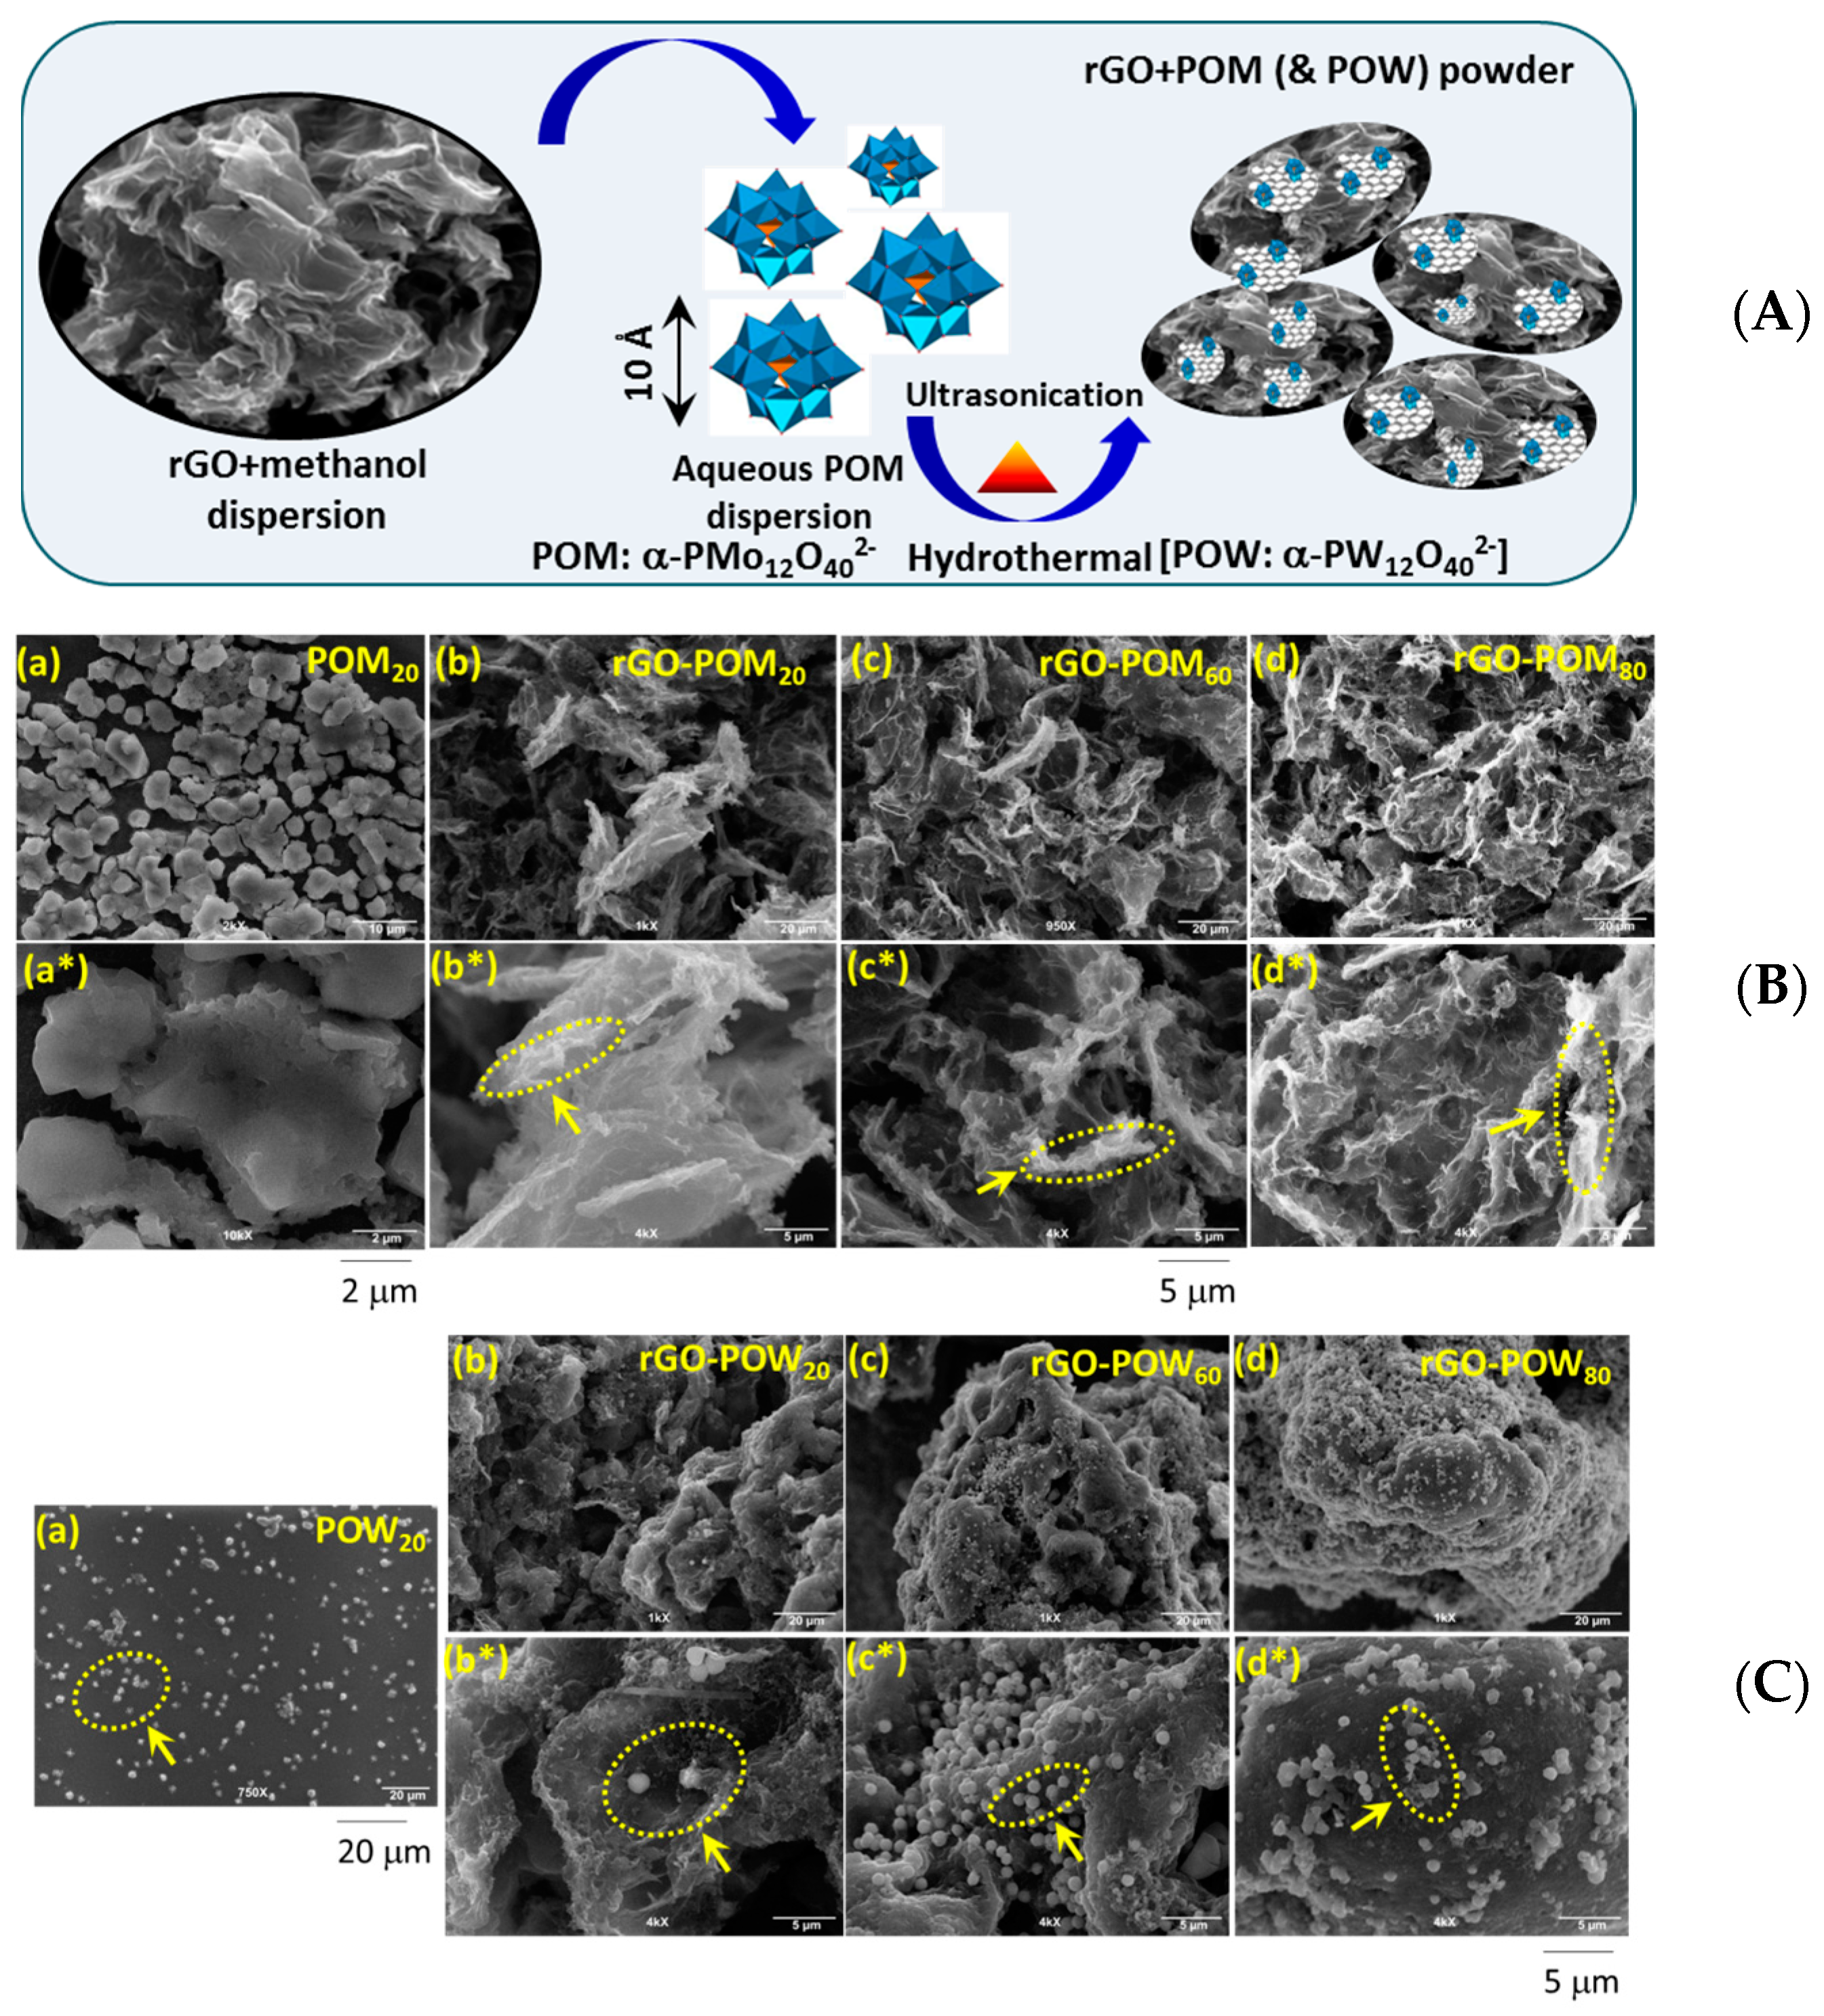
2.1. Microscopic Structural Characterization

Figure 1A–C displays the deposition scheme and representative scanning electron microscopy (SEM) images of POM20, POW20 and a series of composites with rGO (rGO–POM20,60,80 and rGO–POW20,60,80) revealing uniform surface morphology. The rGO exhibits porous architecture composed of ultrathin nanosheets conformed to electrically conductive framework beneficial for electron transfer and ion transport while maintaining electrical conductivity with substantial accessible specific surface area for ion sorption. As for the inorganic phase component, it appears to be distributed relatively uniformly over and/or within the rGO nanosheets as aggregated molecular clusters with average size <100 nm for POMs and as nanodots with no aggregation with size <50 nm for POWs. Small particles of about 10 nm were observed by SEM for the sample with higher POM and POW loadings. It is imperative to mention that, due to the difference between the atomic numbers of carbon (Z = 6), molybdenum (Z = 42) and tungsten (Z = 74), the aggregates of molecularly clustered nanodots would appear as easily detectable bright white spots in SEM micrographs. The transmission electron microscopy images acquired at 100 kV showed that the graphene sheets are homogeneously covered with HPA clusters (see Figure S1). At higher loading, i.e., the samples with concentration greater than 20 wt %, particles of 5–10 nm size correspond to HPA aggregate were observed by SEM which may contribute unambiguously to individual POM or POW clusters. The SEM images show clustering at the graphene sheet edges and regions where the sheets are either folded or crumpled. It is suggestive of the favorable interactions and possibly effective anchoring on the rGO nanosheet surface defect sites, where carbon atoms are not a perfect honeycomb structure and where oxygenated functional groups terminate sp3-bonded carbon atoms. Though further investigation is necessary, this hypothesis is consistent with our recent work that showed transition metal oxide clusters preferentially nucleate at edge and defect sites [6,28,29]. Several research groups also noted that HPAs interact with nanocarbon surfaces in the absence of functional groups such as graphite [49]. Such observations are supported theoretically, not only for transition metal oxides [6,29], but also for POM and POWs. Thus, the adsorption on graphene is energetically favorable and stronger for graphene with oxygen-containing functional groups (hydroxyls, carbonyls, carboxyls, ketones, etc.) with charge transfer to graphene from POM or POW nanodots or vice versa [50,51,52,53,54]. Furthermore, it is important to note that rGO preserves its mesoporous network even after heavy deposition of clusters. The EDX elemental spectra at various points on the samples were measured (see Figure S1) yielding average C, O, MO and W at.%. It is extremely important to note that the homogeneous dispersions of electroactive centers in hybrid materials act as molecular spacers preventing aggregation of graphene nanosheets which allows higher accessibility for ion adsorption and subsequently enhanced energy storage capacity. While carboxyl groups are acidic and lose their proton to become negatively charged in contact with water, all other groups are weak bases that can be protonated under strongly acidic conditions. Therefore, it is facile to develop strong electrostatic attraction (repulsion) interactions between the positively (negatively) charged carbon surface positive (negative) ζ potential and the negatively charged HPA anions depending upon HPAs docking on the graphene basal plane (edge) sites, respectively.

2.2. Optical and Vibrational Spectroscopy

The optical (UV-Vis absorption and fluorescence) spectroscopy measurements are carried out in solutions of POM20,60 and POW20,60 by themselves and their suspensions with rGO (rGO–POM10,60,80 and rGO-POW10,60,80) to investigate the electronic structure of rGO supported HPAs, the representative spectra are shown in Figure S2. In general, all absorption spectral bands arising in UV-Vis range of the electronic spectra of heteropoly compounds containing Keggin polyanion [PVxMo12−xO40](3+x)−, named Keggin Unit (KU), is due to the ligand-metal charge transfer (LMCT): O2−→ Mo6+ (W6+) and O2− → V5+ [55,56]. Raman spectroscopy is widely used non-destructive technique for the characterization of carbon-based materials [57] and POMs [58,59,60], M = Mo and W since it is highly sensitive to local structure and lattice vibrational bonding configurations within molecules and their interactions with graphene. Keggin-type HPAs are formed by assembling three MO6 octahedra by edge-sharing oxygen atoms (M–Oc–M) to form M3O13 sets, which further condense by sharing corner oxygen atoms (M–Ob–M) around a central atom (P or Si) to form a cage. Each M3O13 also presents three terminal oxygen atoms (M=Od). Figure S3 shows the Raman spectra of rGO supported POMs and POWs with varying loading besides POM20 and POW20 as control. Qualitatively, all the Raman spectra show bands associated with HPAs (POM and POW) and rGO support. For instance, four prominent bands namely, D (disorder-induced in-plane A1g zone edge mode), G (in-plane E2g vibration mode of sp2 hybridized carbon atoms), 2D (second-order D) and D+G (combination) bands occurring at approximately 1335, 1600, 2660 and 2925 cm−1, respectively are characteristic bands for rGO. The G and 2D peak positions, the shape of 2D peak, the peak intensity, D to G intensity ratio (ID/IG), the G to 2D peak intensity (IG/I2D) ratio determine number of layers, type and density of defects, degree of disorder, sp2-bonded carbon domains size, stacking order and electronic properties of edges for graphene [61]. The shift in G band position can also be used to determine the extent of reduction of graphene oxide (GO) to rGO. Raman spectra of both POM and POW systems contain higher intensity bands in the interval 1050–800 cm−1 besides peaks at lower frequency occurring at ≤250 cm−1. In particular, the characteristic peaks assigned to the Keggin anion are symmetric stretching vibrations νs(M=Od) at about 1010 and 995 cm-1, a mix of stretching vibrations νas(M=Od) and νs(P−Oa) at ~990 and 980 cm−1 and 850 and 940 cm−1 and symmetric stretching vibrations νs(M−Ob−M) at ~925 and 900 cm−1 for POW and POM, respectively [62]. The bands from POMs and POWs are also observed occasionally for hybrids depending upon the location on the rGO supported samples. In the case of their absence or weaker intensity, it is due to either low concentration in the probe area or loss of their tetrahderal symmetry which tends to broaden the peaks and loss in intensity [63,64]. The vibration frequency characteristics of HPAs abovementioned are influenced by several parameters such as structural isomerism, nature of counterion or anion–anion interactions. The spectral analysis in terms of the position and intensity ratio of corresponding bands are presented in Tables S1 and S2.

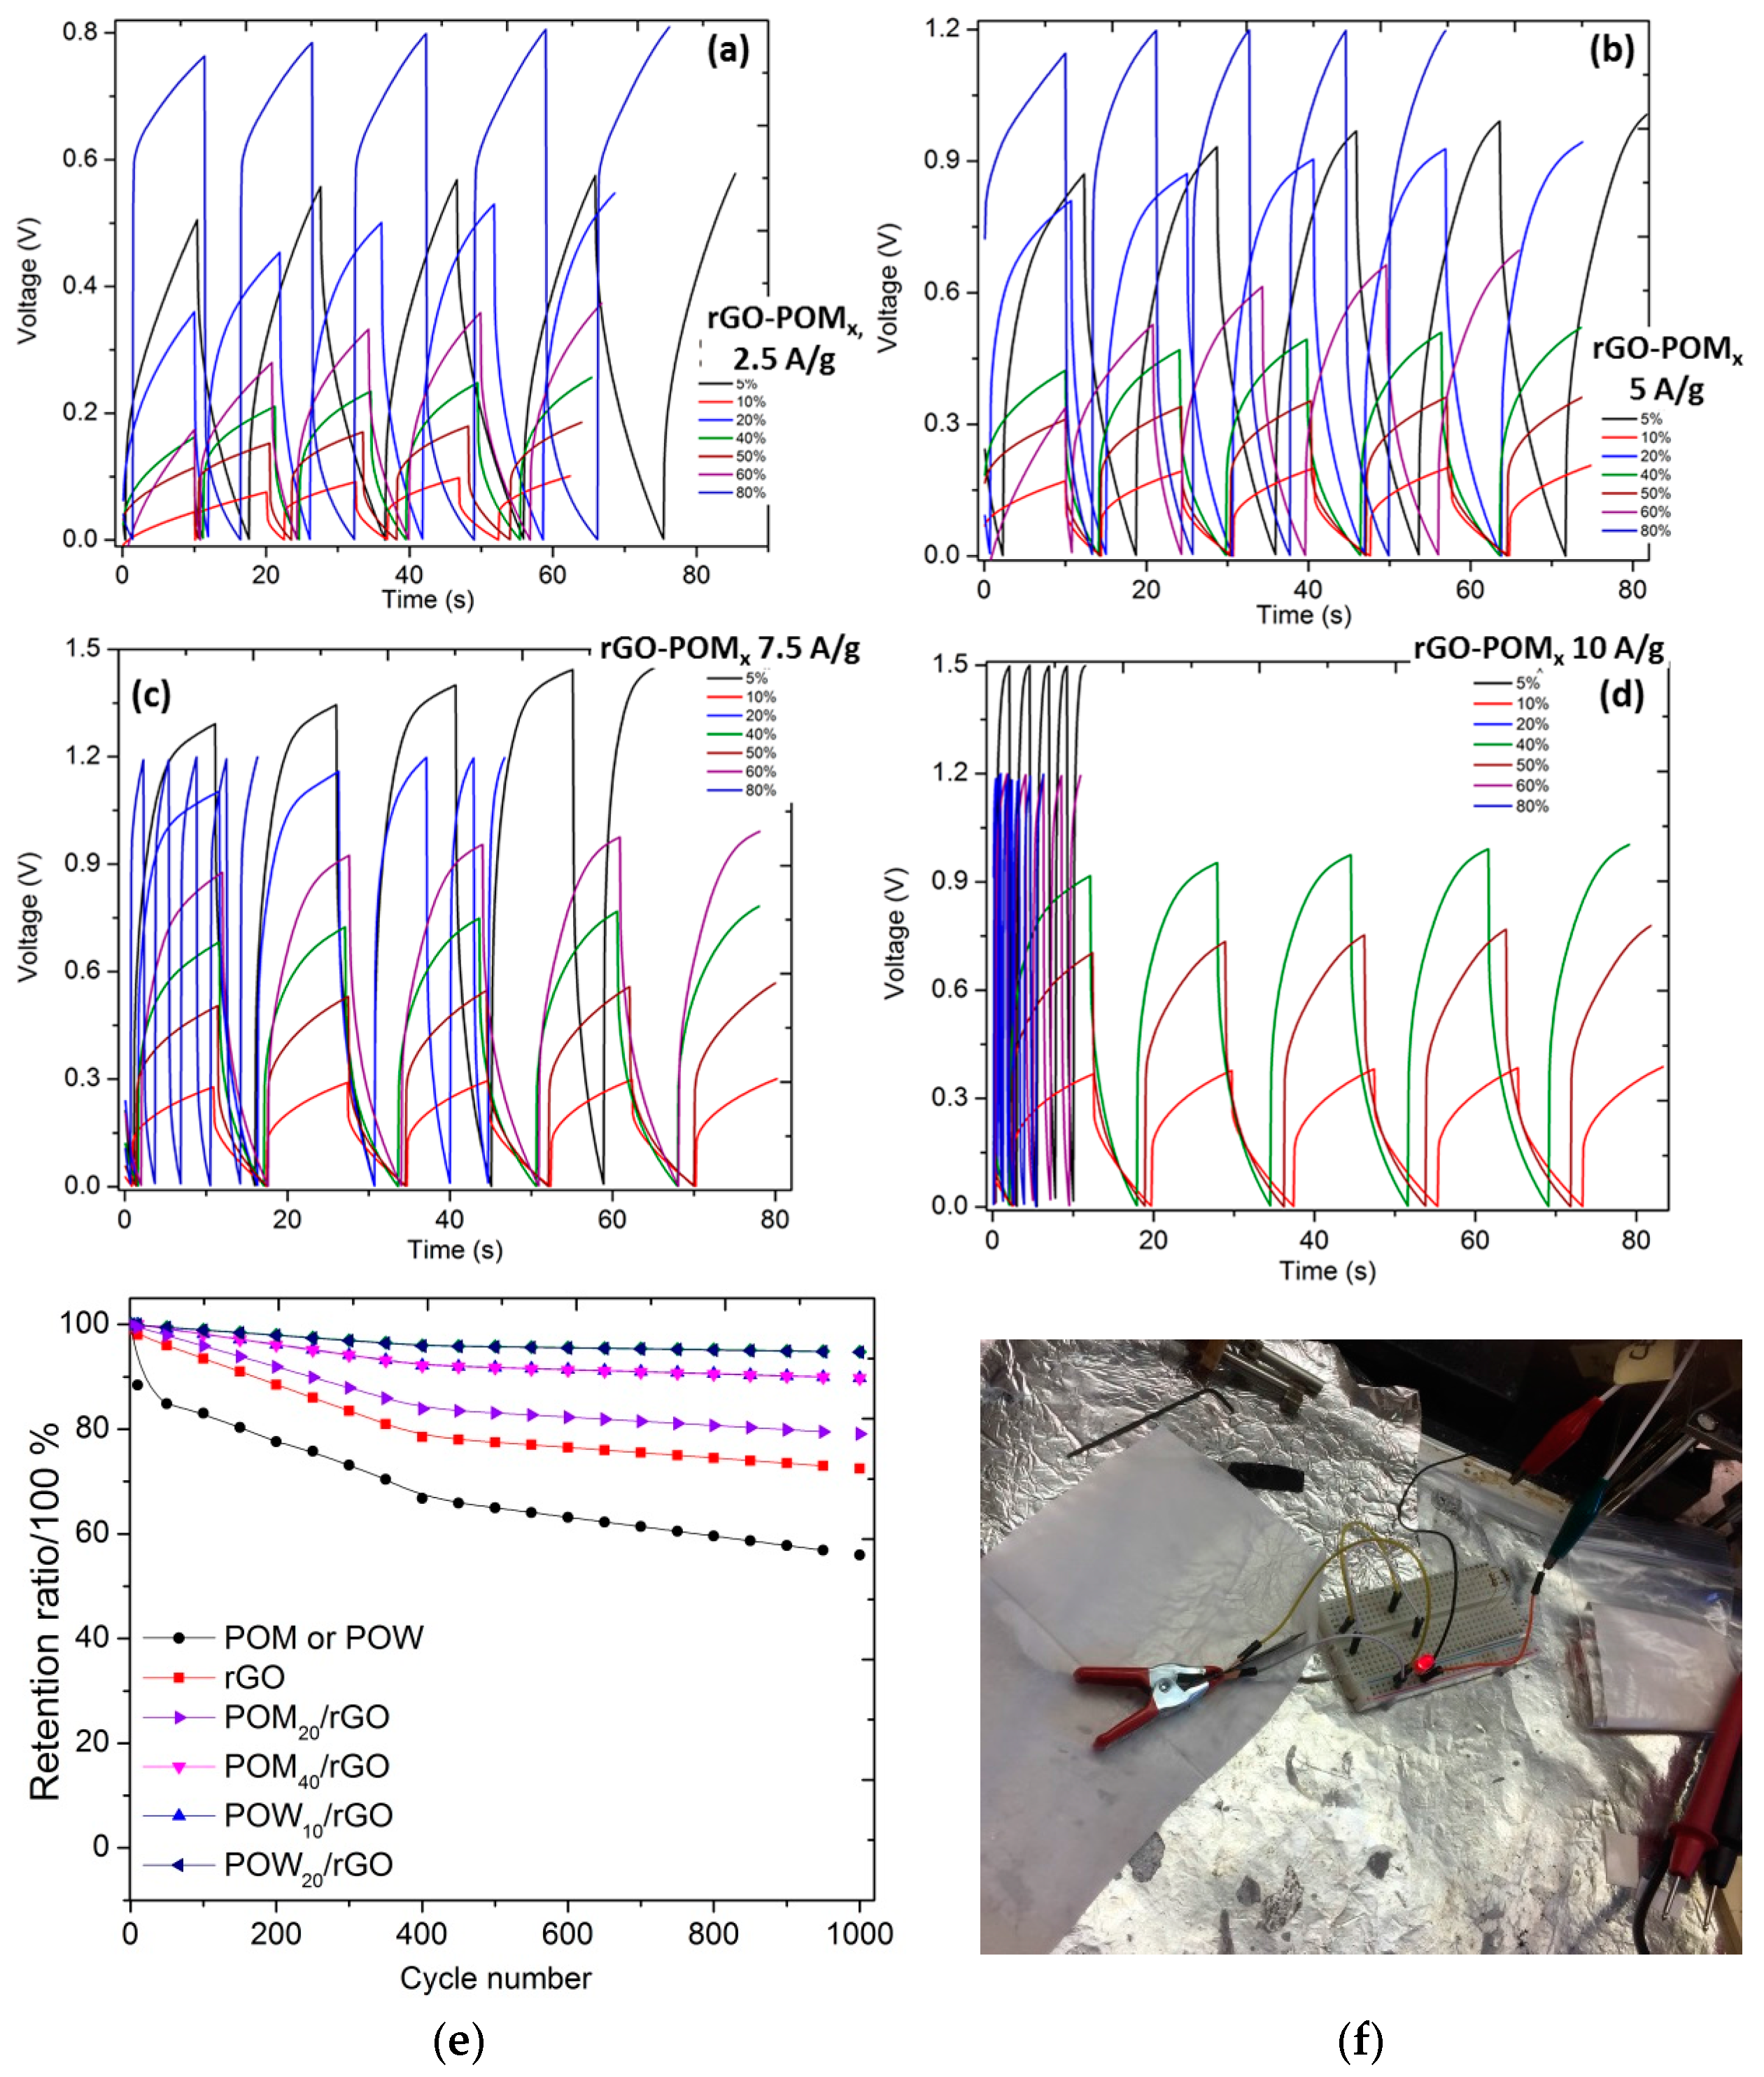
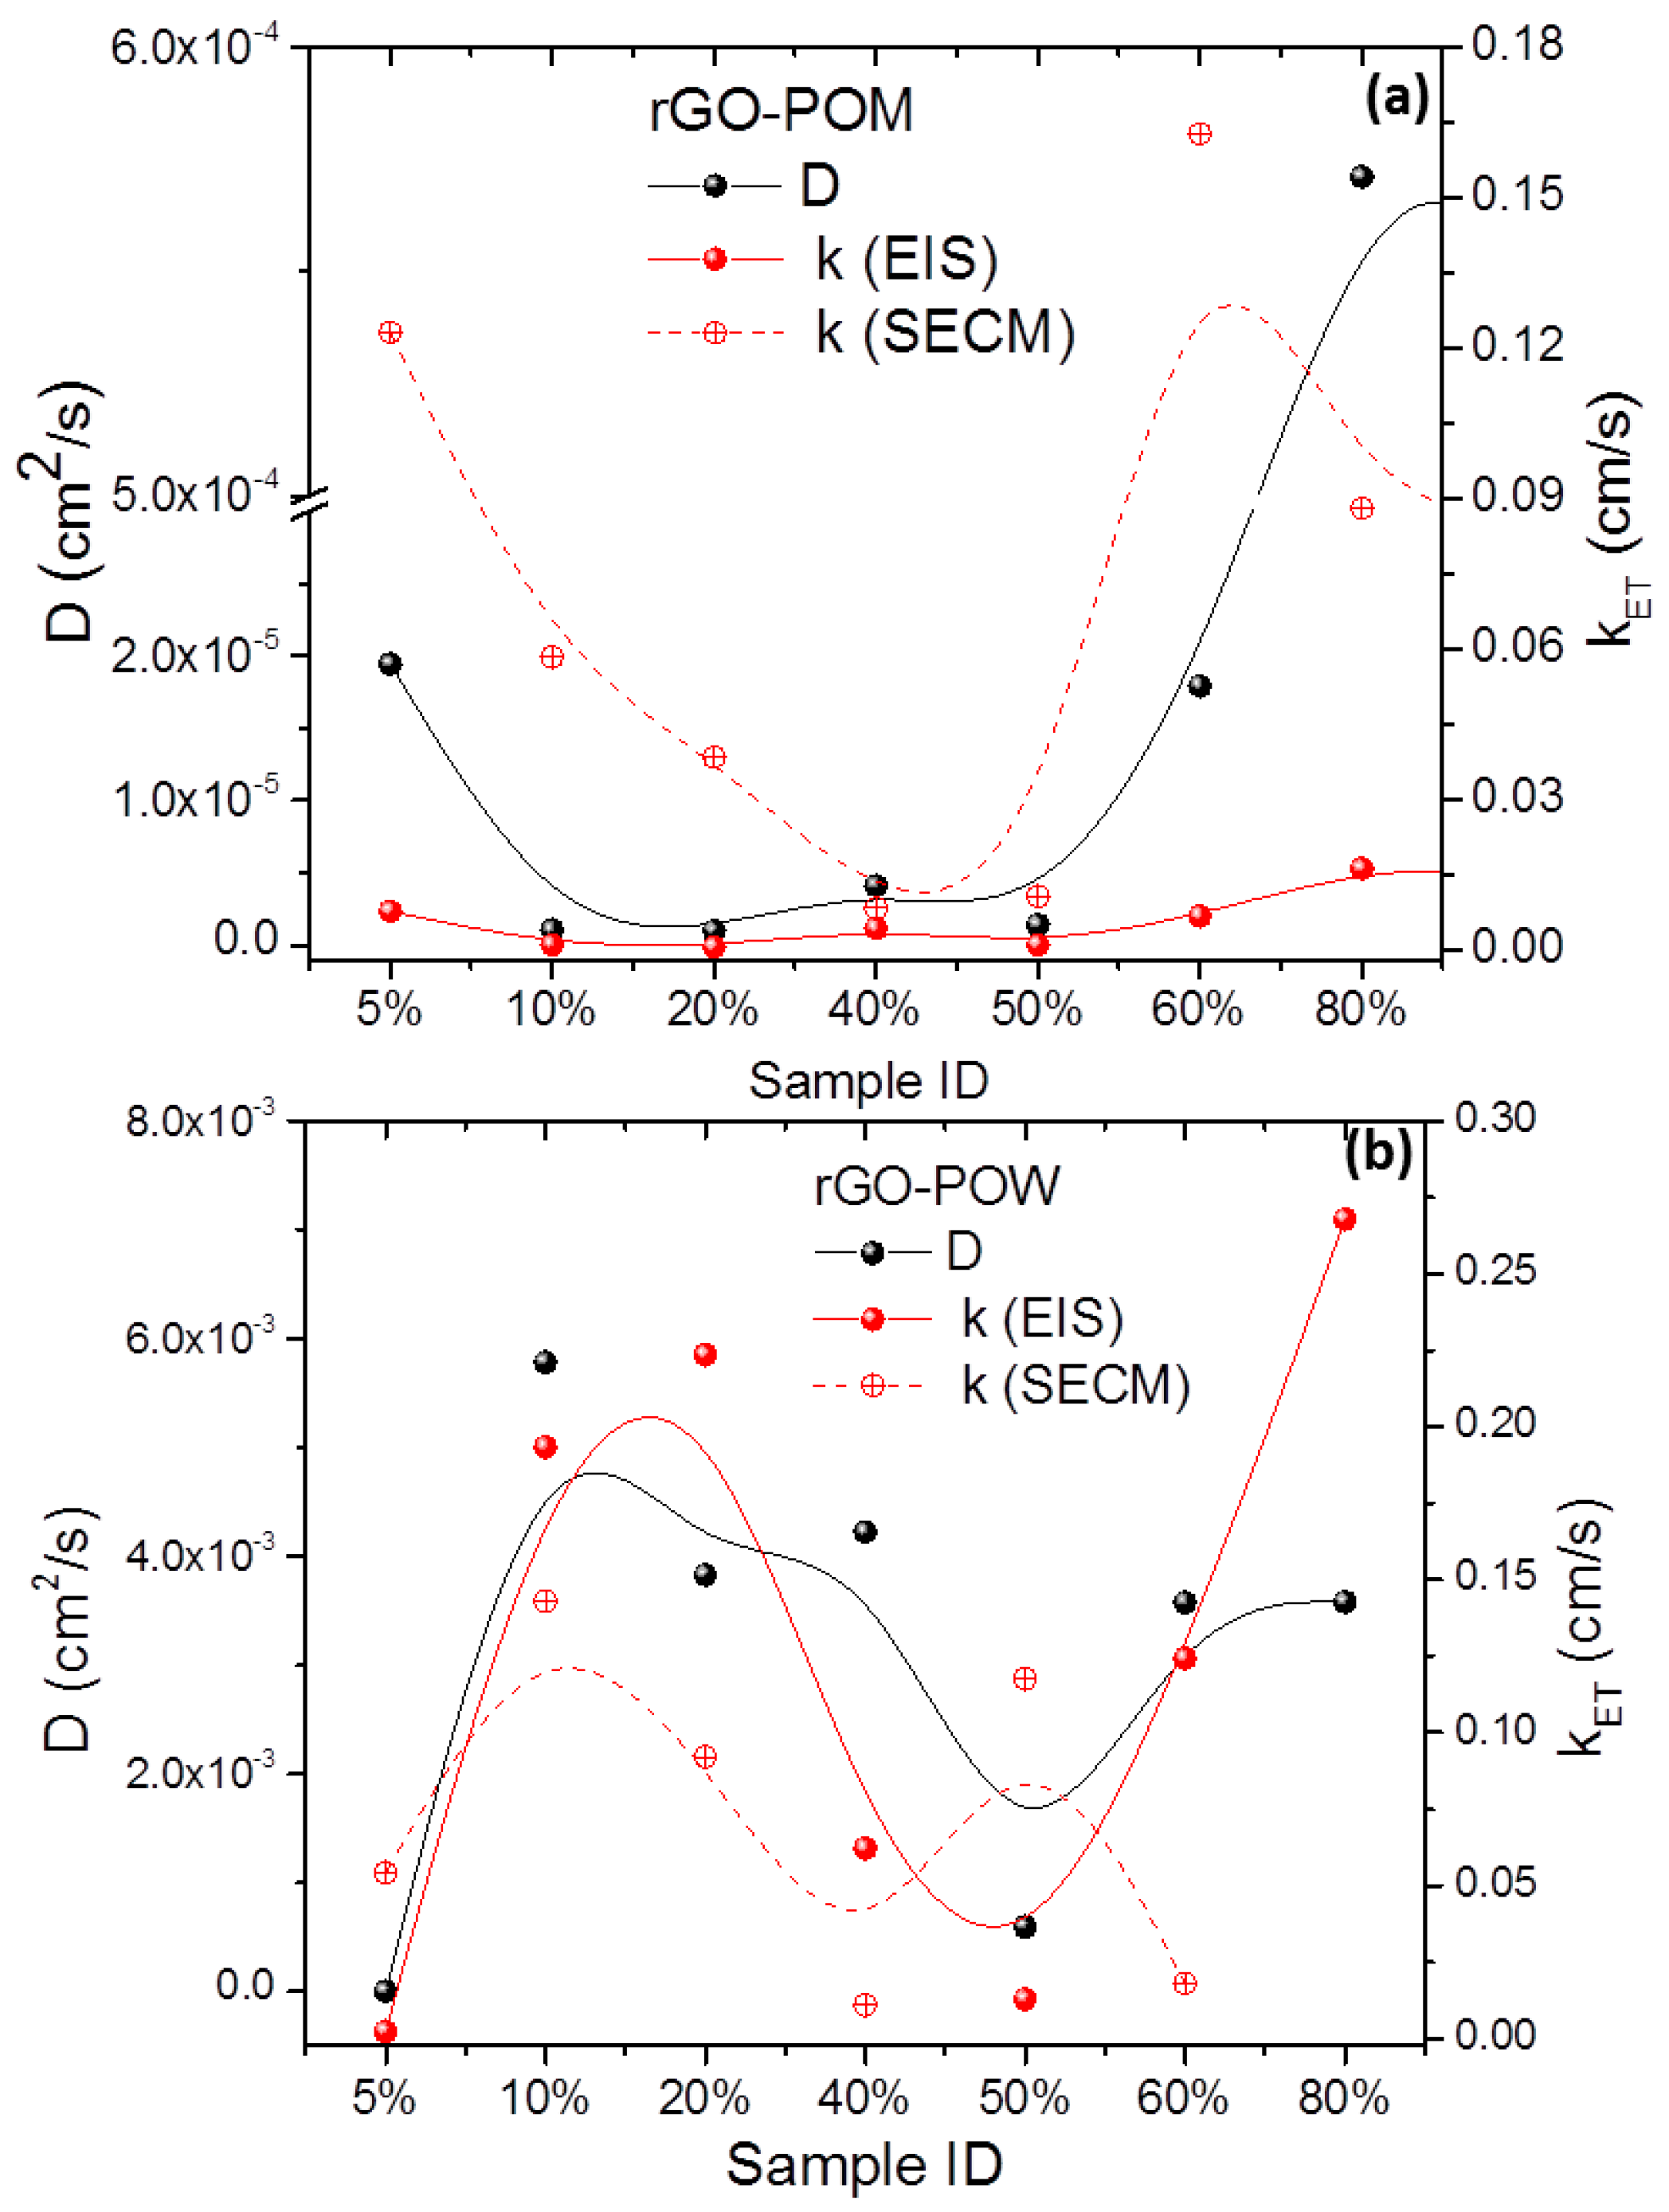
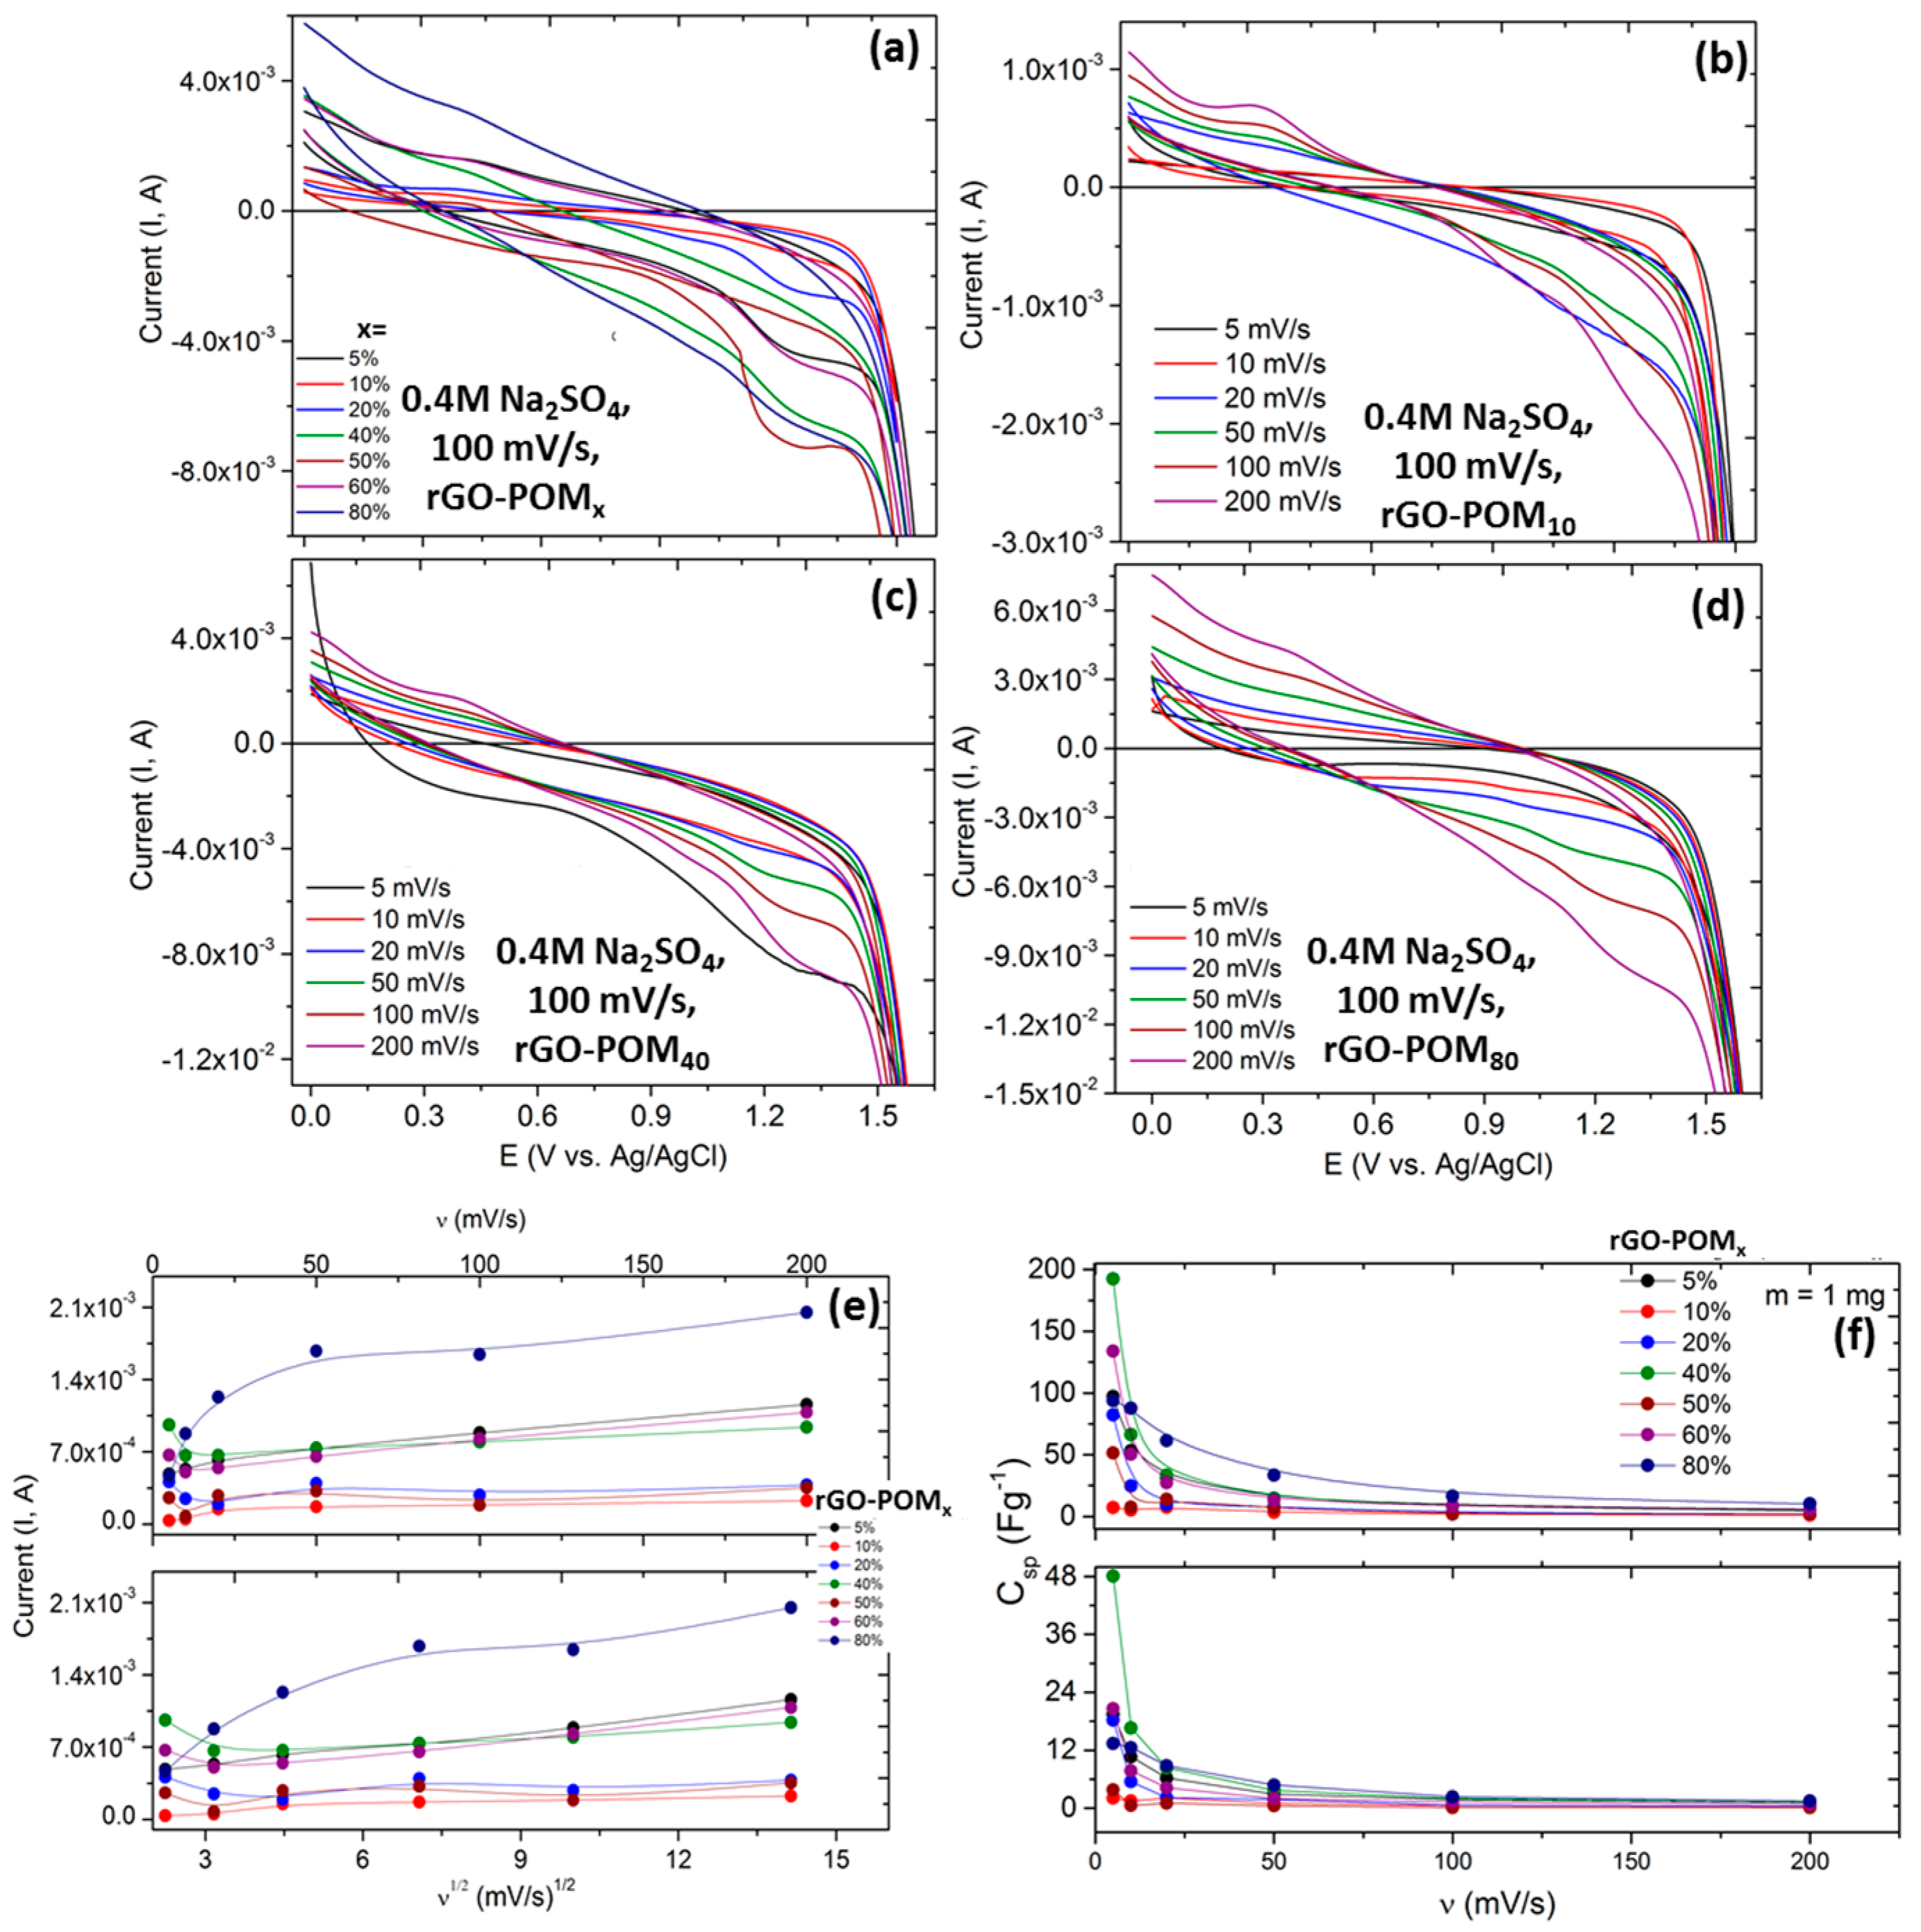
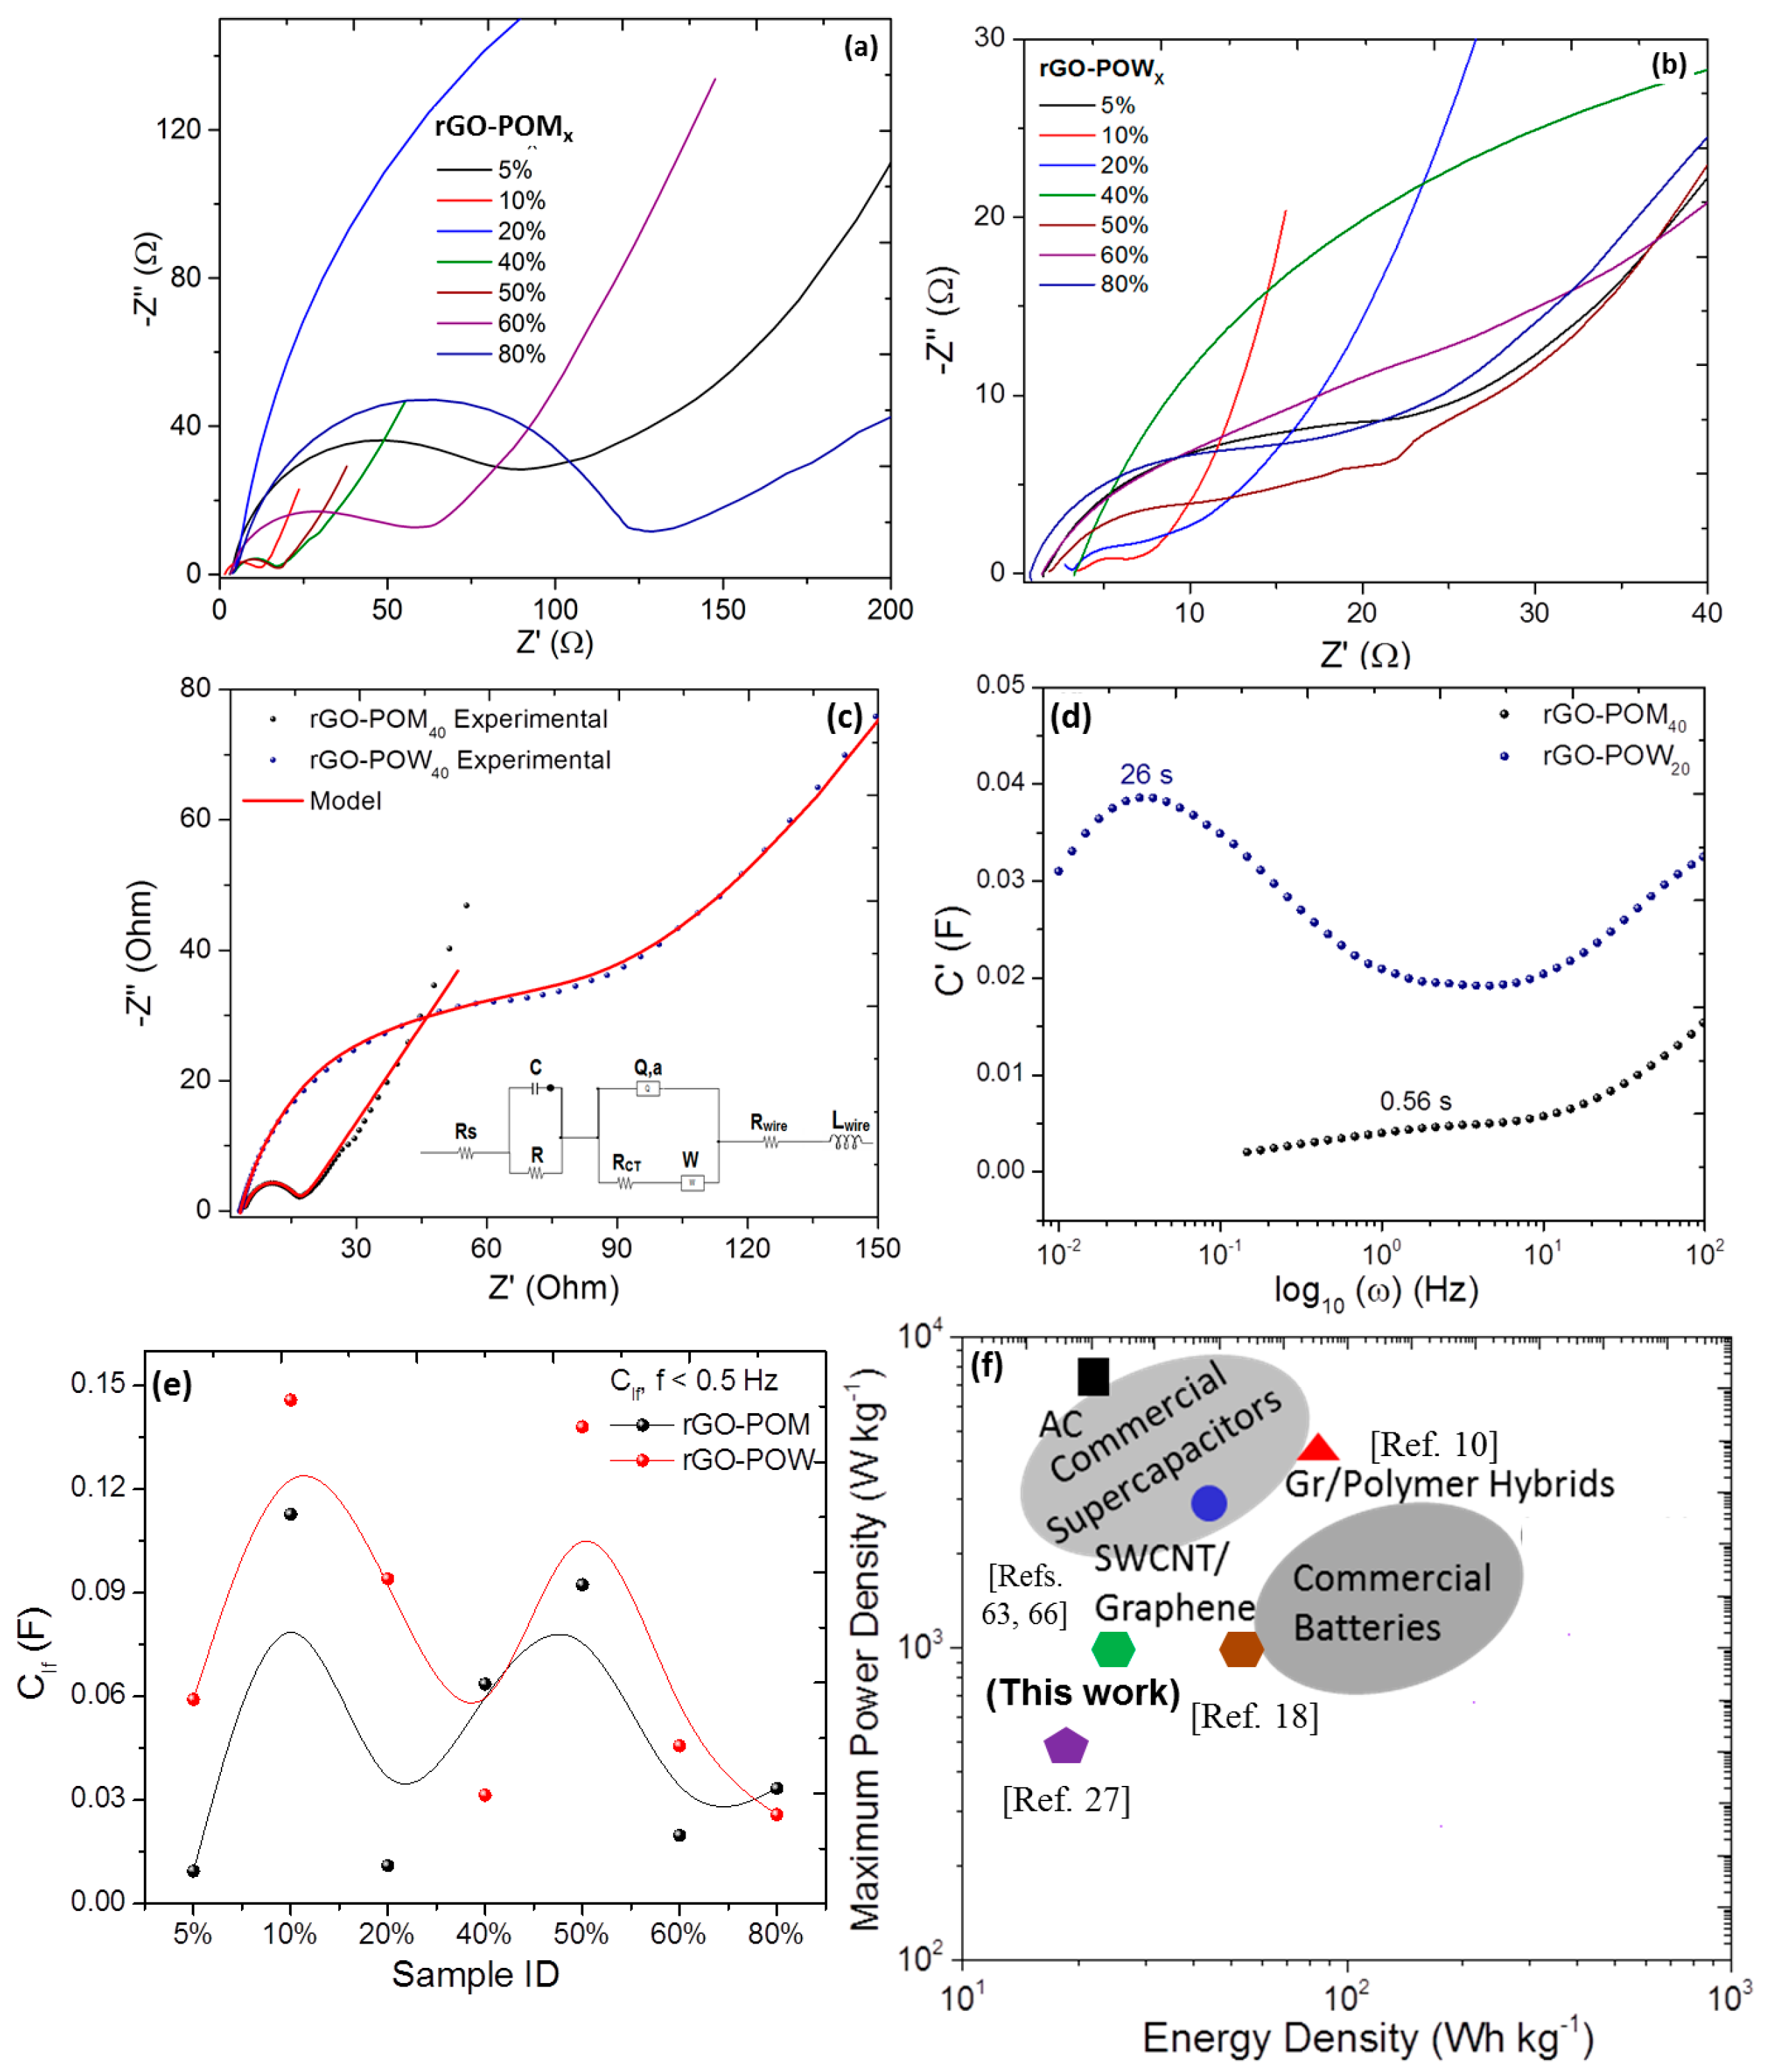
2.3. Electrochemical Properties

To evaluate the electrochemical properties of hybrid samples, we performed cyclic voltammetry (CV) in 0.4 M Na2SO4 electrolyte in addition to characterizing electrodes composed exclusively of component materials (i.e., rGO, POM and POWs) that will help to determine the supercapacitive and pseudocapacitive contributions, respectively, within hybrids electrodes. Figure 2a–d and Figure S4a–d show cyclic voltammograms for hybrids loaded with different HPA concentration with scan rate in the potential range 0.0 to +1.6 V exhibiting broad redox peaks. The CVs from rGO (see [6]), which is nearly rectangular indicative of almost an ideal supercapacitor (where charge storage is through electrochemical double layer) in stark contrast to hybrids investigated hereby. Since it is rGO, the pseudocapacitive contribution due to surface functionalities is expected to be far less and there are no redox peaks (not shown, see [6]).
The specific capacitance for rGO by itself is approximately 70–80 F·g−1. Likewise, POM and POW only materials with moderate 20–40 wt % show specific capacitance of ~60–70 F·g−1. All hybrid electrodes displayed well-defined pseudocapacitive behavior with multiple reversible redox waves centered at +0.4/+0.3 V (cathodic I/anodic II) and +1.0/+1.3 V (cathodic III/anodic IV) with respect to Ag|AgCl. They have been reported to correspond to a sequence of reversible electron transfer reactions (a one-electron transfer, another one-electron and two-electron reduction process that is pH dependent) for heteropolymolybdates and heteropolytugstates anions clusters [65]:
PM 12 O 40 3 + e PM 12 O 40 4
PM 12 O 40 4 + e PM 12 O 40 5
PM 12 O 40 5 + 2 e + H + PM 12 O 40 6
Thus, use of POM and POW in hybrid materials provides a faradaic contribution to the specific capacitance. However, the redox peaks become lesser defined with increasing scan rate despite stabilized interactions between rGO and HPAs. It is related to electrodes kinetic dependence of the faradaic processes in comparison with the electrochemical double-layer capacitive mechanisms. Similar observations were made with activated carbon, porous carbon and graphene oxide as supports. Important to mention that HPAs by themselves progressively leach into the electrolyte while they are adsorbed strongly on rGO and leaching is minimal except in alcohols. The rectangular CV loop desirable for supercapacitor is superimposed with redox peaks and the rectangular area increased with increasing scan rate as expected (5, 10, 20, 50, 100, and 200 mV/s). Alternatively, these electrodes show larger integrated area CV curves and therefore they have higher Cs. Figure 2e,f shows the variation of maximum current with scan rate (v) and square root scan rate (v1/2). A quasi-linear behavior, especially at higher scan rates, is reminiscence of diffusion-limited (mass transport) phenomenon and they are representative of multi-electron quasi-reversible electron transfer process attributed to composite nature of our hybrid electrode materials. The magnitude of ion current is governed by Randles–Ševćik equation for a reversible transfer process,
I rev = 0.446 F A C ( FD v / RT ) 0.5
Or
I rev = ( 2.69 × 10 5 ) n 3 / 2 A C D 1 / 2 v 1 / 2
where A is the geometric area of the electrode (cm2), F is Faraday Constant (C·mol−1), D is diffusion coefficient (cm2·s−1), C is concentration (mol·cm−3), v is scan rate (V/s), R and T are usual constants, and n is the total number of electrons transferred in the electrochemical process. The analysis of ion current helped to determine D that ranged 5 × 10⁻¹⁰–2 × 10⁻⁹ m2 s−1, which decreases marginally beyond 40 wt %, lesser for higher POM mass loaded hybrids as compared with POW-based hybrids. The Cs of hybrid electrodes are calculated according to Equation:
1 m v ( V f V i ) V i V f I ( V ) d V
where m is the mass of active electrode material (g) measured using micro-balance estimated to be 1–5 mg. Figure 2f presents variation in upper and lower bound Cs with scan rate showing gradual decrease in Cs peaking at scan rate 5 mV·s−1, which are 240, 140, and 100 F·g−1, and 350, 240 and 200 F·g−1 for POM- and POW-based hybrid electrodes, respectively. While these values are not significantly higher to those reported with transition metal oxides [6,29,30,31,32], but these studies are unprecedented and are utilized to gain fundamental insights into charge transfer dynamics and ion transport at molecular level approaching to single-molecule level depending upon the loading. The V–t profiles between 0 and 1.5 V at different current densities and cyclability of various hybrid electrodes (see Figure S4) exhibits relatively stable performance and the fading in Cs is due to internal resistance and polarization of the electrodes. We also measured Cs using charging–discharging (V–t) profiles (Figure 3a–d and Figure S4) and the values are comparable with those determined using CV curves. Generally, the rate capability is strongly influenced by the ion sorption, electrolyte ions accessibility, interfacial diffusion and the charge transfer through or across the electrode. At higher scan rates, any of these electrode kinetic processes is slower limiting the Cs (see Figure 3e for retention). Although rGO has smaller supercapacitive contribution to the hybrid composites, it offers excellent electronic conductivity and mechanical robustness and therefore can shuttle electrons between POM (and POW) clusters and current collector. Moreover, the chemical bridging between component building units into a single system enhanced the storage capacity of “hybrid” electrodes via topologically interconnected and open network of mesoporous rGO sheets allowing partial hydrated/solvated ions comparable to those reported for graphene/NiO, graphene/PAni electrodes and graphene/MnO2 [9,28,66]. To elucidate practical applicability of these hybrid electrodes (rGO–POM40), a coin cell with redox-active electrolyte was assembled and the demonstration was carried out with a red LED provided (see Figure 3f). A single LED is lit by a symmetric cell for almost two minutes and the energy output founded on rapid charging after a short full-charging time of 8 s, indicating a sustained effort.
To further understand the unique performance of hybrid electrodes, electrochemical impedance spectroscopy (EIS) data were acquired, which enables convenient spectroscopic mapping of electron transfer efficacy and helped to quantify electronic and ionic contributions, interfacial capacitance and surface diffusive behavior besides determining various circuit elements in bulk electrolyte at the electrode/electrolyte interface. Nyquist plots (−Z″ versus Z′) for representative hybrids are shown in Figure 4a,b, with semi log frequency. These plots exhibit reasonably good supercapacitive behavior with a straight sloping line (i.e., solid-state diffusion in bulk electrolyte and SO42− ion diffusion into electrode) in the low-frequency and a small semicircle arc (i.e., solid-electrolyte interphase and grain boundary) in the high-frequency region. The impedance data are simulated by different circuit simulation modeling to fit experimental data using in-built “sim” software with our electrochemical workstation following procedure described in [29]. In principle, the ESR of the composite hybrid electrodes determined from high-frequency intercept at real Z’, is smaller (<2.0 Ω) than those of only components (>10 Ω). The fitting data and the equivalent circuit model are shown in Figure 4c inset consisting of equivalent series resistance (ESR; Rs) that includes ionic or bulk resistance of the electrolyte solution combined with interface resistance, the intrinsic and contact resistance at the electroactive material/current collector [67], charge transfer resistance (Rct), Warburg impedance (ZW), double layer capacitance (Cdl) as in Randles’ equivalent circuit and constant phase element (CPE; Q, n) along with supplementary wire resistance, an RC circuit and constant inductance (L, 7 × 10⁻⁷ H) from connecting leads [29,68,69,70,71]. The arc in the high-frequency region corresponds to charge transfer resistance (Rct) caused by the pseudocapacitive or Faradaic reactions of electroactive electrode material, double layer charging on the electrode surface (Cdl) and Warburg impedance (ZW) [72]. For macroelectrode and diffusion layer of infinite thickness,
Z W = R ct λ ( ω ) 1 / 2
and λ = k ET 2 D , kET is the heterogeneous kinetics on the electrode and D is the diffusion coefficient of the redox species. The relatively lower Rct values for almost all of the hybrid electrodes studied imply an enhancement in the electronic and ionic conductivities of HPAs with the presence of functionalized graphene support. It is important to note that Rct values are higher for some of the hybrid electrodes especially when modeled with CPE circuit element [67,68] and chemically bridged POMs and POWs while complying these values with other electrodes. It justifies the usefulness of CPE model. Finally, the slope of the Nyquist plots in the low frequency region tends to increase with presence of underlying graphene support, reflecting a decrease in the Warburg resistance (W) or faster electrolyte ion diffusion into or onto the hybrids. Table S3 summarizes the impedance spectroscopy modeling results. Considering the supercapacitor as a whole system for evaluating frequency dependent capacitive behavior, the capacitance C (ω) can be expressed as [73]:
C ( ω ) = 1 j ω Z = ( Z ( ω ) ω | Z ( ω ) | 2 + j Z ( ω ) ω | Z ( ω ) | 2 ) = C ( ω ) j C ( ω )
The low frequency of real part C′(ω) corresponds to effective capacitance of supercapacitor devices and imaginary part C″(ω) is related to the energy dissipation due to an irreversible process. The electrode response time τ = 1/fm, is estimated from the frequency inverse that correspond to the maximum of the imaginary capacitance as shown in Figure 4d for representative hybrids. The relatively larger response time, from 0.5 to 13 s for POM and from 0.46 s to 26 s for POW series, is due to smaller RC constant and since the series resistance is lower; this behavior is due to increase in specific capacitance. Figure 4e shows representative low frequency (Clf) capacitance variation for all hybrids studied derived following relationship:
1 C If ( ω ) = Z ( ω ) 1 / ω
The Clf peaks for hybrid electrodes with 10 and 40 wt % rGO–POW and rGO–POM consistent with the results those obtained with transition metal oxides nanostructures anchored on graphene-family nanomaterials [6,28]. We attempted to calculate the energy density
E = 1 2 C S V 2 m × 1000 3600
for these hybrid electrodes reaching values ranged between 5 and 60 Wh·kg−1, respectively, at power density
P = E Δ t = I Δ V 2 m = V 2 4 m R s × 1000
of 1.0 kW·kg−1 following Ragone plot. It is suggestive that ordered structure can reduce the ionic diffusion path, favor ionic motion inside the films and improve the ion accessibility of electrode materials, which tends to gradually disrupt with aggregated POM and POW clustering over rGO support. While it is not significant to compare the specific power and energy densities when the mass loading is smaller, we made an attempt to generate Ragone plot (Figure 4f) illustrating the performance comparison of different electrodes from literature with those studied in this work. They lie in the cusp bridging the gap between commercial batteries and supercapacitors [9,28,74,75].

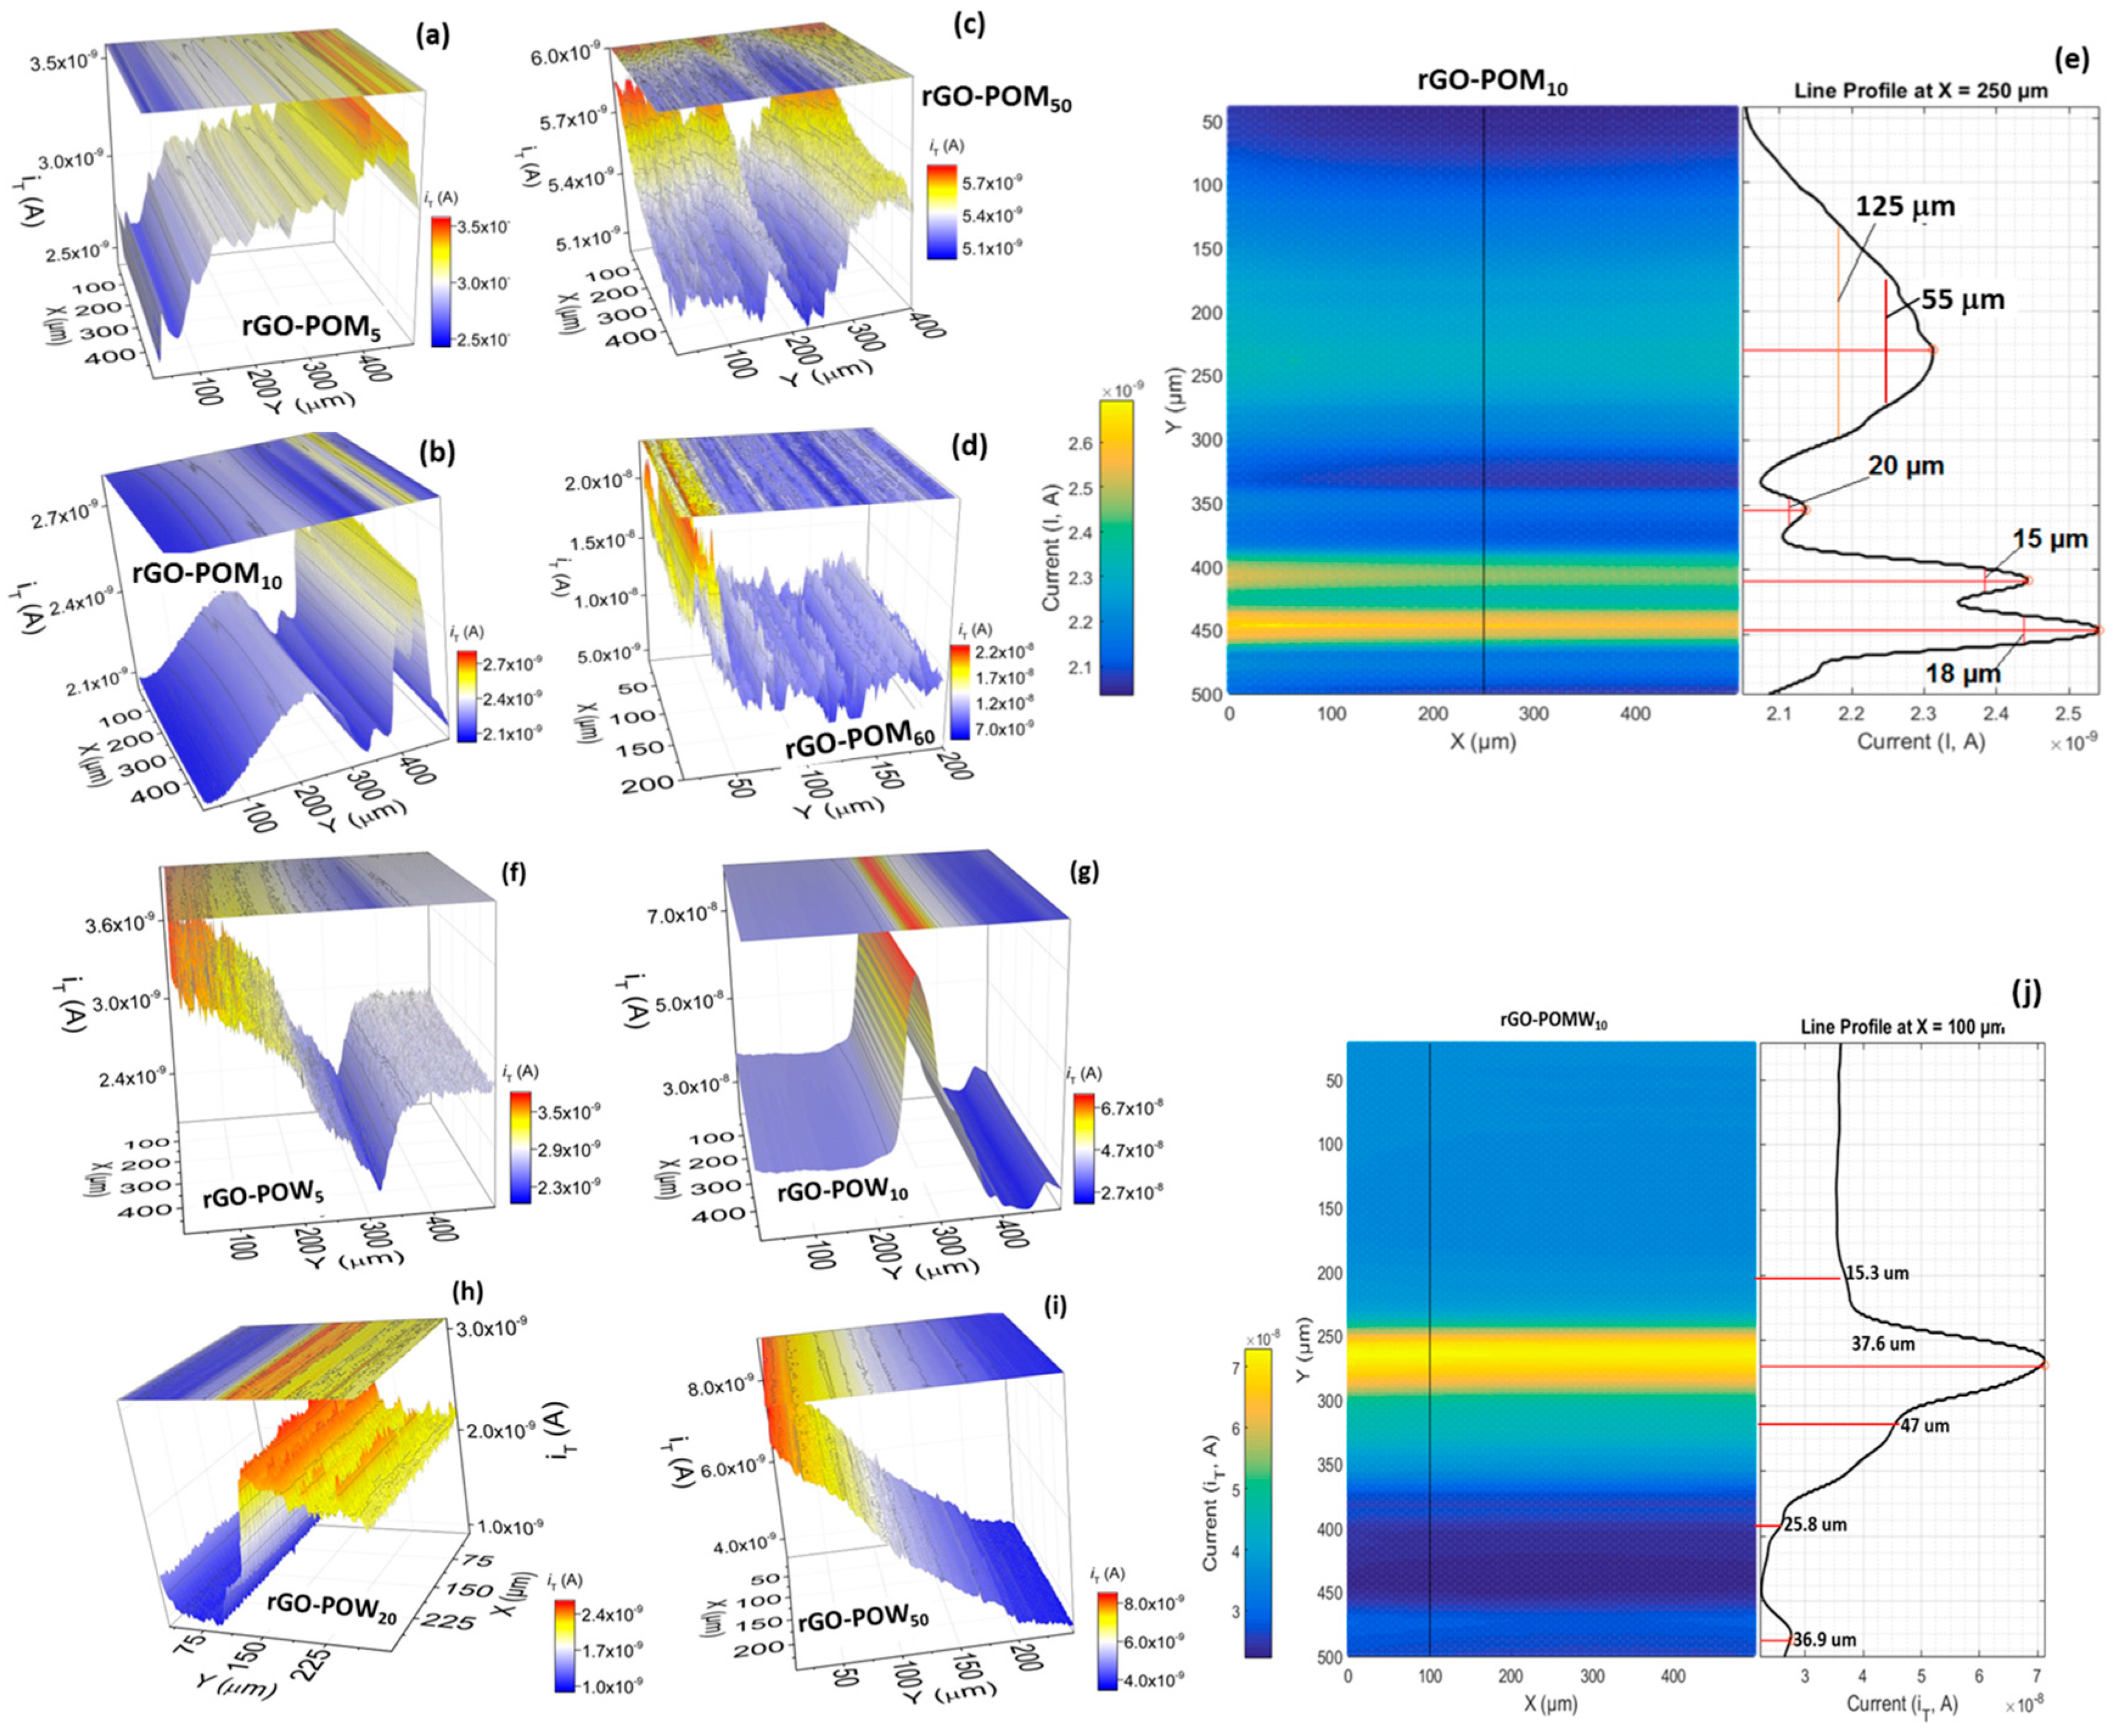
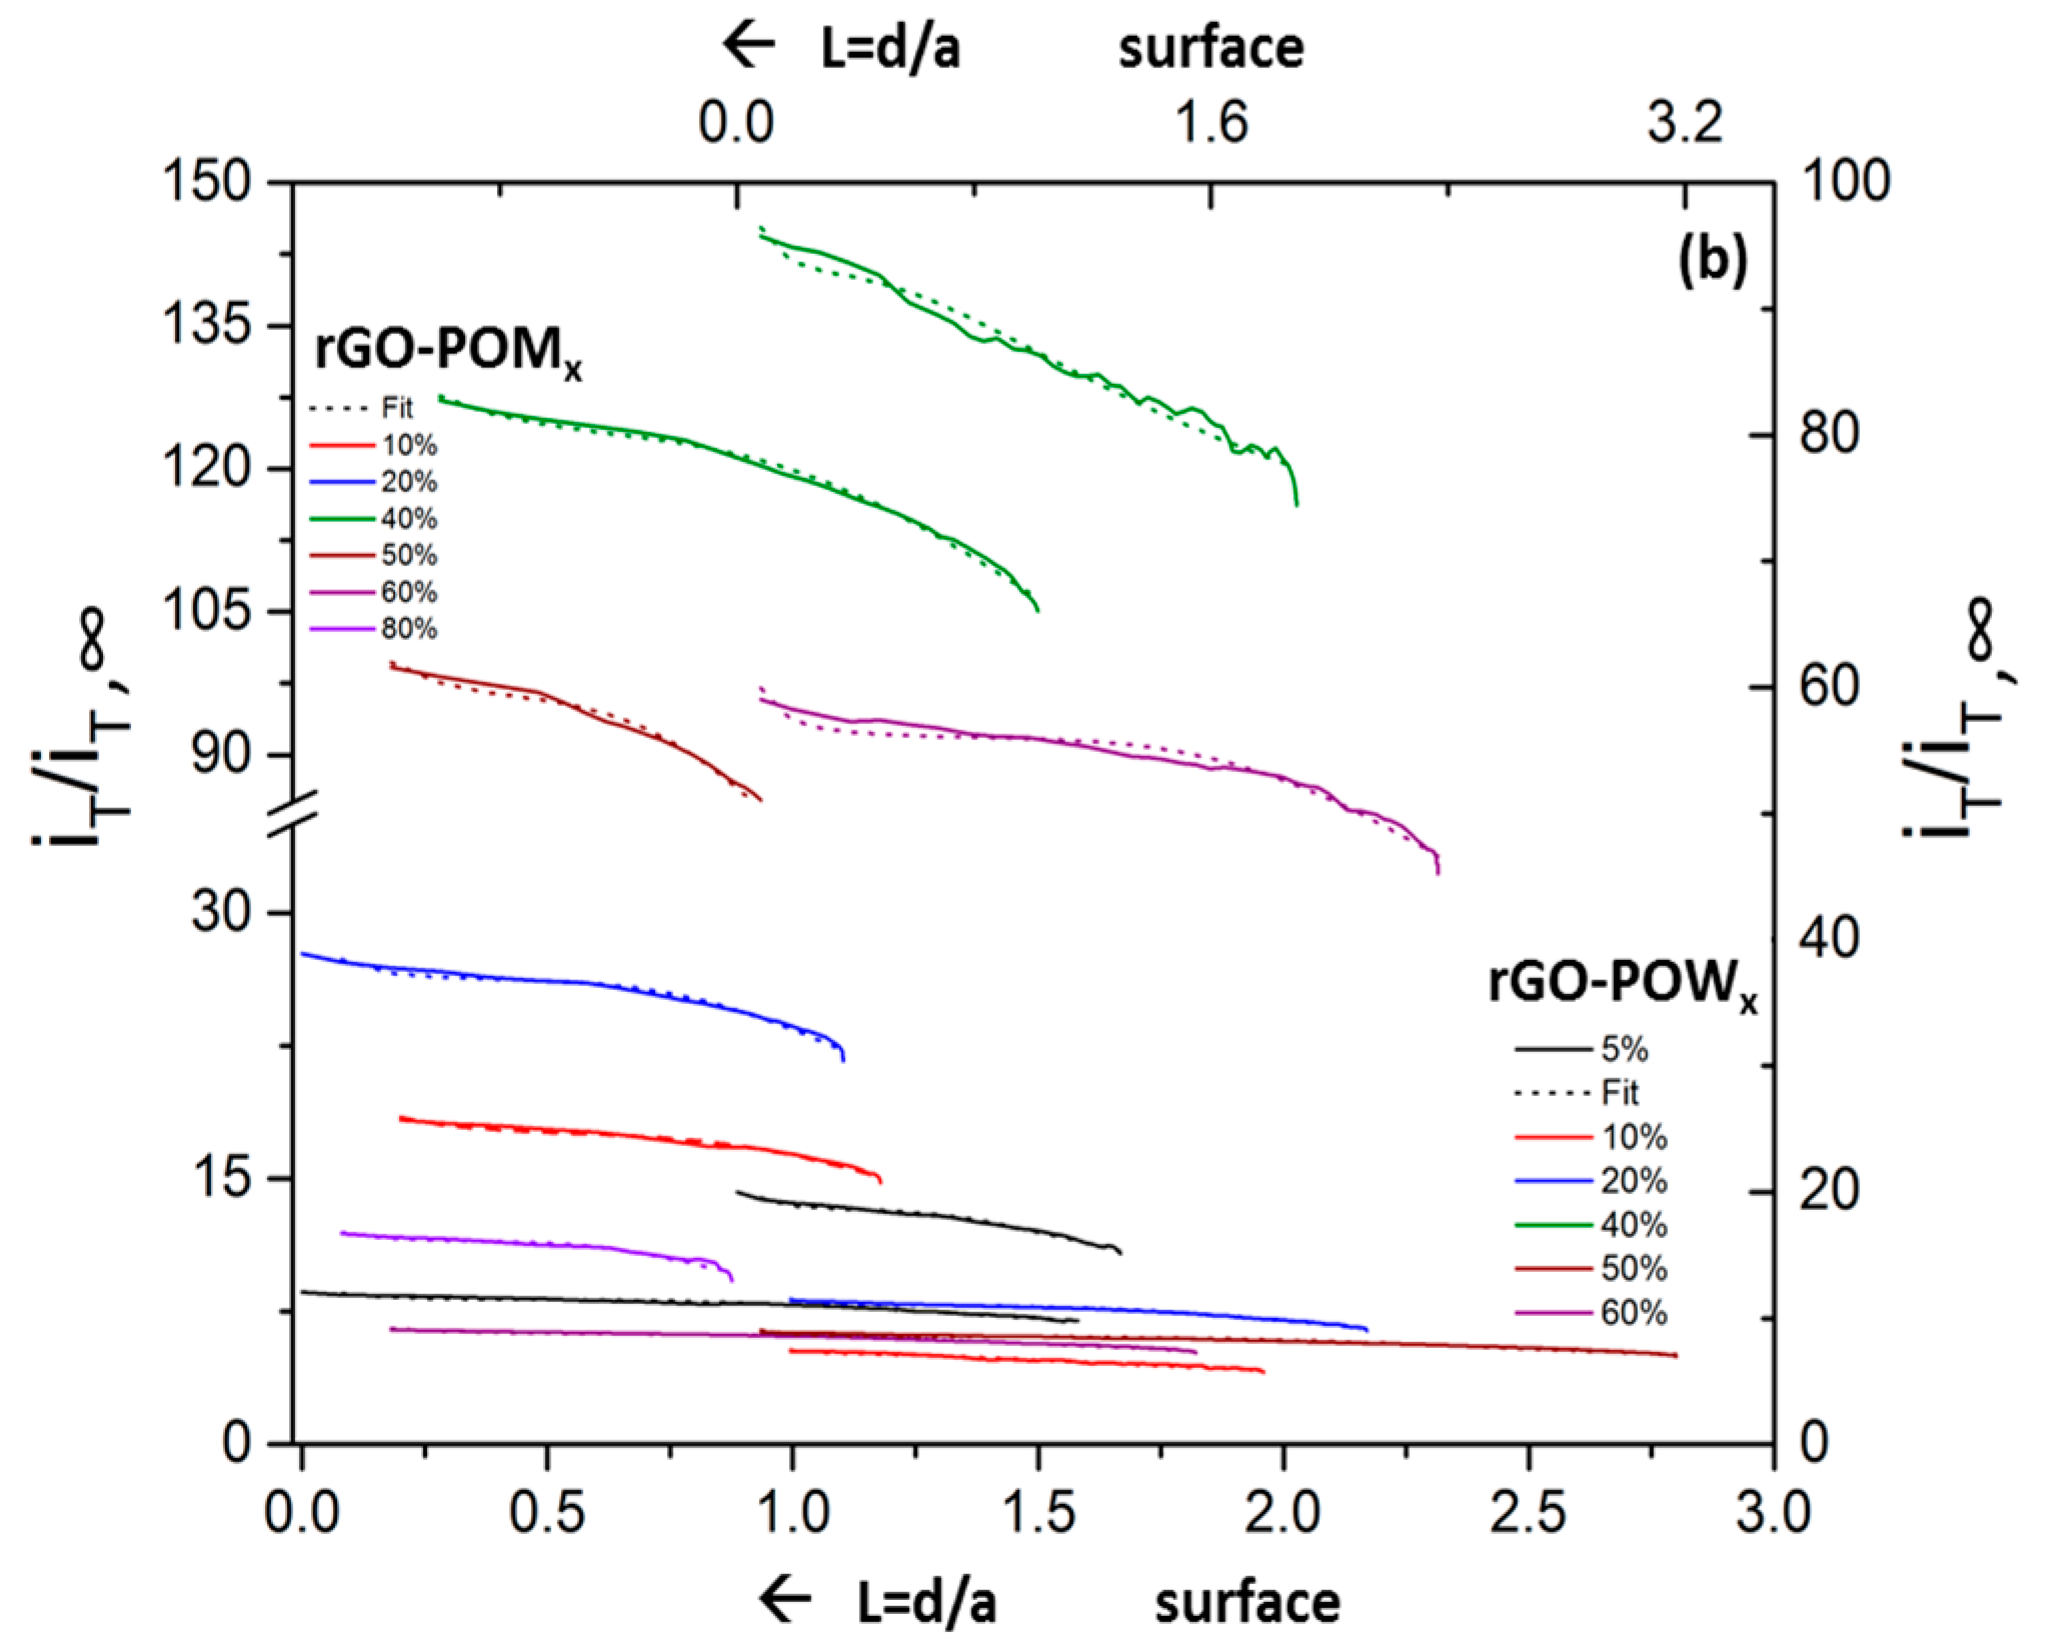
2.4. Scanning Electrochemical Microscopy

When active graphene domains including basal plane and edge sites are combined with other nanomaterials forming hybrids, they are anticipated to show higher diffusion (D) and electron transfer kinetic rate (kET) depending upon the constituents’ interactions at electrode/electrolyte interfaces. Moreover, they not only enhance electroactivity, but also molecularly bridge HPA nanodots and create tailored interfaces, thus facilitating facile electron transport. Therefore, maximizing electroactive sites on graphene-based hybrids is an active area of research, albeit challenging [6]. Thus, it becomes pertinent that we investigate the global complex physicochemical processes by probing electrochemical signatures and electron transport locally using scanning electrochemical microscopy (SECM) and hopefully correlate with microstructure, as opposed to scanning probe microscopy technique [76]. By detecting redox reactions in close proximity to electrode surface, SECM probe approach mode is used to obtain quantitative information of local heterogeneous reaction rates. Figure 5 provides probe approach curves for hydrothermally synthesized hybrids showing normalized tip electrode current ( i T / i T , ) versus normalized distance (L = d/a), where d is substrate (electrode)-tip distance and a is the radius of the tip and corresponding fits. The tip current (iT) reaches plateau behavior with steady-state current following:
i T , = 4 n F C D a
where n is the number of electrons transferred at the electrode tip (O + ne → R), F is Faraday constant, C is concentration of oxidized species and D is the diffusion coefficient limited by hemispherical region [47]. With tip approaching the heterogeneous electrode surface, the reduced species formed at the tip is oxidized at the conductive surface, yielding an increase in the tip current following (iT > iT,∞):
i T c ( L ) = i T i T , = [ k 1 + k 2 L + k 3 × exp ( k 4 L ) ]
that creates a regenerative “positive” feedback loop. The opposite effect is observed when probing insulating region creating a “negative” feedback loop that decreases the tip current (iT < iT,∞):
i T i n s ( L ) = i T i T , = 1 / [ k 1 + k 2 L + k 3 × exp ( k 4 L ) ]
where k1, k2, k3 and k4 are one-electron heterogeneous rate transfer and related higher-order coefficients and they depend on the RG (ratio of insulating sheath radius to a, which is equal to 5) and normalized distance, L = d0dexp/a.
The diffusion (D) of redox species of the hybrids ranged 2 × 10⁻¹⁰–5 × 10⁻⁹ m2·s−1 reaching maximum for rGO–POM40 and rGO–POW20 and then marginally decreases complying with those determined from CV curves. The probe approach curve fits are plotted as dashed curves in Figure 5b and Table S3 enlists the parameter values with accuracy <1%, which is usually smaller than typical experimental uncertainties. They are determined by fitting parameter d0 in L and by taking different RG values for all of the heterogeneous kinetics at the tip and diffusion-controlled mediator regeneration at the samples studied. The hybrids show relatively higher diffusion D and k coefficients determined from both ac EIS and SECM for all of the hybrids plotted in Figure 6. These values are unprecedented for the samples studied and they are much higher peaking for rGO–POM60 and rGO–POW20 hybrids than those of constituents (rGO, POMs or POWs) signifying the importance of integration of graphene and molecular nanoclusters/nanodots. The visualization of electrochemical (re)activity and mapping adsorption sites density is performed in constant height feedback imaging mode taking advantage of amperometric tip current that originates from redox mediator, modulated by variations in the tip-to-sample distance and by the local electrochemical activity of the electrode surfaces. For instance, the tip current variation on insulating (or semiconducting) electroactive surface is reflective of sample topography. On the other hand, variations in the tip current on reasonably flat conductive surfaces are indicative for variations in the local electrochemical (re)activity of the sample. Thus, changes in the electrochemical activity (hence, electron transfer rate) that give rise to changes in the feedback (tip) current are attributed to heterogeneous surfaces.
Figure 7 displays SECM area (250 μm × 250 μm or 400 μm × 400 μm) scans as two-dimension contour “heat maps” and three-dimension current distribution maps using Origin software (ver. 16.0, Origin Lab Corporation, Northampton, MA, USA) for rGO–POMx, x = 5, 10, 50, 80; and rGO–POWx, x = 5, 10, 50, 80 hybrids. The tip was polarized at potential sufficient to cause an electrochemical redox reaction (generator) and the current was recorded (collected) over the polarized electrode surfaces. The occasional higher (peak)/lower (valley) tip current is characteristic of semiconductive/insulating behavior at the POM (or POW)/rGO-solution interfaces. It is apparent from the probe current distribution that the hybrid samples rGO–POM5, rGO–POM10, rGO–POW10 and rGO–POM20 yielded several regions of highly electroactive regions “hot spots” with areal site density that can be determined from full-width at half maximum of peaks ~20–60 μm in both x and y dimensions corroborated with surface morphology (see Figure 7, panels e and j, line profiles deduced using Matlab custom-designed script). Our recent theoretical calculations on electron density of states have reported the occurrence of finite density of states at or near Fermi level attributed to localized re-hybridized pockets at transition metal oxide–graphene and transition metal oxide–graphene oxide interfaces [6,27,29]. Compared to physically adsorbed atoms or molecules, the interfacial bonding and chemically bridged nanodots can be robust and the areal density of these nanoparticles is controlled to create pockets of locally hybridized area, where the bonding is modulated favorably and effective charge transfer contributions arise from transition metal p and d orbitals, which in-turn increase the electron density at Fermi level [6,27,29]. In the energy-intensive storage systems, the electrochemical signatures in accessible orbital states is contained within two measurable series energetic components, an energy loss term related to the charging of appropriately addressable molecular orbitals (resonant or charge transfer resistance) and energy storage or electrochemical capacitance component. These findings reinforce the multiple roles played by orbital engineered extended inorganic connectivity of HPAs chemisorbed on rGO support providing an interconnected topological conductive network, edge plane sites, raised graphene edges (graphene walls) within graphene domains, surface functionalities associated with π bonding and defects sites, all of them serving as anchor sites for POM nanoclusters and POW nanodots.

3. Materials and Methods

3.1. Hydrothermal Synthesis and Electrodes Preparation

Graphene oxide (GO) was prepared by modified Hummer’s method [77] followed by low-temperature thermal reduction in ambient air for 3 h at ~250 °C producing rGO nanosheets [78,79]. Contrary to thermal treatment in vacuum or inert atmosphere, heating under ambient atmosphere triggers concomitant reduction and oxidation reactions. As a result, graphene edge hydroxyl (–OH) and epoxy (C–O–C) groups are progressively eliminated, while newly formed carbonyls (C=O) groups appear due to air oxidation, as revealed using Raman spectroscopy (via monitoring G band position mentioned below and in Supplementary Materials available online). Electrical measurements reveal that despite the presence of oxygen containing groups in the partially restored graphene sp2 bonded carbon (sp2 C) network in rGO, the dc (direct current) conductivity is enhanced. Therefore, this process is scalable and suitable to produce conductive rGO with increased functionalities suitable for electrochemical energy storage and electrocatalytical sensing applications. Polyoxometalates; (H3PMO12O40·xH2O; POM and H3PW12O40·xH2O; POW from Fisher Chemicals, (Fair Lawn, NJ, USA)) were deposited on rGO forming organic–inorganic hybrids using a facile and scalable hydrothermal method (Figure 1A). Briefly, rGO (30 mg) was placed in a vial and methanol (2 mL) was added to produce a paste followed by mixing with aqueous POM dispersions made using 1 mL of DI water (pH < 2). The POM was varied in proportion (5, 10, 20, 40, 50, 60 and 80 wt %) to rGO nanosheets in the form of powder. The mixture was stirred and sonicated for 15 min. to produce homogeneous mixing of POM and rGO nanosheets followed by placing them in hydrothermal autoclave chamber at 60 °C for 24 h in box furnace and cooled to room temperature. If the powder was not dried after being taken out of the furnace, the vial containing the paste was placed on a hot plate at ~90 °C for several hours. This process yielded rGO–POM composite powder. The same process was also used to yield rGO–POW composite powder. The dried samples were finally crushed to a fine powder in an agate mortar. In total, fourteen different powders were prepared. Aqueous solutions of H3PMO12O40·xH2O; POM and H3PW12O40·xH2O; POW with different concentrations were prepared depending on the target HPA loading. The pH varied slightly when the HPA concentration decreased but it always remained below 2, conditions at which H3PMO12O40 is stable. In addition, it is emphasized that methanol was also used to wet the graphene surface and that the stability of HPAs is significantly improved in water–alcohol mixtures [80]. Finally, the pH in aqueous film dropped as water evaporated. Overall, the samples with loadings of x = 5, 10, 20, 40, 50, 60 and 80 wt % are synthesized with rGO designated as rGO–POMx and rGO–POWx (Figure 1A shows the scheme).
To prepare the hybrid electrochemical electrodes, slurry composed of 80% active electrode material, 10% PVDF (polyvinylidene fluoride) as binder and 10% carbon black is prepared by sheared mixing with NMP (N-Methyl-2-pyrrolidone) organic solvent in agate mortar and stirred for 3 h. The nickel foam, stainless steel, and Indium Tin Oxide (ITO) substrates of size 1.5 cm × 5 cm were cleaned subsequently in acetone and methanol and dried with N2 gas. The slurry for each concentration of rGO–POMx and rGO–POWx composite pastes were coated on these substrates using a blade knife and all samples were air dried at room temperature for more than 24 h. Additional samples of 20 and 60 wt % POM and POW dispersions were prepared as control. After the electrodes had dried, they were annealed at 100 °C for 1 h in Ar atmosphere by placing into a quartz tube furnace for better adhesion and linking to substrates. All of the chemicals were purchased from Sigma-Aldrich (St. Louis, MO, USA) and used without further purification. These strategic approaches afford scalable, uniform, optimized loaded graphene nanosheets as advanced high-performance electrochemical electrodes that lead to topologically interconnectedness and three-dimensional framework, ideal for electrochemical energy storage producing electrical energy.

3.2. Sample Characterization

All the samples were characterized in terms of surface morphology, elemental composition, microscopic structure, crystallinity, lattice vibration, electrochemical and scanning electrochemical microscopy properties. Scanning electron microscopy (SEM) images were taken with electron microscope (Model JEOL 6010Plus, Peabody, MA, USA) operating at primary electron acceleration voltage (Vacc) 15 kV at constant current 45 μA in secondary electron imaging (SEI) mode collected with an in-lens SiLi detector equipped with an X-ray ISIS EDS system providing surface morphology. The various complementary analytical techniques used in this work are summarized (Supplemental Materials). Electrochemical tests were carried out using electrochemical bi-potentiostat (Model 920D, CH Instruments Inc., Bee Cave, TX, USA) workstation in terms of cyclic voltammetry (CV), galvanostatic charging–discharging (or chronopotentiometry) and ac electrochemical impedance spectroscopy (EIS). All of the measurements were performed in a custom designed three-electrode electrochemical cell in symmetric configuration where Ag|AgCl electrode and Pt wire of 3 mm diameter were used as the reference (RE) and counter electrode (CE), respectively, and the hybrid samples were used as working electrode (WE). The CV measurements were carried out in 0.4 M sodium sulfate (Na2SO4) base electrolyte with potential ranging −0.2 V to 1.6 V at scan rates 5, 10, 20, 50, 100 and 200 mV/s. It is suggestive that asymmetric or symmetric two-electrode cell configuration mimics the physical configuration, internal voltages and charge transfer that occurs in a packaged supercapacitor and thereby provide indications of electrodes performance, while three-electrode cell is typically used to investigate electrode kinetics. Gravimetric specific capacitance (Cs) was calculated from dividing the capacitive charge (Q) obtained using half the integrated area of the CV curve by active electrode mass (m) and the width of the operating potential window (V) following:
C S = Q m Δ V
Or
1 m v ( V f V i ) V i V f I ( V ) d V
The actual specific capacitance is determined using the simplified expression: Cs (F·g−1) = 2 Ce (F), where mass of the active material is in the lightest electrode, valid for symmetric configuration. Galavanostatic charging–discharging was conducted using cathode and anode current densities of 2.5–10 A·g−1. Five sets of measurements (V–t) profiles were measured on each sample for 0–500 cycles. Using chronopotentiometry, specific capacitance (Cs) values were calculated by charge–discharge current (I), potential change with discharge time (dV/dt) and the mass of the active electrode following:
C s = 2 I d t m Δ V   o r   2 I m ( d V d t )
while discarding the ohmic (IR) drop. From these capacitance values, the energy density (E) and maximum power (Pm) were calculated: E (W·h·kg−1) = 1/4 CeV2 and Pm = V2/4ESR, where ESR is the equivalent series resistance (Rs), determined from impedance spectroscopy. These values refer to a real two-electrode system. The cyclability tests were carried out by running galvanostatic cycles at 5 A·g−1 within voltage range 0–1.2 V for more than 500 cycles. AC Electrochemical impedance spectroscopy (ac EIS) was performed at open circuit voltage +0.3 V with ac signal amplitude Vac = 5 mV in frequency range 0.01 Hz–98 kHz. The capacitance with frequency is obtained by C ( ω )   =   Z ( ω ) / ω | Z ( ω ) | 2 relationship that converts complex impedance Z″ into capacitance (C′).
Scanning electrochemical microscopy (SECM) was performed on all samples in CV, probe approach and imaging modes described in detail elsewhere [9,27]. Briefly, ITO coated working electrodes were placed on a stage and a measuring cell with a Pt wire CE was secured over the electrode to create a seal. The reference electrode (RE) was Ag|AgCl and the electrolyte was 0.4 M sodium sulfate (Na2SO4). The SECM probe is a Pt wire with a diameter of 10 µm encased in a glass sheath that is dipped in the electrolyte. A CV at scan rate 20 mV/s in microelectrode configuration was performed and then 0.5 mL of 10 µM ferrocenemethanol (FcMeOH) was added to the electrolyte as redox agent and the CV test was repeated for all the samples. When used in probe approach mode, a constant potential of 0.5 V and 0.6 V was applied to the probe, −0.4 V was applied to the working electrode, the probe was then withdrawn and the tip ion current (iT) was measured. During imaging mode, +0.6 V potential was applied to the probe (Vt) which measured the tip ion current while rastering laterally to cover 0.062 mm2 (i.e., 250 µm × 250 µm) or 0.16 mm2 (i.e., 400 µm × 400 µm) area.

4. Conclusions

In summary, we reported the development of a series of hydrothermally synthesized and thermally processed high-performance “organic–inorganic” hybrids consisting of pseudocapacitive phosphomoybdate (and phosphotungstic) molecular clusters anchored to or distributed on the supercapacitive rGO nanosheets. The nanosized polynuclear redox-active molecular clusters consisting of transition metals at their highest oxidation states are appropriate to achieve high specific energy capacity due to multi-electron redox reactions. The interaction between complementary functionalized graphene (organic), POM and POW nanodots (inorganic) components facilitate tunable physicochemical properties and tailorable chemically bridged interfaces, thus demonstrate a series of modular and interesting properties. These energy-intensive hybrid materials elucidate extended superior operating voltage yielding enhanced specific energy and power density. The excellent performance of hybrids takes full advantage of: (1) overcoming bottleneck to extend the inorganic (POM or POW) nanoscale dimensionality, while using the organic (rGO) components to provide chemical functionality; (2) synergistic coupled charge storage (i.e., electrochemical double-layer and faradaic) mechanisms; (3) mesoporous and topologically interconnected morphology of rGO nanosheets creating electronic and ionic conducting channels; (4) molecularly bridged and chemically anchored POM and POW nanoclusters create tailored interactions that provide high specific capacitance, interfacial contact area at electrode/electrolyte interfaces and accessibility for ion adsorption and developing new conductive pathways for charge transfer; (5) larger operating voltage 1.5 V, with improved specific energy density and maximal retention, much superior to the stability of the parent supercapacitor based on only graphene under the same experimental conditions; (6) redox-active electrolyte that can provide extra protons and improved ionic conductivity and additional faradaic active sites for storage capacity; and (7) SECM measurements provided quantitative information of electrochemical “redox” activity and mapping electroactive sites distribution at electrode/electrolyte interfaces, corroborating favorable modulation of band structure and charge density.

Supplementary Materials

The following are available online at https://www.mdpi.com/2311-5629/3/3/24/s1.

Acknowledgments

The author (Sanju Gupta) gratefully acknowledges financial supports in parts from NSF-MRI (Grant #1429563), NSF EPSCoR RSP Grant (subaward # 3200000271-17-212), NASA KY EPSCoR Grant (NASA RID-3-NNX15AK28A, subaward # 3200000029-17-229), KSEF-RDE (Grant #148-502-17-397) and internal WKU Research Foundation RCAP-I Award. The acknowledgement is also due to Dr. John Andersland (Biology) for SEM and TEM training to student co-authors.

Author Contributions

Bryce Aberg and Sanju Gupta conceived, designed and performed the experiments; Bryce Aberg, Sanju Gupta, and Sara B. Carrizosa analyzed the data; and Sanju Gupta wrote the paper.

Conflicts of Interest

The authors declare no conflict of interest.

References

  1. Conway, B.E.; Bliss, V.; Wojtowicz, J. The role and utilization of pseudocapacitance for energy storage by supercapacitors. J. Power Sources 1997, 66, 1–14. [Google Scholar] [CrossRef]
  2. Crabtree, G.; Lewis, N. Renewable energy: Progress and prospects. Phys. Today 2007, 60, 37–42. [Google Scholar] [CrossRef]
  3. Romero, P.G.; Ayyad, O.; Guevara, J.S.; Rojas, D.M. Hybrid organic-inorganic materials: From Child’s play to energy applications. J. Sol. Stat. Electrochem. 2010, 14, 1939–1945. [Google Scholar] [CrossRef]
  4. Simon, P.; Gogotsi, Y.; Dunn, B. Where do batteries end and supercapacitors begin? Science 2014, 343, 1210–1211. [Google Scholar] [CrossRef] [PubMed] [Green Version]
  5. Bruce, P.G.; Scrosat, B.; Raeascon, J.-M. Nanomaterials for rechargeable lithium batteries. Angew. Chem. Int. Ed. 2008, 47, 2930–2946. [Google Scholar] [CrossRef] [PubMed]
  6. Gupta, S.; Carrizosa, S.B.; McDonald, B.; Jasinski, J.; Dimakis, N. Graphene-family nanomaterials assembled with cobalt oxides and cobalt nanoparticles as hybrid supercapacitive electrodes and enzymeless glucose detection platforms. J. Mater. Res. 2017, 32, 301–322. [Google Scholar] [CrossRef]
  7. Laforgue, A.; Simon, P.; Fauvarque, J.F.; Conte, M.; Sarrau, J.F.; Lailler, P. Hybrid supercapacitors—From laboratory to industrial development. Work 2002, 6, 8. [Google Scholar]
  8. Gupta, S.; McDonald, B.; Carrizosa, S.B.; Price, C. Microstructure, residual stress, and intermolecular force distribution maps of graphene/polymer hybrid composites: Nanoscale morphology-promoted synergistic effects. Compos. Part B Eng. 2016, 92, 175–192. [Google Scholar] [CrossRef]
  9. Gupta, S.; Price, C. Investigating graphene/conducting polymer hybrid layered composites as pseudocapacitors: Interplay of heterogeneous electron transfer, electric double layers and mechanical stability. Compos. Part B Eng. 2016, 105, 46–59. [Google Scholar] [CrossRef]
  10. Geim, A.; Novoselov, K.S. The rise of graphene. Nat. Mater. 2007, 6, 183–191. [Google Scholar] [CrossRef] [PubMed]
  11. Raccichini, R.; Varzi, A.; Passerini, S.; Scrosati, B. The role of graphene for electrochemical energy storage. Nat. Mater. 2015, 14, 271–279. [Google Scholar] [CrossRef] [PubMed]
  12. Novoselov, K.S.; Geim, A.K.; Morozov, S.V.; Jiang, D.; Zhang, Y.; Dubonos, S.V.; Grigorieva, I.V.; Firsov, A.A. Electric field effect in atomically thin carbon films. Science 2004, 306, 666–669. [Google Scholar] [CrossRef] [PubMed]
  13. Bagri, A.; Mattevi, C.; Acik, M.; Chabal, Y.J.; Chowalla, M.; Shenoy, V.B. Structural evolution during the reduction of chemically derived graphene oxide. Nat. Chem. 2010, 2, 581. [Google Scholar] [CrossRef] [PubMed]
  14. Loh, K.P.; Bao, Q.; Eda, G.; Chowalla, M. Graphene oxide as a chemically tunable platform for optical applications. Nat. Chem. 2010, 2, 1015. [Google Scholar] [CrossRef] [PubMed]
  15. Eda, G.; Chowalla, M. Chemically derived graphene oxide: Towards large-area thin-film electronics and optoelectronics. Adv. Mater. 2010, 22, 2392. [Google Scholar] [CrossRef] [PubMed]
  16. Loh, K.P.; Bao, Q.L.; Ang, P.K.; Yang, J.X. The chemistry of grapheme. J. Mater. Chem. 2010, 20, 2277. [Google Scholar] [CrossRef]
  17. Schwierz, F. Graphene transistors. Nat. Nanotechnol. 2010, 5, 487. [Google Scholar] [CrossRef] [PubMed]
  18. Blake, P.; Brimicombe, P.D.; Nair, R.R.; Booth, T.J.; Jiang, D.; Schedin, F.; Ponomarenko, L.A.; Morozov, S.V.; Gleeson, H.F.; Hill, E.W.; et al. Graphene-based liquid crystal device. Nano Lett. 2008, 8, 1704. [Google Scholar] [CrossRef] [PubMed]
  19. Ohno, Y.; Maehashi, K.; Yamashiro, Y.; Matsumoto, K. Electrolyte-gated graphene field-effect transistors for detecting pH and protein adsorption. Nano Lett. 2009, 9, 3318. [Google Scholar] [CrossRef] [PubMed]
  20. Pavlidis, I.V.; Patila, M.; Bornscheuer, U.T.; Gournis, D.; Stamatis, H. Graphene-based nanobiocatalytic systems: Recent advances and future prospects. Trends Biotechnol. 2014, 32, 312. [Google Scholar] [CrossRef] [PubMed]
  21. Zhang, L.; Xia, J.; Zhao, Q.; Liu, L.; Zhang, Z. Functional graphene oxide as a nanocarrier for controlled loading and targeted delivery of mixed anticancer drugs. Small 2010, 6, 537. [Google Scholar] [CrossRef] [PubMed]
  22. Cho, J.-H.; Picraux, T. Enhanced lithium ion battery cycling of silicon nanowire anodes by template growth to eliminate silicon underlayer islands. Nano Lett. 2013, 13, 5740–5747. [Google Scholar] [CrossRef] [PubMed]
  23. Vaillant, J.; Cantu, M.L.; Gallegos, K.C.; Pastor, N.C.; Romero, P.G. Chemical synthesis of hybrid materials based on PAni and PEDOT with polyoxometalates for electrochemical superapacitors. Prog. Sol. Stat. Chem. 2006, 34, 147–159. [Google Scholar] [CrossRef]
  24. Cericola, D.; Kötz, R. Hybridization of electrochemical capacitors and rechargeable batteries: Principles and limits. Electroch. Acta 2012, 72, 1–17. [Google Scholar] [CrossRef]
  25. Brousse, T.; Maarchand, R.; Taberna, P.-L.; Simon, P. TiO2-activated carbon non-aqueous hybrid system for energy storage. J. Power Sources 2006, 158, 571–577. [Google Scholar] [CrossRef]
  26. Naoi, K.; Ishimoto, S.; Miyamoto, J.-I.; Naoi, W. Second generation “nanohybrid supercapacitor”: Evolution of capacitive energy storage devices. Energy Environ. Sci. 2012, 5, 9363–9373. [Google Scholar] [CrossRef]
  27. Gupta, S.; Carrizosa, S.B. Graphene–inorganic hybrids with cobalt oxide polymorphs for electrochemical energy systems and electrocatalysis: Synthesis, processing and properties. J. Electron. Mater. 2015, 44, 4492–4509. [Google Scholar] [CrossRef]
  28. Gupta, S.; van Meveren, M.; Jasinski, J. Investigating electrochemical properties and interfacial processes of manganese oxides/graphene hybrids as high-performance supercapacitor electrodes. Int. J. Electrochem. Sci. 2015, 10, 10272–10291. [Google Scholar]
  29. Gupta, S.; Aberg, B.; Carrizosa, S.B.; Dimakis, N. Vanadium pentoxide nanobelt-reduced graphene oxide nanosheet composites as high-performance pseudocapacitive electrodes: AC impedance spectroscopy data modeling and theoretical calculations. Materials 2016, 9, 615. [Google Scholar] [CrossRef]
  30. Wang, H.; Dai, H. Strongly coupled inorganic–nano-carbon hybrid materials for energy storage. Chem. Soc. Rev. 2013, 42, 3088–3113. [Google Scholar] [CrossRef] [PubMed]
  31. Liang, Y.; Li, Y.; Wang, H.; Dai, H. Strongly coupled inorganic/nanocarbon hybrid materials for advanced electrocatalysis. J. Am. Chem. Soc. 2013, 135, 2013–2036. [Google Scholar] [CrossRef] [PubMed]
  32. Avansi, W., Jr.; Ribeiro, C.; Leite, E.R.; Mastelaro, V.R. Vanadium pentoxide nanostructures: An effective control of morphology and crystal structure in hydrothermal conditions. Cryst. Growth Des. 2009, 9, 3626–3631. [Google Scholar] [CrossRef]
  33. Zhang, Y.-Z.; Cheng, T.; Wang, Y.; Lai, W.-Y.; Pang, H.; Huang, W. A Simple approach to boost capacitance: Flexible supercapacitors based on manganese Oxides@MOFs via chemically induced in situ self-transformation. Adv. Mater. 2016, 28, 5242–5249. [Google Scholar] [CrossRef] [PubMed]
  34. Zhang, Y.-Z.; Wang, Y.; Cheng, T.; Lai, W.-Y.; Pang, H.; Huang, W. Flexible supercapacitors based on paper substrates: A new paradigm for low-cost energy storage. Chem. Soc. Rev. 2015, 44, 5181. [Google Scholar] [CrossRef] [PubMed]
  35. Cheng, T.; Zhang, Y.-Z.; Zhang, J.-D.; Lai, W.-Y.; Huang, W. High-performance free-standing PEDOT:PSS electrodes for flexible and transparent all-solid-state supercapacitors. J. Mater. Chem. A 2016, 4, 10493–10499. [Google Scholar] [CrossRef]
  36. Romero, P.G. Polyoxometalates as photoelectrochemical models for quantum-sized semiconducting oxides. Solid State Ionics 1997, 101, 243–248. [Google Scholar] [CrossRef]
  37. Symes, M.D.; Cronin, L. Decoupling hydrogen and oxygen evolution during electrolytic water splitting using an electron-coupled-proton buffer. Nat. Chem. 2013, 5, 403–409. [Google Scholar] [CrossRef] [PubMed]
  38. Müller, A.; Krickemeyer, E.; Meyer, J.; Bogge, H.; Peters, F.; Plass, W.; Diemann, E.; Dillinger, S.; Nonnenbrunch, F.; Randernath, M.; et al. [Mo154(NO)14O420(OH)28(H2O)70](25 ± 5)−: A water-soluble big wheel with more than 700 atoms and a relative molecular mass of about 24000. Angew. Chem. Int. Ed. 1995, 34, 2122–2124. [Google Scholar] [CrossRef]
  39. Muller, A.; Beckemann, E.; Bogge, H.; Schmidtmann, M.; Dress, A. Inorganic chemistry goes protein size: A Mo368 nano-hedgehog initiating nanochemistry by symmetry breaking. Angew. Chem. Int. Ed. 2002, 41, 1163–1167. [Google Scholar] [CrossRef]
  40. Long, D.-L.; Tsunashima, R.; Cronin, L. Polyoxometalates: Building blocks for functional nanoscale systems. Angew. Chem. Int. Ed. 2010, 49, 1736–1758. [Google Scholar] [CrossRef] [PubMed]
  41. Suarez-Guevara, J.; Ruiz, V.; Romero, P.G. Hybrid energy storage: High voltage aqueous supercapacitors based on activated carbon–phosphotungstate hybrid materials. J. Mater. Chem. A 2014, 2, 1014–1021. [Google Scholar] [CrossRef]
  42. Dubal, D.P.; Guervara, J.S.; Tonti, D.; Encisco, E.; Romero, P.G. A high voltage solid state symmetric supercapacitor based on graphene–polyoxometalate hybrid electrodes with hydroquinone doped hybrid gel-electrolyte. J. Mater. Chem. A 2015, 3, 23483–23492. [Google Scholar] [CrossRef]
  43. Kim, Y.; Shanmugam, S. Polyoxometalate-reduced graphene oxide hybrid catalyst: Synthesis, structure, and electrochemical properties. ACS Appl. Mater. Interfaces 2013, 5, 12197–12204. [Google Scholar] [CrossRef] [PubMed]
  44. Tessonnier, J.-P.; Renaudin, S.G.; Alia, S.; Yan, Y.; Barteau, M.A. Structure, stability and electronic interactions of polyoxometalates on functionalized graphene sheets. Lnagmuir 2013, 29, 393–402. [Google Scholar] [CrossRef] [PubMed]
  45. Byrappa, K.; Yoshimura, M. Handbook of Hydrothermal Technology; Noyes Publications: Park Ridge, NJ, USA, 2001. [Google Scholar]
  46. Gupta, S.; Price, C. Scanning electrochemical microscopy of graphene/polymer hybrid thin films as supercapacitors: Physical–chemical interfacial processes. AIP Adv. 2015, 5, 107113-1–107113-8. [Google Scholar] [CrossRef]
  47. Gupta, S.; Carrizosa, S.B. Insights into electrode/electrolyte interfacial processes and the effect of nanostructured cobalt oxides loading on graphene-based hybrids by scanning electrochemical microscopy. Appl. Phys. Lett. 2016, 109, 243903–243907. [Google Scholar] [CrossRef]
  48. Bard, A.J.; Mirkin, M.V. (Eds.) Scanning Electrochemical Microscopy; Marcel Dekker: New York, NY, USA, 2001. [Google Scholar]
  49. Song, I.K.; Kaba, M.S.; Barteau, M.A.; Lee, W.Y. Investigation of redox potential and negative differential resistance behavior of heteropolyacids by scanning tunneling microscopy. Catal. Today 1998, 44, 285–291. [Google Scholar] [CrossRef]
  50. Wen, S.; Guan, W.; Wang, J.; Lang, Z.; Yan, L.; Su, Z. Theoretical investigation of structural and electronic properties of [PW12O40]3− on graphene layer. Dalton Trans. 2012, 41, 4602–4607. [Google Scholar] [CrossRef] [PubMed]
  51. Schwegler, M.A.; Vinke, P.; van der Eijk, M.; van Bekkum, H. Activated carbon as a support for heteropolyanion catalysts. Appl. Catal. A 2012, 80, 41–57. [Google Scholar] [CrossRef]
  52. Jorio, A.; Dresselhaus, M.S.; Saito, R.; Dresselhaus, G. Raman Spectroscopy in Graphene Related Systems; Wiley-VCH Verlag: New York, NY, USA, 2011. [Google Scholar]
  53. Ratajczak, H.; Barnes, A.J.; Bielanski, A.; Lutz, H.D.; Müller, A. Polyoxometalate Chemistry from Topology via Self-Assembly to Applications; Muller, A., Pope, M.T., Eds.; Springer: Amesterdam, The Netherlands, 2011; p. 101. [Google Scholar]
  54. Lee, C.-Y.; Bond, A.M. Evaluation of levels of defect sites present in highly ordered pyrolytic graphite electrodes using capacitive and faradaic current components derived simultaneously from large-amplitude fourier transformed ac voltammetric experiments. Anal. Chem. 2009, 81, 584–592. [Google Scholar] [CrossRef] [PubMed]
  55. Weber, R.S. Effect of local structure on the UV-visible absorption edges of molybdenum oxide clusters and supported molybdenum oxides. J. Catal. 1995, 151, 470–474. [Google Scholar] [CrossRef]
  56. Cox, P.A. Transition Metal Oxides: An Introduction to Their Electronic Structure and Properties; Clarendon Press: Oxford, UK, 1992. [Google Scholar]
  57. Gupta, S.; Saxena, A. Nanocarbon materials: Probing the curvature and topology effects using phonon spectra. J. Raman Spectrosc. 2009, 40, 1127–1137. [Google Scholar] [CrossRef]
  58. Vidoeski, B.A.; Jovanic, S.P.; Antunovic, I.D.H.; Bogdanovic, D.V.B.; Budimir, M.D.; Markovic, Z.M.; Markovic, B.M.T. Raman study of the interactions between highly ordered pyrolytic graphite (HOPG) and polyopxometalates: The effects of acid concentration. J. Serb. Chem. Soc. 2016, 81, 777–787. [Google Scholar] [CrossRef]
  59. Nomiya, K.; Sugie, Y.; Amimoto, K.; Miwa, M. Charge-transfer absorption spectra of some tungsten(VI) and molybdenum(VI) polyoxoanions. Polyhedron 1987, 6, 519–524. [Google Scholar] [CrossRef]
  60. Sasca, V.; Popa, A. Band-gap energy of heteropoly compounds containing Keggin polyanion-[PVxMo12−xO40]−(3+x) relates to counter-cations and temperature studied by UV-VIS diffuse reflectance spectroscopy. J. Appl. Phys. 2013, 114, 133503. [Google Scholar] [CrossRef]
  61. Gupta, S.; Heintzman, E.; Jasinski, J. Multiphonon Raman spectroscopy properties and Raman mapping of 2D van der Waals solids: Graphene and beyond. J. Raman Spectrosc. 2015, 45, 217–230. [Google Scholar] [CrossRef]
  62. Deltcheff, C.R.; Fournier, M.; Franck, R.; Thouvenot, R. Vibrational investigations of polyoxometalates. 2. Evidence for anion-anion interactions in molybdenum (VI) and tungsten (VI) compounds related to the Keggin structure. Inorg. Chem. 1983, 22, 207. [Google Scholar] [CrossRef]
  63. Grinenval, E.; Rozanska, X.; Baudouin, A.; Berrier, E.; Delbecq, F.; Sautet, P.; Basset, J.-M.; Lefebvre, F. Controlled interactions between anhydrous Keggin-type heteropolyacids and silica support: Preparation and characterization of well-defined silica-supported polyoxometalates species. J. Phys. Chem. C 2010, 114, 19024–19034. [Google Scholar] [CrossRef]
  64. Aparicio-Angles, X.; Closet, A.; Bo, C.; Poblet, J.M. Towards the computational modeling of polyoxoanions on metal surfaces: IR spectrum characterization of [SiW12O40]4− on Ag (111). Phys. Chem. Chem. Phys. 2011, 13, 15143–15147. [Google Scholar] [CrossRef] [PubMed]
  65. Sadakane, M.; Steckhan, E. Electrochemical properties of polyoxometalates as electrocatalysts. Chem. Rev. 1998, 98, 219–237. [Google Scholar] [CrossRef] [PubMed]
  66. Kötz, R.; Carlen, M. Principles and applications of electrochemical capacitors. Electrochim. Acta 2000, 45, 2483. [Google Scholar] [CrossRef]
  67. Celzard, A.; Collas, F.; Marêché, J.F.; Furdin, G.; Rey, I. Porous electrodes-based double-layer supercapacitors: Pore structure versus series resistance. J. Power Sources 2002, 108, 153. [Google Scholar] [CrossRef]
  68. Hirschorn, B.; Orazem, M.E.; Tribollet, B.; Vivier, V.; Frateur, I.; Musiani, M. Constant-phase-element behavior caused by resistivity distributions in films I. Theory. J. Electrochim. Soc. 2010, 157, C452. [Google Scholar] [CrossRef]
  69. Orazem, M.E.; Tribollet, B. Electrochemical Impedance Spectroscopy; John Wiley & Sons: Hoboken, NJ, USA, 2008. [Google Scholar]
  70. Jorcin, J.-B.; Orazem, M.E.; Pébère, N.; Tribollet, B. CPE analysis by local electrochemical impedance spectroscopy. Electrochim. Acta 2006, 51, 1473. [Google Scholar] [CrossRef] [Green Version]
  71. Grover, F.W. Inductance Calculations; Dover Publications: Schenectady, NY, USA, 2009. [Google Scholar]
  72. Tüken, T.; Yazici, B.; Erbil, M. A new multilayer coating for mild steel protection. Progr. Org. Coat. 2004, 50, 115. [Google Scholar] [CrossRef]
  73. Taberna, P.L.; Simon, P.; Fauvarque, J.F. Electrochemical characteristics and impedance spectroscopy studies of carbon–carbon supercapacitors. J. Electrochem. Soc. 2003, 150, A292. [Google Scholar] [CrossRef]
  74. Gogotsi, Y.; Simon, P. True performance metrics in electrochemical energy storage. Sci. Mag. 2011, 334, 917–918. [Google Scholar] [CrossRef] [PubMed] [Green Version]
  75. Najafabadi, A.I.; Yasud, S.; Kobashi, K.; Yamada, T.; Futaba, D.N.; Hatori, H.; Yumura, M.; Iijima, S.; Hata, K. Extracting the full potential of single-walled carbon nanotubes as durable supercapacitor electrodes operable at 4 V with high power and energy density. Adv. Energy Mater. 2010, 22, E235–E241. [Google Scholar] [CrossRef] [PubMed]
  76. Tan, C.; López, J.R.; Parks, J.J.; Ritzert, N.L.; Ralph, D.C.; Abruňa, H.D. Reactivity of monolayer chemical vapor deposited graphene imperfections studied using scanning electrochemical microscopy. ACS Nano 2012, 6, 3070. [Google Scholar] [CrossRef] [PubMed]
  77. Hummers, W.S.; Offman, R.E. Preparation of graphitic oxide. J. Am. Chem. Soc. 1958, 80, 1339. [Google Scholar] [CrossRef]
  78. Tegou, E.; Pseiropoulos, G.; Filippidou, M.K.; Chatzandroulis, S. Low-temperature thermal reduction of graphene oxide films in ambient atmosphere: Infra-red spectroscopic studies and gas sensing applications, Hydrazine-reduction of graphite- and graphene oxide. Microelectron. Eng. 2016, 159, 146–150. [Google Scholar] [CrossRef]
  79. Dreyer, D.R.; Park, S.; Bielawski, C.W.; Ruoff, R.S. The chemistry of graphene oxide. Chem. Soc. Rev. 2010, 39, 228–240. [Google Scholar] [CrossRef] [PubMed]
  80. Damyanova, S.; Gomez, L.M.; Bañares, M.A.; Fierro, J.L.G. Thermal behavior of 12-molybdophosphoric acid supported on zirconium-loaded silica. Chem. Mater. 2000, 12, 501. [Google Scholar] [CrossRef]
Figure 1. (A) Schematic illustration of hydrothermal synthesis for graphene-based “hybrids” with POM clusters and POW nanodots. SEM images of: (B) rGO-POMx (ad*); and (C) rGO-POWx (a,bd*) hybrid series (x = 5, 10, 20, 40, 50, 60 and 80 wt %) revealing surface morphology and microstructure. (Scale bars are shown at the bottom of images).
Carbon 03 00024 g001
Figure 2. (ad) Cyclic voltammery (CV) curves measured in 0.4 M Na2SO4 showing pseudocapacitive behavior with x (10, 40 and 80 wt %) and scan rate (v = 5, 10, 20, 50, 100 and 200 mV/s); (e) current versus square root scan rate showing quasi-linear behavior; and (f) gravimetric specific capacitance (Csp; F·g−1) with scan rate for rGO–POMx-based hybrid series (x = 5, 10, 20, 40, 50, 60 and 80 wt %).
Carbon 03 00024 g002
Figure 3. (ad) Galvanostatic charge–discharge (V–t) profiles for rGO–POMx series at 2.5, 5, 7.5 and 10 A·g−1 current densities; (e) plots of cycle life tests; and (f) an LED indicator powered by representative electrode (rGO–POM40) as symmetric coin cell with 1 M Na2SO4 electrolyte.
Carbon 03 00024 g003
Figure 4. (a,b) Nyquist plots revealing capacitive behavior for grapheme-based hybrids at V = +0.3 V; (c) low frequency capacitance (Clf; F); (d) representative Nyquist plots modeling for rGO–POM40 (and rGO-POW40); (e) C′ (ω) versus log of frequency behavior; and (f) the electrode performance i.e., Ragone plot for AC, CNT/graphene, commercial supercapacitors and batteries, graphene–polymer hybrids and graphene–polyoxometalates electrodes (this work). The inset (panel c) shows equivalent circuit used to fit the impedance data.
Carbon 03 00024 g004
Figure 5. (Color online). Probe approach curves for rGO–POMx and rGO–POWx series indicative of semiconducting (or insulating) behavior at solid/liquid interface with redox mediator 10 μM FcMeOH (ferrocene methanol) in base electrolyte 0.4 M Na2SO4 with tip Vt = +0.5 V and substrate voltage Vs = −0.4 V. The corresponding theoretical fitting is plotted as dash curves.
Carbon 03 00024 g005
Figure 6. Variation of diffusion coefficient (D) and heterogeneous electron transfer rate constant (kET) derived from EIS data modeling and SECM for: (a) rGO–POMx; and (b) rGO–POWx graphene-based hybrid series.
Carbon 03 00024 g006
Figure 7. (Color online). Representative scanning electrochemical microscopy images in 400 μm × 400 μm area for: (ad) rGO–POMx, x = 5, 10, 50 and 60 wt %; and (fi) rGO–POWx, x = 5, 10, 20 and 50 wt % samples, displaying tip current distribution in two- and three-dimensional contour heat maps with occasional higher (peak)/lower (valley or almost flat) current behavior. Line profiles for: (e) rGO–POM10; and (j) rGO–POW5 samples displaying tip current distribution. A color bar is shown for quantitative values of the tip current.
Carbon 03 00024 g007

