Electrostatic Adsorption of Platinum onto Carbon Nanotubes and Nanofibers for Nanoparticle Synthesis


Abstract
:
1. Introduction
2. Results and Discussion
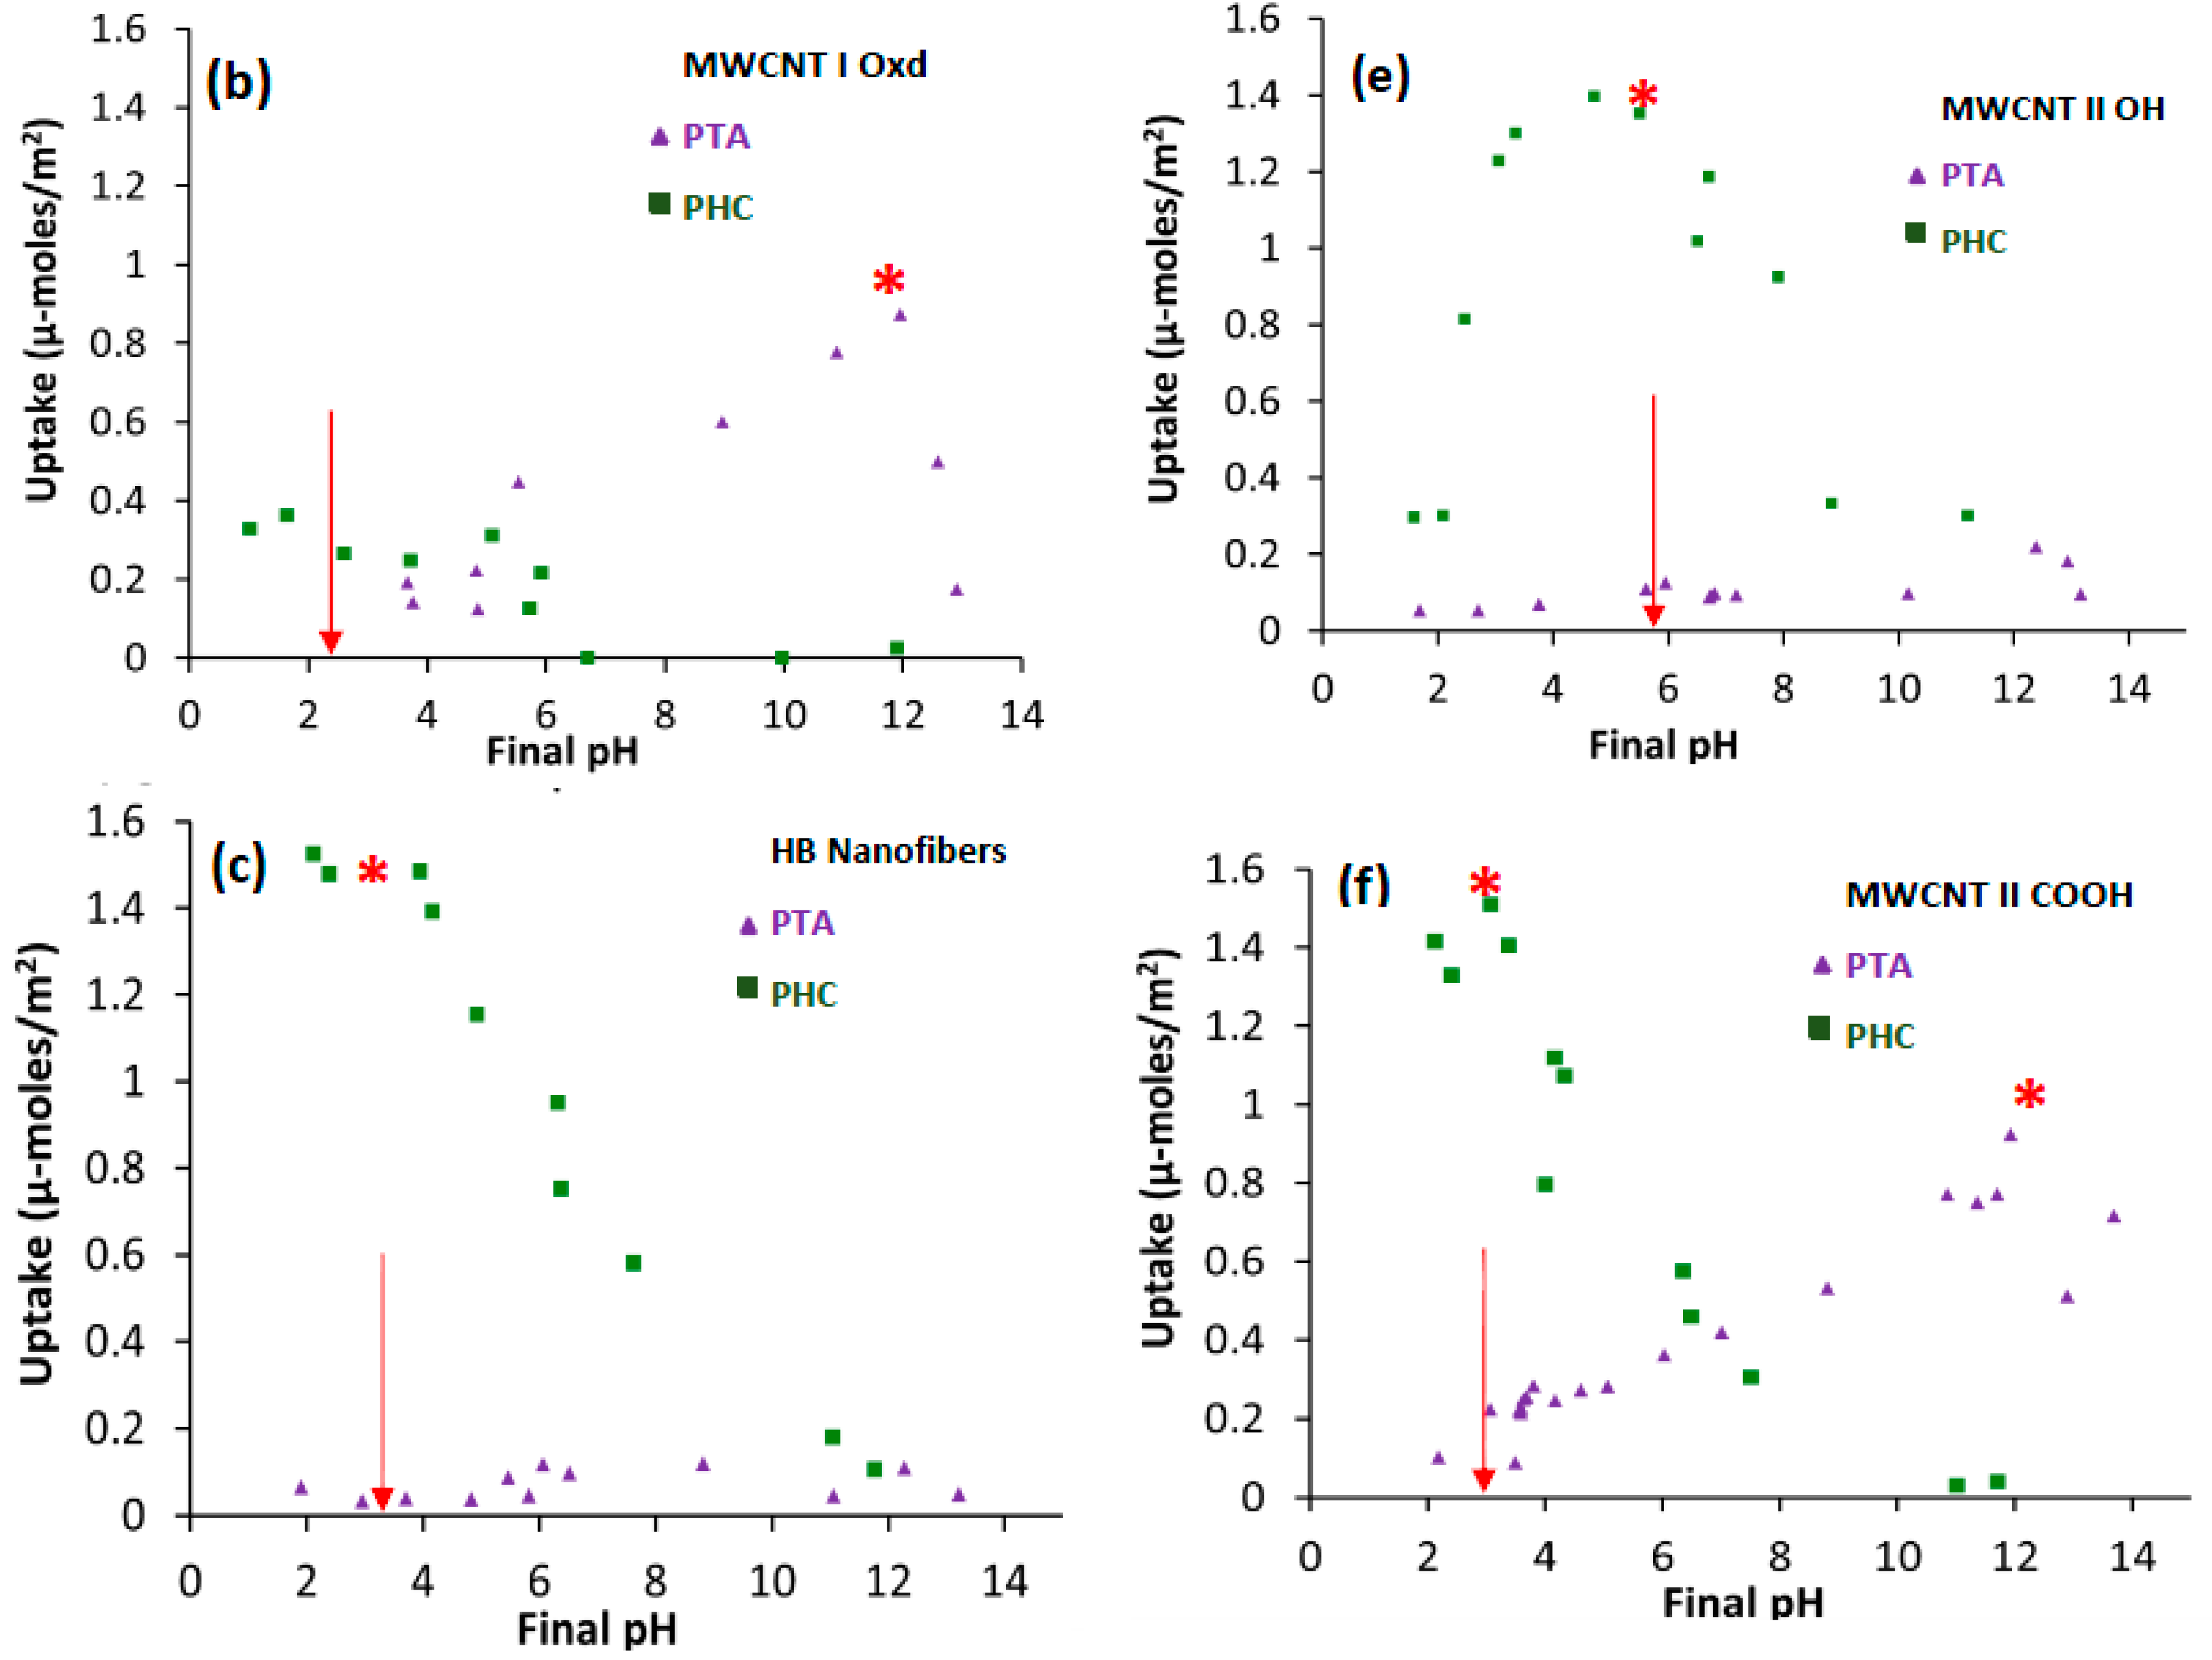
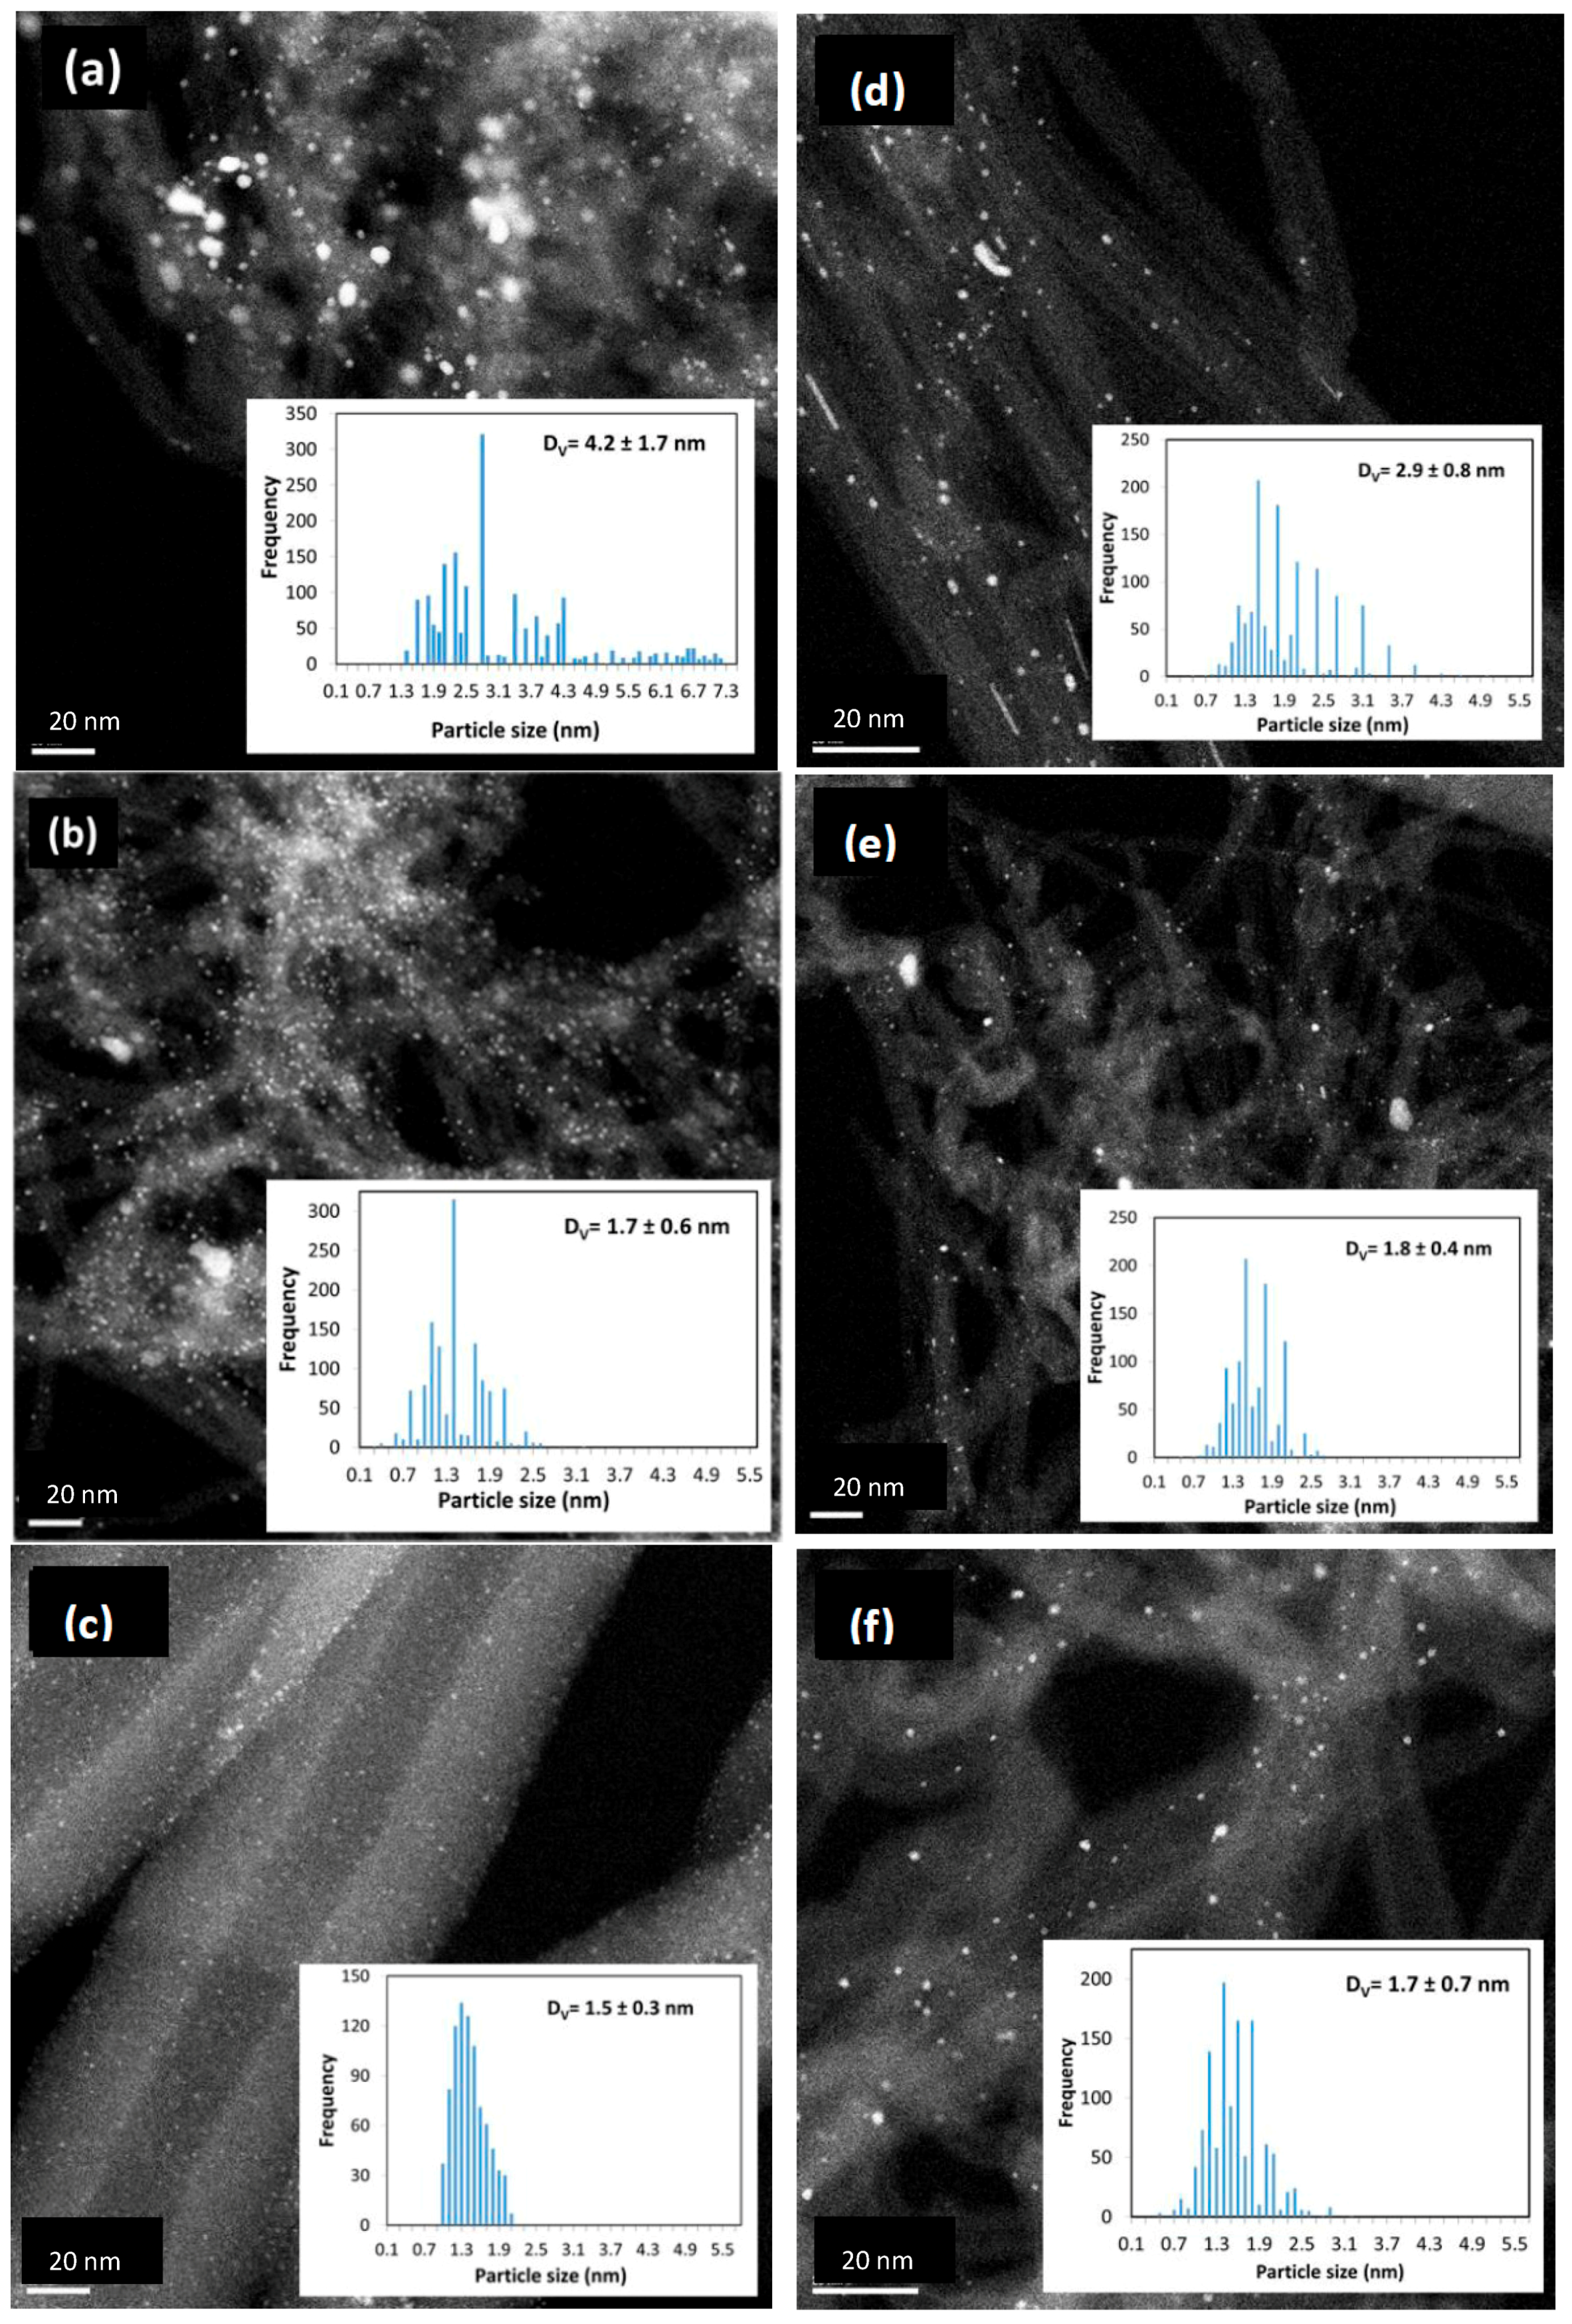
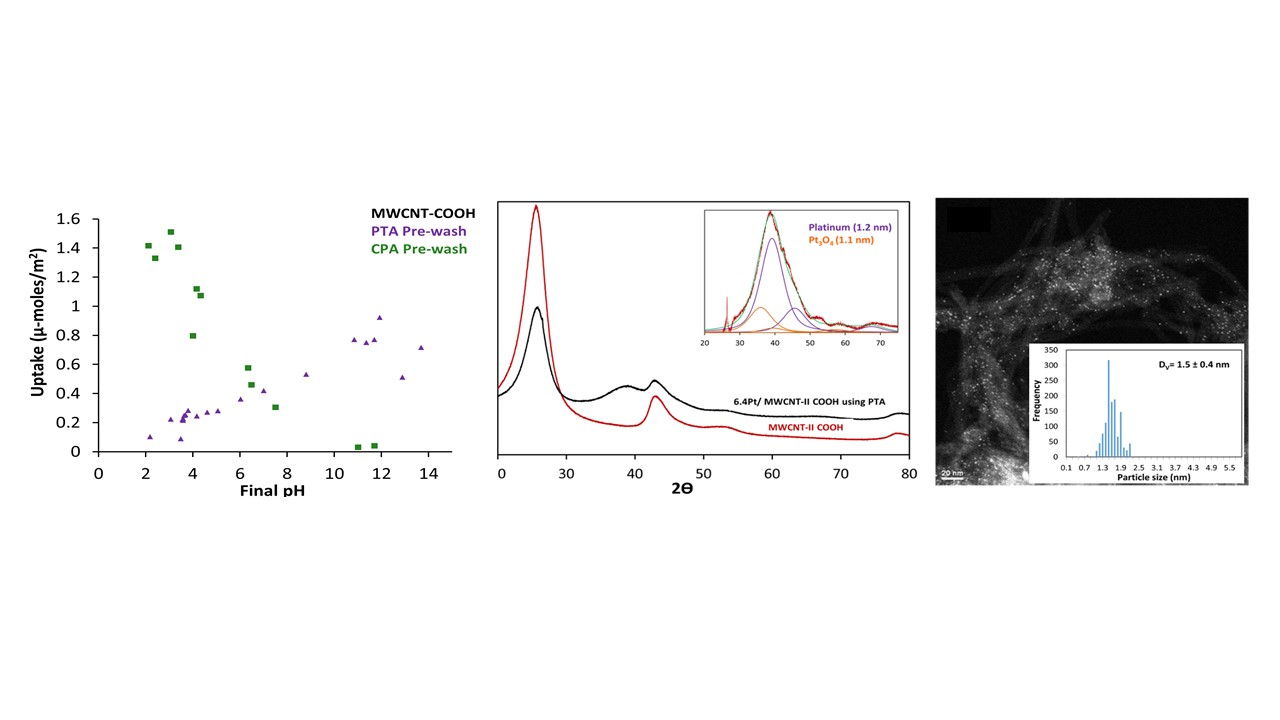
2.1. Pt Precursor Adsorption
2.2. Practical Considerations
3. Materials and Methods
3.1. Specialty Carbons
3.2. Adsorption Surveys
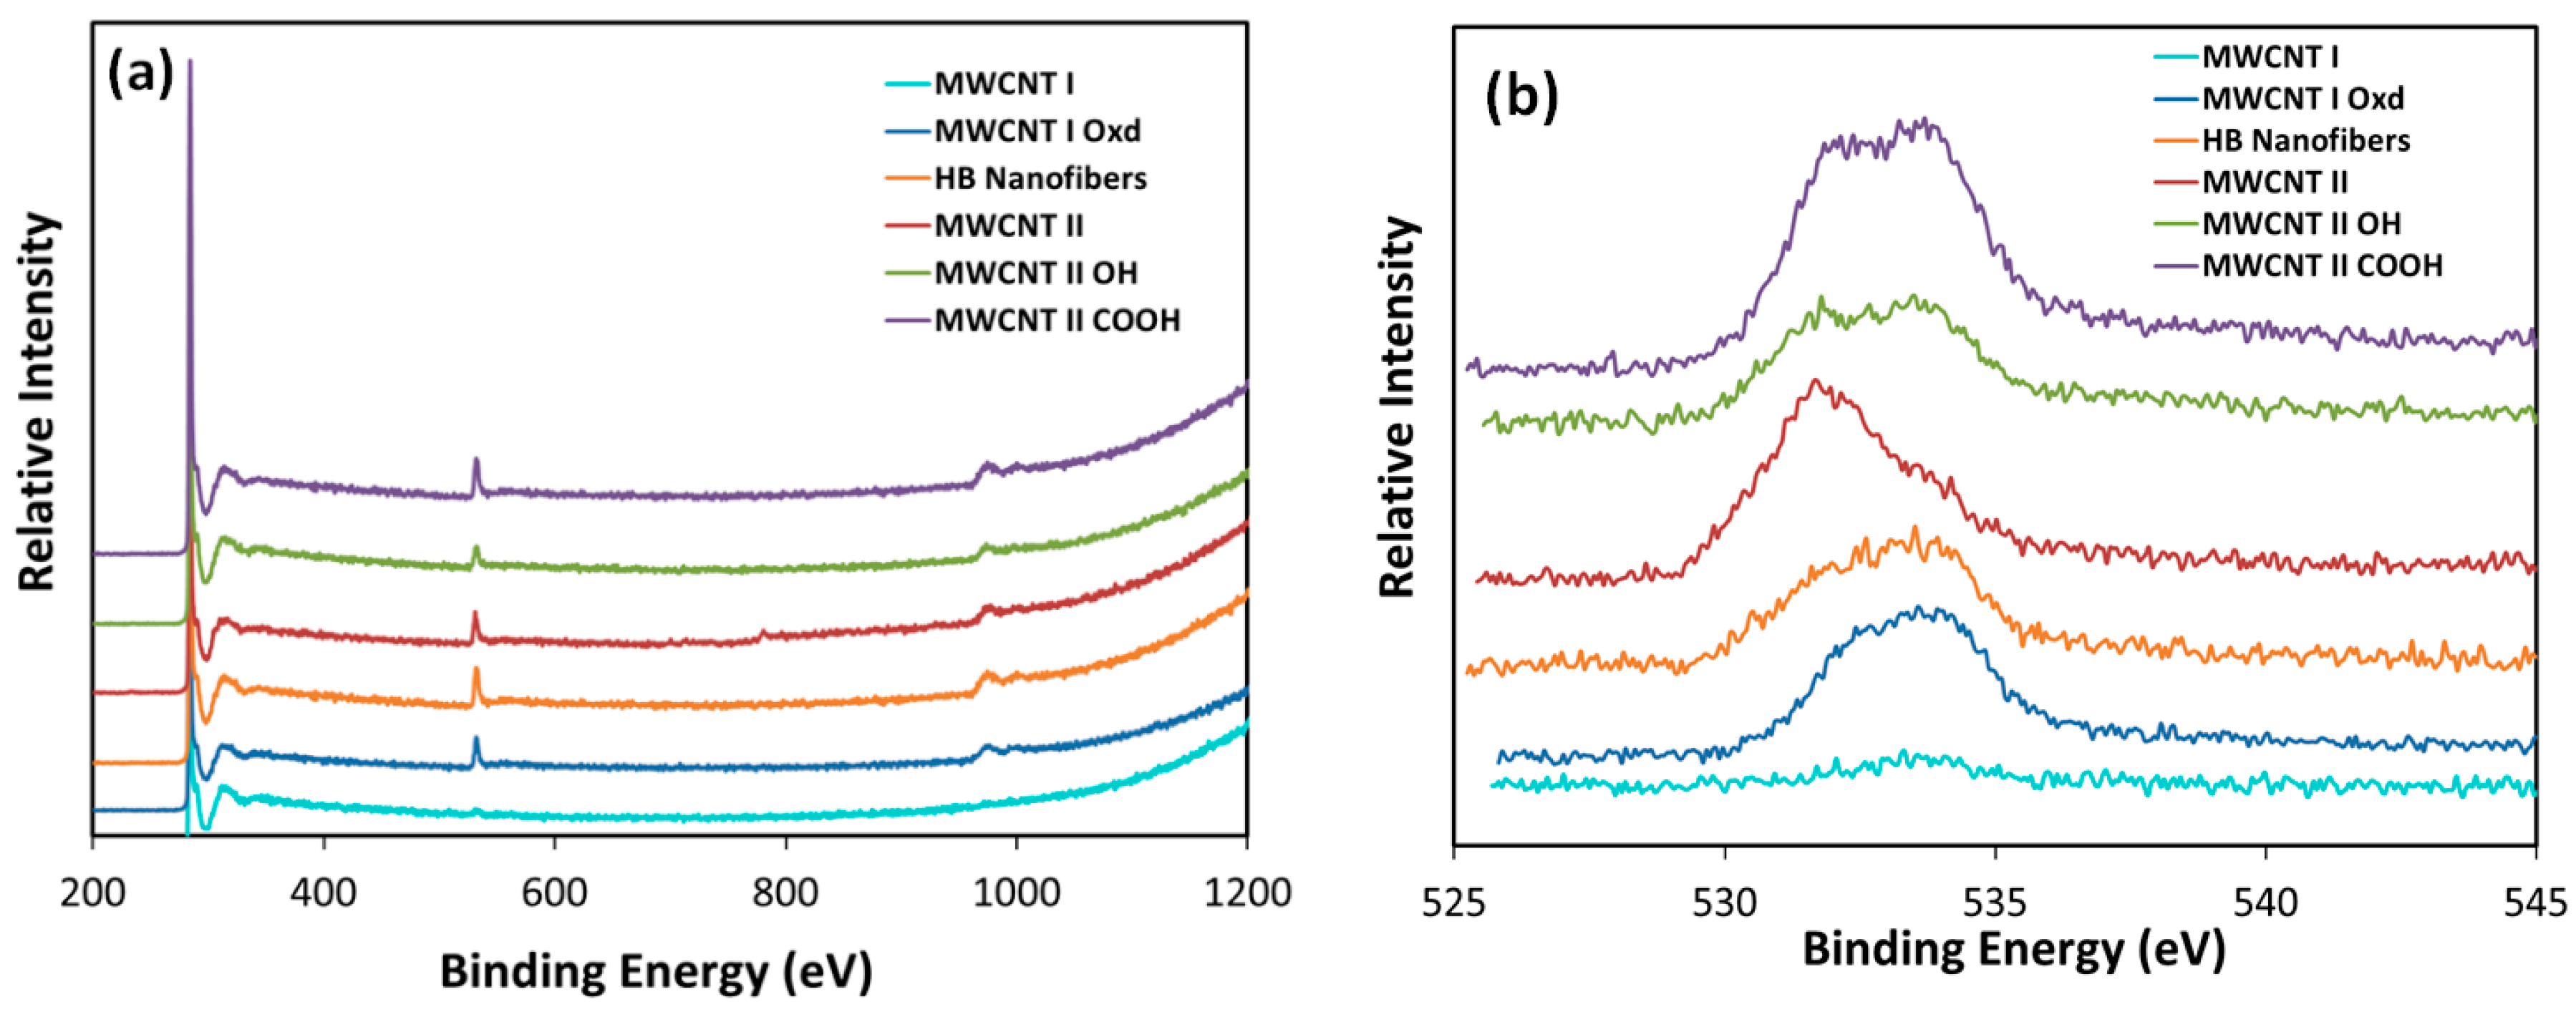
3.3. Characterization
4. Conclusions
Acknowledgments
Author Contributions
Conflicts of Interest
References
- Kim, Y.A.; Hayashi, T.; Endo, M.; Dresselhaus, M.S. Carbon Nanofibers. In Springer Handbook of Nanomaterials; Vajtai, R., Ed.; Springer: Heidelberg, Berlin, 2013; pp. 233–262. ISBN 978-3-642-20594-1. [Google Scholar]
- De Jong, K.P.; Geuss, J.W. Carbon nanofibers: Catalytic synthesis and applications. Catal. Rev. Sci.-Eng. 2000, 42, 481–510. [Google Scholar] [CrossRef]
- Lee, S.; Zhang, Z.; Wang, X.; Pfefferle, L.D.; Haller, G.L. Characterization of multi-walled carbon nanotubes catalyst supports by point of zero charge. Catal. Today 2011, 164, 68–73. [Google Scholar] [CrossRef]
- Serp, P.; Corrias, M.; Kalck, P. Carbon nanotubes and nanofibers in catalysis. Appl. Catal. A Gen. 2003, 253, 337–358. [Google Scholar] [CrossRef]
- Gupta, C.; Maheshwari, P.H.; Sachdev, D.; Sahud, A.K.; Dhakate, S.R. Highly purified CNTs: An exceedingly efficient catalyst support for PEM fuel cell. RSC Adv. 2016, 6, 32258–32271. [Google Scholar] [CrossRef]
- Gupta, C.; Maheshwari, P.H.; Dhakate, S.R. Development of multiwalled carbon nanotubes platinum nanocomposite as efficient PEM fuel cell catalyst. Mater. Renew. Sustain. Energy 2016, 5, 1–11. [Google Scholar] [CrossRef]
- Zheng, Y.; Dou, Z.; Fang, Y.; Li, M.; Wu, X.; Zeng, G.; Hou, Z.; Liao, S. Platinum nanoparticles on carbon-nanotube support prepared by room-temperature reduction with H2 in ethylene glycol/water mixed solvent as catalysts for polymer electrolyte membrane fuel cells. J. Power Sources 2016, 306, 448–453. [Google Scholar] [CrossRef]
- Bedolla-Valdez, Z.I.; Verde-Gómez, Y.; Valenzuela-Muñiz, A.M.; Gochi-Poncec, Y.; Oropeza-Guzmánd, M.T.; Berhaulte, G.; Alonso-Núñeza, G. Sonochemical synthesis and characterization of Pt/CNT, Pt/TiO2, and Pt/CNT/TiO2 electrocatalysts for methanol electro-oxidation. Electrochim. Acta 2015, 186, 76–84. [Google Scholar] [CrossRef]
- Ning, X.; Yu, H.; Peng, F.; Wang, H. Pt nanoparticles interacting with graphitic nitrogen of N-doped carbon nanotubes: Effect of electronic properties on activity for aerobic oxidation of glycerol and electro-oxidation of CO. J. Catal. 2015, 325, 136–144. [Google Scholar] [CrossRef]
- Yu, J.H.; Li, W.W.; Zhu, H. Effect of the diameter of carbon nanotubes supporting platinum nanoparticles on the electrocatalytic oxygen reduction. Acta Phys. Chim. Sin. 2017, 33, 1838–1845. [Google Scholar]
- Zhang, M.; Shi, J.; Suna, Y.; Ning, W.; Hou, Z. Selective oxidation of glycerol over nitrogen-doped carbon nanotubes supported platinum catalyst in base-free solution. Catal. Commun. 2015, 70, 72–76. [Google Scholar] [CrossRef]
- Zhu, Z.Z.; Bukowski, B.; Deskins, N.A.; Zhou, H.S. Bamboo shaped carbon nanotube supported platinum electrocatalyst synthesized by high power ultrasonic-assisted impregnation method for methanol electrooxidation and related density functional theory calculations. Int. J. Hydrogen Energy 2015, 40, 2216–2224. [Google Scholar] [CrossRef]
- Ashikawa, A.; Yoshie, R.; Kato, K.; Miyazawa, K.; Murata, H.; Hotozuka, K.; Tachibana, M. Pt nanoparticles supported on carbon nanowalls with different domain sizes for oxygen reduction reaction. J. Appl. Phys. 2015, 118, 214303. [Google Scholar] [CrossRef]
- Han, Q.; Liu, Y.; Wang, D.; Yuan, F.; Niu, X.; Zhu, X. Effect of carbon nanosheets with different graphitization degrees as a support of noble metals on selective hydrogenation of cinnamaldehyde. RSC Adv. 2016, 6, 98356–98364. [Google Scholar] [CrossRef]
- Li, M.; Wu, X.; Zeng, J.; Hou, Z.; Liao, S. Heteroatom doped carbon nanofibers synthesized by chemical vapor deposition as platinum electrocatalyst supports for polymer electrolyte membrane fuel cells. Electrochim. Acta 2015, 182, 351–360. [Google Scholar] [CrossRef]
- Wang, Y.; Wang, Y.; Jin, J.; Yang, S.; Li, G.; Qiao, J. Highly active and stable platinum catalyst supported on porous carbon nanofibers for improved performance of PEMFC. Electrochim. Acta 2015, 177, 181–189. [Google Scholar] [CrossRef]
- Andersen, S.M.; Ma, S.; Borghei, M.; Lund, P.; Elina, Y.R.; Pasanen, A.; Kauppinen, E.; Ruiz, V.; Kauranen, P.; Skou, E.M. Durability of carbon nanofiber (CNF) & carbon nanotube (CNT) as catalyst support for Proton Exchange Membrane Fuel Cells. Solid State Ion. 2013, 231, 94–101. [Google Scholar] [Green Version]
- Zhao, L.; Zhao, L.; Wang, Z.B.; Sui, X.L.; Yin, G.P. Effect of multiwalled carbon nanotubes with different specific surface areas on the stability of supported Pt catalysts. J. Power Sources 2014, 245, 637–643. [Google Scholar] [CrossRef]
- Tao, L.; Tao, L.; Dou, S.; Ma, Z.; Wang, S. Platinum nanoparticles supported on nitrobenzene-functionalized multiwalled carbon nanotube as efficient electrocatalysts for methanol oxidation reaction. Electrochim. Acta 2015, 157, 46–53. [Google Scholar] [CrossRef]
- Chiang, Y.C.; Hsieh, M.K.; Hsu, H.H. The effect of carbon supports on the performance of platinum/carbon nanotubes for proton exchange membrane fuel cells. Thin Solid Films 2014, 570, 221–229. [Google Scholar] [CrossRef]
- Tian, Z.B.; Liu, C.; Li, Q.; Hou, J.; Li, Y.; Ai, S. Nitrogen- and oxygen-functionalized carbon nanotubes supported Pt-based catalyst for the selective hydrogenation of cinnamaldehyde. Appl. Catal. A 2015, 506, 134–142. [Google Scholar] [CrossRef]
- Wang, Y.R.; Wang, Y.; Clancey, J.; Lu, G.; Liu, J.; Liu, L.; Chaudhuri, J.; George, S.; Xie, M.; Wei, S.; et al. Enhanced methanol oxidation with annealed atomic layer deposited platinum nanoparticles on carbon nanotubes. J. Electrochem. Soc. 2016, 163, F1–F10. [Google Scholar] [CrossRef]
- Ribeiro, L.S.; Ribeiro, L.S.; Rodrigues, E.G.; Delgado, J.J.; Chen, X.; Fernando, M.; Pereira, R.; Órfão, J.J.M. Pd, Pt, and Pt-Cu Catalysts Supported on Carbon Nanotube (CNT) for the Selective Oxidation of Glycerol in Alkaline and Base-Free Conditions. Ind. Eng. Chem. Res. 2016, 55, 8548–8556. [Google Scholar] [CrossRef]
- Chen, S.S.; Chen, S.; Qi, P.; Chen, J.; Yuan, Y. Platinum nanoparticles supported on N-doped carbon nanotubes for the selective oxidation of glycerol to glyceric acid in a base-free aqueous solution. RSC Adv. 2015, 5, 31566–31574. [Google Scholar] [CrossRef]
- Zhu, J.L.; Zhu, J.; He, G.; Liang, L.; Wan, Q.; Shen, P.K. Direct anchoring of platinum nanoparticles on nitrogen and phosphorus-dual-doped carbon nanotube arrays for oxygen reduction reaction. Electrochim. Acta 2015, 158, 374–382. [Google Scholar] [CrossRef]
- Sharma, R.; Kar, K.K. Particle size and crystallographic orientation controlled electrodeposition of platinum nanoparticles on carbon nanotubes. Electrochim. Acta 2015, 156, 199–206. [Google Scholar] [CrossRef]
- Zhang, C.; Hua, J.; Zhang, X.; Wang, X.; Meng, Y. Certain nitrogen functionalities on carbon nanofiber support for improving platinum performance. Catal. Today 2015, 256, 193–202. [Google Scholar] [CrossRef]
- Brunelle, J.P. Preparation of catalysts by metallic complex adsorption on mineral oxides. Pure Appl. Chem. 1978, 50, 1211–1229. [Google Scholar] [CrossRef]
- Hao, X.; Barnes, S.; Regalbuto, J.R. A fundamental study of Pt impregnation of carbon: Adsorption equilibrium and particle synthesis. J. Catal. 2011, 279, 48–65. [Google Scholar] [CrossRef]
- Lambert, S.; Job, N.; D’Souza, L.; Pereira, M.F.R.; Pirard, R.; Heinrichs, B.; Figueiredo, J.L.; Pirard, J.-P.; Regalbuto, J. Synthesis of very highly dispersed platinum catalysts supported on carbon xerogels by the strong electrostatic adsorption method. J. Catal. 2009, 261, 23–33. [Google Scholar] [CrossRef]
- Hao, X.; Quach, L.; Korah, J.; Spieker, W.A.; Regalbuto, J.R. The control of platinum impregnation by PZC alteration of oxides and carbon. J. Mol. Catal. A Chem. 2004, 219, 97–107. [Google Scholar] [CrossRef]
- Zhang, L.; Wen, G.; Liu, H.; Wang, N.; Su, D. Preparation of carbon nanotubes supported Pd catalysts by an electrostatic adsorption method. ChemCatChem 2014, 6, 2600–2606. [Google Scholar] [CrossRef]
- Regalbuto, J.R. Strong electrostatic adsorption of metals onto catalyst supports. In Catalyst Preparation: Science and Engineering; Regalbuto, J.R., Ed.; Taylor and Francis: Boca Raton, FL, USA, 2007. [Google Scholar]
- Regalbuto, J.R. A scientific method to prepare supported metal catalysts. In Surface and Nanomolecular Catalysis; Richards, R., Ed.; CRC Press: Boca Raton, FL, USA, 2006. [Google Scholar]
- Seuser, G.S.; Banerjee, R.; Metavarayuth, K.; Brandt, A.J.; Maddumapatabandi, T.D.; Karakalos, S.; Lin, Y.; Regalbuto, J.R.; Chen, D.A. Understanding uptake of Pt precursors during strong electrostatic adsorption on single-crystal carbon surfaces. Top. Catal 2017. [Google Scholar] [CrossRef]
- O’Connell, K.; Regalbuto, J.R. High sensitivity silicon slit detectors for 1 nm powder XRD size detection limit. Catal. Lett. 2015, 145, 777–783. [Google Scholar] [CrossRef]
- Banerjee, R.; Liu, Q.; Tengco, J.M.M.; Regalbuto, J.R. Detection of Ambient Oxidation of Ultrasmall Supported Platinum Nanoparticles with Benchtop Powder X-Ray Diffraction. Catal. Lett. 2017, 147, 1754–1764. [Google Scholar] [CrossRef]
- Gupta, V.; Saleh, T.A. Syntheses of Carbon Nanotube-Metal Oxides Composites, Adsorption and Photo-degradation. In Carbon Nanotubes—From Research to Applications; Bianco, S., Ed.; IN TECH: Rijeka, Croatia, 2011; ISBN 978-953-307-500-6. [Google Scholar]
- Guadagno, L.; Raimondo, M.; Vittoria, V.; Vertuccio, L.; Lafdi, K.; Vivo, B.D.; Lamberti, P.; Spinelli, G.; Tucci, V. The role of carbon nanofiber defects on the electrical and mechanical properties of CNF-based resins. Nanotechnology 2013, 24, 305704–305714. [Google Scholar] [CrossRef] [PubMed]
- Rodriguez, F.R. The role of carbon materials in heterogeneous catalysis. Carbon 1998, 36, 159–175. [Google Scholar] [CrossRef]
- Wojdyr, M. Fityk: A general-purpose peak fitting program. J. Appl. Crystallogr. 2010, 43, 1126–1128. [Google Scholar] [CrossRef]
- Datye, A.K.; Xu, Q.; Kharas, K.C.; McCarty, J.M. Particle size distributions in heterogeneous catalysts: What do they tell us about the sintering mechanism? Catal. Today 2006, 111, 59–67. [Google Scholar] [CrossRef]


| Preparation Method | Metal Loading % | Carbon Type | Particle Size (nm) | Method for Size | Ref. |
|---|---|---|---|---|---|
| Reduction (ethylene glycol) | 10 | CNT | 2.7 | XRD | [5] |
| Reduction (ethylene glycol) | 20 | CNT | 2.67 | XRD | [6] |
| Reduction (ethylene glycol) | 20 | CNT | 3 | TEM | [7] |
| Reduction | 10 | CNT | 2.95 ± 0.33 | TEM | [8] |
| Reduction (ethylene glycol) | 4.87 | CNT | 3.42 ± 0.58 | TEM | [9] |
| Reduction (ethylene glycol) | 19.6 | CNT | 4.7 | TEM | [10] |
| Reduction (ethylene glycol) | 5 | MWCNT | 2.2 | XRD | [11] |
| Reduction NaBH4 | 24.8 | MWCNT | 6.5 | TEM | [12] |
| Reduction | 19–23 | CNW | 3.4–5.3 | XRD | [13] |
| Reduction (Borohydride) | 3.5 | CNS | 5.2 | XRD | [14] |
| Reduction (ethylene glycol) | 40 | CNF | 4.0 | XRD | [15] |
| Reduction (ethylene glycol) | 20 | CNF | 3.1 | XRD | [16] |
| Polyol | 20 | CNT | 2-3 | TEM | [17] |
| Polyol | 20 | MWCNT | 1.7 | TEM | [18] |
| Polyol | 12.4 | MWCNT | 3.9 | TEM | [19] |
| Colloidal method | 20 | CNF | 2.9–4.4 | TEM | [20] |
| Impregnation-reduction-deposition | 2 | CNT | 4.0–4.5 | TEM | [21] |
| Atomic layer deposition | 16.2 | CNT | 2 | TEM | [22] |
| Incipient-wetness impregnation | 1 | CNT | 4.6 | TEM | [23] |
| Wet impregnation | 1 | CNT | 2.7 | TEM | [24] |
| Microwave heating method | 19.5 | CNT | 2.5 | TEM | [25] |
| Electrodeposition | - | CNT | 1.5 | XRD | [26] |
| Radio frequency magnetron sputtering | 29.2 | CNF | 3.6 | TEM | [27] |
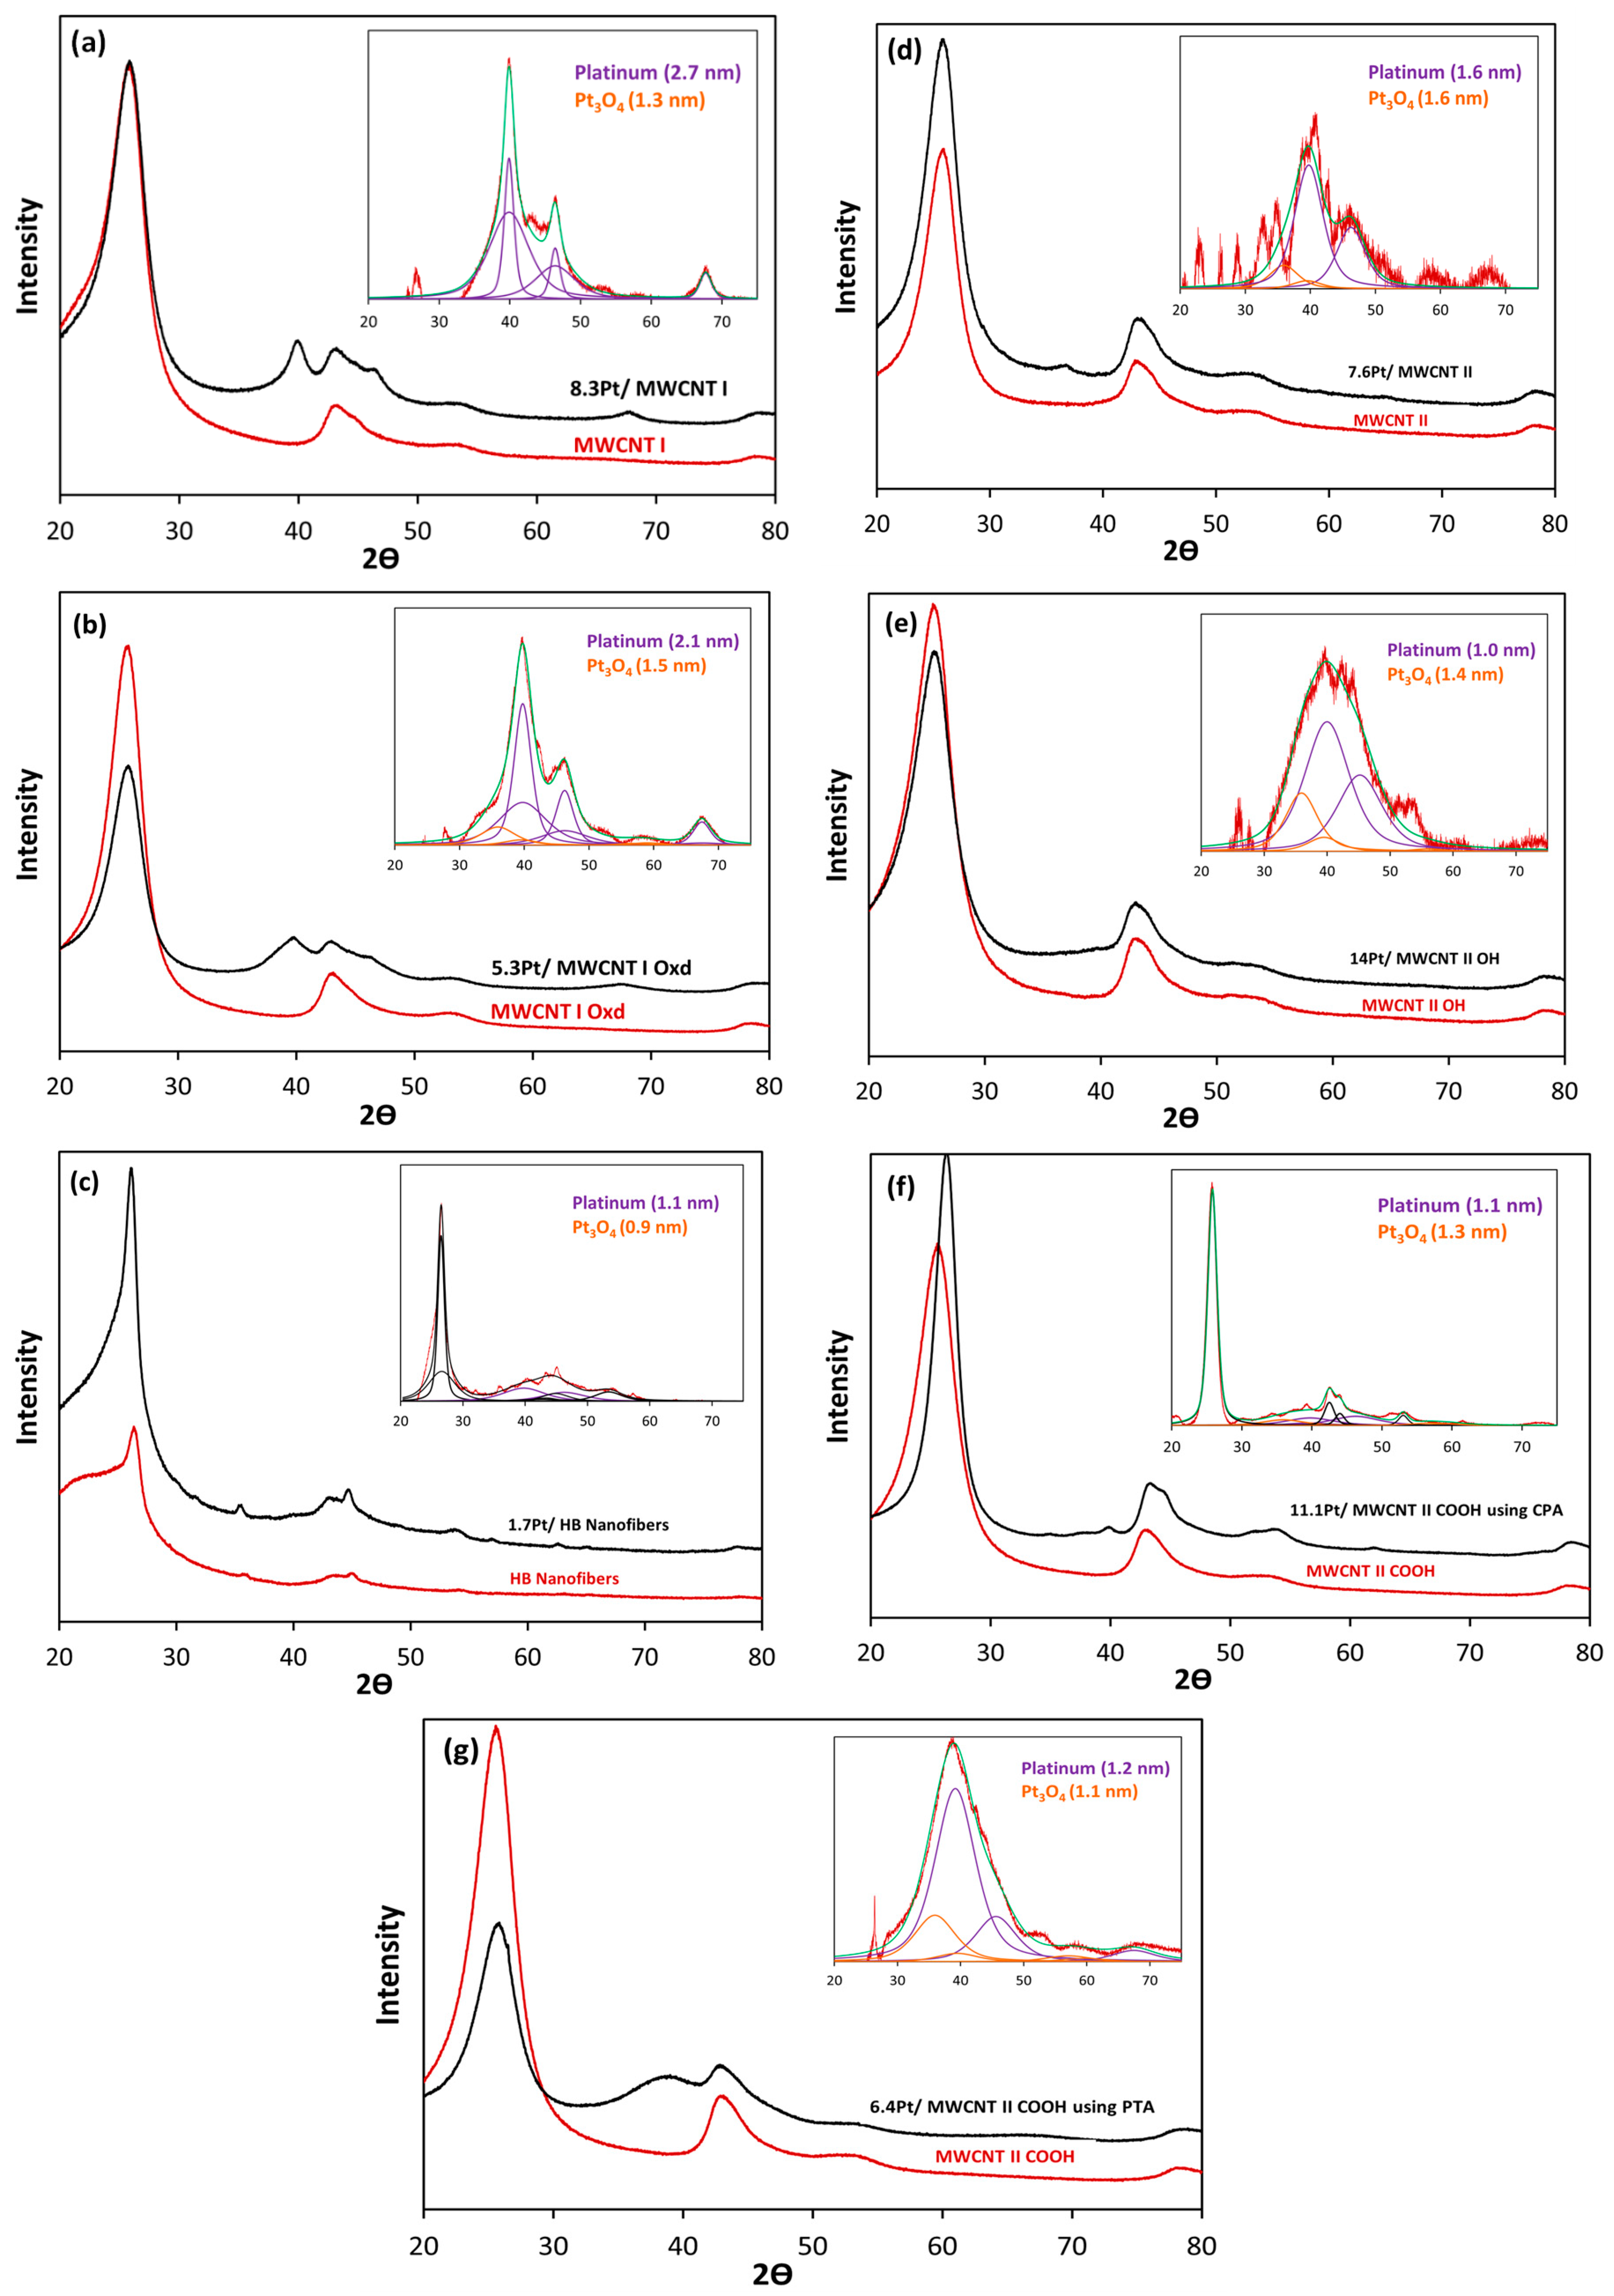
| Support | Precursor | BET Area (m2/g) | PZC | Adsorption pH | Metal Loading (wt %) | XRD Size (nm) | STEM Size (nm) | |
|---|---|---|---|---|---|---|---|---|
| Pt | Pt3O4 | |||||||
| MWCNT I | PHC | 301 | 5.4 | 4.3 | 8.3 | 2.7 | 1.3 | 4.2 |
| MWCNT I Oxd | PTA | 308 | 2.7 | 12.1 | 5.3 | 2.0 | 1.1 | 1.7 |
| MWCNT II | PHC | 302 | 9.3 | 5.7 | 7.6 | 1.6 | 1.6 | 2.9 |
| MWCNT II OH | PHC | 558 | 5.9 | 5.5 | 14 | 1.0 | 1.4 | 1.8 |
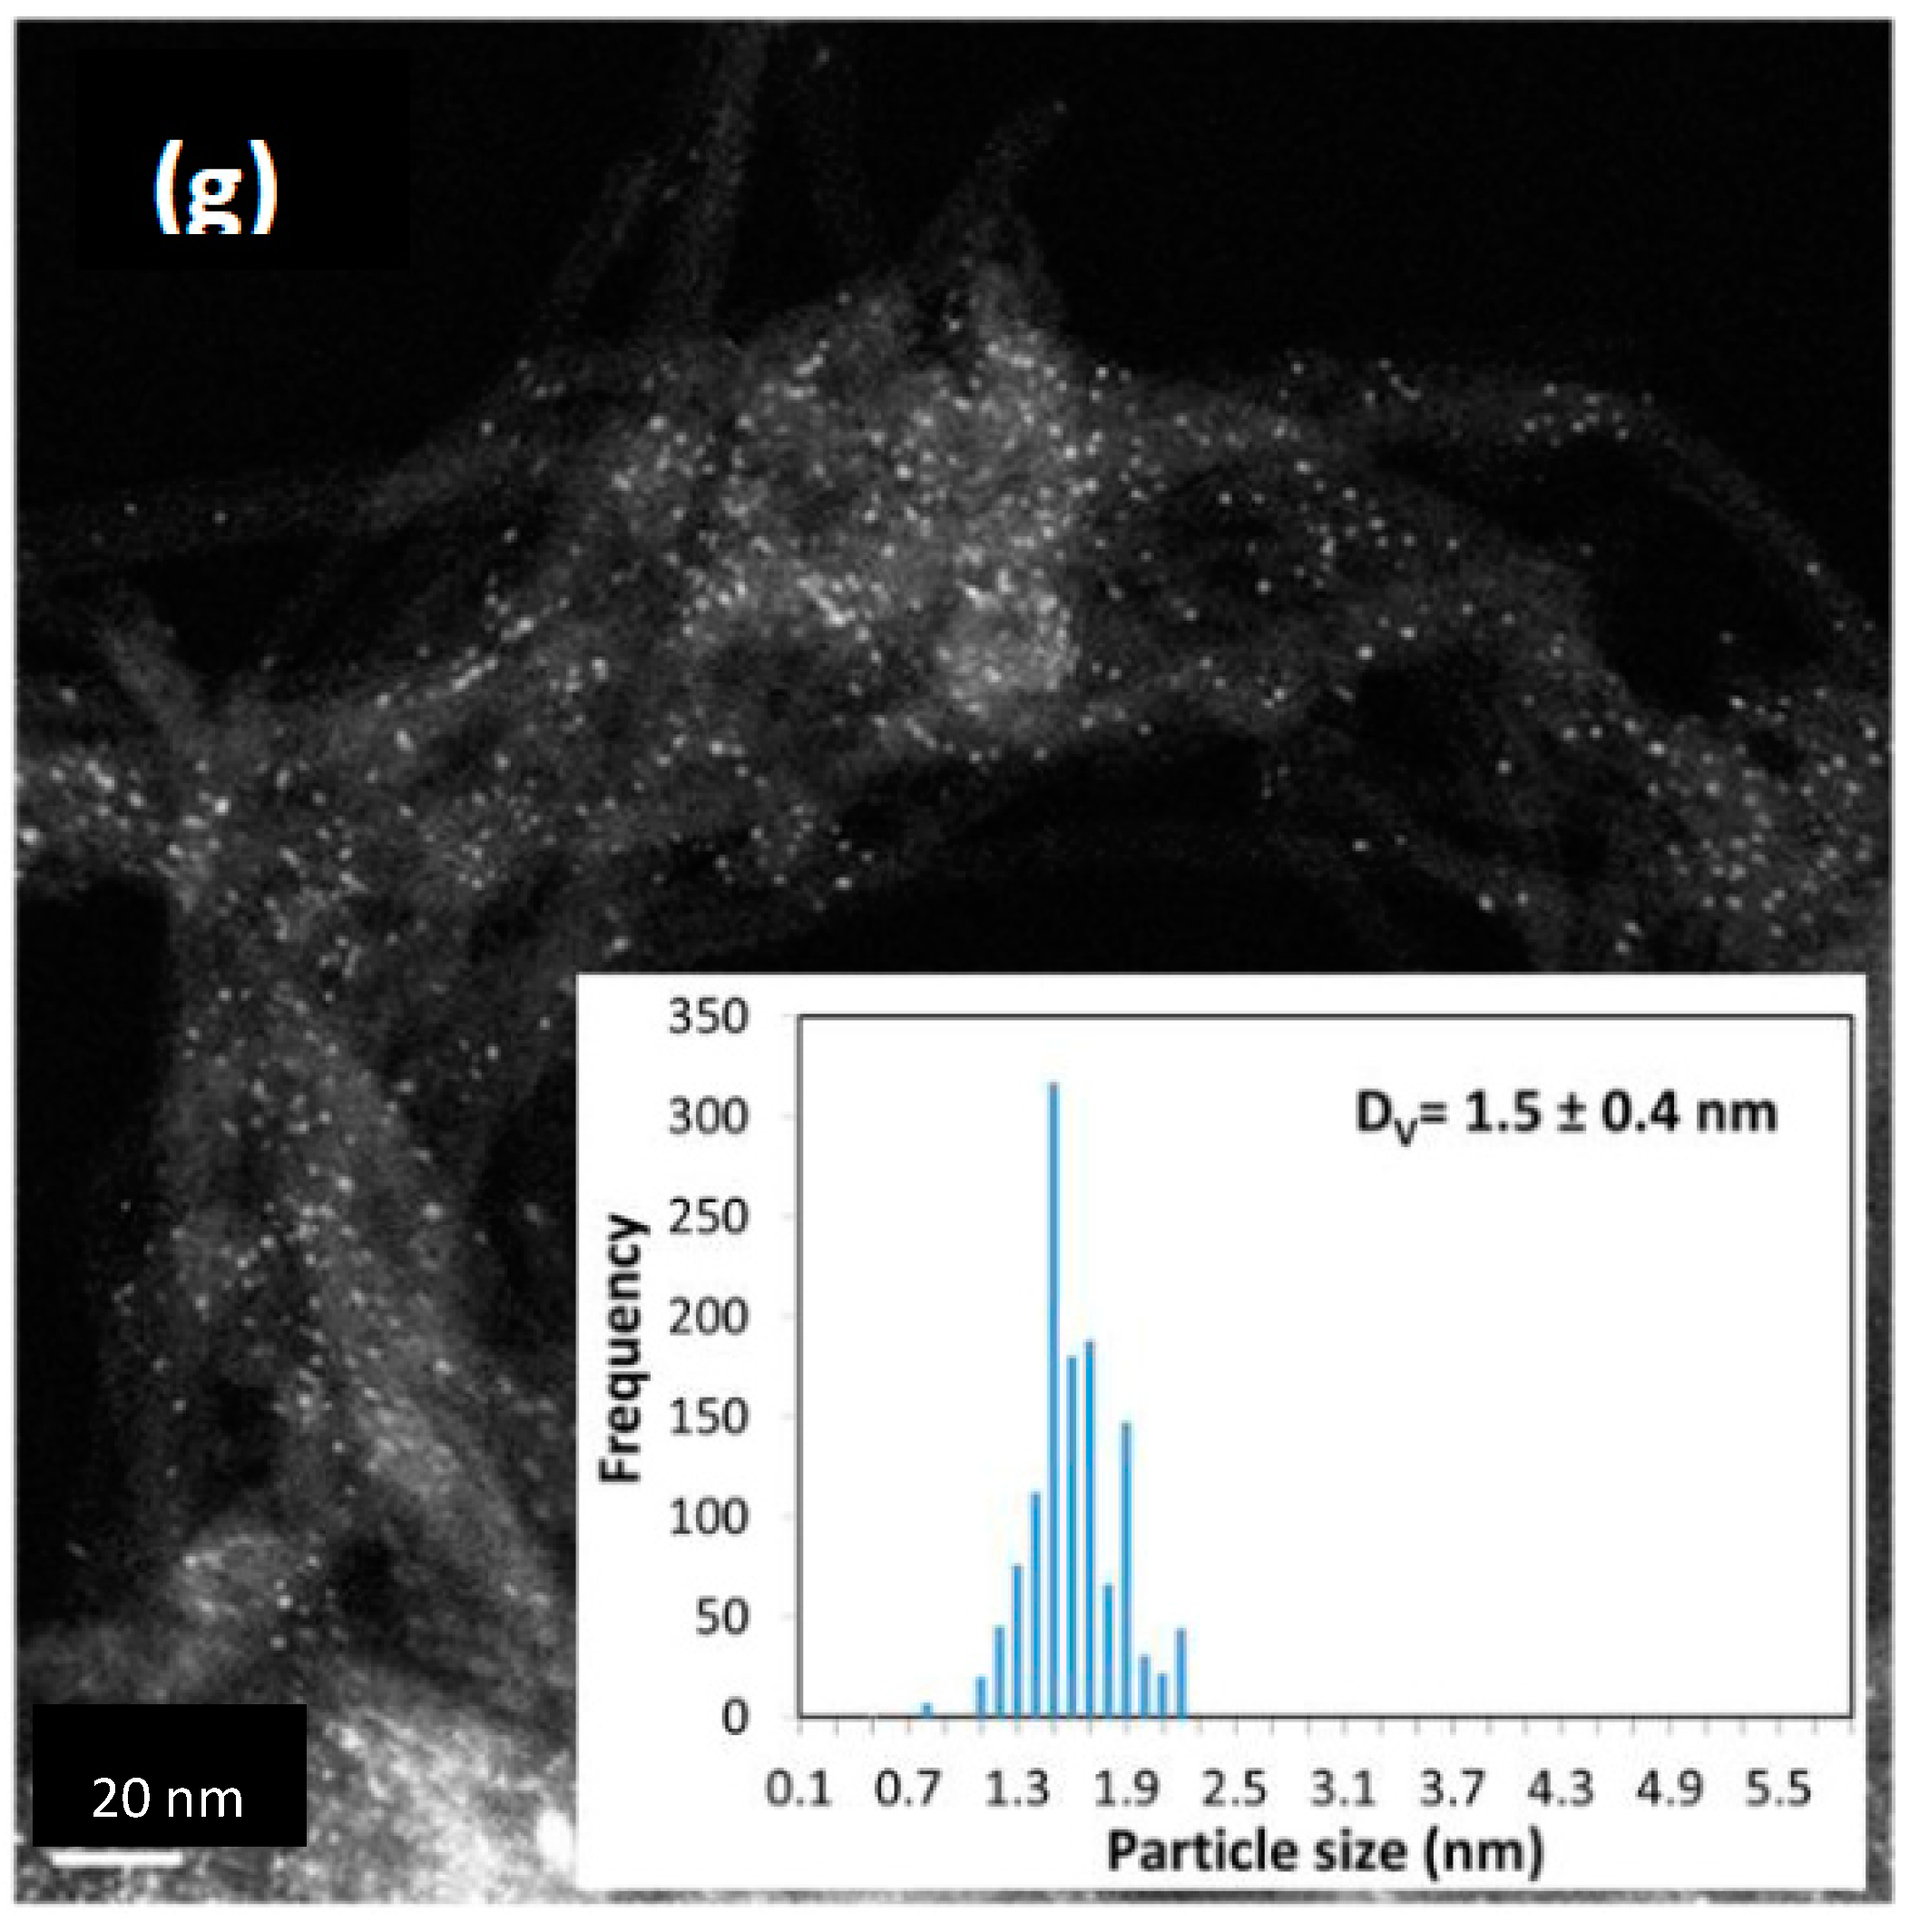
| MWCNT II COOH | PTA | 416 | 3.1 | 11.9 | 6.4 | 1.2 | 1.1 | 1.5 |
| PHC | 3 | 11.1 | 1.1 | 1.3 | 1.7 | |||
| HB Nanofibers | PHC | 54 | 5.4 | 3 | 1.7 | 1.1 | 0.9 | 1.5 |
© 2018 by the authors. Licensee MDPI, Basel, Switzerland. This article is an open access article distributed under the terms and conditions of the Creative Commons Attribution (CC BY) license (http://creativecommons.org/licenses/by/4.0/).
Share and Cite
Banerjee, R.; Contreras-Mora, J.L.; McQuiston, S.K.; Bolton, B.; Tavakoli Mehrabadi, B.A.; Regalbuto, J.R. Electrostatic Adsorption of Platinum onto Carbon Nanotubes and Nanofibers for Nanoparticle Synthesis. C 2018, 4, 12. https://doi.org/10.3390/c4010012
Banerjee R, Contreras-Mora JL, McQuiston SK, Bolton B, Tavakoli Mehrabadi BA, Regalbuto JR. Electrostatic Adsorption of Platinum onto Carbon Nanotubes and Nanofibers for Nanoparticle Synthesis. C. 2018; 4(1):12. https://doi.org/10.3390/c4010012
Chicago/Turabian StyleBanerjee, Ritubarna, Jose L. Contreras-Mora, Susan K. McQuiston, Brandon Bolton, Bahareh Alsadat Tavakoli Mehrabadi, and John R. Regalbuto. 2018. "Electrostatic Adsorption of Platinum onto Carbon Nanotubes and Nanofibers for Nanoparticle Synthesis" C 4, no. 1: 12. https://doi.org/10.3390/c4010012