Catalytic Growth of Carbon Nanotubes by Direct Liquid Injection CVD Using the Nanocluster [HxPMo12O40⊂H4Mo72Fe30(O2CMe)15O254(H2O)98-y(EtOH)y]


1
Department of Chemistry, Rice University, Houston, TX 77005, USA
2
Department of Materials Science and Nanoengineering, Rice University, Houston, TX 77005, USA
3
Energy Safety Research Institute, Swansea University Bay Campus, Swansea SA1 8EN, UK
*
Author to whom correspondence should be addressed.
C 2018, 4(1), 17; https://doi.org/10.3390/c4010017
Submission received: 8 January 2018
/
Revised: 24 February 2018
/
Accepted: 26 February 2018
/
Published: 2 March 2018
(This article belongs to the Special Issue Carbon Nanotube and Applications)
Abstract
:The growth of carbon nanotubes (CNTs) by direct liquid injection chemical vapor deposition (DLICVD) has been studied using the polyoxometalate cluster [HxPMo12O40⊂H4Mo72Fe30(O2CMe)15O254(H2O)98-y(EtOH)y] (FeMoC) as the catalyst with either ethanol or toluene as the carbon source. In order to screen different growth conditions a single large batch of FeMoC is required in order to eliminate variation in the catalyst precursor. The preparation of 6 g of FeMoC is possible by scaling (10×) literature reagent ratios. DLICVD studies of the FeMoC derived carbon product were evaluated by Raman spectroscopy and scanning electron microscopy (SEM) to determine the quality (G:D ratio) and purity of CNT content. With the use of ethanol as the carbon source, increasing the temperature in the injection zone (aspiration temperature) above 250 °C increases the yield, and results in a slight increase in the G:D ratio. The maximum yield is obtained with a growth temperature of 900 °C, while the G:D ratio is the highest at higher temperatures. Faster solution injection rates increase yield, but with a significant decrease in G:D, in fact no CNTs are observed in the product for the highest injection rate (10 mL/h). An optimum catalyst concentration of 1.25 wt.% is found, which influences both the catalyst:C and catalyst:H ratios within the system. Growth at 800 °C is far more efficient for toluene as a carbon source than ethanol. The resulting “process map” allows for large quantities of CNTs to be prepared by DLICVD.
1. Introduction
Although carbon nanotubes (CNTs) are of interest for numerous applications, such as high-performance composites, electronics, and energy storage devices [1,2,3,4,5,6], and the current production lacks structural control, resulting in a range of chiralities and diameters. To realize their potential controlled growth of CNTs is desired. Towards this goal, engineered catalysts appear to be the ideal route. The catalyst plays a critical role in the complicated process of nucleation and growth of CNTs. Traditional catalysts for catalytic chemical vapor deposition (CCVD) growth of CNTs suffer from a lack of control in size and composition of the catalyst [7,8]. This is important, given the dramatic influence both size and composition have on the resulting CNTs, possibly explaining the undesirably broad distribution in diameter and chiralities observed [9,10,11].
The polyoxometalate cluster [HxPMo12O40⊂H4Mo72Fe30(O2CMe)15O254(H2O)98-y(EtOH)y] (abbreviated as FeMoC for “iron-molybdenum cluster”) appears to be an ideal catalyst for CNTs given its uniformity and constituent makeup. FeMoC is uniform in size (~2.5 nm diameter) and metal composition (i.e., Mo:Fe = 84:30). Thus, circumventing the challenges in catalyst uniformity. Additionally, FeMoC belongs to the Fe-Mo system that consists of high temperature alloys, likely to maintain their structure under CCVD conditions. The Fe-Mo system has also demonstrated excellent catalytic performance; ultra-long single walled carbon nanotubes (SWCNT) growth (>18.5 cm), growth of ultra-high-density SWCNTs (160 SWCNTs/μm2), and SWCNT growth under variable temperatures (450–1000 °C) [12,13,14,15].
Liu and co-workers first reported that SWCNTs could be grown using the molecular nanocluster FeMoC [16]; however, it was found to be necessary to add an external source of iron to enable growth. Anderson et al. [17] subsequently found that even with ligand exchange and purification, the nanocluster on its own resulted in essentially no observable growth. As with the report by Liu, it was found that the specific coordination of an additional 25 Fe atoms was required in order to achieve SWCNT growth. These results appear counter to theoretical work by Ding and co-workers that suggest the minimum size of a catalyst must be 20 atoms [18]. The addition of 25 Fe atoms to FeMoC through coordination would suggest that 139 atoms are sufficient, but 114 are not. When considering that both Mo and Fe have demonstrated effective catalytic performance both independently and as mixed heterogenous nanoparticles [19,20,21,22], FeMoC should be catalytically active, but under the growth conditions reported in prior work it is not [16,17,23,24]. We have recently shown that this is in part due to both incomplete catalyst activation and the sublimation of a portion of the Mo component during the slow catalyst activation process [25,26]. However, the growth conditions (temperature, gas composition, carbon source, and catalyst concentration) also play role in the catalytic activity [27,28,29,30]. Therefore, we are interested in investigating the CCVD conditions that are used in CNT growth with FeMoC.
Herein, we investigate the synthesis conditions that were used for the scale-up of FeMoC: pH environment, air sensitivity, and relative molar ratios of reactants. Subsequently, FeMoC is used in the CCVD growth of CNTs using a direct liquid injection chemical vapor deposition (DLICVD) reactor, as depicted in Figure 1. The DLICVD system was selected given the numerous advantages it provides; i.e., ease of scale-up, fast processing time, minimal maintenance, and the versatility in fine-tuning growth parameters. The DLICVD growth parameters, aspiration temperature, growth temperature, injection rate, catalyst concentration, and carbon source, are studied in the aim of elucidating their influence on FeMoC catalyst performance. In our initial studies, we focus optimizing a “process map” for CNT growth; however, given the potentially larger scale of vapor phase growth over surface growth previously reported [17] it is also important to understand the limitations of the scalability of the synthesis of FeMoC.
2. Experimental Section
2.1. Materials and Characterization
FeMoC synthesis chemicals (iron(II) chloride tetrahydrate, phosphomolybdic acid hydrate, sodium molybdate, glacial acetic acid, hydrochloric acid), were purchased from Sigma-Aldrich (St. Louis, MO, USA) and were used as received. HiPco single-walled carbon nanotubes (Batch No. 188.4) were obtained from the Carbon Nanotube Laboratory at Rice University (Houston, TX, USA) and used as received. The 5% hydrogen gas blend (Ar balance) was acquired from Matheson Tri-Gas (Basking Ridge, NJ, USA). Quartz tube substrates were purchased from GM Associates Inc. (product # 6000-53, Oakland, CA, USA).
UV-visible measurements were performed on an Agilent 8453 system (Santa Clara, CA, USA) using a diluted FeMoC solution in EtOH. Raman spectra were obtained using a Renishaw inVia Raman Microscope (Wotton-under-Edge, UK), at 514.5 nm wavelength, using a 50× LWD lens, data was acquired with 3 or more accumulations between 100 cm−1 and 3300 cm−1 with cosmic-ray background removal applied. FT-IR measurements were obtained using a Nicolet iS50 FTIR Infrared Microscope (Waltham, MA, USA) with an ATR objective with 2 cm−1 resolution. TEM characterization was performed on a JEOL 2100F TEM (Akishima, Tokyo, Japan) at 200 kV equipped with a CCD camera. TEM samples were prepared by drop casting a diluted solution of FeMoC (0.01 µM) in EtOH onto ultrathin lacey carbon TEM grids (400 mesh, Ted Pella, Inc., Redding, CA, USA). TGA was conducted using a TA instruments Q-600 (New Castle, DE, USA) with air as the carrier gas (Matheson Tri-Gas). Measurements were performed using ~5 mg samples that were placed in an alumina pan and heated to 900 °C with a ramp rate of 5 °C/min under a 100 mL/min carrier gas flow. SEM was performed on a FEI Quanta 400 field emission scanning electron microscope (Hillsboro, OR, USA). SEM samples were placed on double-sided carbon tape that is fixed to aluminum SEM stubs, used as received. Images were acquired under the high vacuum setting with a typical operating voltage of 5 kV, with a working distance of 10 mm, and spot size of 3.
2.2. FeMoC Synthesis
FeMoC was synthesized and purified as previously reported [14]. In a typical synthesis, iron(II) chloride tetrahydrate (1.00 g, 5.03 mmol) was dissolved in Millipore water (75 mL) followed by the addition of sodium molybdate dihydrate (2.00 g, 8.27 mmol). To this solution, phosphomolybdic acid hydrate (2.50 g, 1.37 mmol) and pure glacial acetic acid (10 mL, 59 mmol) were added. HCl was then used to adjust the solution pH to 2 followed by stirring at room temperature for 45 min. The solution was then filtered through a fine glass frit. The filtrate was then left to crystallize in air. The crystals were then vacuum filtered, washed with cold Millipore water, and dried. The resulting solid was placed in a membrane thimble and transferred to a Soxhlet extractor. After refluxing in EtOH for 12 h, a dark green solution was collected.
2.3. CNT Growth
The synthesis of CNTs was carried out using a Nanotech Innovations SSP-354 two-zone liquid injection furnace [31]. A 5% hydrogen gas blend (Ar balance) was used as the carrier gas. The flow rate for the mixed gas was held constant at 1 Lpm. The quartz furnace tube was used as the growth substrate. The DLICVD system was purged with the carrier gas for 15 min prior to heating the first zone (aspiration zone) of the furnace to either 150, 225, or 300 °C (please see 3.2. Direct Liquid Injection Chemical Vapor Deposition (DLICVD))). Then the second zone (growth zone) was set to the growth temperature (700, 800, 900, and 1000 °C). After reaching equilibrium, a 3 mL solution containing FeMoC in either EtOH or toluene was injected into the furnace via a 9” needle that was obtained from Hamilton Syringe Company (part# 7748-12). The injection speed of 1, 5, and 10 mL/h was controlled via a syringe pump system (KOS 106). Upon injection completion, the furnace was turned off and cooled under the H2/Ar atmosphere.
3. Results and Discussion
3.1. Optimization of FeMoC Synthesis
FeMoC was synthesized under a range of conditions as shown in Table 1. The synthesized products were evaluated with UV-visible spectroscopy, Raman spectroscopy, Fourier transform infrared (FT-IR) spectroscopy, and transmission electron microscopy (TEM) to verify successful synthesis of FeMoC. The higher Fe reagent concentration was investigated to more closely match the stoichiometry of the desired product. To scale FeMoC, experiments (Exp.) were also conducted using the literature (Lit.) molar ratio values, as seen in Table 1.
The UV-visible spectrum results for all growth experimental conditions are shown Figure 2. In the literature, the UV-visible spectra of FeMoC is reported to have characteristic peaks at 550, 880, and 1045 nm, corresponding to the nucleus shell charge transfer between Keggin guest and host (550 nm) and the [MoV→MoVI] charge transfer in the Keggin cluster (880 and 1045 nm) [17,32]. Given this information, experiments 2–4, and 7 show the characteristic features of FeMoC. The failure of experiments 1, 5, 6, 8 to form FeMoC are likely due to the conditions that were employed. For experiments 1, 6, and 8 the Soxhlet purification process was conducted in air. The high temperature refluxing of EtOH in the presence of air, likely results in FeMoC degradation [33,34]. For experiment 5, FeMoC synthesis likely failed due to the unfavorable pH, which controls the relative formation of the MoVI and MoV centers. The MoVI centers are critical in the formation of the pentagonal [MoVI(MoV)5] units in the polyoxometalate framework, and the MoV centers take the role as linkers that connect the icosahedral structure. The formation of the Keplerate cage requires the coexistence of MoVI and MoV centers in a favorable ratio [34]. Therefore, the unfavorable pH environment in experiment 5 likely failed to produce FeMoC by preventing the necessary ratio of MoVI to MoV centers that were required to build the Keplerate cage.
For DLICVD studies, the product from experiment 4 was used. Therefore, further characterization of the products, in addition to UV-visible, was performed to confirm FeMoC synthesis. Raman spectroscopy offers a fast way to evaluate successful synthesis of FeMoC [25,32], and the Raman spectrum for experiment 4 [25] confirms the formation of FeMoC. Fourier transform infrared (FT-IR) spectroscopy results also corroborate the successful synthesis of FeMoC [25], with corresponding peaks being indicative of FeMoC [17,32,35,36]. Transmission electron microscopy (TEM) was also performed to verify the nanocluster size of FeMoC [25]. TEM imaging of the as synthesized product from experiment 4 reveals spherical nanoparticles with a ~2.5 nm diameter characteristic of FeMoC from single crystal X-ray diffraction studies [32].
3.2. Direct Liquid Injection Chemical Vapor Deposition (DLICVD)
The experimental results for the catalytic growth of carbon nanomaterials using FeMoC that were carried out using various CVD conditions are shown in Table 2. The products of each experiment were characterized by Raman spectroscopy (see Supplementary Materials), revealing the quality of the CNTs as determined by the relative intensities of the G and D peaks. The stretching mode associated with the G peak is attributed to the tangential displacement of the carbon-carbon bond stretching motions in the range of 1500 to 1600 cm−1. This G peak consists of both the G− and G+ bands, attributed to the E2g symmetry stretching along the in-plane circumferential direction (G−), and the in-plane vibrations along the tube axis (G+) [37]. The D peak is attributed to the disorder mode (A1g symmetry), ranging from 1290 to 1330 cm−1 as a consequence of the lattice imperfections and crystallinity disorders [38]. Thus, the relative intensities of G and D are used to evaluate the quality of carbon materials consisting of sp2 hybridized states, such as carbon nanotubes and graphene.
3.3. Variation of Aspiration Temperature
To elucidate the influence of the aspiration temperature (1st zone in furnace), experiments were performed using a growth temperature of 800 °C, a 1 mL/h injection rate, a 1.25 wt.% catalyst concentration, using EtOH as a carbon source (Table 2). The aspiration temperature will influence the carbon precursor dictating the possible mixture of complex volatile organic compounds that enter the reaction zone [39]. This is important because the precursor chemistry has been demonstrated to influence the CNT morphology [40]. Additionally, the aspiration temperature will also affect the temperature gradient that is entering the reaction zone. Thus, the aspiration temperature influences the inlet gas mixture composition and flows that enter the growth zone of the furnace.
Figure 3 shows the Raman characterized G:D ratio and the isolated product yield as a function of the aspiration (injection zone) temperature. The Raman results (see Supplementary Materials) reveal a small variance in G:D ratio with aspiration temperature, ranging from 1.25 to 1.56, suggesting that the aspiration temperature has little influence on the quality of the carbon materials that are produced under the conditions employed. However, the aspiration temperature is shown to have a significant influence on the product yield, which increases with increasing aspiration temperature. The increase in product yield may be attributed to the increase in carbon available for catalysis or alternatively as a consequence of the pre-decomposition of the EtOH (see below).
Figure 4 shows growth of CNTs under all of the experimental conditions, in agreement with the Raman characterization. The SEM imaging of the product using a 150 °C aspiration temperature (Figure 4a) consists of various carbon materials, including CNTs, while experiments that were conducted at 225 °C (Figure 4b) display large CNT bundles. Finally, at an aspiration temperature of 300 °C (Figure 4c), SEM images show agglomerations of carbon materials with protruding nanostructures.
3.4. Variation of Growth Temperature
The growth temperature is expected to influence CNT product and morphology by dictating both the kinetics of hydrocarbon decomposition, and the thermodynamics of the system, namely the energy available for carbon structure arrangements. The growth temperature also plays a role in determining the catalyst structure and physical state (solid or liquid) that intimately influences the CNT morphology. Previous studies show that the morphology of product varies with decomposition temperature: the general trend being that an increasing temperature results in CNTs with a larger average diameter and a broader diameter distribution [41,42,43].
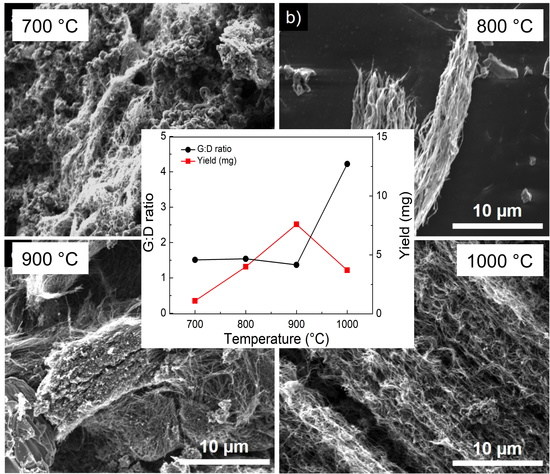
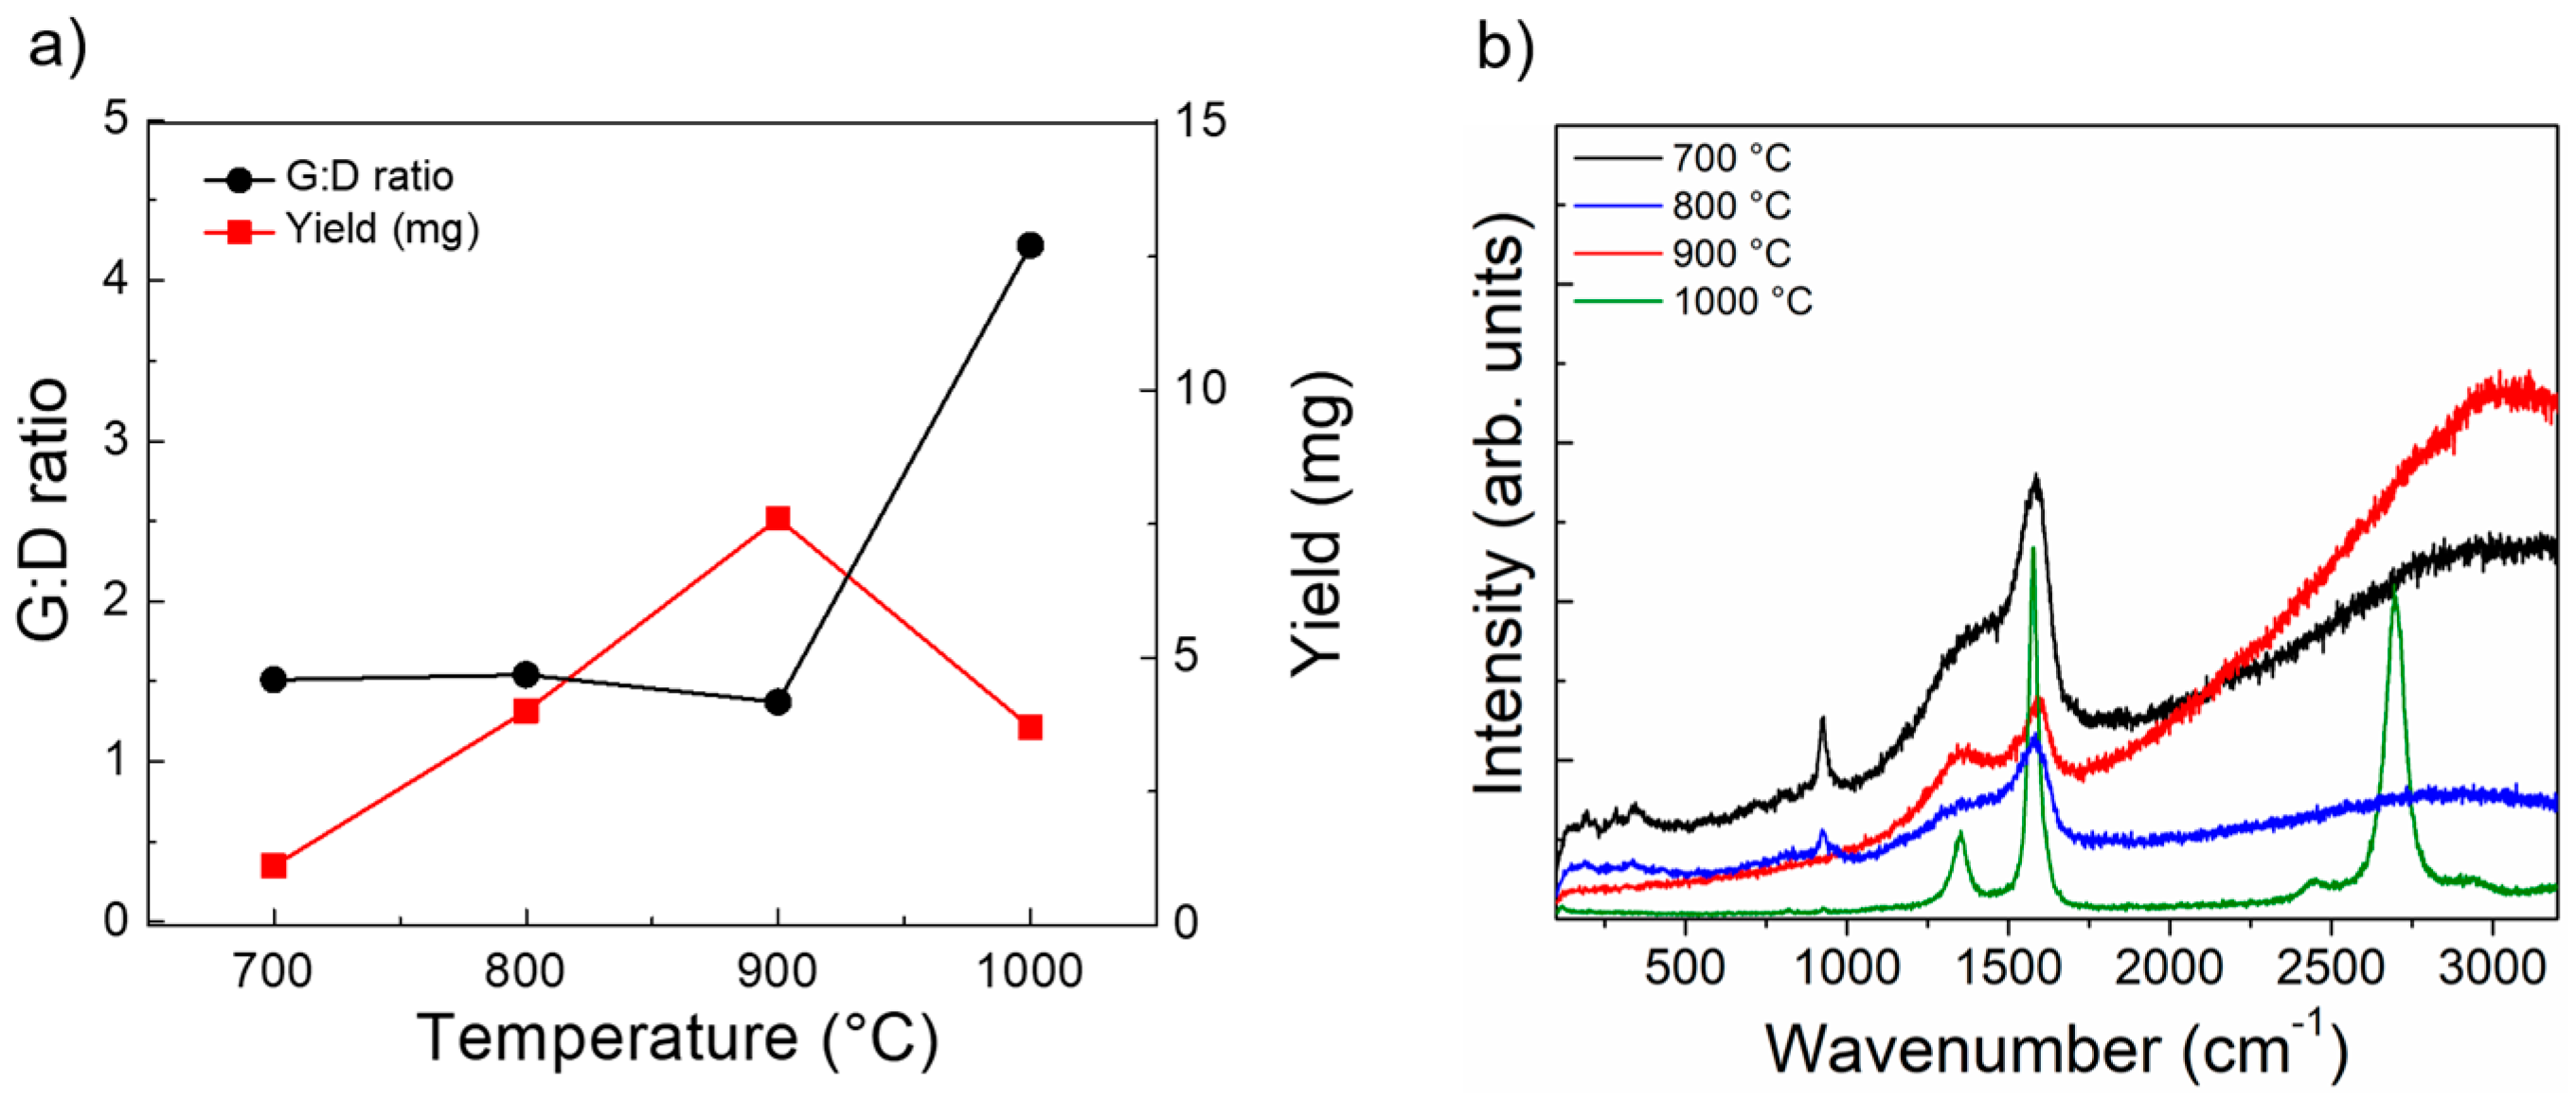
Growth temperature experiments were performed by varying the reaction temperature in the 2nd zone (growth zone, see Figure 1) of the furnace using an aspiration temperature of 225 °C, an injection rate of 1 mL/h, a 1.25 wt.% catalyst concentration, and EtOH as a carbon source (Table 2). The experimental results for variable growth temperature are shown in Figure 5. The Raman G:D ratio shows little variance in the 700–900 °C growth temperature range, but at a growth temperature of 1000 °C the G:D ratio increases ~3× (4.22) as compared to that observed for growth at 900 °C (1.37). The increase in growth temperature appears to provide a more favorable growth environment for carbon nanotubes. This transition in CNT growth at temperatures >900 °C agrees with prior work using FeMoC [16,17,23,24,44], suggesting that FeMoC has a temperature dependent activation mechanism for CNT growth [26]. Product yield for the growth temperature experiments is shown to increase when the growth temperature is increased from 700 °C to 900 °C. This is followed by a decrease in product yield when increasing the growth temperature to 1000 °C. This growth temperature relationship with product yield likely arises from the temperature dependent behavior of the kinetics of hydrocarbon decomposition.
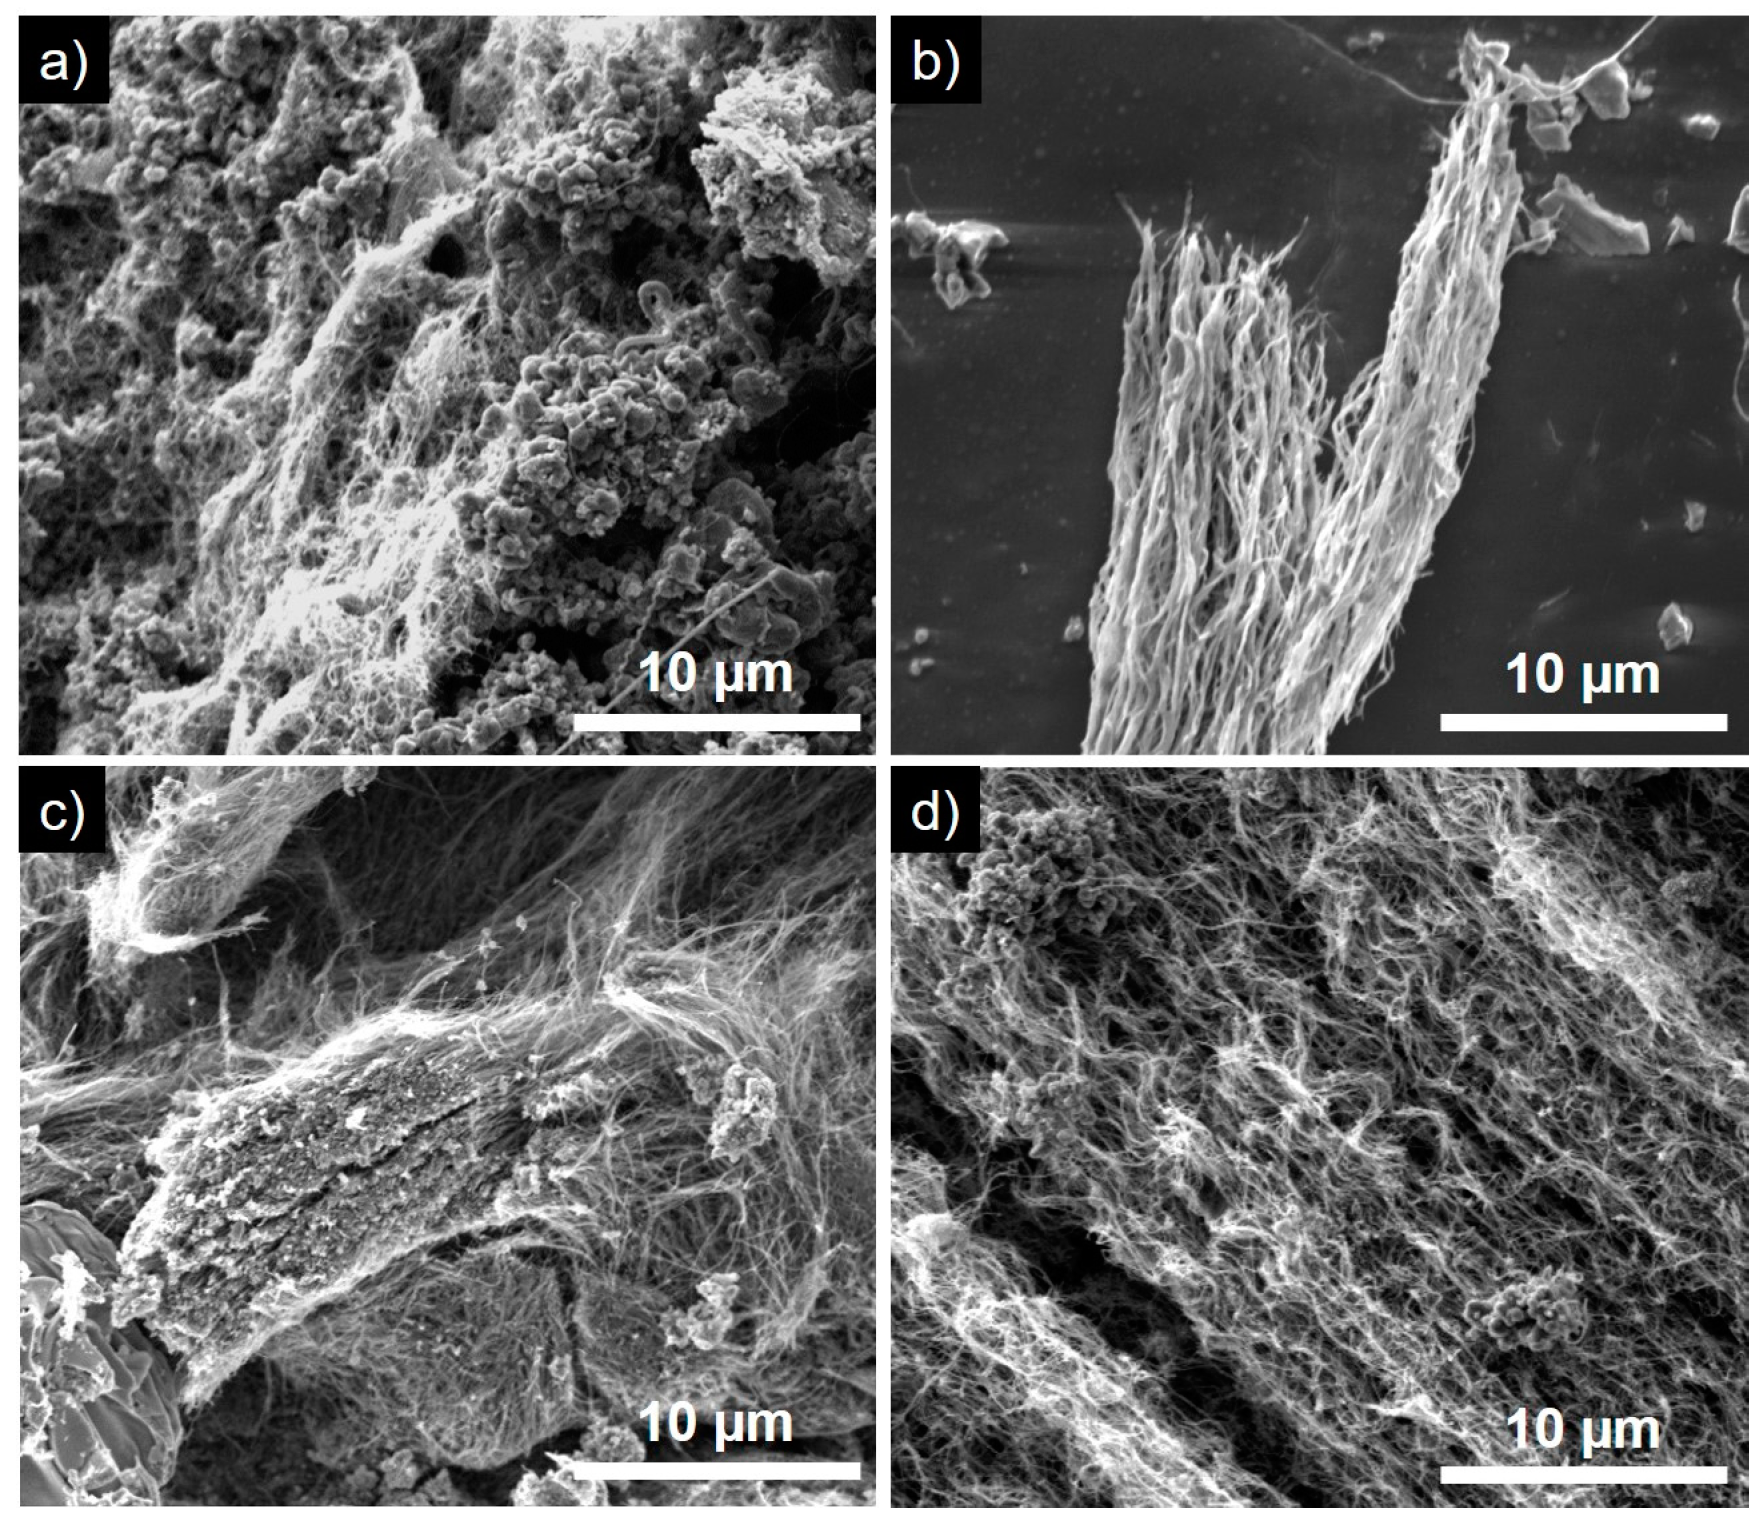
The SEM images for the growth temperature experiments are shown in Figure 6. At a growth temperature of 700 °C (Figure 6a), SEM imaging reveals the presence of CNTs decorated on the surfaces of large agglomerations. At growth temperatures of 800 °C and 900 °C SEM show long CNT bundles further corroborating the Raman characterization. The synthesized product at 1000 °C appears to be dominated by CNTs in agreement with the favorable Raman spectroscopy measurements.
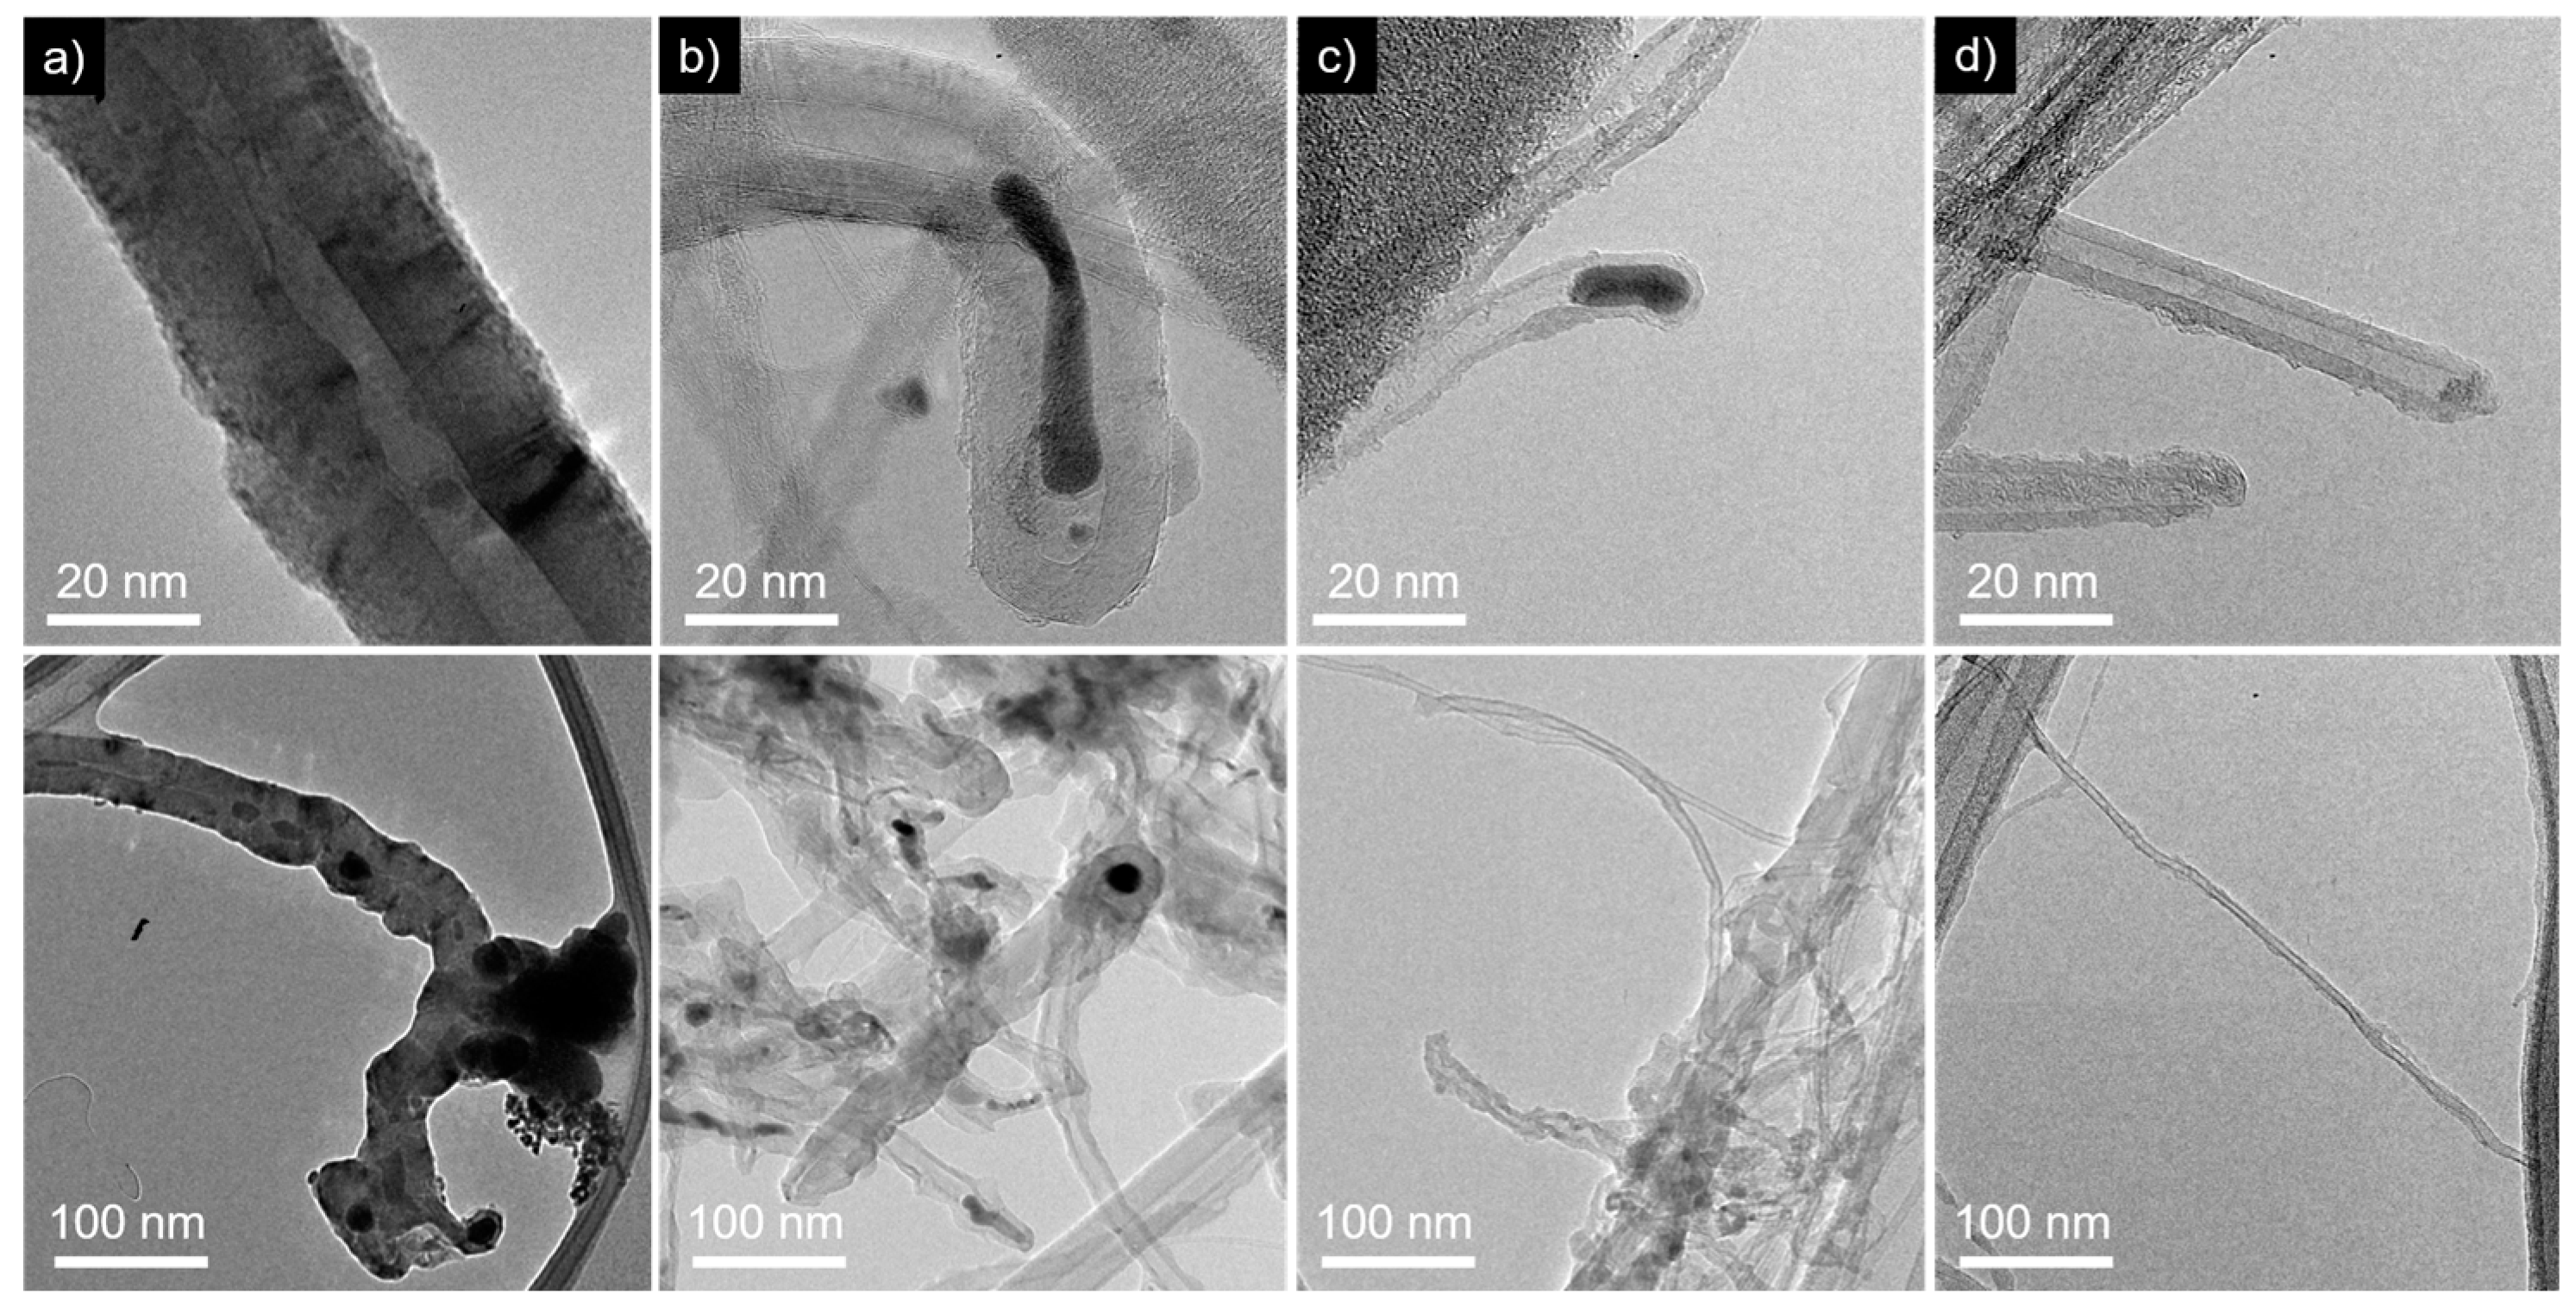
The TEM images at two magnifications for the growth temperature experiments are shown in Figure 7. At a 700 °C growth temperature (Figure 7a), TEM imaging reveals the presence of MWCNTs, with an average diameter of 51 nm and agglomerations of catalyst and carbon residue. The curly and tangled MWCNT morphology makes the reporting lengths and subsequent aspect ratios difficult. Therefore, only the average diameter is reported here. At an 800 °C growth temperature (Figure 7b), TEM images display tangled MWCNTs with an average diameter of 27 nm. TEM imaging at a 900 °C growth temperature reveals MWCNTs with an average diameter of 9 nm. At a 1000 °C growth temperature, MWCNT are observed with a distinctly less curly morphology and an average diameter of 8 nm. The TEM observations display a decreasing CNT diameter trend with an increasing growth temperature.
Further characterization of the growth temperature experiments was carried out using thermogravimetric analysis (TGA), as seen in Figure 8. The TGA results show that the residual weight decreases with increasing temperature, suggesting that increased growth temperatures improve CNT product purity. The weight loss onset for 700, 800, and 900 °C growth temperature experiments begins at ~300 °C accompanied by varying slopes of weight loss. The increasing rate loss slope with increasing growth temperature suggests that less carbon impurities are present in the CNT product at higher growth temperatures, which is in agreement with the TEM observations. At the highest growth temperature, 1000 °C, the TGA results show a weight loss onset temperature at ~500 °C with the sharpest rate loss slope and least residual weight (22.5%), indicating the highest purity and quality CNT product, in agreement with both the TEM and Raman characterization.
3.5. Variation of Injection Rate
The injection rate of the solution into the carrier gas will alter both the C:H ratio and the catalyst:H ratio. A high catalyst:H ratio may result in incomplete reduction of the pro-catalyst. Additionally, a high C:H ratio may result in a decreased product yield via catalyst deactivation by encapsulation of catalytically active sites [45]. Prior work has shown that the C:H ratio in the growth zone has significant effects on the growth rate of CNTs [30,46]. Furthermore, our research has previously shown for the DLICVD system that increased injection rates using ferrocene in toluene resulted in lower yields of CNTs [31]. This is consistent with lower growth rates that are expected for higher C:H ratios.
Injection rate experiments were performed by varying the injection rate of the FeMoC solution into the furnace using an aspiration temperature of 225 °C, a growth temperature of 1000 °C, a 1.25 wt.% catalyst concentration, and EtOH as a carbon source (Table 2). The Raman characterization and product yield results for injection rate experiments are shown in Figure 9. The Raman G:D ratio is shown to decrease with an increasing injection rate from a G:D ratio of 4.22 to 1.36 for injection rates of 1 and 5 mL/h, respectively. Using an injection rate of 10 mL/h, the Raman G:D ratio is shown to slightly increase from 1.36 to 1.58 for injection rates of 5 and 10 mL/h, respectively. The injection rate of the solution into the carrier gas influences both the catalyst:H ratio, and the C:H ratio. Thus, the results here suggest that reducing the C:H and the catalyst:H ratios provides a more favorable environment for producing quality CNTs. From Figure 9, we observe that the product yield increases with injection rate from 3.7 mg to 5.4 mg for 1 mL/h and 10 mL/h, respectively. This increased product yield is likely due to the increased quantity of both carbon source material and catalyst particles that are available in the system.
The SEM micrographs for variable injection rate experiments are shown in Figure 10. At a 1 mL/h injection rate, SEM reveals an abundance of CNTs (Figure 10a), as corroborated by the Raman characterization. Using an injection rate of 5 mL/h (Figure 10b), SEM micrographs show CNTs to a lesser degree in both quantity and quality. At a 10 mL/h injection rate (Figure 11c), even fewer CNTs are observed. Thus, SEM evidence shows that the quantity and quality of CNTs decreases with an increasing injection rate in agreement with the Raman characterization.
3.6. Variation of Catalyst Concentration
The catalyst concentration will determine both the catalyst:C and catalyst:H ratios that influence the resulting CNT morphology and product yield. If catalyst concentrations are too high, catalyst aggregation may result upon the evaporation of solvent from individual aspirated droplets, which in turn favors undesirable carbon structures, rather than the intended CNTs. However, if catalyst concentrations are too low, the CNT product yield may suffer due to limited catalyst site availability. Therefore, careful consideration of catalyst concentration is required for optimal performance.
To investigate the influence of catalyst concentration experiments were performed using an aspiration temperature of 225 °C, a growth temperature of 800 °C, a 1 mL/h injection rate, and EtOH as the carbon source (see Table 2) The Raman G:D ratio and product yield from catalyst concentration experiments are shown in Figure 11. At a catalyst concentration of 0.25 and 5.00 wt.%, no synthesized product was recovered, and thus, no Raman characterization could be conducted. However, at a catalyst concentration of 1.25 wt.%, ~4 mg of the synthesized product was recovered, with a corresponding Raman G:D ratio of 1.54. It would appear that further optimization would be beneficial to find the “Goldilocks” zone, i.e., an optimal region between two extremes advantageous to CNT growth [47].
3.7. Variation in Carbon Source
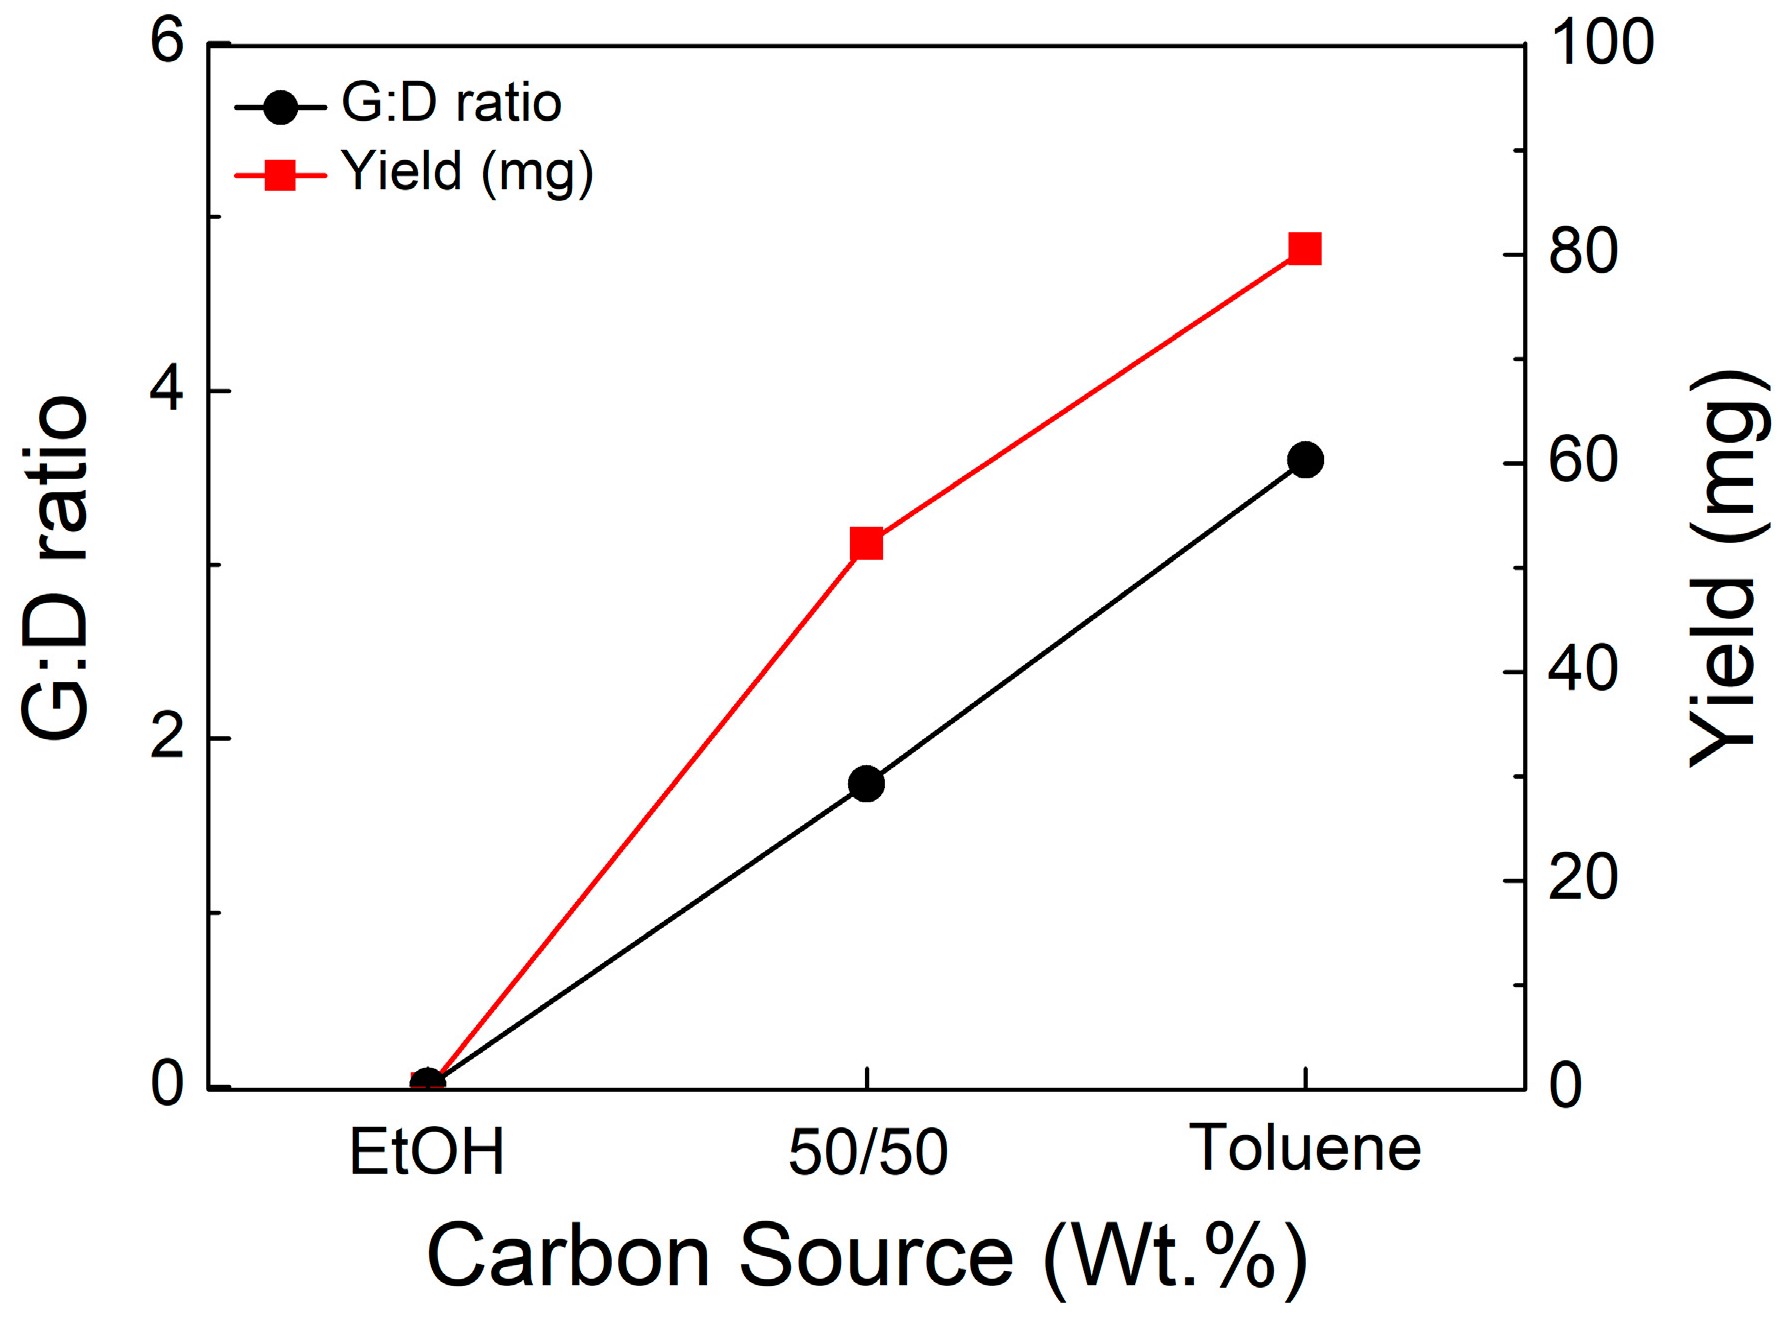
The choice of carbon source, hydrocarbons, or increasingly more common alcohols, can influence the nature of the CNT quality and product yield due to their varying decomposition products that determine CNT quality, morphology, and growth rate [48]. Furthermore, the choice of carbon source also impacts the relative C:H and the C:catalyst ratios that also influence CNT morphology and product yield. If carbon ratios are too low, then CNT product yield may suffer; if carbon ratios are too high, the catalyst may be “deactivated” via catalyst encapsulation. Therefore, carbon source selection is vital to optimizing CNT production.
To elucidate the effects of carbon source, experiments were conducted using an aspiration temperature of 225 °C, a growth temperature of 800 °C, an injection rate of 1 mL/h, a 5.00 wt.% catalyst concentration, using varying degrees of toluene in EtOH as the carbon source. The Raman G:D ratio and product yield for the carbon source experiments are shown in Figure 12. Using only EtOH as the carbon source resulted in no product yield under the conditions that were employed (Table 2). Using a carbon source consisting of EtOH and toluene (1:1 wt.%) resulted in 52.3 mg product yield with a corresponding Raman G:D ratio of 1.74. Further improvements were obtained when using 100% toluene as the carbon source, resulting in a product yield of 80.5 mg and a Raman G:D ratio of 3.6. The carbon source is known to influence the nature of synthesized product due to the varying hydrocarbon decomposition species.
Toluene thermally decomposes by either fission of the C-H bond in the methyl group (Equation (1)) or by cleavage of the C-C bond connecting the methyl and phenyl groups (Equation (2)) [49,50]. The benzyl radical formation (Equation (1)) dominates under the CVD conditions that are employed here; therefore, the subsequent decomposition is outlined in Equations (3) and (4) [49].
C6H5CH3 → C6H5CH2 + H
C6H5CH3 → C6H5 + CH3
C6H5CH2 → C3H3 + C4H4
C6H5CH2 → C5H5 + C2H2
EtOH is known to decompose by either the dehydration reaction seen in Equation (5) or by cleavage of the C-C bond connecting the methyl group and the methylene group as seen in Equation (6) [51,52]. The dehydration reaction (Equation (5)) dominates under the conditions that are employed here [52].
CH3CH2OH → C2H4 + H2O
CH3CH2OH → CH3 + CH2OH
The thermal decomposition of carbon sources EtOH and toluene result in the formation of Cx (x = 2–5) species that are then subsequently used in the growth of carbon nanotubes. These Cx species differ in metal/support adsorption energies that dictate (1) carbon association with the catalyst nanoparticle, (2) nanotube quality, and (3) nanotube chirality and growth rate [53]. Therefore, the CNT growth results observed here are likely a result of the complicated interplay between the thermal decomposition species and the FeMoC catalyst. In addition, CNT quality and yield are influenced by the presence of oxygen containing species, such as EtOH and H2O. Oxygen containing species are known to etch carbon materials under CNT growth conditions [54,55,56]. This may possibly explain the decrease in quality and product yield observed with increasing EtOH content.
4. Conclusions
We have evaluated the conditions used in scaling up FeMoC synthesis into the gram scale, and investigated the CCVD conditions employed in CNT growth. The synthesis conditions; pH environment, air sensitivity, and relative molar ratios of reactants were evaluated. The results reveal that the successful scale-up of FeMoC is sensitive to both the presence of air, and the pH environment. Soxhlet purification in air led to degradation. Additionally, experimental results suggest that successful FeMoC synthesis requires a favorable pH environment (~0.5–2.0); likely to maintain the desirable ratios of MoVI and MoV centers required to form the Keplerate cage [34].
Subsequently, DLICVD was used to grow CNTs using FeMoC. The CCVD conditions: aspiration temperature, growth temperature, injection rate, catalyst concentration, and carbon source, were investigated. Increasing aspiration temperature was found to enhance product yield with a negligible influence on CNT quality (as determined by Raman spectroscopy G:D ratio values). The growth temperature was found to have a pronounced influence over CNT product yield and quality. The product yield was found to increase from 700 to 900 °C, followed by a slight decrease at 1000 °C. Notably, a ~3-fold increase in CNT quality was observed from 900 to 1000 °C. This is interesting to note, given that prior work with FeMoC demonstrated poor catalytic performance at growth temperatures below 900 °C [16,17,23,24]. The results herein, and from prior work, suggest that FeMoC has a temperature dependent “activation” mechanism for the catalytic growth of CNTs. The increase in injection rates resulted in a slight increase in product yield from 3.7 mg to 5.4 mg at the expense of CNT quality with Raman G:D ratio values of 4.2 to 1.58, respectively. The catalyst concentration results demonstrated that concentration either too low or too high will fail to produce CNTs, suggesting that optimized catalyst concentrations are required for CNT growth. The carbon source experiments reveal that both product yield and CNT quality were improved with increasing addition of toluene (wt.%) in EtOH, indicating that toluene is a more favorable carbon source under the CCVD conditions employed.
Supplementary Materials
Supplementary materials can be found at https://www.mdpi.com/2311-5629/4/1/17/s1. Figure S1: The Raman spectra (514.5 nm) for CNT samples grown using FeMoC as a catalyst.
Acknowledgments
Financial support for this work is provided by the Robert A. Welch Foundation (C-0002), the NSF IRISE training program at Rice University (NSF EHR-0966303), and the Welsh Government Sêr Cymru Programme.
Author Contributions
Gibran L. Esquenazi performed all the experiments and UV-vis, Raman spectroscopy, FT-IR, SEM, and TGA characterization. Bruce Brinson performed the TEM characterization. Andrew R. Barron provided guidance to experiments. Both authors contributed to writing the manuscript.
Conflicts of Interest
The authors declare no conflict of interest.
References
- De Volder, M.F.; Tawfick, S.H.; Baughman, R.H.; Hart, A.J. Carbon nanotubes: Present and future commercial applications. Science 2013, 339, 535–539. [Google Scholar] [CrossRef] [PubMed]
- Ameli, A.; Arjmand, M.; Sundararaj, U. Effects of synthesis catalyst and temperature on broadband dielectric properties of nitrogen-doped carbon nanotube/polyvinylidene fluoride nanocomposites. Carbon 2016, 106, 260–278. [Google Scholar] [CrossRef]
- Arjmand, M.; Ameli, A.; Sundararaj, U. Employing nitrogen doping as innovative technique to improve broadband dielectric properties of carbon nanotube/polymer nanocomposites. Macromol. Mater. Eng. 2016, 301, 555–565. [Google Scholar] [CrossRef]
- Pawar, S.P.; Arjmand, M.; Gandi, M.; Bose, S.; Sundararaj, U. Critical insights in understanding effects of synthesis temperature and nitrogen doping towards charge storage capability and microwave shielding in nitrogen-doped carbon nanotube/polymer nanocomposites. RSC Adv. 2016, 6, 63224–63234. [Google Scholar] [CrossRef]
- McEuen, P.L.; Fuhrer, M.S.; Park, H. Single walled carbon nanotube electronics. IEEE Trans. Nanotechnol. 2002, 1, 78–85. [Google Scholar] [CrossRef]
- Liu, X.M.; Huang, Z.D.; Oh, S.W.; Zhang, B.; Ma, P.C.; Yuen, M.M.F.; Kim, J.K. Carbon nanotube (CNT)-based composites as electrode material for rechargeable Li-ion batteries: A review. Compos. Sci. Technol. 2012, 72, 121–144. [Google Scholar] [CrossRef]
- Cheung, C.L.; Kurtz, A.; Park, H.; Lieber, C.M. Diameter-controlled synthesis of carbon nanotubes. J. Phys. Chem. B 2002, 106, 2429–2433. [Google Scholar] [CrossRef]
- Orbaek, A.W.; Owens, A.C.; Crouse, C.C.; Pint, C.L.; Hauge, R.H.; Barron, A.R. Single walled carbon nanotube growth and chirality dependence on catalyst composition. Nanoscale 2013, 5, 9848–9859. [Google Scholar] [CrossRef] [PubMed]
- Nasibulin, A.G.; Pikhitsa, P.V.; Jiang, H.; Kauppinen, E.I. Correlation between catalyst particle and single-walled carbon nanotube diameters. Carbon 2005, 43, 2251–2257. [Google Scholar] [CrossRef]
- Schäffel, F.; Rümmeli, M.H.; Kramberger, C.; Queitsch, U.; Mohn, E.; Kaltofen, R.; Pichler, T.; Büchner, B.; Rellinghaus, B.; Schultz, L. Tailoring the diameter, density and number of walls of carbon nanotubes through predefined catalyst particles. Phys. Status Solidi A 2008, 205, 1382–1385. [Google Scholar] [CrossRef]
- Fiawoo, M.-F.C.; Bonnot, A.M.; Amara, H.; Bichara, C.; Thibault-Pénisson, J.; Loiseau, A. Evidence of correlation between catalyst particles and the single-wall carbon nanotube diameter: A first step towards chirality control. Phys. Rev. Lett. 2012, 108, 195503. [Google Scholar] [CrossRef] [PubMed]
- Wang, X.; Li, Q.; Xie, J.; Jin, Z.; Wang, J.; Li, Y.; Jiang, K.; Fan, S. Fabrication of ultralong and electrically uniform single-walled carbon nanotubes on clean substrates. Nano Lett. 2009, 9, 3137–3141. [Google Scholar] [CrossRef] [PubMed]
- Kang, L.; Hu, Y.; Zhong, H.; Si, J.; Zhang, S.; Zhao, Q.; Lin, J.; Li, Q.; Zhang, Z.; Peng, L.; et al. Large-area growth of ultra-high-density single-walled carbon nanotube arrays on sapphire surface. Nano Res. 2015, 8, 3694–3703. [Google Scholar] [CrossRef]
- Youn, S.K.; Park, H.G. Morphological evolution of Fe–Mo bimetallic catalysts for diameter and density modulation of vertically aligned carbon nanotubes. J. Phys. Chem. C 2013, 117, 18657–18665. [Google Scholar] [CrossRef]
- Harutyunyan, A.R.; Pradhan, B.K.; Kim, U.J.; Chen, G.; Eklund, P.C. CVD synthesis of single wall carbon nanotubes under “soft” conditions. Nano Lett. 2002, 2, 525–530. [Google Scholar] [CrossRef]
- An, L.; Owens, J.M.; McNeil, L.E.; Liu, J. Synthesis of nearly uniform single-walled carbon nanotubes using identical metal-containing molecular nanoclusters as catalysts. J. Am. Chem. Soc. 2002, 124, 13688–13689. [Google Scholar] [CrossRef] [PubMed]
- Anderson, R.E.; Colorado, R., Jr.; Crouse, C.; Ogrin, D.; Maruyama, B.; Pender, M.J.; Edwards, C.L.; Whitsitt, E.; Moore, V.C.; Koveal, D.; et al. A study of the formation, purification and application as a SWNT growth catalyst of the nanocluster [HxPMo12O40⊂H4Mo72Fe30(O2CMe)15O254(H2O)98]. Dalton Trans. 2006, 3097–3107. [Google Scholar] [CrossRef] [PubMed]
- Ding, F.; Rosén, A.; Bolton, K. Molecular dynamics study of the catalyst particle size dependence on carbon nanotube growth. J. Chem. Phys. 2004, 121, 2775–2779. [Google Scholar] [CrossRef] [PubMed]
- Cassell, A.M.; Raymakers, J.A.; Kong, J.; Dai, H. Large scale CVD synthesis of single-walled carbon nanotubes. J. Phys. Chem. B 1999, 103, 6484–6492. [Google Scholar] [CrossRef]
- Lamouroux, E.; Serp, P.; Kihn, Y.; Kalck, P. Identification of key parameters for the selective growth of single or double wall carbon nanotubes on FeMo/Al2O3 CVD catalysts. Appl. Catal. Gen. 2007, 323, 162–173. [Google Scholar] [CrossRef]
- Zhang, S.; Tong, L.; Hu, Y.; Kang, L.; Zhang, J. Diameter-specific growth of semiconducting SWNT arrays using uniform Mo2C solid catalyst. J. Am. Chem. Soc. 2015, 137, 8904–8907. [Google Scholar] [CrossRef] [PubMed]
- Harutyunyan, A.R.; Mora, E.; Tokune, T.; Bolton, K.; Rosén, A.; Jiang, A.; Awasthi, N.; Curtarolo, S. Hidden features of the catalyst nanoparticles favorable for single-walled carbon nanotube growth. Appl. Phys. Lett. 2007, 90, 163120. [Google Scholar] [CrossRef]
- Edgar, K.; Spencer, J.L. The synthesis of carbon nanotubes from Müller clusters. Curr. Appl. Phys. 2006, 6, 419–421. [Google Scholar] [CrossRef]
- Goss, K.; Kamra, A.; Spudat, C.; Meyer, C.; Kögerler, P.; Schneider, C.M. CVD growth of carbon nanotubes using molecular nanoclusters as catalyst. Phys. Status Solidi B 2009, 246, 2494–2497. [Google Scholar] [CrossRef]
- Esquenazi, G.L.; Barron, A.R. Reduction kinetics of the nanocluster [HxPMo12O40⊂H4Mo72Fe30(O2CMe)15O254(H2O)98-y (EtOH)y]. J. Clust. Sci. 2018, 29, 325–335. [Google Scholar] [CrossRef]
- Esquenazi, G.L.; Barron, A.R. Understanding the “activation” of the nanocluster [HxPMo12O40⊂H4Mo72Fe30(O2CMe)15O254(H2O)98-y (H2O)y] for low temperature growth of carbon nanotubes. J. Clust. Sci. 2018, in press. [Google Scholar] [CrossRef]
- Lee, C.J.; Park, J.; Huh, Y.; Lee, J.Y. Temperature effect on the growth of carbon nanotubes using thermal chemical vapor deposition. Chem. Phys. Lett. 2001, 343, 33–38. [Google Scholar] [CrossRef]
- Emmenegger, C.; Bonard, J.-M.; Mauron, P.; Sudan, P.; Lepora, A.; Grobety, B.; Züttel, A.; Schlapbach, L. Synthesis of carbon nanotubes over Fe catalyst on aluminium and suggested growth mechanism. Carbon 2003, 41, 539–547. [Google Scholar] [CrossRef]
- Young Lee, T.; Han, J.-H.; Hong Choi, S.; Yoo, J.-B.; Park, C.-Y.; Jung, T.; Yu, S.; Yi, W.K.; Han, I.T.; Kim, J.M. Effects of source gases on the growth of carbon nanotubes. Diam. Relat. Mater. 2003, 12, 851–855. [Google Scholar] [CrossRef]
- Orbaek, A.W.; Owens, A.C.; Barron, A.R. Increasing the efficiency of single walled carbon nanotube amplification by Fe–Co catalysts through the optimization of CH4/H2 partial pressures. Nano Lett. 2011, 11, 2871–2874. [Google Scholar] [CrossRef] [PubMed]
- Orbaek, A.W.; Aggarwal, N.; Barron, A.R. The development of a ‘process map’ for the growth of carbon nanomaterials from ferrocene by injection CVD. J. Mater. Chem. A 2013, 1, 14122–14132. [Google Scholar] [CrossRef]
- Müller, A.; Das, S.K.; Kögerler, P.; Bögge, H.; Schmidtmann, M.; Trautwein, A.X.; Schünemann, V.; Krickemeyer, E.; Preetz, W. A new type of supramolecular compound: Molybdenum-oxide-based composites consisting of magnetic nanocapsules with encapsulated keggin-ion electron reservoirs cross-linked to a two-dimensional network. Angew. Chem. Int. Ed. 2000, 39, 3413–3417. [Google Scholar] [CrossRef]
- Mekala, R.; Supriya, S.; Das, S.K. Fate of a giant {Mo72Fe30}-type polyoxometalate cluster in an aqueous solution at higher temperature: Understanding related keplerate chemistry, from molecule to material. Inorg. Chem. 2013, 52, 9708–9710. [Google Scholar] [CrossRef] [PubMed]
- Yin, P.; Wu, B.; Mamontov, E.; Daemen, L.L.; Cheng, Y.; Li, T.; Seifert, S.; Hong, K.; Bonnesen, P.V.; Keum, J.K.; Ramirez-Cuesta, A.J. X-ray and neutron scattering study of the formation of core–shell-type polyoxometalates. J. Am. Chem. Soc. 2016, 138, 2638–2643. [Google Scholar] [CrossRef] [PubMed]
- Camacho-López, M.A.; Escobar-Alarcón, L.; Picquart, M.; Arroyo, R.; Córdoba, G.; Haro-Poniatowski, E. Micro-Raman study of the m-MoO2 to α-MoO3 transformation induced by cw-laser irradiation. Opt. Mater. 2011, 33, 480–484. [Google Scholar] [CrossRef]
- Müller, A.; Krickemeyer, E.; Das, S.K.; Kögerler, P.; Sarkar, S.; Bögge, H.; Schmidtmann, M.; Sarkar, S. Linking icosahedral, strong molecular magnets {Mo} to layers—A solid-state reaction at room temperature. Angew. Chem. Int. Ed. 2000, 39, 1612–1614. [Google Scholar] [CrossRef]
- Dresselhaus, M.S.; Dresselhaus, G.; Saito, R.; Jorio, A. Raman spectroscopy of carbon nanotubes. Phys. Rep. 2005, 409, 47–99. [Google Scholar] [CrossRef]
- Ferrari, A.C.; Basko, D.M. Raman spectroscopy as a versatile tool for studying the properties of graphene. Nat. Nanotechnol. 2013, 8, 235–246. [Google Scholar] [CrossRef] [PubMed]
- Plata, D.L.; Meshot, E.R.; Reddy, C.M.; Hart, A.J.; Gschwend, P.M. Multiple alkynes react with ethylene to enhance carbon nanotube synthesis, suggesting a polymerization-like formation mechanism. ACS Nano 2010, 4, 7185–7192. [Google Scholar] [CrossRef] [PubMed]
- Nessim, G.D.; Seita, M.; Plata, D.L.; O’Brien, K.P.; Hart, A.J.; Meshot, E.R.; Reddy, C.M.; Gschwend, P.M.; Thompson, C.V. Precursor gas chemistry determines the crystallinity of carbon nanotubes synthesized at low temperature. Carbon 2011, 49, 804–810. [Google Scholar] [CrossRef]
- Bandow, S.; Asaka, S.; Saito, Y.; Rao, A.M.; Grigorian, L.; Richter, E.; Eklund, P.C. Effect of the growth temperature on the diameter distribution and chirality of single-wall carbon nanotubes. Phys. Rev. Lett. 1998, 80, 3779–3782. [Google Scholar] [CrossRef]
- Jourdain, V.; Bichara, C. Current understanding of the growth of carbon nanotubes in catalytic chemical vapour deposition. Carbon 2013, 58, 2–39. [Google Scholar] [CrossRef] [Green Version]
- Kumar, M.; Ando, Y. Chemical vapor deposition of carbon nanotubes: A review on growth mechanism and mass production. J. Nanosci. Nanotechnol. 2010, 10, 3739–3758. [Google Scholar] [CrossRef] [PubMed]
- Peng, F.; Luo, D.; Sun, H.; Wang, J.; Yang, F.; Li, R.; Yang, J.; Li, Y. Diameter-controlled growth of aligned single-walled carbon nanotubes on quartz using molecular nanoclusters as catalyst precursors. Chin. Sci. Bull. 2013, 58, 433–439. [Google Scholar] [CrossRef]
- Kuwana, K.; Endo, H.; Saito, K.; Qian, D.; Andrews, R.; Grulke, E.A. Catalyst deactivation in CVD synthesis of carbon nanotubes. Carbon 2005, 43, 253–260. [Google Scholar] [CrossRef]
- Orbaek, A.W.; Barron, A.R. Towards a ‘catalyst activity map’ regarding the nucleation and growth of single walled carbon nanotubes. J. Exp. Nanosci. 2015, 10, 66–76. [Google Scholar] [CrossRef]
- Obrey, S.J.; Bott, S.G.; Barron, A.R. A Lewis base promoted alkyl/alkoxide ligand redistribution: Reaction of [Me2Al(μ-OCPh3)]2 with THF. Organometallics 2001, 20, 5119–5124. [Google Scholar] [CrossRef]
- Gomez-Ballesteros, J.L.; Burgos, J.C.; Lin, P.A.; Sharma, R.; Balbuena, P.B. Nanocatalyst shape and composition during nucleation of single-walled carbon nanotubes. RSC Adv. 2015, 5, 106377–106386. [Google Scholar] [CrossRef] [PubMed]
- Brouwer, L.D.; Mueller-Markgraf, W.; Troe, J. Thermal decomposition of toluene: A comparison of thermal and laser-photochemical activation experiments. J. Phys. Chem. 1988, 92, 4905–4914. [Google Scholar] [CrossRef]
- Eng, R.A.; Gebert, A.; Goos, E.; Hippler, H.; Kachiani, C. Incubation times, fall-off and branching ratios in the thermal decomposition of toluene: Experiments and theory. Phys. Chem. Chem. Phys. 2002, 4, 3989–3996. [Google Scholar] [CrossRef]
- Li, J.; Kazakov, A.; Dryer, F.L. Experimental and numerical studies of ethanol decomposition reactions. J. Phys. Chem. A 2004, 108, 7671–7680. [Google Scholar] [CrossRef]
- Park, J.; Zhu, R.S.; Lin, M.C. Thermal decomposition of ethanol. I. ab Initio molecular orbital/Rice–Ramsperger–Kassel–Marcus prediction of rate constant and product branching ratios. J. Chem. Phys. 2002, 117, 3224–3231. [Google Scholar] [CrossRef]
- Gómez-Gualdrón, D.A.; Beetge, J.M.; Burgos, J.C.; Balbuena, P.B. Effects of precursor type on the CVD growth of single-walled carbon nanotubes. J. Phys. Chem. C 2013, 117, 10397–10409. [Google Scholar] [CrossRef]
- Zhang, G.; Mann, D.; Zhang, L.; Javey, A.; Li, Y.; Yenilmez, E.; Wang, Q.; McVittie, J.P.; Nishi, Y.; Gibbons, J.; et al. Ultra-high-yield growth of vertical single-walled carbon nanotubes: Hidden roles of hydrogen and oxygen. Proc. Natl. Acad. Sci. USA 2005, 102, 16141–16145. [Google Scholar] [CrossRef] [PubMed]
- Li, J.; Ke, C.T.; Liu, K.; Li, P.; Liang, S.; Finkelstein, G.; Wang, F.; Liu, J. Importance of diameter control on selective synthesis of semiconducting single-walled carbon nanotubes. ACS Nano 2014, 8, 8564–8572. [Google Scholar] [CrossRef] [PubMed]
- Moon, C.Y.; Kim, Y.S.; Lee, E.C.; Jin, Y.G.; Chang, K.J. Mechanism for oxidative etching in carbon nanotubes. Phys. Rev. B 2002, 65, 155401. [Google Scholar] [CrossRef]
Figure 1.
Schematic of the direct liquid injection chemical vapor deposition furnace.
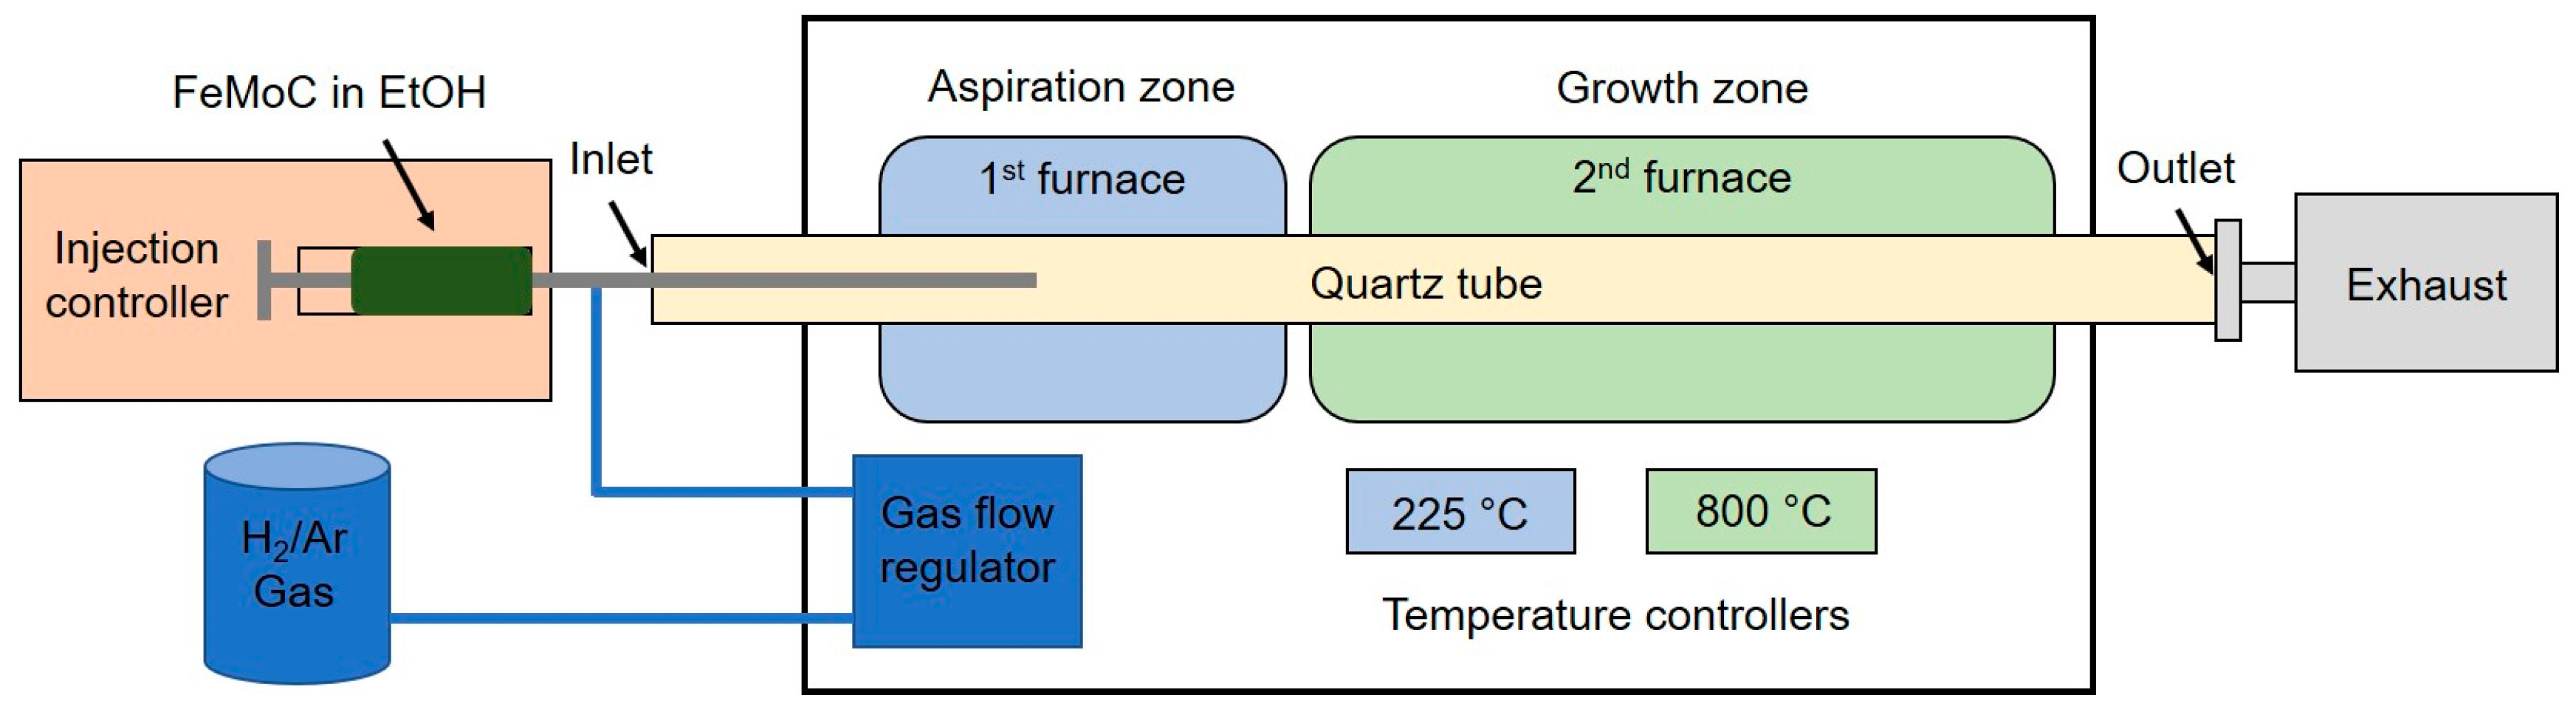
Figure 2.
UV-visible spectroscopy characterization of synthesized products diluted in EtOH for experiments 1–8 (a–h). The corresponding peaks are labeled if applicable.
Figure 2.
UV-visible spectroscopy characterization of synthesized products diluted in EtOH for experiments 1–8 (a–h). The corresponding peaks are labeled if applicable.
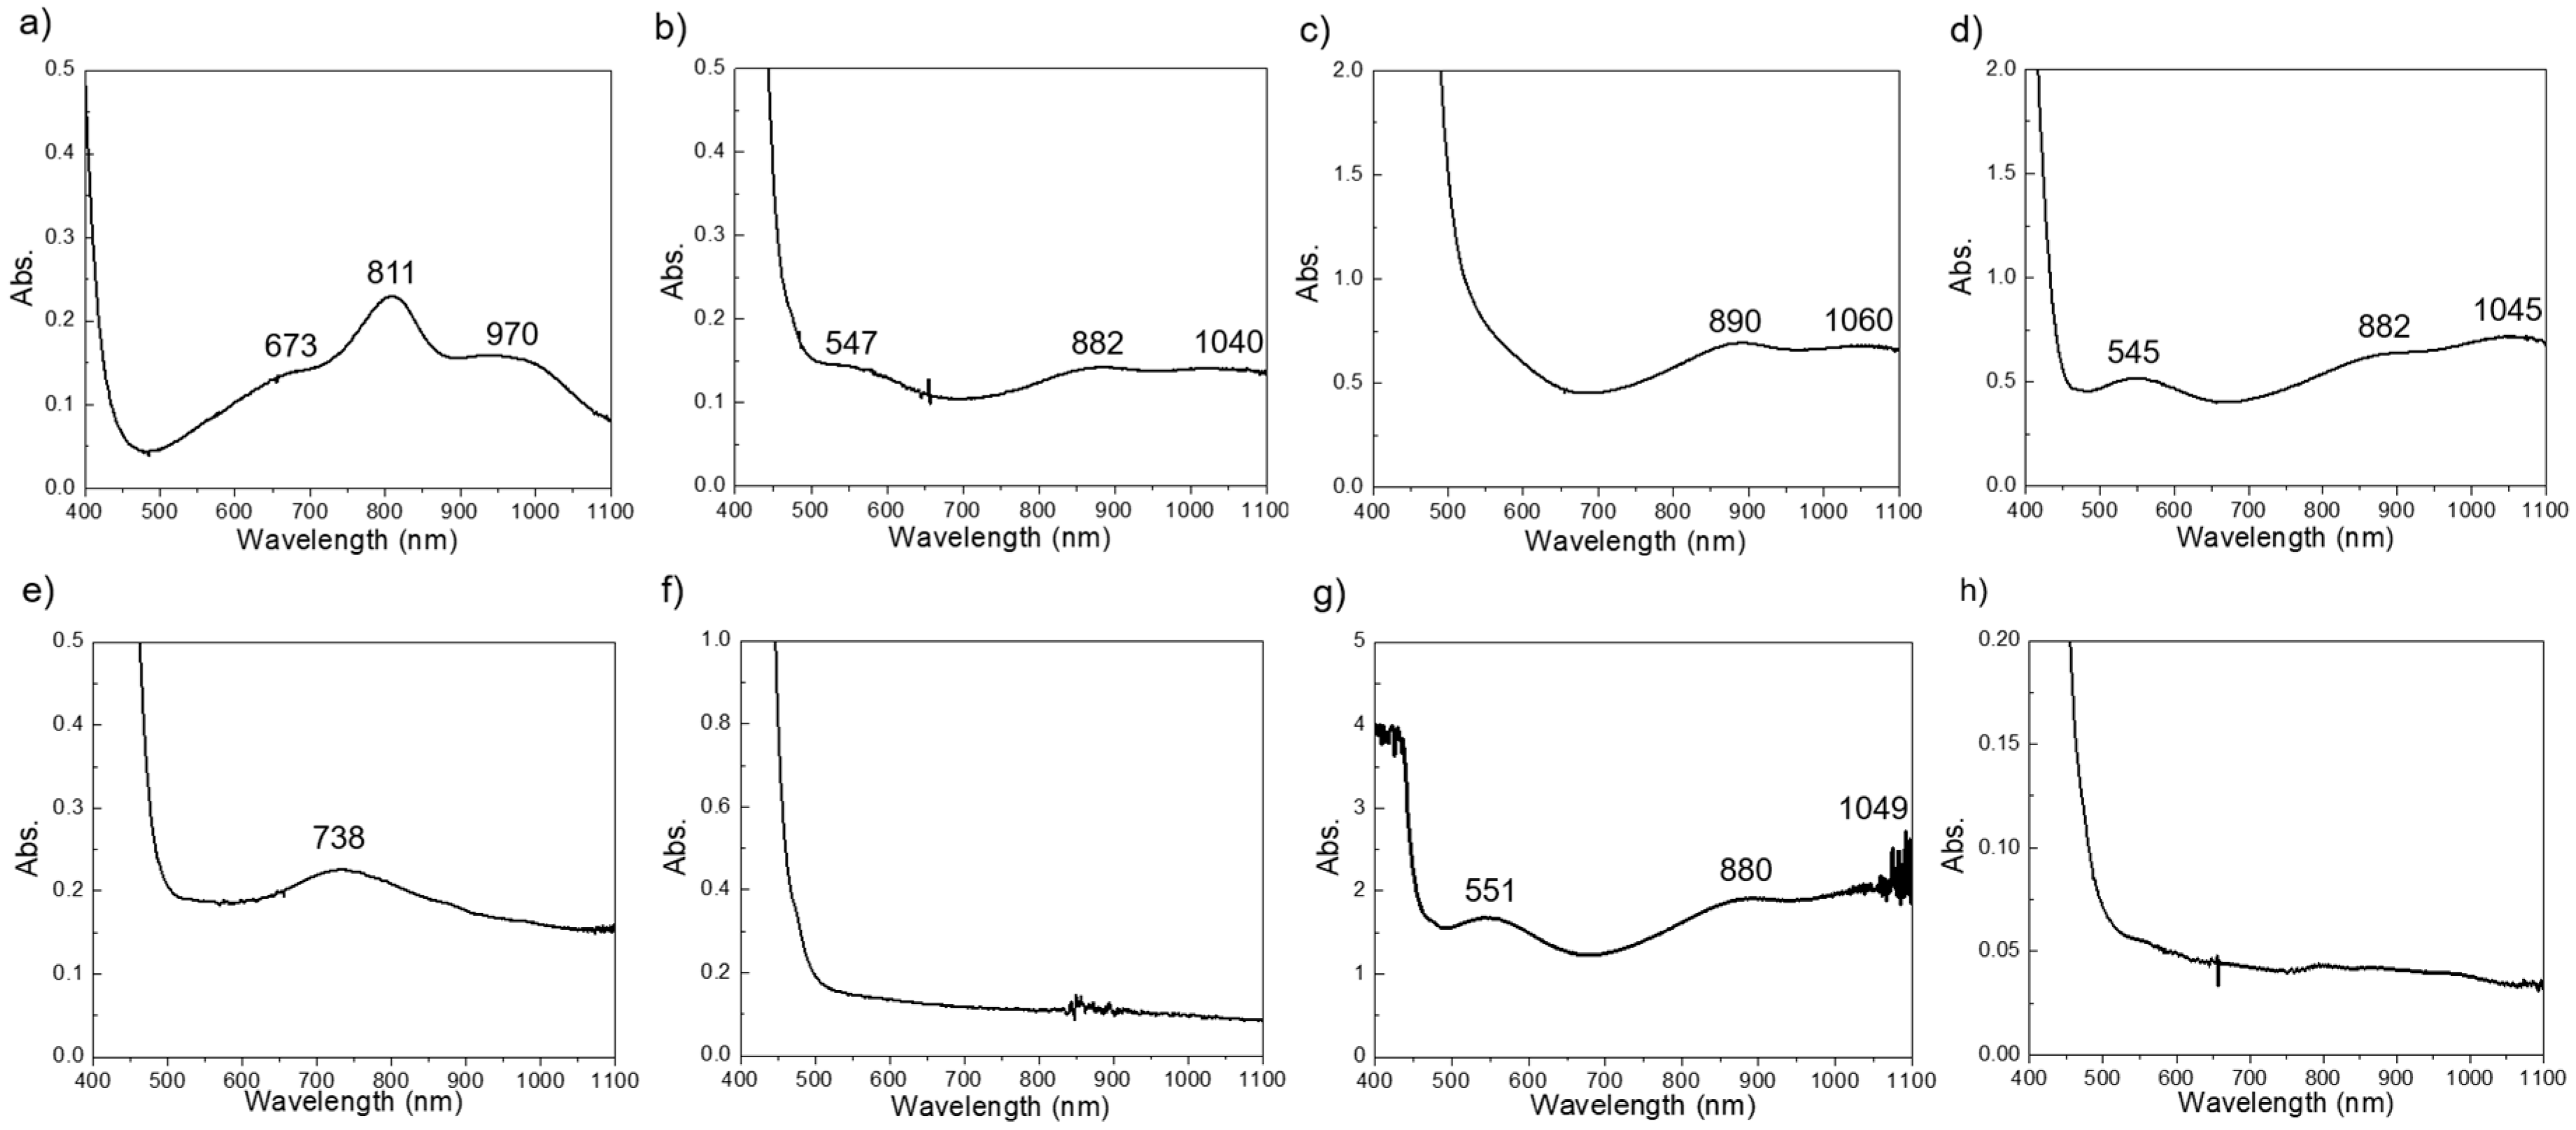
Figure 3.
Plot of the Raman G:D ratio (black) and product yield (red) for DLICVD experiments with variable aspiration temperature (a) with the corresponding Raman spectra (b). Experiments were performed with a reaction temperature of 800 °C, a 1 mL/h injection rate, a 1.25 wt.% catalyst concentration, using EtOH as a carbon source.
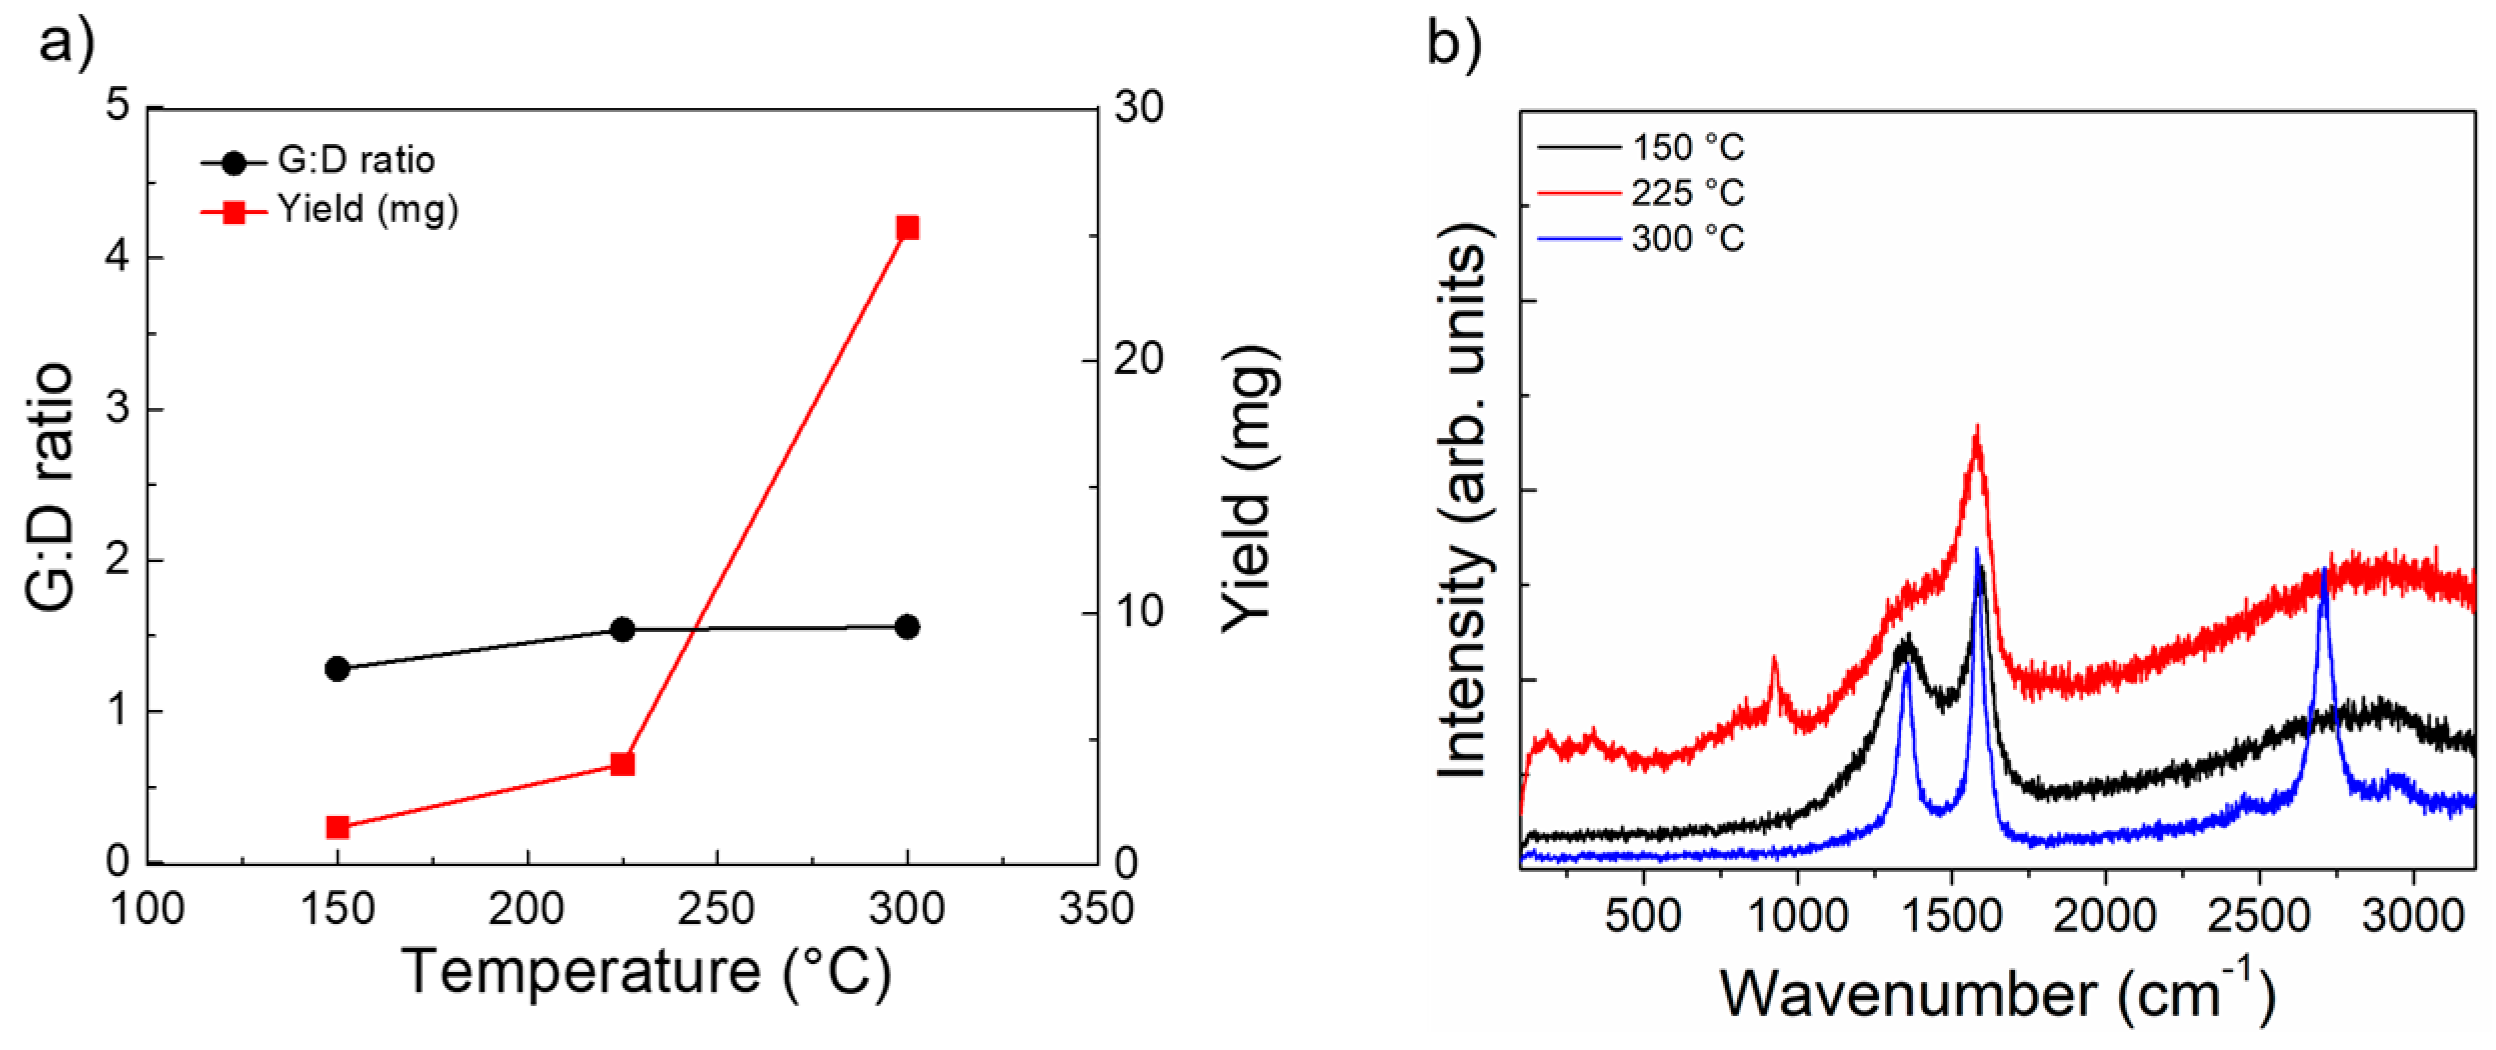
Figure 4.
SEM images of DLICVD experiments conducted using a reaction temperature of 800 °C, a 1 mL/h injection rate, a 1.25 wt.% catalyst concentration, using EtOH as a carbon source, and an aspiration temperature of (a) 150 °C, (b) 225 °C, and (c) 300 °C.
Figure 4.
SEM images of DLICVD experiments conducted using a reaction temperature of 800 °C, a 1 mL/h injection rate, a 1.25 wt.% catalyst concentration, using EtOH as a carbon source, and an aspiration temperature of (a) 150 °C, (b) 225 °C, and (c) 300 °C.
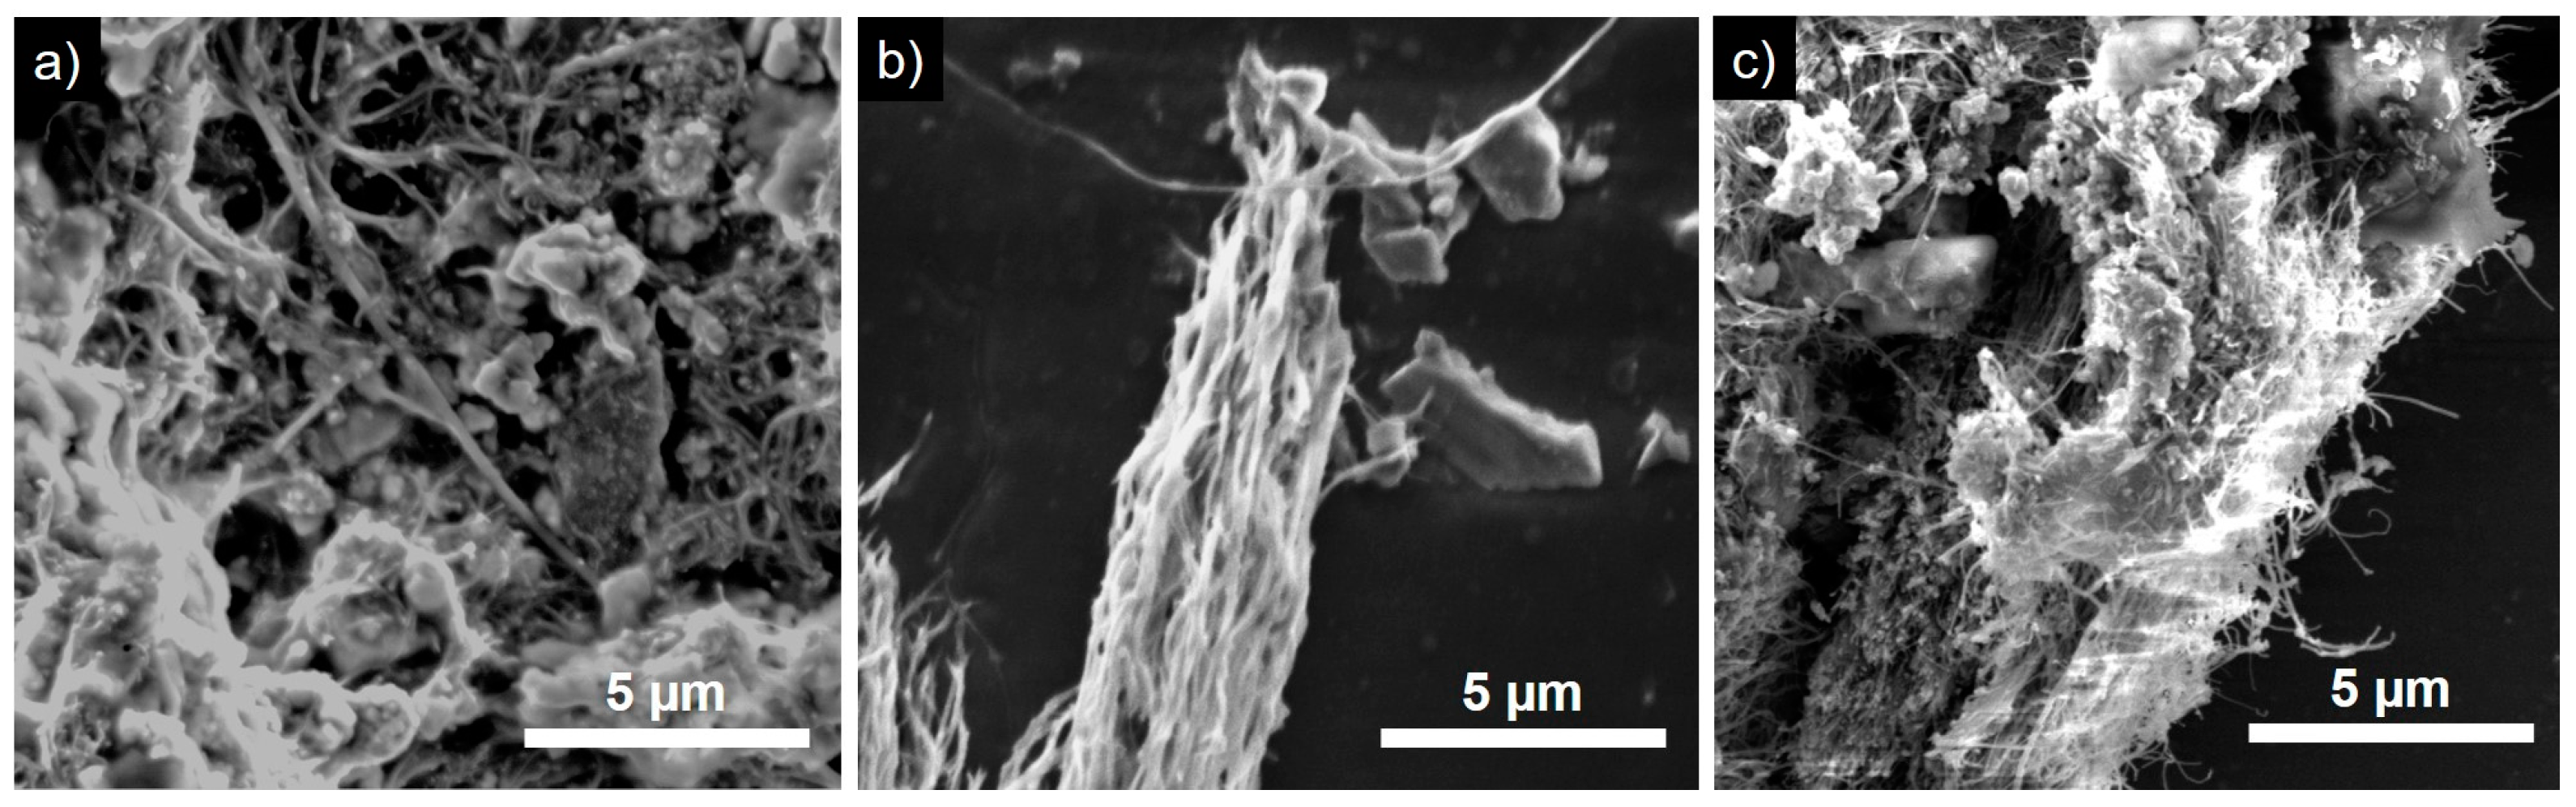
Figure 5.
Plot of the Raman G:D ratio (black) and product yield (red) for DLICVD experiments with variable growth temperature (a) with the corresponding Raman spectra (b). Experiments were performed with an aspiration temperature of 225 °C, a 1 mL/h injection rate, a 1.25 wt.% catalyst concentration, using EtOH as a carbon source.

Figure 6.
SEM images of DLICVD experiments conducted using an aspiration temperature of 225 °C, a 1 mL/h injection rate, a 1.25 wt.% catalyst concentration, using EtOH as a carbon source, and a reaction temperature of (a) 700 °C, (b) 800 °C, (c) 900 °C, and (d) 1000 °C.
Figure 6.
SEM images of DLICVD experiments conducted using an aspiration temperature of 225 °C, a 1 mL/h injection rate, a 1.25 wt.% catalyst concentration, using EtOH as a carbon source, and a reaction temperature of (a) 700 °C, (b) 800 °C, (c) 900 °C, and (d) 1000 °C.

Figure 7.
TEM images of DLICVD experiments at high magnification (top) and low magnification (bottom) conducted using an aspiration temperature of 225 °C, a 1 mL/h injection rate, a 1.25 wt.% catalyst concentration, using EtOH as a carbon source, and a reaction temperature of (a) 700 °C, (b) 800 °C, (c) 900 °C, and (d) 1000 °C.

Figure 8.
Thermogravimetric analysis (TGA) results of DLICVD experiments, performed at an aspiration temperature of 225 °C, a 1 mL/h injection rate, a 1.25 wt.% catalyst concentration, using EtOH as a carbon source, and a reaction temperature of 700 °C (red), 800 °C (black), 900 °C (green), and 1000 °C (blue) with the corresponding residual weights labeled.
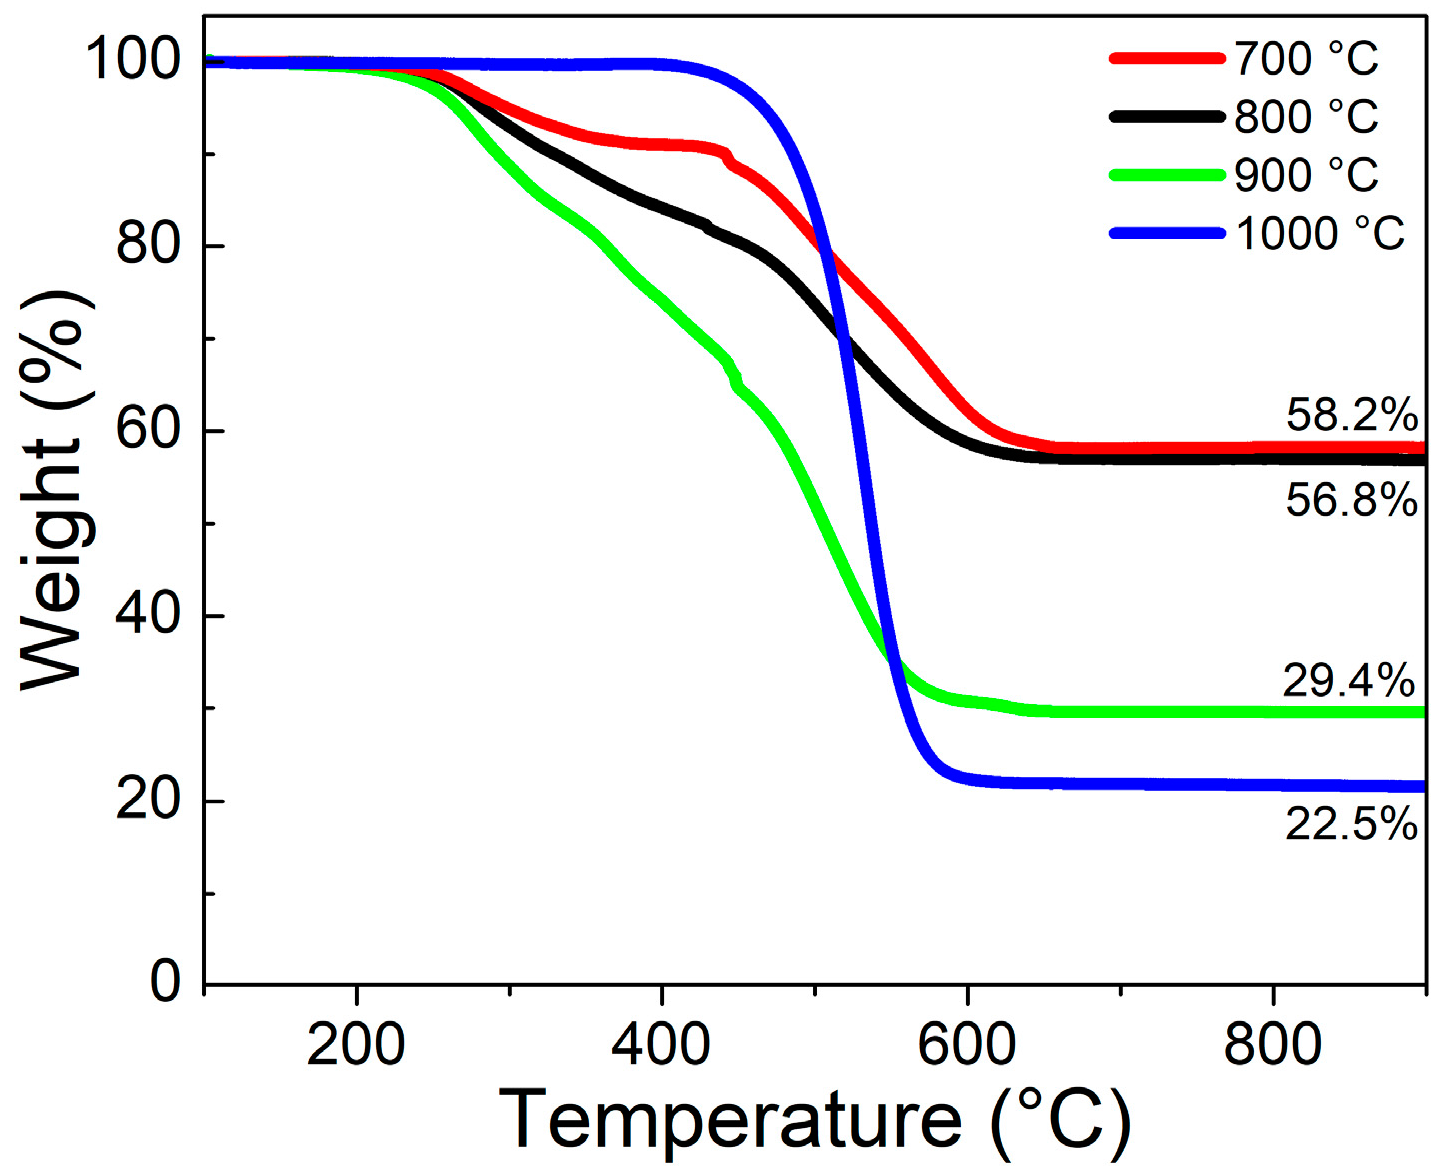
Figure 9.
Plot of the Raman G:D ratio (black) and product yield (red) for DLICVD experiments with variable injection rate (a) with the corresponding Raman spectra (b). Experiments were performed with an aspiration temperature of 225 °C, a reaction temperature of 1000 °C, a 1.25 wt.% catalyst concentration, using EtOH as a carbon source.
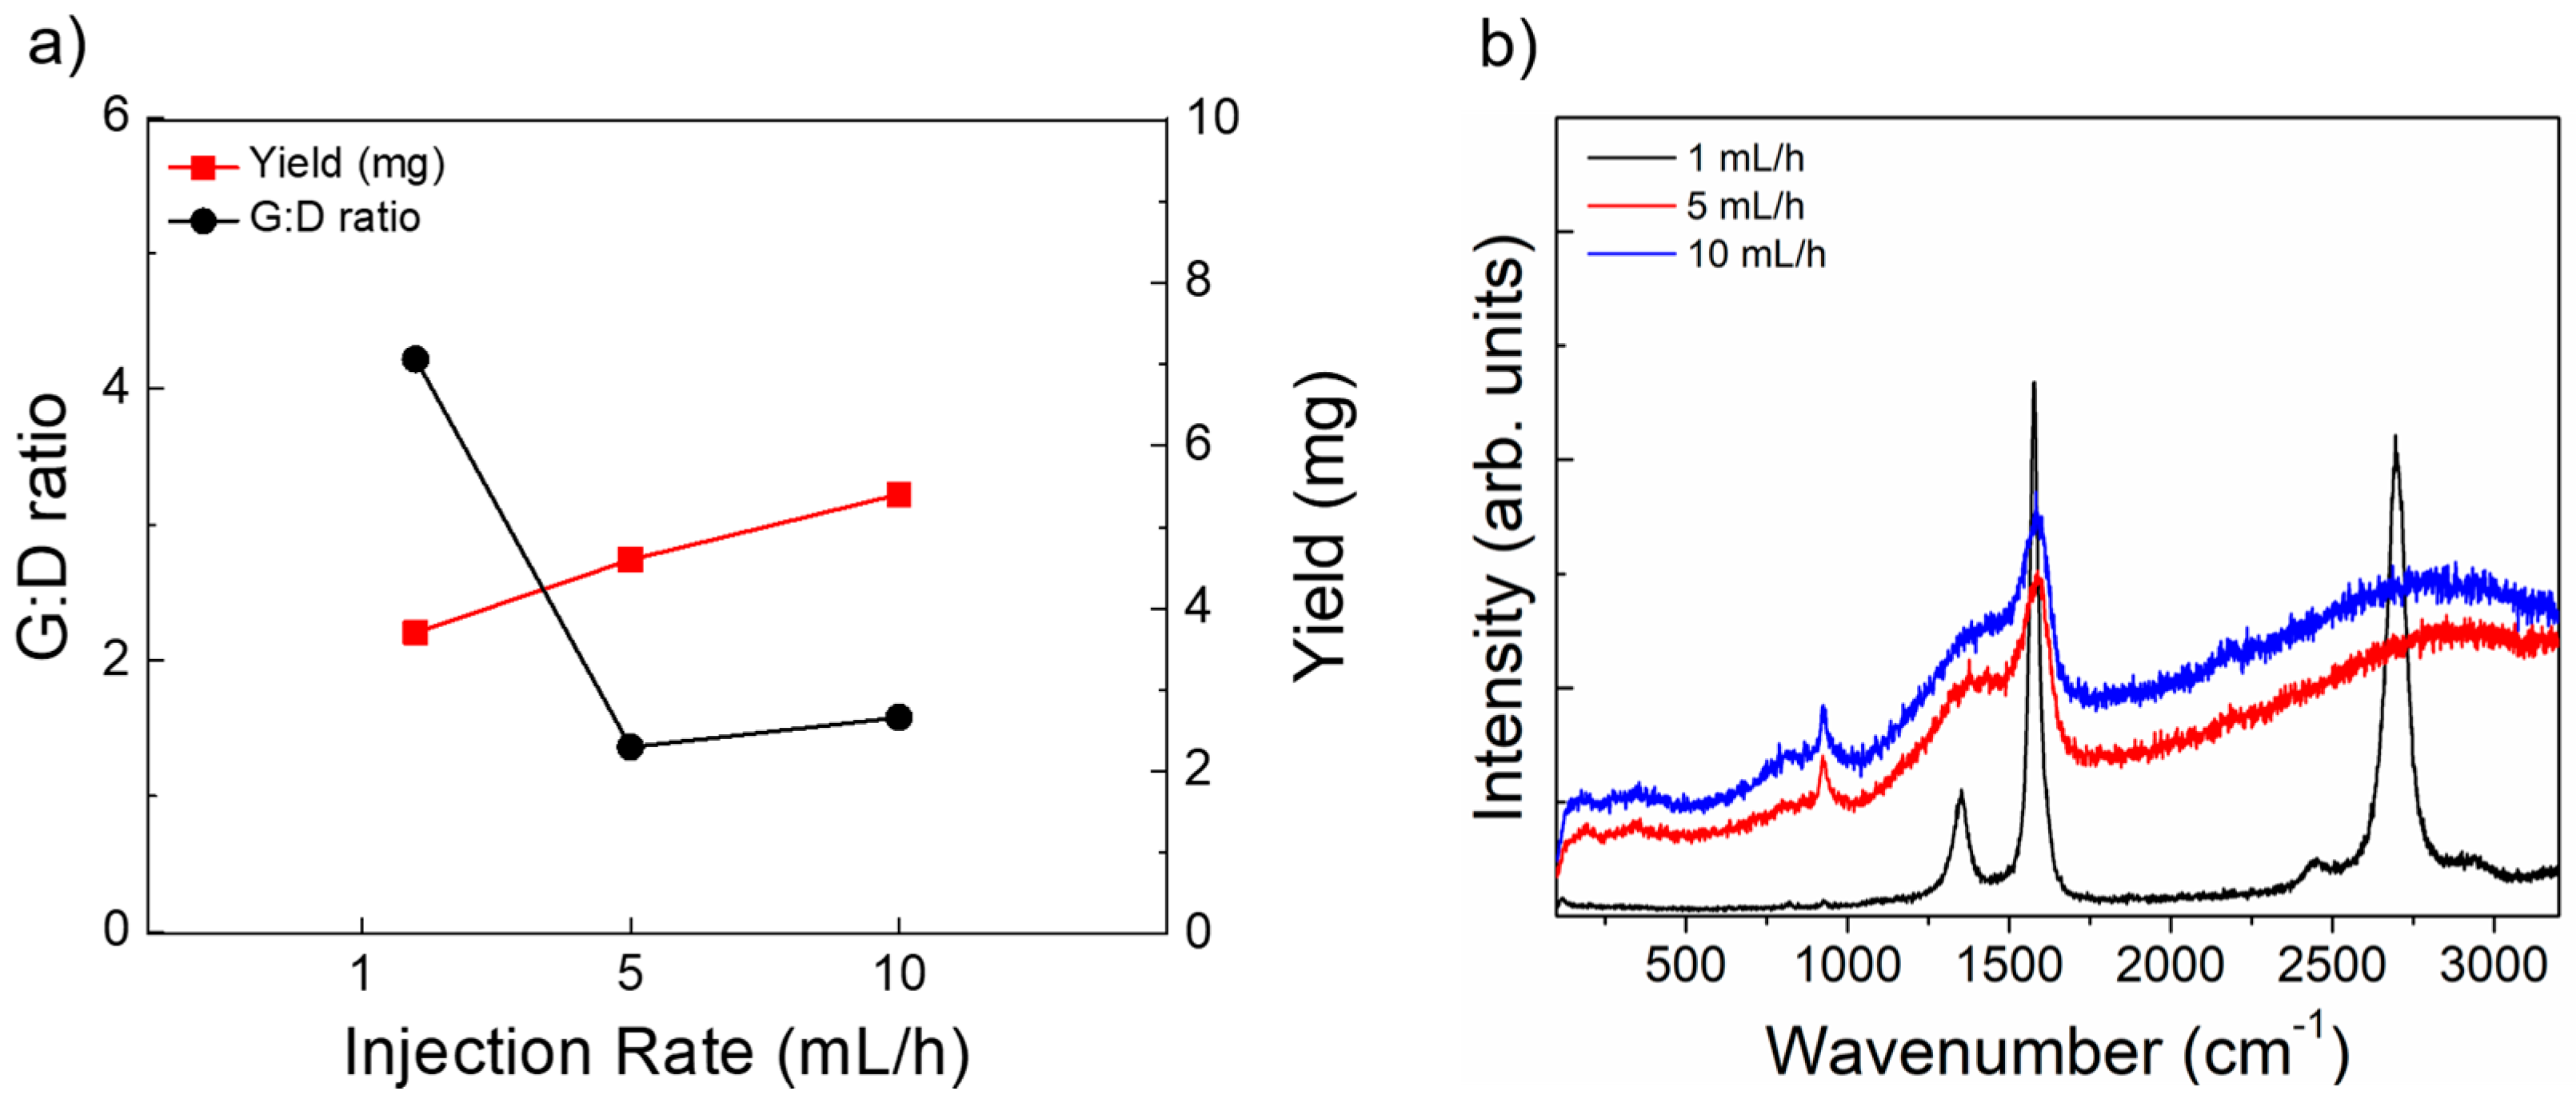
Figure 10.
SEM images of DLICVD experiments conducted using an aspiration temperature of 225 °C, a reaction temperature of 1000 °C, a 1.25 wt.% catalyst concentration, using EtOH as a carbon source, and an injection rate of (a) 1 mL/h (b) 5 mL/h, and (c) 10 mL/h.
Figure 10.
SEM images of DLICVD experiments conducted using an aspiration temperature of 225 °C, a reaction temperature of 1000 °C, a 1.25 wt.% catalyst concentration, using EtOH as a carbon source, and an injection rate of (a) 1 mL/h (b) 5 mL/h, and (c) 10 mL/h.
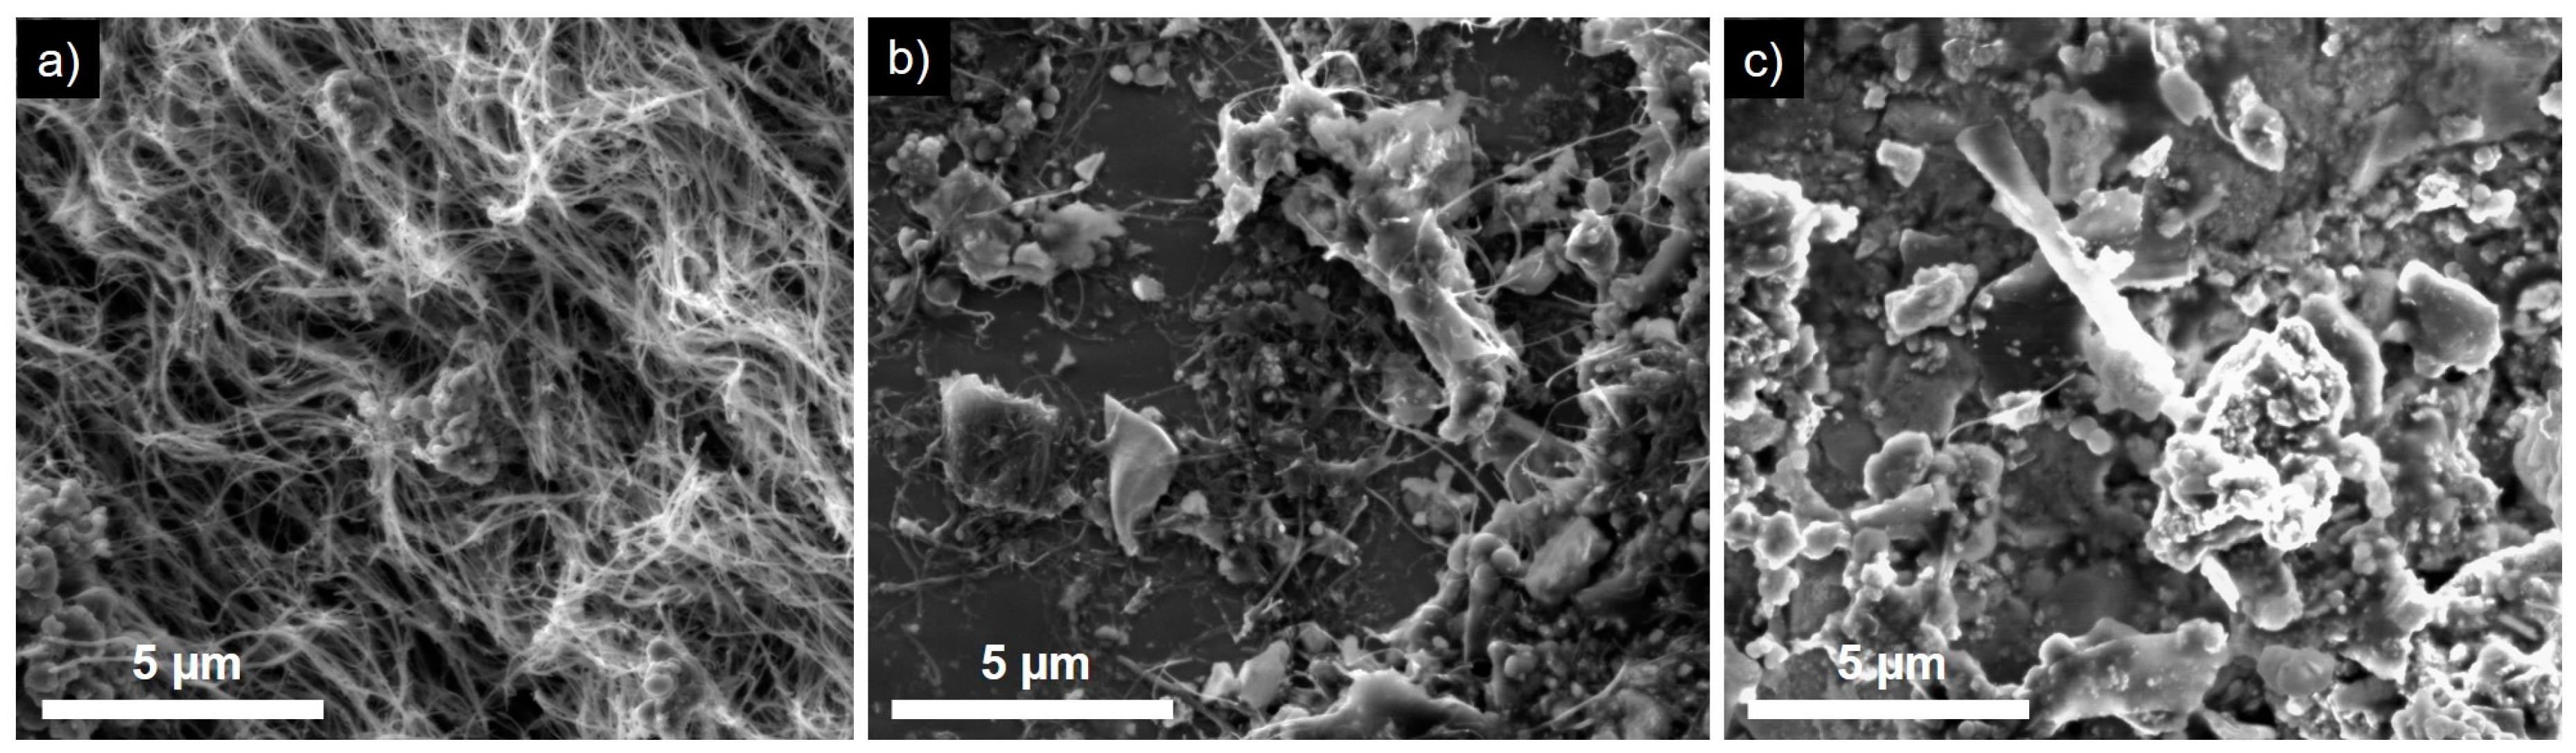
Figure 11.
Plot of the Raman G:D ratio (black) and product yield (red) for DLICVD experiments with variable catalyst concentration (wt.%). Experiments were performed with an aspiration temperature of 225 °C, a reaction temperature of 800 °C, an injection rate of 1 mL/h, and EtOH as the carbon source.
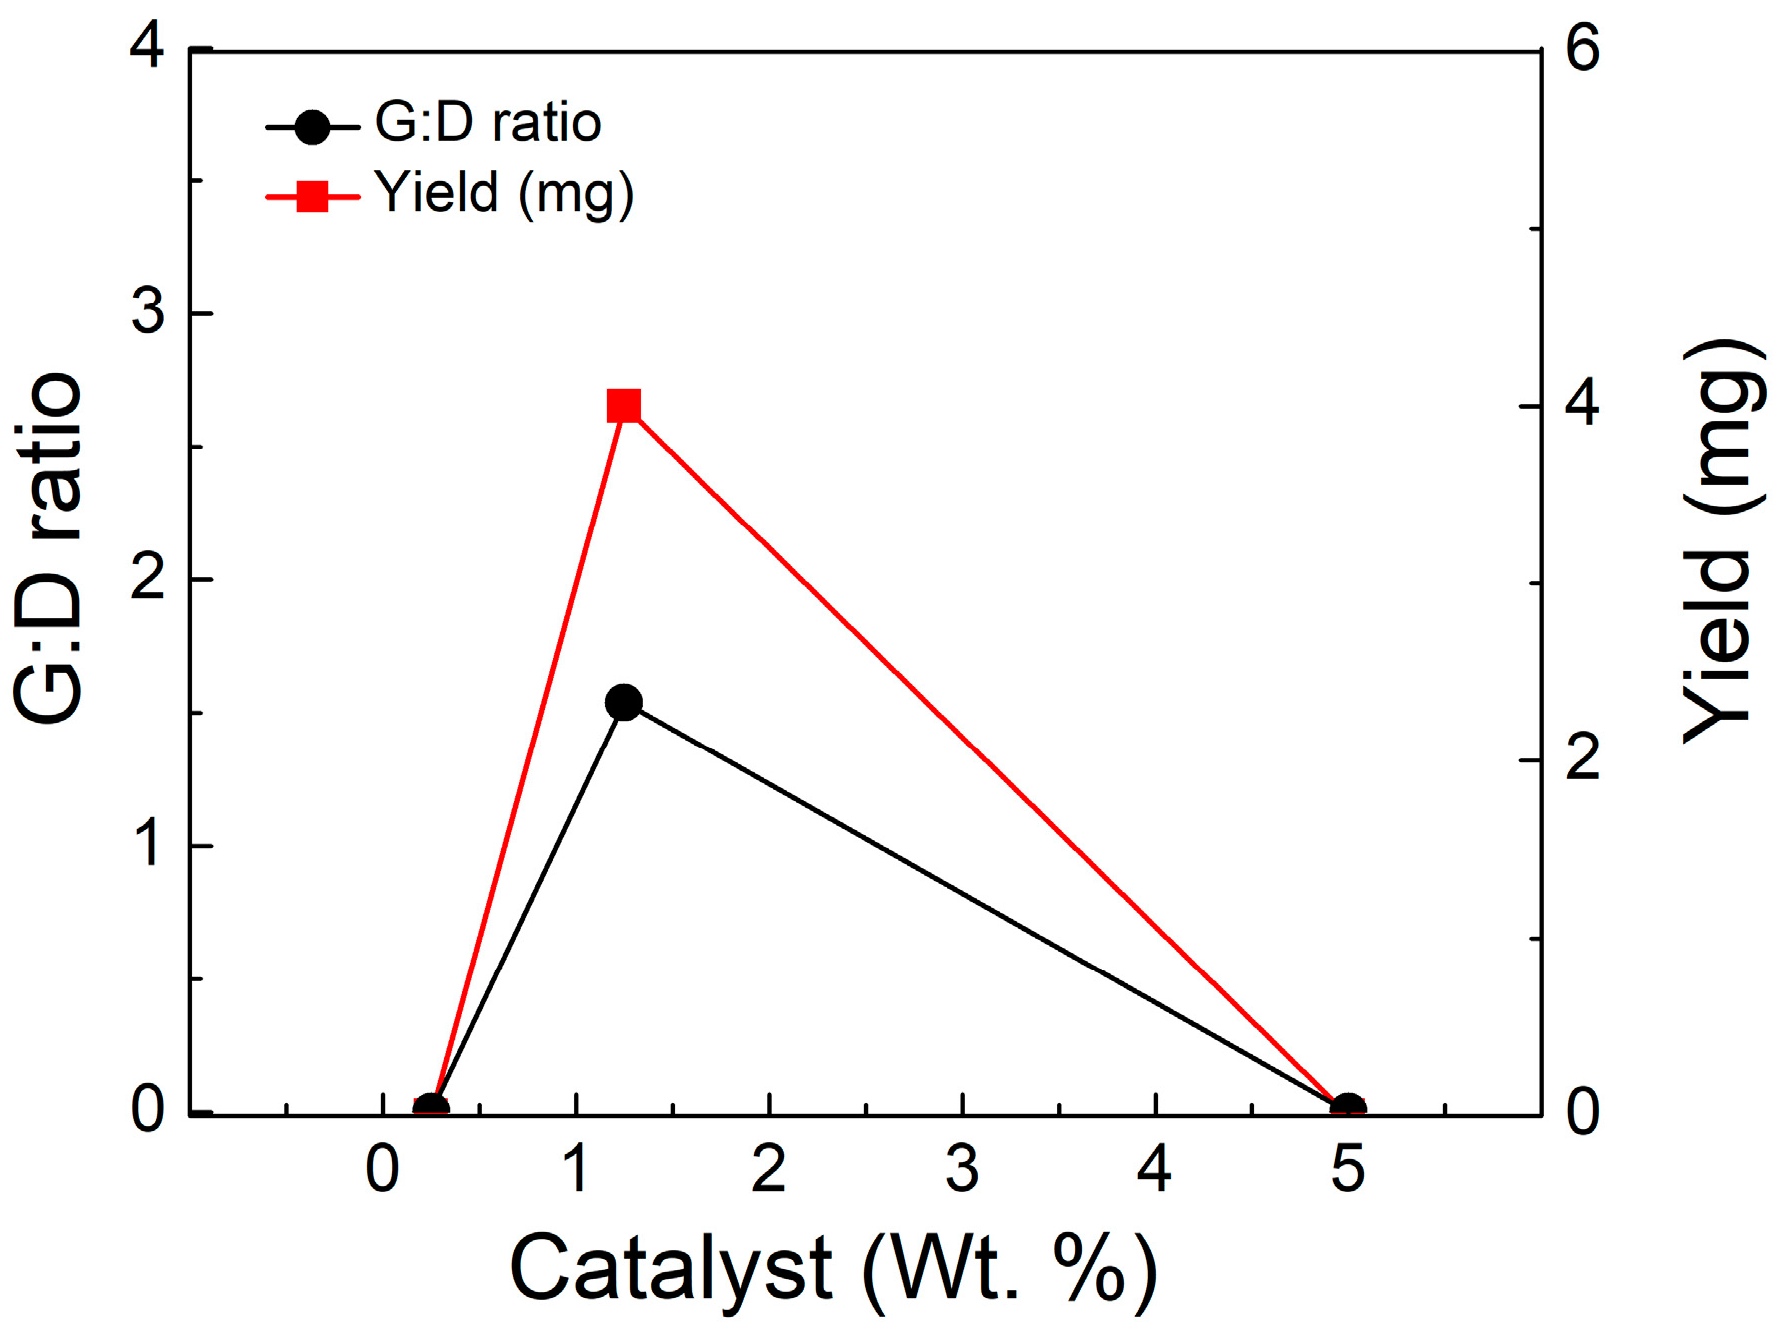
Figure 12.
Plot of the Raman G:D ratio (black) and product yield (red) for DLICVD experiments with the carbon source consisting of varying degrees of toluene in EtOH. Experiments were performed with an aspiration temperature of 225 °C, a reaction temperature of 800 °C, an injection rate of 1 mL/h, and a 5.00 wt.% catalyst concentration.

Table 1.
Summary of [HxPMo12O40⊂H4Mo72Fe30(O2CMe)15O254(H2O)98-y(EtOH)y] (FeMoC) synthesis experiments.
Table 1.
Summary of [HxPMo12O40⊂H4Mo72Fe30(O2CMe)15O254(H2O)98-y(EtOH)y] (FeMoC) synthesis experiments.
| Exp. | FeCl2 (mmol) | Na2MoO4 (mmol) | CH3CO2H (mmol) | H3[P(Mo3O10)4] (mmol) | pH a | Yield (g) b | Notes |
|---|---|---|---|---|---|---|---|
| 1 | 20.17 | 8.26 | 174 | 1.37 | 0.5 | 0.468 | 4× Fe, air |
| 2 | 20.13 | 8.28 | 174 | 1.37 | 1.5 | 0.685 | 4× Fe |
| 3 | 201.19 | 82.661 | 1740 | 13.70 | 1.4 | 18.180 | 10× Exp. 2 |
| 4 | 50.30 | 82.70 | 1740 | 13.70 | 2.0 | 6.480 | 10× Lit. |
| 5 | 20.12 | 8.27 | 174 | 1.37 | 2.5 | 2.500 | 4× Fe |
| 6 | 20.14 | 8.29 | 174 | 1.37 | 2.0 | 2.403 | 4× Fe, air |
| 7 | 50.55 | 82.66 | 1914 | 13.70 | 2.0 | 5.113 | 10× Lit. |
| 8 | 28.82 | 47.08 | 1091 | 7.815 | 2.0 | 2.717 | 6× Lit., air |
a Solution pH adjusted through addition of HCl and measured with a pH meter. b Solid material isolated.
Table 2.
Summary of direct liquid injection chemical vapor deposition (DLICVD) experiments where temperature and concentration are abbreviated as temp. and conc. respectively.
Table 2.
Summary of direct liquid injection chemical vapor deposition (DLICVD) experiments where temperature and concentration are abbreviated as temp. and conc. respectively.
| CVD Run | Aspiration Temp. (°C) | Growth Temp. (°C) | Injection Rate (mL/h) | Catalyst Conc. (wt.%) | Carbon Source | Variable |
|---|---|---|---|---|---|---|
| 1 | 150 | 800 | 1 | 1.25 | EtOH | Aspiration temp. |
| 2 | 225 | 800 | 1 | 1.25 | EtOH | Aspiration temp. |
| 3 | 300 | 800 | 1 | 1.25 | EtOH | Aspiration temp. |
| 4 | 225 | 700 | 1 | 1.25 | EtOH | Growth temp. |
| 5 | 225 | 900 | 1 | 1.25 | EtOH | Growth temp. |
| 6 | 225 | 1000 | 1 | 1.25 | EtOH | Growth temp. |
| 7 | 225 | 1000 | 5 | 1.25 | EtOH | Injection rate |
| 8 | 225 | 1000 | 10 | 1.25 | EtOH | Injection rate |
| 9 | 225 | 800 | 1 | 0.25 | EtOH | Catalyst conc. |
| 10 | 225 | 800 | 1 | 5 | EtOH | Catalyst conc. |
| 11 | 225 | 800 | 1 | 5 | EtOH/toluene (1:1) | Carbon source |
| 12 | 225 | 800 | 1 | 5 | Toluene | Carbon source |
© 2018 by the authors. Licensee MDPI, Basel, Switzerland. This article is an open access article distributed under the terms and conditions of the Creative Commons Attribution (CC BY) license (http://creativecommons.org/licenses/by/4.0/).
Share and Cite
MDPI and ACS Style
Esquenazi, G.L.; Brinson, B.; Barron, A.R. Catalytic Growth of Carbon Nanotubes by Direct Liquid Injection CVD Using the Nanocluster [HxPMo12O40⊂H4Mo72Fe30(O2CMe)15O254(H2O)98-y(EtOH)y]. C 2018, 4, 17. https://doi.org/10.3390/c4010017
AMA Style
Esquenazi GL, Brinson B, Barron AR. Catalytic Growth of Carbon Nanotubes by Direct Liquid Injection CVD Using the Nanocluster [HxPMo12O40⊂H4Mo72Fe30(O2CMe)15O254(H2O)98-y(EtOH)y]. C. 2018; 4(1):17. https://doi.org/10.3390/c4010017
Chicago/Turabian StyleEsquenazi, Gibran L., Bruce Brinson, and Andrew R. Barron. 2018. "Catalytic Growth of Carbon Nanotubes by Direct Liquid Injection CVD Using the Nanocluster [HxPMo12O40⊂H4Mo72Fe30(O2CMe)15O254(H2O)98-y(EtOH)y]" C 4, no. 1: 17. https://doi.org/10.3390/c4010017
Note that from the first issue of 2016, this journal uses article numbers instead of page numbers. See further details here.