Adsorption of Bovine Serum Albumin on Carbon-Based Materials


1
Department of Materials Science & Engineering and A.J. Drexel Nanomaterials Institute, Drexel University, Philadelphia, PA 19104, USA
2
School of Pharmacy and Biomolecular Sciences, University of Brighton, Brighton BN2 4GJ, UK
*
Author to whom correspondence should be addressed.
C 2018, 4(1), 3; https://doi.org/10.3390/c4010003
Submission received: 3 December 2017
/
Revised: 28 December 2017
/
Accepted: 3 January 2018
/
Published: 7 January 2018
(This article belongs to the Special Issue Functional Nanoporous Carbon-Based Materials)
Abstract
:The protein adsorption plays a very important role in biotechnology, biomolecular engineering and it is one of the main factors determining bio- and hemocompatibility of biomedical materials in medical applications, such as blood purification and wound healing. Here we report adsorption properties of two carbon-based materials, thermally expanded graphite (EGr) and graphene nanoplatelets (GnP), for bovine serum albumin (BSA), the most abundant blood plasma protein. The influence of the surface chemistry of expanded graphite on the mechanism of BSA adsorption was studied by using EGr modified with oxygen or nitrogen functionalities. Having low microporosity and the specific surface area in the range of 5 to 50 m2/g, the expanded graphite exhibits high protein adsorption capacity at high equilibrium concentrations, which makes this material a potential candidate for biomedical applications as a carrier for high molecular weight (HMW) drug delivery or adsorption of HMW metabolites. At low equilibrium concentrations, the effect of specific protein-surface functional groups interaction reveals the differences between the adsorption affinity of different surface modified EGr materials to BSA. The adsorption of BSA on GnP with a specific surface area of 286 m2/g and a developed micro-/mesoporous structure did not follow the same mechanism as seen with EGr materials. At low equilibrium concentration of BSA, GnP exhibits high adsorption efficiency. An important finding is that no release of nanoparticles from expanded graphite adsorbents was observed, which makes them potentially suitable for direct contact with blood and other tissues while very small nanoparticles were noticed in the case of graphene nanoplatelets.
1. Introduction
Carbon materials have been used in biomedical applications for many decades. Among the earliest applications are the use of graphite and pyrolytic carbon for constructing artificial heart valves [1] and activated carbon in hemoperfusion devices for the treatment of exo- and endogenous poisonings of different etiology [2]. The use of activated carbon as an oral adsorbent can be traced back to ancient Greece [2]. Development of novel nanostructured carbons and methods for their surface modification expanded the choice of materials and led to the applications in biosensors, coatings for medical devices, drug and gene delivery carriers and bioimaging [3]. Current interest to biomedical applications of novel nanostructured carbon materials is based on their structural, mechanical, physical and chemical properties, which are often superior to other materials [4,5]. This interest is supported by the fact that many carbon materials have good biocompatibility and can be used in direct contact with blood and human tissues [6]. The phenomenon of biocompatibility is very complex and its key factors have not been fully understood yet, however it is known to be associated with the protein adsorption on the surface of materials exposed to the human body [6]. When the biomaterial is exposed to the blood, it undergoes a rapid surface modification by the protein adsorption, which occurs at the earliest stages of the biomaterial-blood contact. The adsorption of serum albumin, the most abundant blood protein, in general is considered to play a positive, passivating role in the body response to a foreign material [7]. Recently it was shown that the cytotoxicity of graphene oxide was greatly reduced after its incubation with 10% fetal bovine serum, in which bovine serum albumin, BSA, is the main protein component [8]. The protein adsorption may also play a negative role in the material performance, for example, reducing the efficiency of hemofiltration and hemodialysis by blocking and narrowing of the membrane pores and thus lowering its molecular cut-off limits [9]. This phenomenon is very similar in its nature to biofouling. Uncontrolled protein adsorption may also affect the biosensor performance [10].
Recent advances in designing nanostructured carbon materials and methods for fine tuning of their pore structure broaden the range of carbon materials of potential interest for biomedical applications. It was shown that finely tuned carbide-derived carbons (CDCs) can selectively remove inflammatory cytokines from the blood [11,12,13]. It has also been proven that meso- and small macropores are essential for removing middle- and high molecular weight biotoxins from the bloodstream [11,12,13,14,15]. In direct hemoperfusion, it is important that the carbon-based adsorbent does not activate the blood coagulation cascade or cause platelet activation or hemolysis, which are among factors affecting bio-/hemocompatibility of biomaterials. Despite their excellent molecular adsorption properties, biocompatibility of activated carbons is often compromised by the release of microparticles owing to their poor mechanical strength [16]. This problem was addressed by using semipermeable synthetic or natural polymer coatings, which prevented nanoparticles release but decreased adsorption capacity of the adsorbent, in particular towards middle and high molecular weight toxins [2]. However, the development of medical grade activated carbon adsorbents allows their use in direct contact with blood without coating or with patchy coating which does not significantly affect their adsorption capacity towards the whole range of adsorbates [17]. The adsorption capacity of uncoated activated carbon is therefore determined mainly by the pore size range [11,12,13,14,15]. Proteins can be adsorbed in the mesopores with the width larger than 5 nm, depending on molecular size of proteins and their configurations [13]. The molecular adsorption is not selective but some selectivity towards large molecules can be achieved by the size exclusion effect as it was shown by higher adsorption selectivity of carbon adsorbents with small mesopores towards inflammatory cytokines, which are smaller biomolecules than most blood proteins [11,12,13]. Although the molecular adsorption of undesirable substances from the human body is the main mechanism of the therapeutic action of carbon adsorbents, the role of other factors that may contribute to their adsorption capability and selectivity remains uncertain. The factors that may influence protein adsorption include ionic and van-der-Waals interactions and hydrophobic effects [18,19].
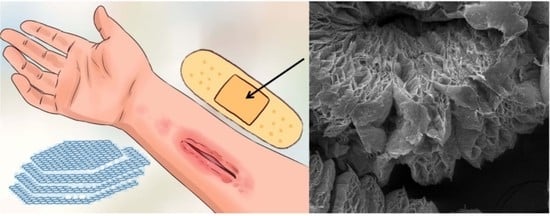
The new forms of nanostructured carbon materials such as graphene and exfoliated or expanded graphite, EGr, have an open structure with accessible surface and no or little internal microporosity rendering fast adsorption kinetics. However, to date there have been few publications reporting experimental data on protein adsorption on these nanostructured carbon materials. The expanded graphite was reported to have substantial adsorption capacity for bovine serum albumin (BSA) from aqueous solution with a view of assessing its application as a wound dressing, in particular for wound drainage [20]. Three-dimensional (3D) porous graphene showed high adsorption capacity towards BSA-bound bilirubin, however the adsorption of BSA was not studied separately and it is not therefore clear whether high adsorption capacity towards bilirubin was a result of a competition between the graphene surface and BSA for bilirubin, or graphene adsorbed the whole bilirubin-BSA complex [21]. Conformational changes of BSA and fibrinogen adsorbed on graphene and graphene oxide nanoribbons were also studied [22].
In this paper, we present an assessment of the adsorption properties of expanded graphite and graphene nanoplatelets towards bovine serum albumin as an indication of their biocompatibility.
2. Materials and Methods
2.1. Materials
Expanded graphite (EGr) was obtained from graphite powder (Superior Graphite, Grade 2900G8, Chicago, IL, USA) intercalated with H2SO4 (18.4 M): HNO3 (15.8 M) (5:1) followed by a thermal shock performed according to the protocol described in [23]. First, graphite (50 g) was mixed with concentrated H2SO4 (80 mL) and the mixture was stirred for 10 min. Then, concentrated HNO3 (16 mL) was added to the intercalated graphite and the mixture was stirred for 2 h. Afterwards, graphite intercalated with the acids was washed with copious amounts of water to remove residual acids. The mixture was then filtered and dried at 120 °C and expanded by inserting into a pre-heated furnace at 900 °C for 1 min. The thermally expanded (exfoliated) graphite thus obtained was washed with distilled water until neutral pH. The expanded volume of the acid intercalated graphite after the thermal shock treatment was 98 cm3. The volume before treatment was 14 cm3. A portion of this sample was subjected to an additional high-temperature treatment under Ar flow (100 mL/min) at a heating rate of 10 °C/min to 900 °C for one hour to remove surface functional groups. The sample obtained was referred to as EGr-H. In order to introduce acidic or basic oxygen groups [24], expanded graphite (EGr) (5 g) was either oxidized with HNO3 (50%) or immersed in KOH (6 M) for 5 h at room temperature and then washed with water to neutral pH. The washing of the oxidized expanded graphite caused layer separation related to the different bed density, degree of oxidation and wettability of the material (Figure S1). The sample was separated into a top and a bottom layer (referred to as EGr-COOH-TL and EGr-COOH-BL respectively). The sample treated with KOH is referred to as EGr-OH.
To introduce nitrogen groups [24], EGr-COOH-TL and EGr-COOH-BL (3 g) were impregnated with urea solution (2 g of urea in 100 mL of water) and stirred at room temperature for 24 h. The samples were then filtered and dried at 120 °C and subjected to high-temperature treatment under Ar flow at a heating rate of 10 °C/min to 900 °C for one hour (referred to as EGr-N-TL and EGr-N-BL respectively).
In order to study the effect of the lateral dimensions of graphene layers on the albumin adsorption, the graphene nanoplatelets GnP-300 (xGnPTM, XG Sciences©, Lansing, MI, USA; referred to as GnP) were used in this study. Particles of GnP stick together forming graphene layers of 1–5 nm in thickness and between 1 and 2 µm in lateral dimensions [25].
A schematic, summarizing the procedure used herein to produce expanded graphite, surface modifications and graphene nanoplatelets, is shown in Figure 1.
2.2. Adsorption of Bovine Serum Albumin (BSA)
BSA lyophilized powder was obtained from Fisher Scientific (≥ 99.0%, BP671-10, Hampton, NH, USA). BSA solutions were prepared in phosphate-buffered saline, PBS (pH 7.2). Kinetic studies were conducted with BSA solutions (1 mg/mL) at varying adsorption times (5, 10, 20, 30, 60 and 90 min) at room temperature while shaking at 150 rpm. Prior to BSA adsorption, expanded graphite (~100 mg) was equilibrated overnight in PBS (2.0 mL) to prevent adsorption of environmental contaminants from the air and then the excessive liquid phase was separated by centrifugation. Afterwards, BSA solution in PBS (5 mL) was added to 6 non-sticky vials containing the adsorbent. At 5, 10, 20, 30, 60 and 90 min time points, samples were centrifuged and the supernatant collected to record the UV spectra. The residual protein concentration in the solution was determined from the intensity of the UV absorbance at 278 nm (Figure S2a) using a calibration curve (Figure S2b), which confirmed that the Beer’s law was obeyed.
The amount of BSA adsorbed was calculated from the equation:
where q is the amount of adsorbed BSA (mg/g), Co is the initial concentration of solute (mg/mL), Ct is the residual concentration of solute (mg/mL) at a certain time point, V is the volume of the solution (mL) and m is the mass of adsorbent (g).
Several models of adsorption kinetics were used to fit the experimental data: the pseudo-first-order, the intraparticle diffusion model and the pseudo-second-order kinetic model. Only the pseudo-second-order kinetic model fitted the adsorption kinetic data (results of curve fitting using other models are not shown) [26]:
where qe is the adsorption capacity at equilibrium (mg/g), qt is the amount of adsorbate adsorbed at various times t (mg/g), k2 is the rate constant of the pseudo-second-order adsorption rate equation (g mg−1·min−1).
To determine qe the adsorption isotherms were studied. Approximately 100 mg of adsorbent was added to 5 mL of BSA solutions of different concentrations in the range of 0.025–10.0 mg/mL (13 non-sticky vials). The experiments were run in triplicate and the error in the concentrations determined by this procedure was within ±10%. The vials containing adsorbent and BSA solution were shaken at ambient temperature for an hour. In separate experiments, which were run for 24 h, it was found that the residual protein concentration in solution remains the same as after 1 h confirming that the system reached equilibrium within 1 h. All conditions for batch adsorption experiments and the supernatant analysis for protein concentration were the same as described for adsorption kinetics experiments.
2.3. Porosity
Sorption of nitrogen at −196 °C was carried out using a Quadrasorb gas sorption analyzer (Quantachrome Instruments, Boynton Beach, FL, USA). The sample was out-gassed to constant vacuum at 100 mTorr and 120 °C for 12 h prior to analysis. The specific surface area of carbon materials, SBET was calculated from 0.05 to 0.30 relative pressure value range, p/po (the ratio of absolute pressure, p, to the saturated vapor pressure, po), using Brunauer-Emmett-Teller equation [27]. The total pore volume, Vt, was calculated from the last point of nitrogen adsorption isotherm at p/po = 0.99. The pore size distribution was calculated using the manufacturer’s software SAIEUS (Norcross, GA, USA) and two-dimensional nonlocal density functional theory, 2D-NLDFT [28].
2.4. Surface Characterization
X-ray photoelectron spectra (XPS; VersaProbe 5000, Physical Electronics Inc., Chanhassen, MN, USA) were taken at a pass energy of 23.50 eV, with a step size of 0.2 eV for survey and 0.025 eV for high-resolution spectra, employing a 100 μm monochromatic Al Kα X-ray beam to irradiate the sample surface. Emitted photoelectrons were collected using a 180° hemispherical electron energy analyzer. Samples were analyzed at a 45° takeoff angle between the sample surface and the path to the analyzer. High-resolution XPS spectra were analyzed using CasaXPS Version 2.3.16 RP 1.6 through peak fitting using symmetric Gaussian-Lorentzian curves resting on a Shirley background.
3. Results and Discussion
3.1. Porosity and Surface Chemistry of Carbon-Based Materials
The cumulative pore volume vs. pore width for the initial expanded graphite (EGr) and post heat-treatment suggest the presence of large mesopores with an average size of 30 nm (Figure 2a). Significant differences in the porosity are seen between graphene nanoplatelets (GnP) and expanded graphite (Figure 2a,b). Graphene nanoplatelets are a primarily mesoporous material with micropore and mesopore volume being 0.076 and 0.408 cm3/g, respectively (Figure 2c). The mesopores are probably formed between the stacks of graphene layers (1–5 nm in thickness and 1–2 µm in lateral dimensions). Immersing expanded graphite (SBET = 31 m2/g and mesopore volume 0.076 cm3/g) in a strong acidic or basic environment results in a decrease of the specific surface area to 5 m2/g and mesopore volume to 0.008 cm3/g (Figure 2c). The materials after those treatments have a denser structure compared to the as-produced expanded graphite and can be considered effectively nonporous.
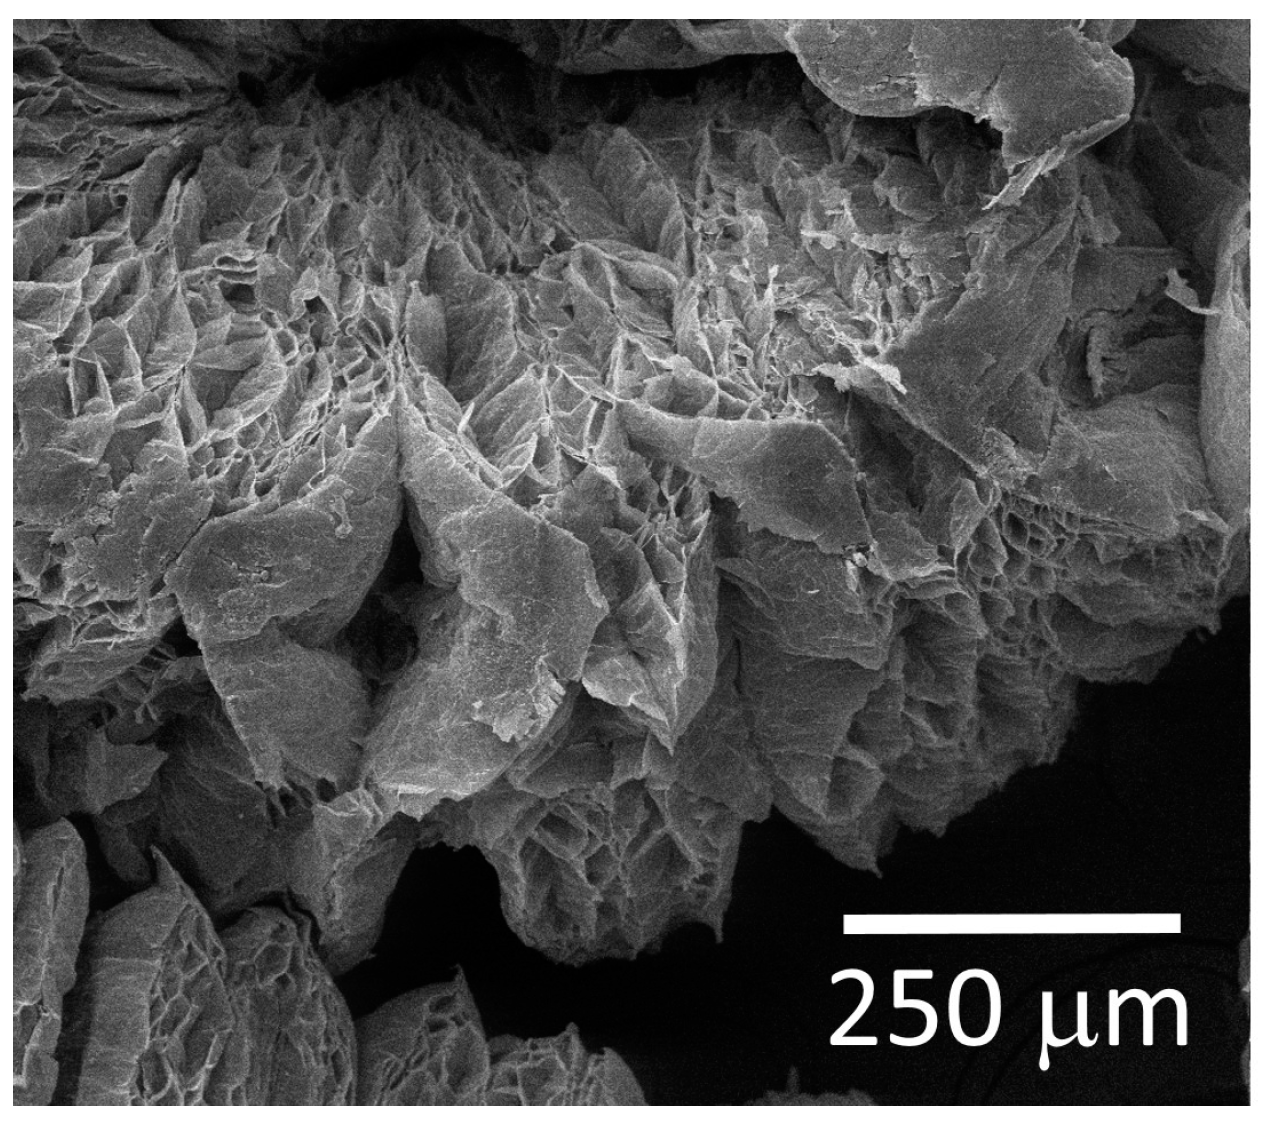
EGr forms worm-like graphite grains with large graphite flakes (Figure 3) and there is a large expansion along the graphitic c-axis of the graphite during the exfoliation process, generally greater than 100 times the original [29]. TEM images showed that GnP agglomerate consisted of submicron size particles [30] indicating that each GnP particle is formed by stacks of graphene layers.
To understand the difference in the adsorption capacity of carbon materials with different surface functional groups, a detailed XPS analysis of their surface chemistry was performed (Table 1). The heat treatment of EGr did not have a significant effect on the content of oxygen. The amount of oxygen increased after strong acid or alkali treatment. The heat-treatment with urea resulted in the incorporation of 2.0 at % nitrogen into the aromatic rings of expanded graphite in the form of pyridinic and pyrrole/amine/amide functionalities (Table 2). The content of oxygen in graphene nanoplatelets was much higher (7.9 at %) than in expanded graphite (2.8 at %). This difference is likely to be owed to the different methods of incorporating oxygen in these materials. Unlike EGr in which oxygen-containing groups were introduced by chemical treatment as described in the Experimental section, oxygen-containing functionalities in GnP were introduced during mechanical grinding to generate small flakes that are 1 to 15 nanometers thick, with diameters ranging from submicrometer to 100 micrometers [25]. The C 1s core energy levels indicate that the surface chemistry of GnP is enriched with both double-bonded (carboxylic/carbonyl) and single-bonded (phenolic/alkoxy/ether) oxygen groups. In the EGr-COOH sample the number of carboxylic/carbonyl groups increased compared to the initial EGr, while in the EGr-OH sample the oxygen content increased mainly in the form of phenolic, alkoxy and ether groups. The heat treatment of the expanded graphite EGr increased the specific surface area and pore volume EGr-H, whereas all chemical methods of treatment yielded samples with a very low surface area and open porosity. However, N2 adsorption does not necessarily show the true values of the parameters of the porous structure such as surface area and total pore volume, especially for the materials with large/open pores.
3.2. Adsorption Kinetics
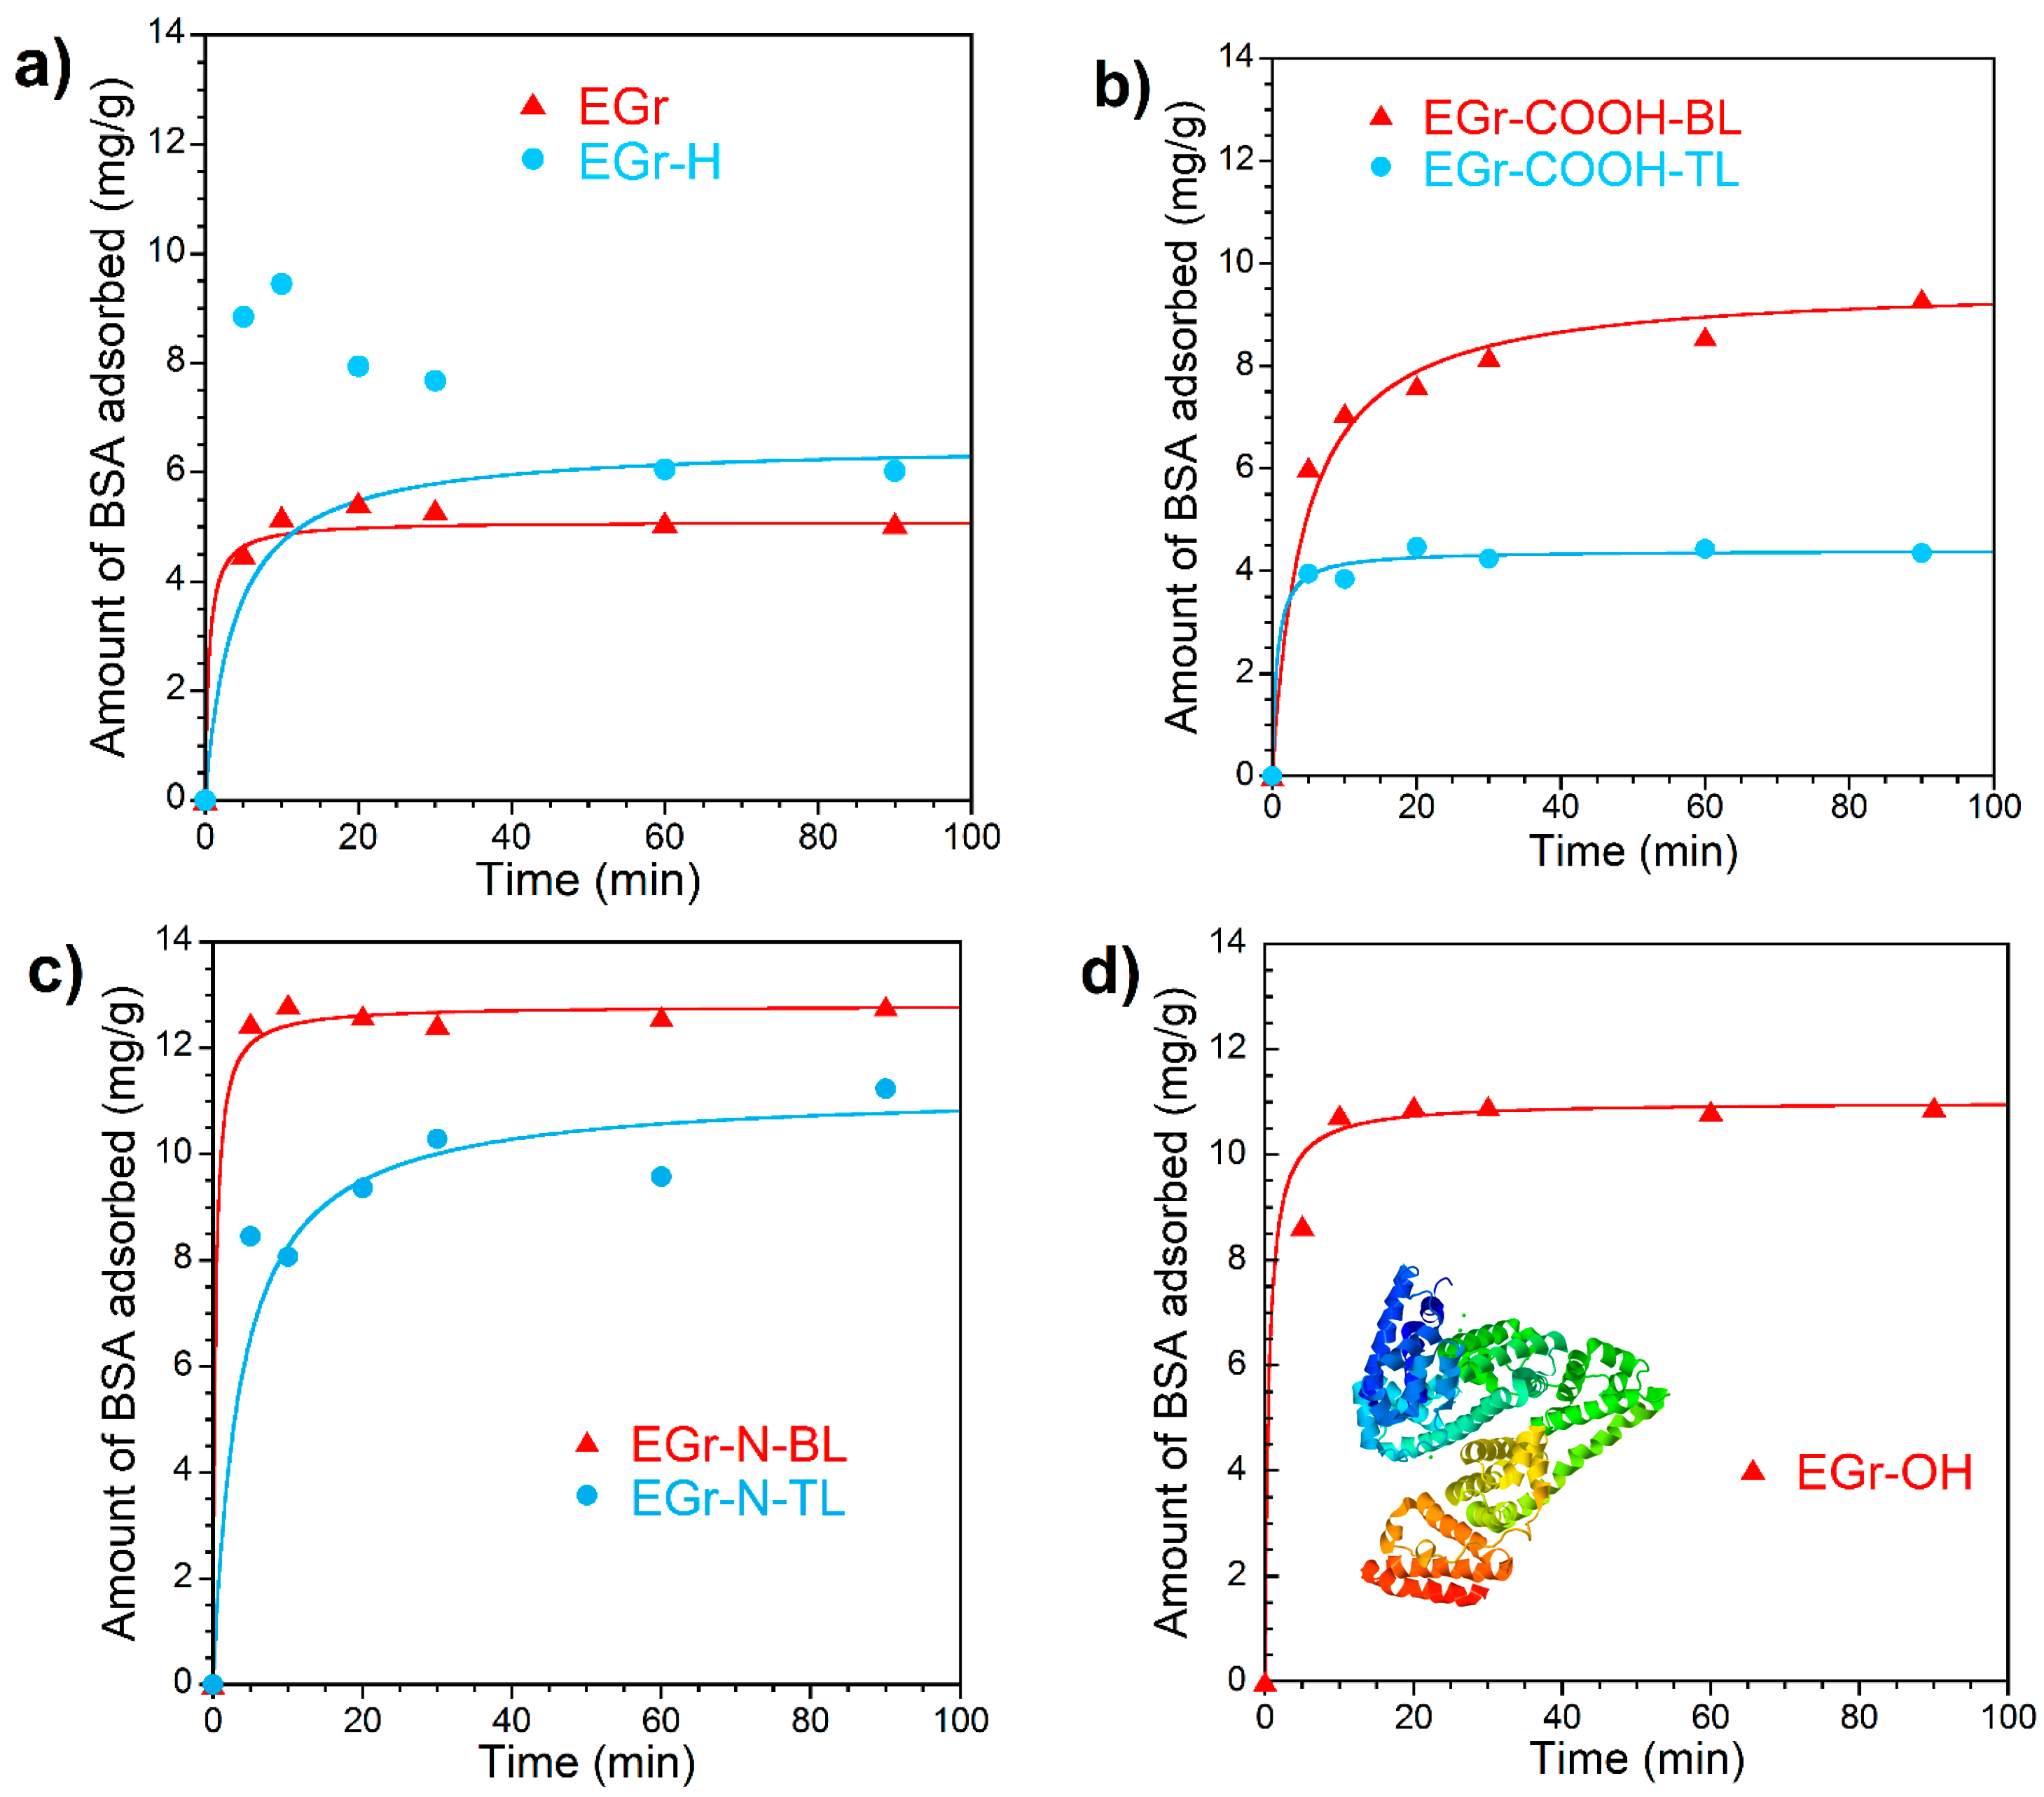
The adsorption kinetics of BSA was analyzed using the pseudo-second-order adsorption model and fitting parameters are listed in Table 3. The pseudo-second-order kinetic model described the experimental adsorption kinetic data with good fitness (R2 > 0.99) and the calculated equilibrium capacity is close to the experimental value obtained from the adsorption isotherm (results presented in Section BSA adsorption isotherms). The exception is the initial adsorption kinetics on the sample EGr-H, during which the amount of BSA adsorbed went through a maximum value around the 10th minute and then gradually decreased reaching the equilibrium by 60th minute (Figure 4a). All surface-functionalized expanded graphene samples (EGr-COOH, EGr-OH and EGr-N) showed higher adsorption capacity for BSA than the non-functionalized samples (EGr and EGr-H), despite the fact that the former have much smaller surface area and pore volume than the latter. This observation highlights the contribution of the interaction between the surface polar groups of carbon and their counterparts in BSA molecule to the mechanism of carbon surface—protein interaction. Although it may seem trivial but the role of polar interactions in the adsorption from liquid phase on carbon materials is often difficult to establish because in most applications it is obscured by a large contribution of molecular interactions particularly on highly porous carbons. It requires the use of low-porosity carbons to reveal the influence of the surface chemistry of carbons on protein adsorption, as it was proven in the study of cytokine adsorption in the channels of carbon nanotubes [31].
It is also interesting to note that between the two pairs of EGr materials designated as BL and TL, both EGr-COOH-BL and EGr-N-BL showed higher adsorption capacity for BSA than TL samples. It probably reflects the effect of carbon hydrophilicity on BSA adsorption, as BL samples are more hydrophilic than TL samples. The existence of the maximum on the BSA adsorption curve on EGr-H, which has the lowest concentration of surface functional groups, deserves special attention. This maximum is not an artefact as its value is significantly higher than the experimental error in calculation of the amount of BSA adsorbed. In general, it is accepted that protein adsorption on solid surface is irreversible [32]. The phenomenon of protein displacement from the surface by another larger protein known as Vroman effect [33] is not relevant to the experimental conditions used in this study since BSA is the only protein in solution. It is likely that the observed maximum of BSA adsorption in the kinetic experiments in early stages reflects the conformational changes in the first layer of the adsorbed BSA molecules, which occur slower than the initial adsorption. The initial conformation of BSA adsorbed in the first layer might allow weak or co-operative attraction of other BSA molecules which ceases to exist once the BSA molecules at the surface underwent further conformational changes thus releasing the weakly retained molecules back in solution [34,35].
A significantly higher adsorption capacity of porous graphene nanoplatelets (surface area 286 m2/g, pore volume 0.48 cm3/g) for BSA (Figure 5) compared to the expanded graphite materials with a smaller surface area (Figure 4) suggests that a significant proportion of pores in GnP are accessible to BSA molecules. However, using graphene nanoplatelets directly as an oral or hemoadsorbent or for drug delivery might be problematic due to the nanoparticle release into the body. Although after four cycles of centrifugation (3500 rpm), no particles were observed visually, they were clearly detectable after filtration of the GnP supernatant using a polypropylene membrane (Celgard, pore size 0.064 µm), (insert in Figure 5). It confirms that GnP cannot be used in direct contact with blood and other tissues without additional granulation or coating. In contrast to GnP, no nanoparticles were found in the supernatant when expanded graphite materials were used.
The applicability of the pseudo-second order equation for the description of adsorption kinetics usually means that the overall adsorption process is controlled by the rate of direct adsorption as the slowest step, which can be interpreted as a specific interaction between the adsorbate and the adsorbent surface [37,38]. Taking into account low porosity of the EGr materials with predominance of mesopores, alternative interpretations of the applicability of this equation, such as intra-particle diffusion controlled adsorption, are not likely to be relevant.
3.3. BSA Adsorption Isotherms
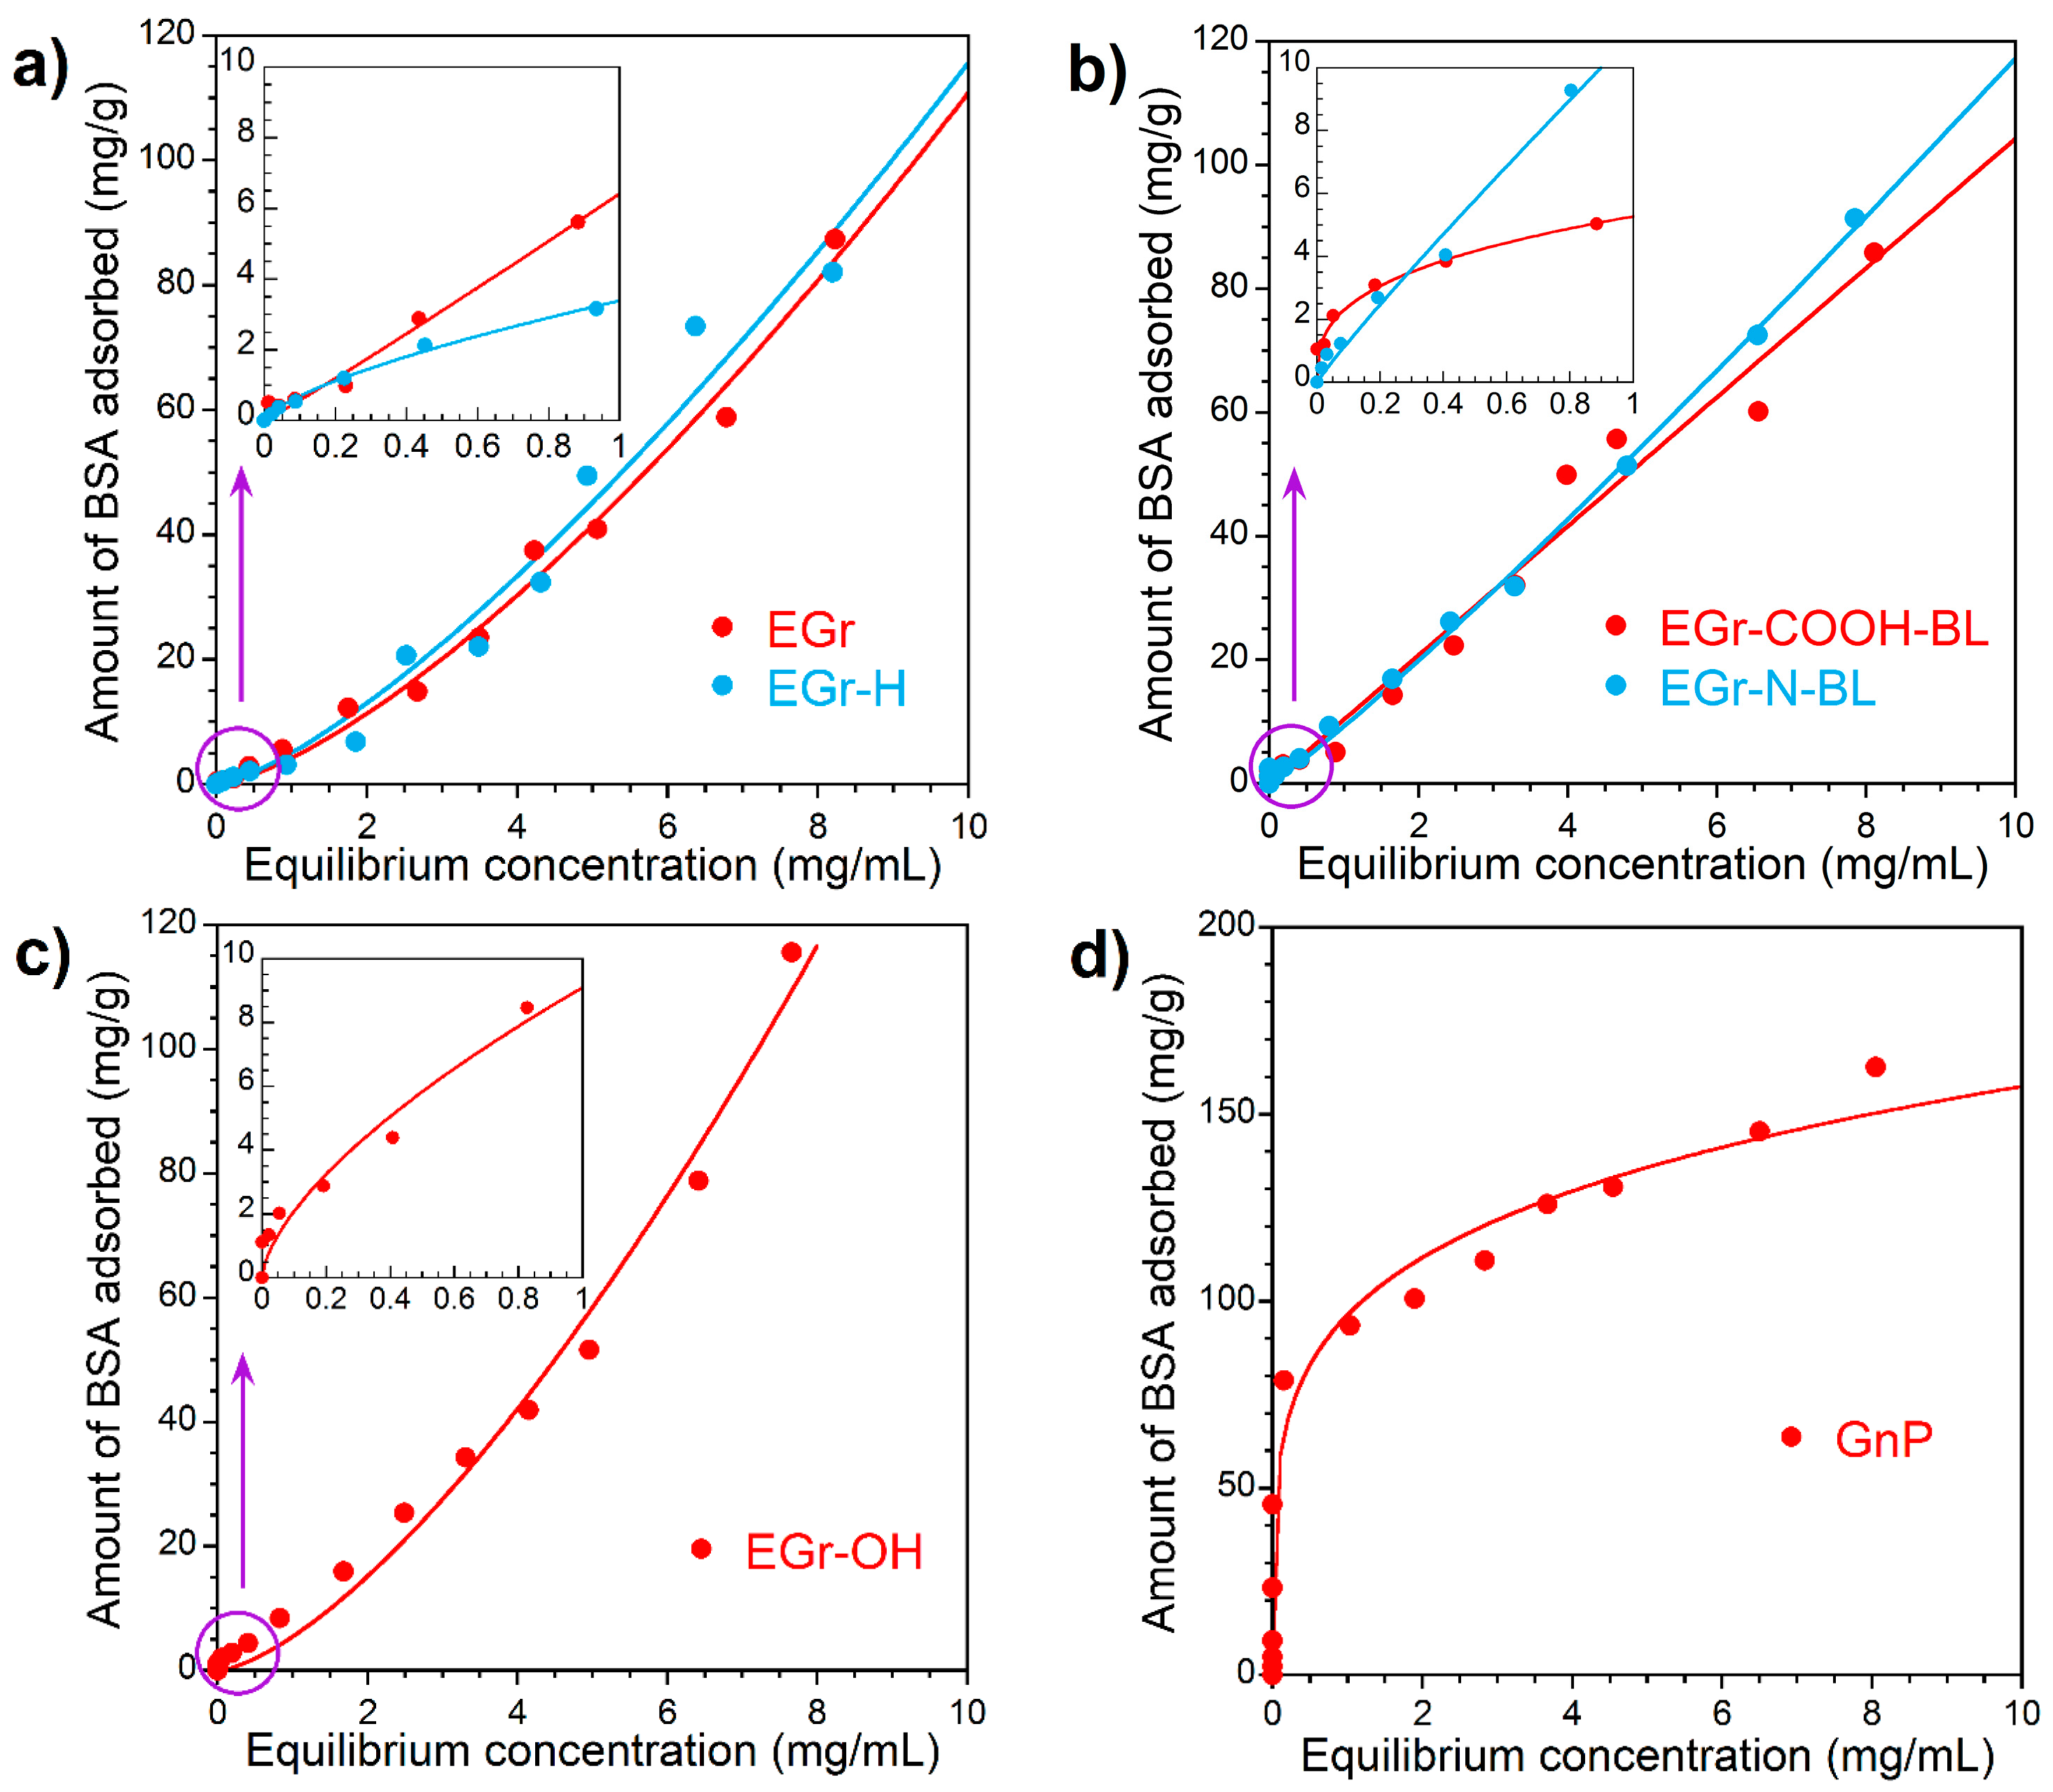
BSA consists of 583 amino acid residues and forms a single polypeptide chain, crystallized in a monoclinic crystal form with two chains present in the asymmetric unit. The helical content is 74% and each has seventeen conserved disulfide bonds and a free thiol group [36]. Protein Data Bank (PDB) number of the BSA used in our work was 3V03 [36]. It is known that negatively charged groups of the first and second domains of the amino acid sequences of BSA (molecular mass 66.382 kDa and molecule dimensions 14 nm × 4 nm × 4 nm) [39] are positioned inside the globules, while the positively charged groups are located on the surface of the globule [40]. Binding of BSA to the surface groups of expanded graphite can occur due to both hydrophobic and electrostatic interactions and the albumin monolayer formation on the surface undergo via side-on and/or end-on orientation. The kinetic experiments described in the previous section indirectly support this mechanism of BSA adsorption to the carbon surface. Figure 6 shows BSA adsorption isotherms from PBS on the initial and modified expanded graphite. The shape of BSA adsorption isotherms demonstrates the S-type adsorption mechanism according to the Giles classification [41], which can be clearly seen at low equilibrium concentrations of the protein (inserts in Figure 6). Assuming that the adsorbed BSA molecule occupies a surface of 14 nm × 4 nm, the adsorbed amount of 4 mg/g carbon material corresponds to the surface coverage of 2 m2. For EGr-COOH, EGr-N and EGr-OH materials which have very low specific surface areas of 2–3 m2/g, it means that even at such a low equilibrium concentration of BSA in solution as 0.2–0.8 mg/mL a full coverage of the surface by BSA layer is reached. The shape of the adsorption isotherm at higher equilibrium BSA concentrations suggests the multi-layer adsorption mechanism. EGr and EGr-H materials show a similar trend although their specific surface area is significantly larger, 30 and 50 m2/g, respectively. At a high concentration of solute in the solution, the adsorption capacity significantly increases indicating no saturation limit. At low equilibrium concentration, the differences between EGr materials in their adsorption behavior towards BSA are noticeable, whereas at high equilibrium concentrations the adsorption isotherms become very similar. Therefore, the surface functional groups contribute to the specific short-range attraction of protein molecules forming the first adsorption layer. At higher solute concentrations, the differences in surface chemistry between EGr materials play no role in the formation of multilayers, which are formed by the interaction between BSA molecules.
In the case of graphene nanoplatelets (Figure 6d) the shape of BSA adsorption isotherm exhibits L “Langmuir” type suggesting the monolayer formation on the surface. The adsorption isotherm of BSA on GnP shows a tendency to reach a plateau, while no saturation was reached for expanded graphite materials. At 100 mg/g BSA adsorbed the surface coverage corresponds to ca. 50 m2 in a flat orientation or about 200 m2 in the perpendicular orientation of molecules on the surface. Taking into account that GnP has a specific surface area of 286 m2/g, the L-shape of the adsorption isotherm on GnP is not an unreasonable interpretation of the experimental data as it may indicate the complete monolayer coverage at high equilibrium concentrations of BSA. Graphene nanoplatelets exhibit the highest affinity for BSA adsorption at low equilibrium concentrations; GnP has well-developed mesoporosity (0.408 cm3/g) with an average pore size in the range of 3–15 nm. Comparing the pore size with the size of BSA molecule (14 nm × 4 nm × 4 nm) [39] suggests that there is low steric hindrance for BSA adsorption which explains the high adsorption capacity of GnP (Figure 6d) and fast adsorption kinetics (Figure 5).
The equilibrium data was fitted using the Freundlich model [42], an empirical isotherm that can be used for non-ideal adsorption that involves heterogeneous sorption with a non-uniform population of adsorption sites. The fitting parameters of BSA adsorption isotherms presented in Table 4 show that KF relates to the multilayer adsorption capacity and n represents the heterogeneity of the site energies. The results support the multilayer mechanism of BSA adsorption. For the homogeneous surface of expanded graphite n is close to 1. It is notable that both Freundlich and Langmuir-Freundlich adsorption models led to about the same n value. Using Langmuir-Freundlich equation gives an estimation of the maximum BSA adsorption capacities, which are very high on expanded graphite materials, in the range of 9–22 grams of BSA per gram of adsorbent.
4. Conclusions
We have investigated the adsorption of BSA on “flat” expanded graphite surfaces with different surface chemistry and porous textures. The data obtained show that the protein layers’ formation correlates well with the hydrophobic nature of expanded graphite resulting in effective adsorption of hydrophobic segments of BSA. Expanded graphite’s “accordion-like” texture consisting of large graphite flakes facilitates adsorption of large amount of protein which reveals their potential as large molecular weight drug delivery carriers and high protein fouling resistance if they are used as membranes. At low equilibrium concentration of BSA functionalized expanded graphite surfaces adsorbed protein via electrostatic interactions, which play an important role in protein adsorption phenomena. Incorporation of -O or -N functional groups results in more specific attraction of protein molecules to the surface and improved materials adsorption capacity owing to the formation of binding sites for BSA. The protein adsorption mechanism includes protein-surface interactions of various strength; strong, weak or co-operative adsorption of BSA molecules on the surface which depends on the surface chemistry. The results presented in this study support the importance of mesopores with the dimensions capable of accommodating large proteinaceous molecules. This study shows evidence of protein adsorption dependence on the textural parameters of expanded graphite at both low and high equilibrium concentrations. The BSA adsorption equilibrium on EGr materials is reached very fast, within 5 to 60 min. At low equilibrium protein concentration, the surface chemistry plays an important role in BSA adsorption. In terms of practical applications in medicine, the fast adsorption kinetics of BSA by EGr materials indicates their good biocompatibility with blood and their ability to adsorb large molecules, which could be beneficial in the treatment of wounds and other inflammatory conditions, when the removal of pro-inflammatory cytokines, which are proteins with molecular weight between 5 and 51 kDa, is important.
Supplementary Materials
The supporting material is available online at https://www.mdpi.com/2311-5629/4/1/3/s1. It includes UV-visible absorption spectra and calibration curve of BSA and N 1s core energy levels for aminated (EGr-N) sample.
Acknowledgments
We thank Patrick Urbankowski for the XPS analysis. This work was supported by the Hemolife Medical, Inc., Dana Point, CA, USA.
Author Contributions
The experimental design was conceived by Mykola Seredych, Lyuba Mikhalovska, Sergey Mikhalovsky and Yury Gogotsi. Mykola Seredych synthesized carbon-based materials and carried out BSA sorption experiments. Mykola Seredych and Sergey Mikhalovsky wrote the manuscript. All authors reviewed the manuscript prior to submission.
Conflicts of Interest
The authors declare no conflict of interest.
References
- Bokros, J.C. Deposition, Structure and Properties of Pyrolytic Carbon. In Chemistry and Physics of Carbon; Walker, P.L., Ed.; Dekker: New York, NY, USA, 1969; Volume 5, pp. 1–118. [Google Scholar]
- Mikhalovsky, S.V.; Sandeman, S.R.; Howell, C.A.; Phillips, G.J.; Nikolaev, V.G. Biomedical Applications of Carbon Adsorbents. In Novel Carbon Adsorbents; Tascon, J.M.D., Ed.; Elsevier Ltd.: Amsterdam, The Netherlands, 2012; Chapter 21; pp. 639–669. [Google Scholar]
- Ray, S.C.; Jana, N.R. Carbon Nanomaterials for Biological and Medical Applications, 1st ed.; Elsevier: Amsterdam, The Netherlands, 2017; pp. 1–231. [Google Scholar]
- Kostarelos, K.; Novoselov, K.S. Graphene Devices for Life. Nat. Nanotechnol. 2014, 9, 744–745. [Google Scholar] [CrossRef] [PubMed]
- Yang, C.; Denno, M.E.; Pyakurel, P.; Venton, B.J. Recent Trends in Carbon Nanomaterial-Based Electrochemical Sensors for Biomolecules: A Review. Anal. Chim. Acta 2015, 887, 17–37. [Google Scholar] [CrossRef] [PubMed]
- Dee, K.C.; Puleo, D.A.; Bizios, R. An Introduction to Tissue-Biomaterial Interactions; Wiley-Liss, Inc.: Hoboken, NJ, USA, 2002; pp. 1–219. [Google Scholar]
- Tang, L.; Eaton, J.W. Natural Responses to Unnatural Materials: A Molecular Mechanism for Foreign Body Reactions. Mol. Med. 1999, 5, 351–358. [Google Scholar] [PubMed]
- Hu, W.; Peng, C.; Lv, M.; Li, X.; Zhang, Y.; Chen, N.; Fan, C.; Huang, Q. Protein Corona-Mediated Mitigation of Cytotoxicity of Graphene Oxide. ACS Nano 2011, 5, 3693–3700. [Google Scholar] [CrossRef] [PubMed]
- Krummel, T.; Hannedouche, T. Clinical Potentials of Adsorptive Dialysis Membranes. Blood Purif. 2013, 35 (Suppl. 2), 1–4. [Google Scholar] [CrossRef] [PubMed]
- Tengvall, P.; Lundstrom, I.; Liedberg, B. Protein Adsorption Studies on Model Organic Surfaces: An Ellipsometric and Infrared Spectroscopic Approach. Biomaterials 1998, 19, 407–422. [Google Scholar] [CrossRef]
- Yachamaneni, S.; Yushin, G.; Yeon, S.-H.; Gogotsi, Y.; Howell, C.; Sandeman, S.; Phillips, G.; Mikhalovsky, S. Mesoporous Carbide-Derived Carbon for Cytokine Removal from Blood Plasma. Biomaterials 2010, 31, 4789–4794. [Google Scholar] [CrossRef] [PubMed]
- Yushin, G.; Hoffman, E.N.; Barsoum, M.W.; Gogotsi, Y.; Howell, C.A.; Sandeman, S.R.; Phillips, G.J.; Lloyd, A.W.; Mikhalovsky, S.V. Mesoporous Carbide-Derived Carbon with Porosity Tuned for Efficient Adsorption of Cytokines. Biomaterials 2006, 27, 5755–5762. [Google Scholar] [CrossRef] [PubMed]
- Presser, V.; Yeon, S.-H.; Vakifahmetoglu, C.; Howell, C.A.; Sandeman, S.R.; Colombo, P.; Mikhalovsky, S.; Gogotsi, Y. Cytokine Removal: Hierarchical Porous Carbide-Derived Carbons for the Removal of Cytokines from Blood Plasma. Adv. Healthc. Mater. 2012, 1, 796–800. [Google Scholar] [CrossRef] [PubMed] [Green Version]
- Howell, C.A.; Sandeman, S.R.; Phillips, G.J.; Lloyd, A.W.; Davies, J.G.; Mikhalovsky, S.V.; Tennison, S.R.; Rawlinson, A.P.; Kozynchenko, O.P.; Owen, H.L.H.; et al. The In Vitro Adsorption of Cytokines by Polymer-Pyrolysed Carbon. Biomaterials 2006, 27, 5286–5291. [Google Scholar] [CrossRef] [PubMed]
- Tripisciano, C.; Kozynchenko, O.P.; Linsberger, I.; Phillips, G.J.; Howell, C.A.; Sandeman, S.R.; Tennison, S.R.; Mikhalovsky, S.V.; Weber, V.; Falkenhagen, D. Activation-Dependent Adsorption of Cytokines and Toxins Related to Liver Failure to Carbon Beads. Biomacromolecules 2011, 12, 3733–3740. [Google Scholar] [CrossRef] [PubMed] [Green Version]
- Fuchigami, Y.; Nakashima, T. Fibrous Adsorbent for Hemoperfusion. U.S. Patent 4,248,736, 3 February 1981. [Google Scholar]
- Howell, C.A.; Sandeman, S.R.; Zheng, Y.; Mikhalovsky, S.V.; Nikolaev, V.G.; Sakhno, L.A.; Snezhkova, E.A. New Dextran Coated Activated Carbons for Medical Use. Carbon 2016, 97, 134–146. [Google Scholar] [CrossRef]
- Malmsten, M. Formation of Adsorbed Protein Layers. J. Colloid Interface Sci. 1998, 207, 186–199. [Google Scholar] [CrossRef] [PubMed]
- Nakanishi, K.; Sakiyama, T.; Imamura, K. On the Adsorption of Proteins on Solid Surfaces, a Common but Very Complicated Phenomenon. J. Biosci. Bioeng. 2001, 91, 233–244. [Google Scholar] [CrossRef]
- Wanci, S.; Shizhu, W.; Naizhen, C.; Lu, Z.; Wei, Z.; Yingjie, L.; Jialin, G. Expanded Graphite. A New Kind of Biomedical Material. Carbon 1999, 37, 356–358. [Google Scholar] [CrossRef]
- Ma, C.-F.; Gao, Q.; Xia, K.-S.; Huang, Z.-Y.; Han, B.; Zhou, C.-G. Three-Dimensionally Porous Graphene: A High-Performance Adsorbent for Removal of Albumin-Bonded Bilirubin. Colloids Surf. B: Biointerfaces 2017, 149, 146–153. [Google Scholar] [CrossRef] [PubMed]
- Sengupta, B.; Gregory, W.E.; Zhu, J.; Dasetty, S.; Karakaya, M.; Brown, J.M.; Rao, A.M.; Barrows, J.K.; Sarupria, S.; Podila, R. Influence of Carbon Nanomaterial Defects on the Formation of Protein Corona. RSC Adv. 2015, 5, 82395–82402. [Google Scholar] [CrossRef] [PubMed]
- Yaroshenko, A.P.; Savos’kin, M.V.; Magazinskii, A.N.; Shologon, V.I.; Mysyk, R.D. Synthesis and Properties of Thermally Expandable Residual Graphite Hydrosulfite Obtained in the System HNO3-H2SO4. Russ. J. Appl. Chem. 2002, 75, 861–865. [Google Scholar] [CrossRef]
- Boehm, H.P. Some Aspects of the Surface Chemistry of Carbon Black and other Carbons. Carbon 1994, 32, 759–769. [Google Scholar] [CrossRef]
- Li, X.; Biswas, S.; Drzal, L.T. High Temperature Vacuum Annealing and Hydrogenation Modification of Exfoliated Graphite Nanoplatelets. J. Eng. 2013, 2013, 1–10. [Google Scholar] [CrossRef]
- Ho, Y.S.; McKay, G. Sorption of Dye from Aqueous Solution by Peat. Chem. Eng. J. 1998, 70, 115–124. [Google Scholar] [CrossRef]
- Brunauer, S.; Emmett, P.H.; Teller, E. Adsorption of Gases in Multimolecular Layers. J. Am. Chem. Soc. 1938, 60, 309–319. [Google Scholar] [CrossRef]
- Jagiello, J.; Olivier, J.P. Carbon Slit Pore Model Incorporating Surface Energetical Heterogeneity and Geometrical Corrugation. Adsorption 2013, 19, 777–783. [Google Scholar] [CrossRef]
- Chung, D.D.L. A Review of Exfoliated Graphite. J. Mater. Sci. 2016, 51, 554–568. [Google Scholar] [CrossRef]
- Zheng, Y.; Pescatore, N.; Gogotsi, Y.; Dyatkin, B.; Ingavle, G.; Mochalin, V.; Ozulumba, T.; Mikhalovsky, S.; Sandeman, S. Rapid Adsorption of Pro-inflammatory Cytokines by Graphene Nanoplatelets and Their Composites for Extracorporeal Detoxification. J. Nanomater. 2018, in press. [Google Scholar]
- Kharlamova, M.V.; Mochalin, V.N.; Lukatskaya, M.R.; Niu, J.; Presser, V.; Mikhalovsky, S.; Gogotsi, Y. Adsorption of Proteins in Channels of Carbon Nanotubes: Effect of Surface Chemistry. Mater. Express 2013, 3, 1–10. [Google Scholar] [CrossRef]
- Adamczyk, Z.; Jaszczolt, K.; Michna, A.; Siwek, B.; Szyk-Warszynska, L.; Zembala, M. Irreversible Adsorption of Particles on Heterogeneous Surfaces. Adv. Colloid Interface Sci. 2005, 118, 25–42. [Google Scholar] [CrossRef] [PubMed]
- Vroman, L.; Adams, A.L.; Fischer, G.C.; Munoz, P.C. Interaction of High Molecular Weight Kininogen, Factor XII and Fibrinogen in Plasma at Interfaces. Blood 1980, 55, 156–159. [Google Scholar] [PubMed]
- Kubiak-Ossowska, K.; Jachimska, B.; Mulheran, P.A. How Negatively Charged Proteins Adsorb to Negatively Charged Surfaces: A Molecular Dynamics Study of BSA Adsorption on Silica. J. Phys. Chem. B 2016, 120, 10463–10468. [Google Scholar] [CrossRef] [PubMed]
- Kubiak-Ossowska, K.; Tokarczyk, K.; Jachimska, B.; Mulheran, P.A. Bovine Serum Albumin Adsorption at a Silica Surface Explored by Simulation and Experiment. J. Phys. Chem. B 2017, 121, 3975–3986. [Google Scholar] [CrossRef] [PubMed]
- Majorek, K.A.; Porebski, P.J.; Dayal, A.; Zimmerman, M.D.; Jablonska, K.; Stewart, A.J.; Chruszcz, M.; Minor, W. Structural and Immunologic Characterization of Bovine, Horse and Rabbit Serum Albumins. Mol. Immunol. 2012, 52, 174–182. [Google Scholar] [CrossRef] [PubMed]
- Plazinski, W.; Rudzinski, W.; Plazinska, A. Theoretical Models of Sorption Kinetics Including a Surface Reaction Mechanism: A Review. Adv. Colloid Interface Sci. 2009, 152, 2–13. [Google Scholar] [CrossRef] [PubMed]
- Kuchlyan, J.; Kundu, N.; Banik, D.; Roy, A.; Sarkar, N. Spectroscopy and Fluorescence Lifetime Imaging Microscopy to Probe the Interaction of Bovine Serum Albumin with Graphene Oxide. Langmuir 2015, 31, 13793–13801. [Google Scholar] [CrossRef] [PubMed]
- Wright, A.K.; Thompson, M.R. Hydrodynamic Structure of Bovine Serum Albumin Determined by Transient Electric Birefringence. Biophys. J. 1975, 15, 137–141. [Google Scholar] [CrossRef]
- Luik, A.I.; Lukianchuk, V.D. Serum Albumin and Biotransport of Poison; Medicina: Moscow, Russia, 1984; p. 224. [Google Scholar]
- Giles, C.; McEwan, T.; Nakhwa, S.; Smith, D.J. Studies in Adsorption. Part XI. A System of Classification of Solution Adsorption Isotherms and its Use in Diagnosis of Adsorption Mechanisms and in Measurement of Specific Surface Areas of Solids. J. Chem. Soc. 1960, 3973–3993. [Google Scholar] [CrossRef]
- Freundlich, H.M.F. Über die Adsorption in Lösungen. Z. Phys. Chem. 1906, 57, 385–470. [Google Scholar] [CrossRef]
Figure 1.
Schematic showing the processing steps from natural graphite to the expanded graphite (EGr), surface modifications: carboxylated (EGr-COOH), hydroxylated (EGr-OH) and aminated (EGr-N) and graphene nanoplatelets (GnP).
Figure 1.
Schematic showing the processing steps from natural graphite to the expanded graphite (EGr), surface modifications: carboxylated (EGr-COOH), hydroxylated (EGr-OH) and aminated (EGr-N) and graphene nanoplatelets (GnP).
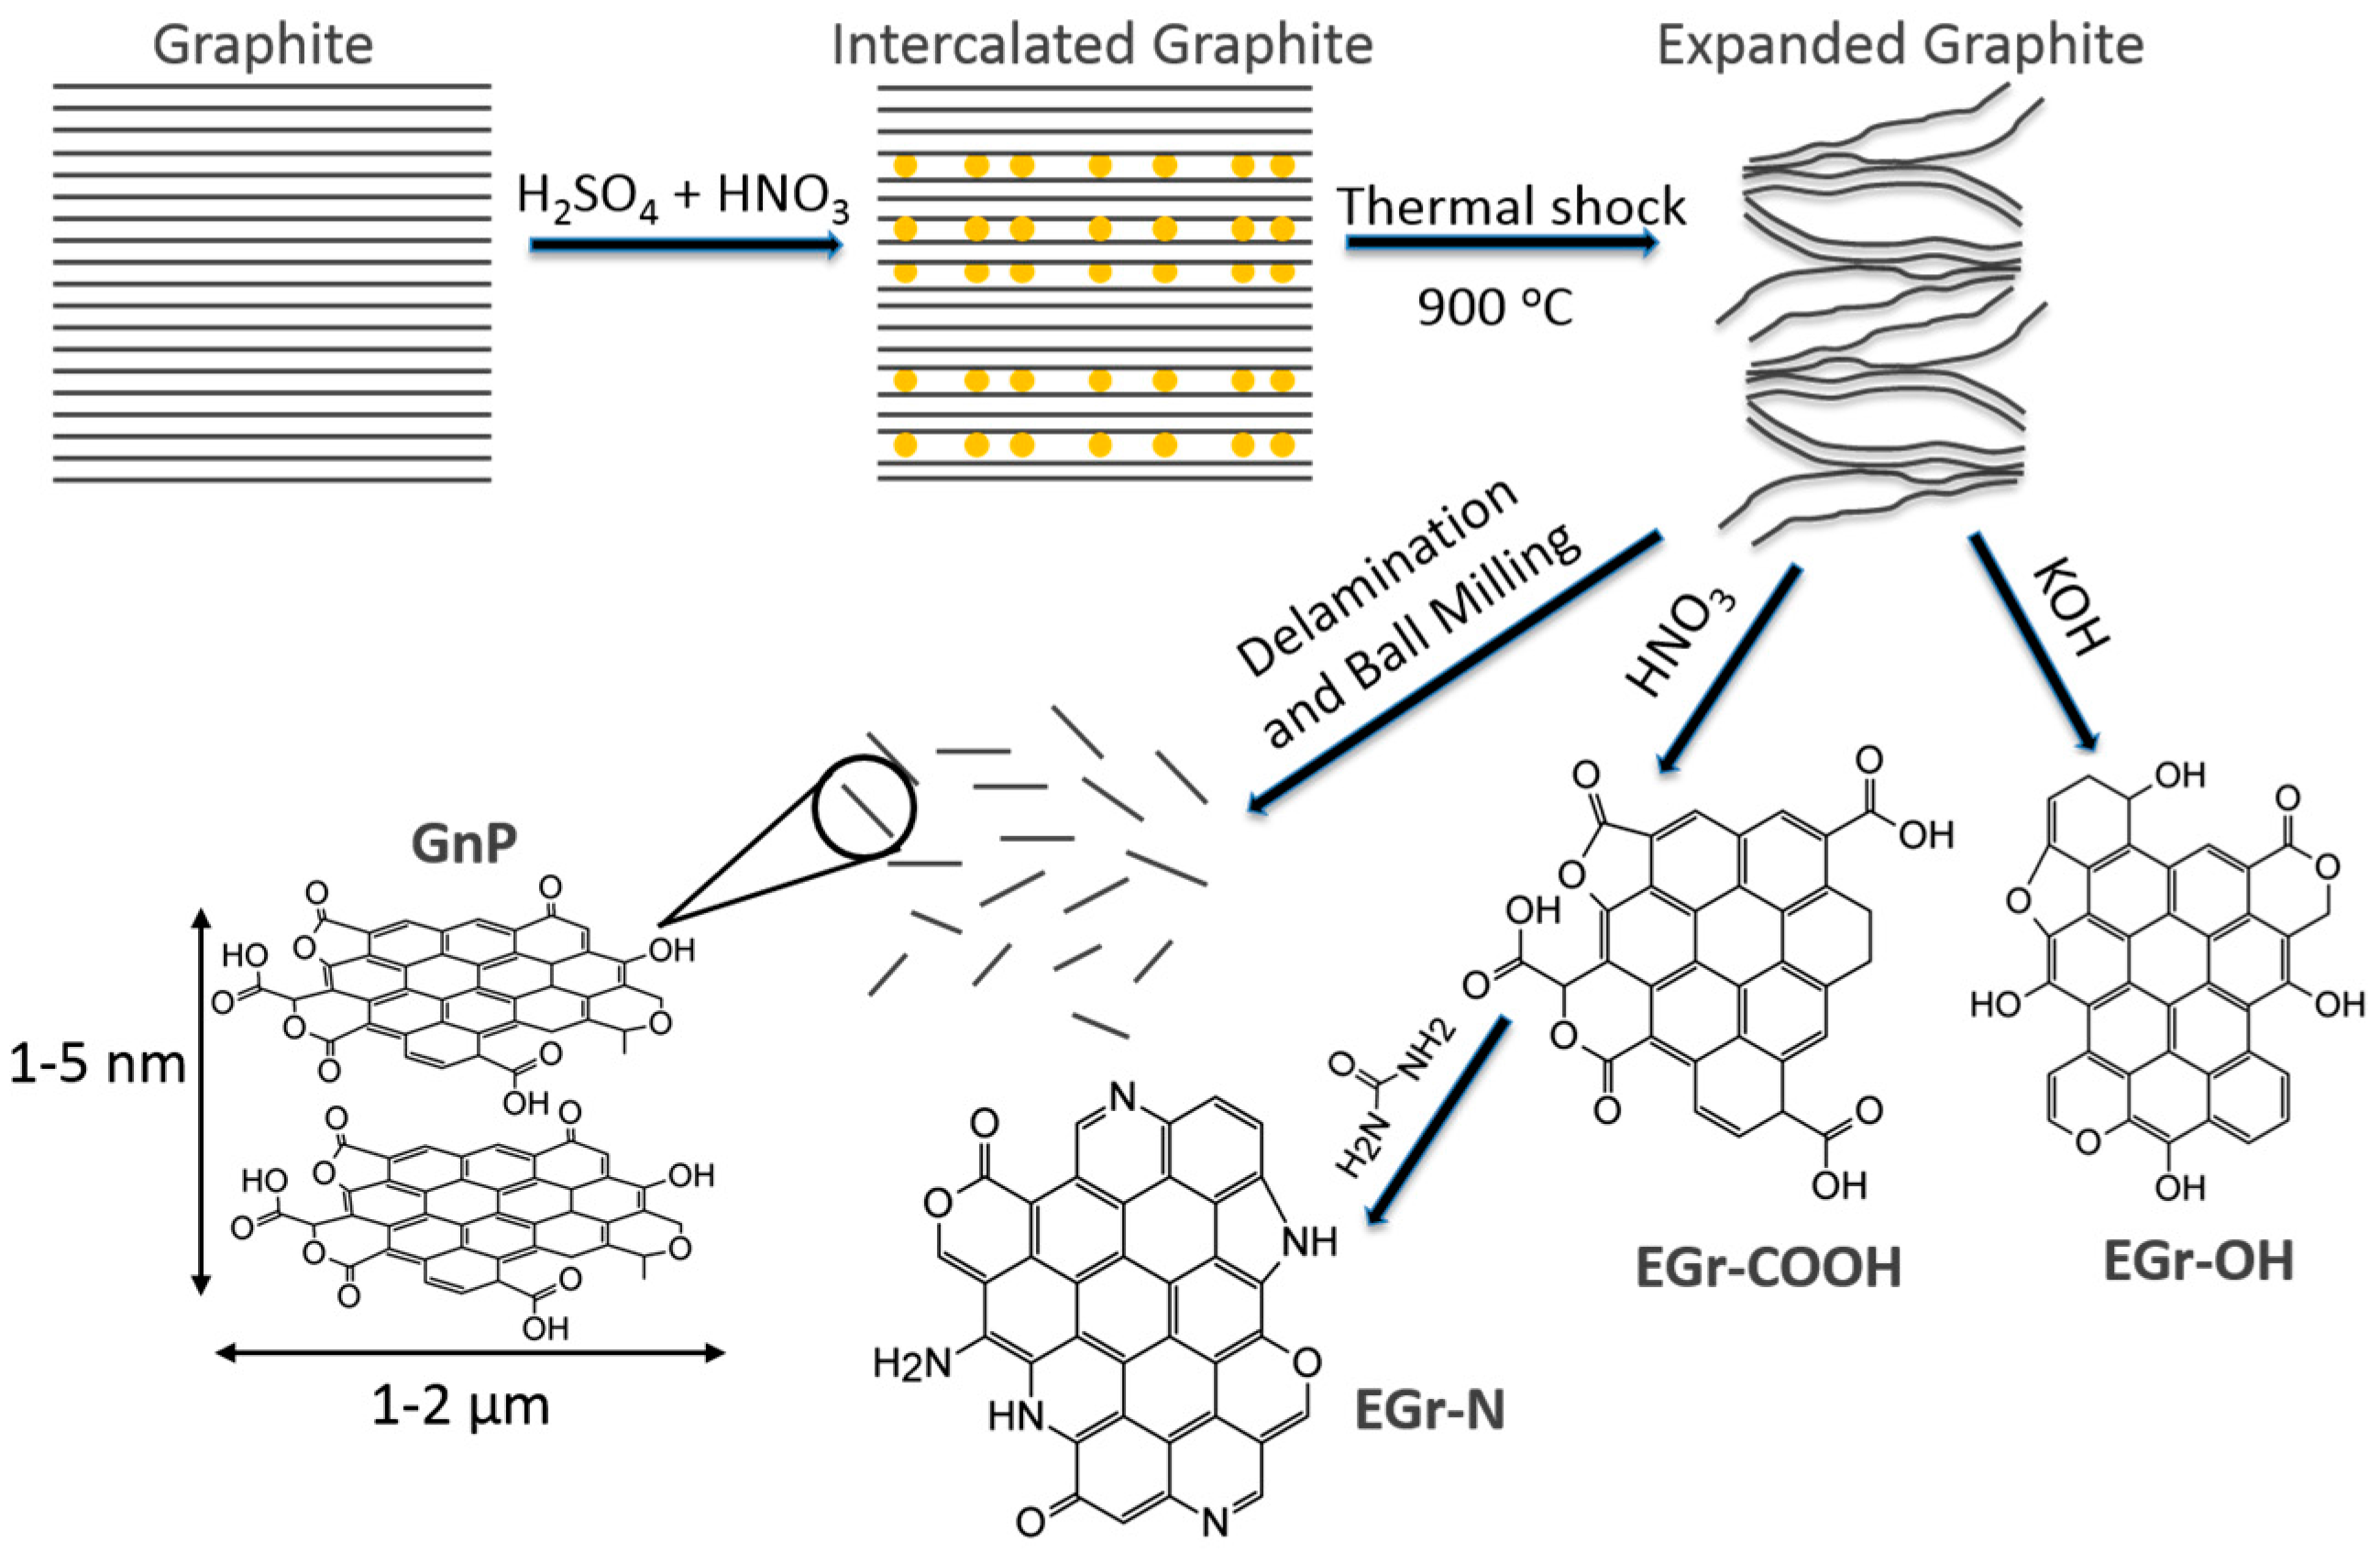
Figure 2.
(a) Cumulative pore volume vs. pore width using Barrett-Joyner-Halenda (BJH) model; (b) Pore size distributions calculated using two-dimensional nonlocal density functional theory 2D-NLDFT and (c) specific surface area (SBET) calculated using BET model and total pore volume for the materials studied (in logarithmic scale).
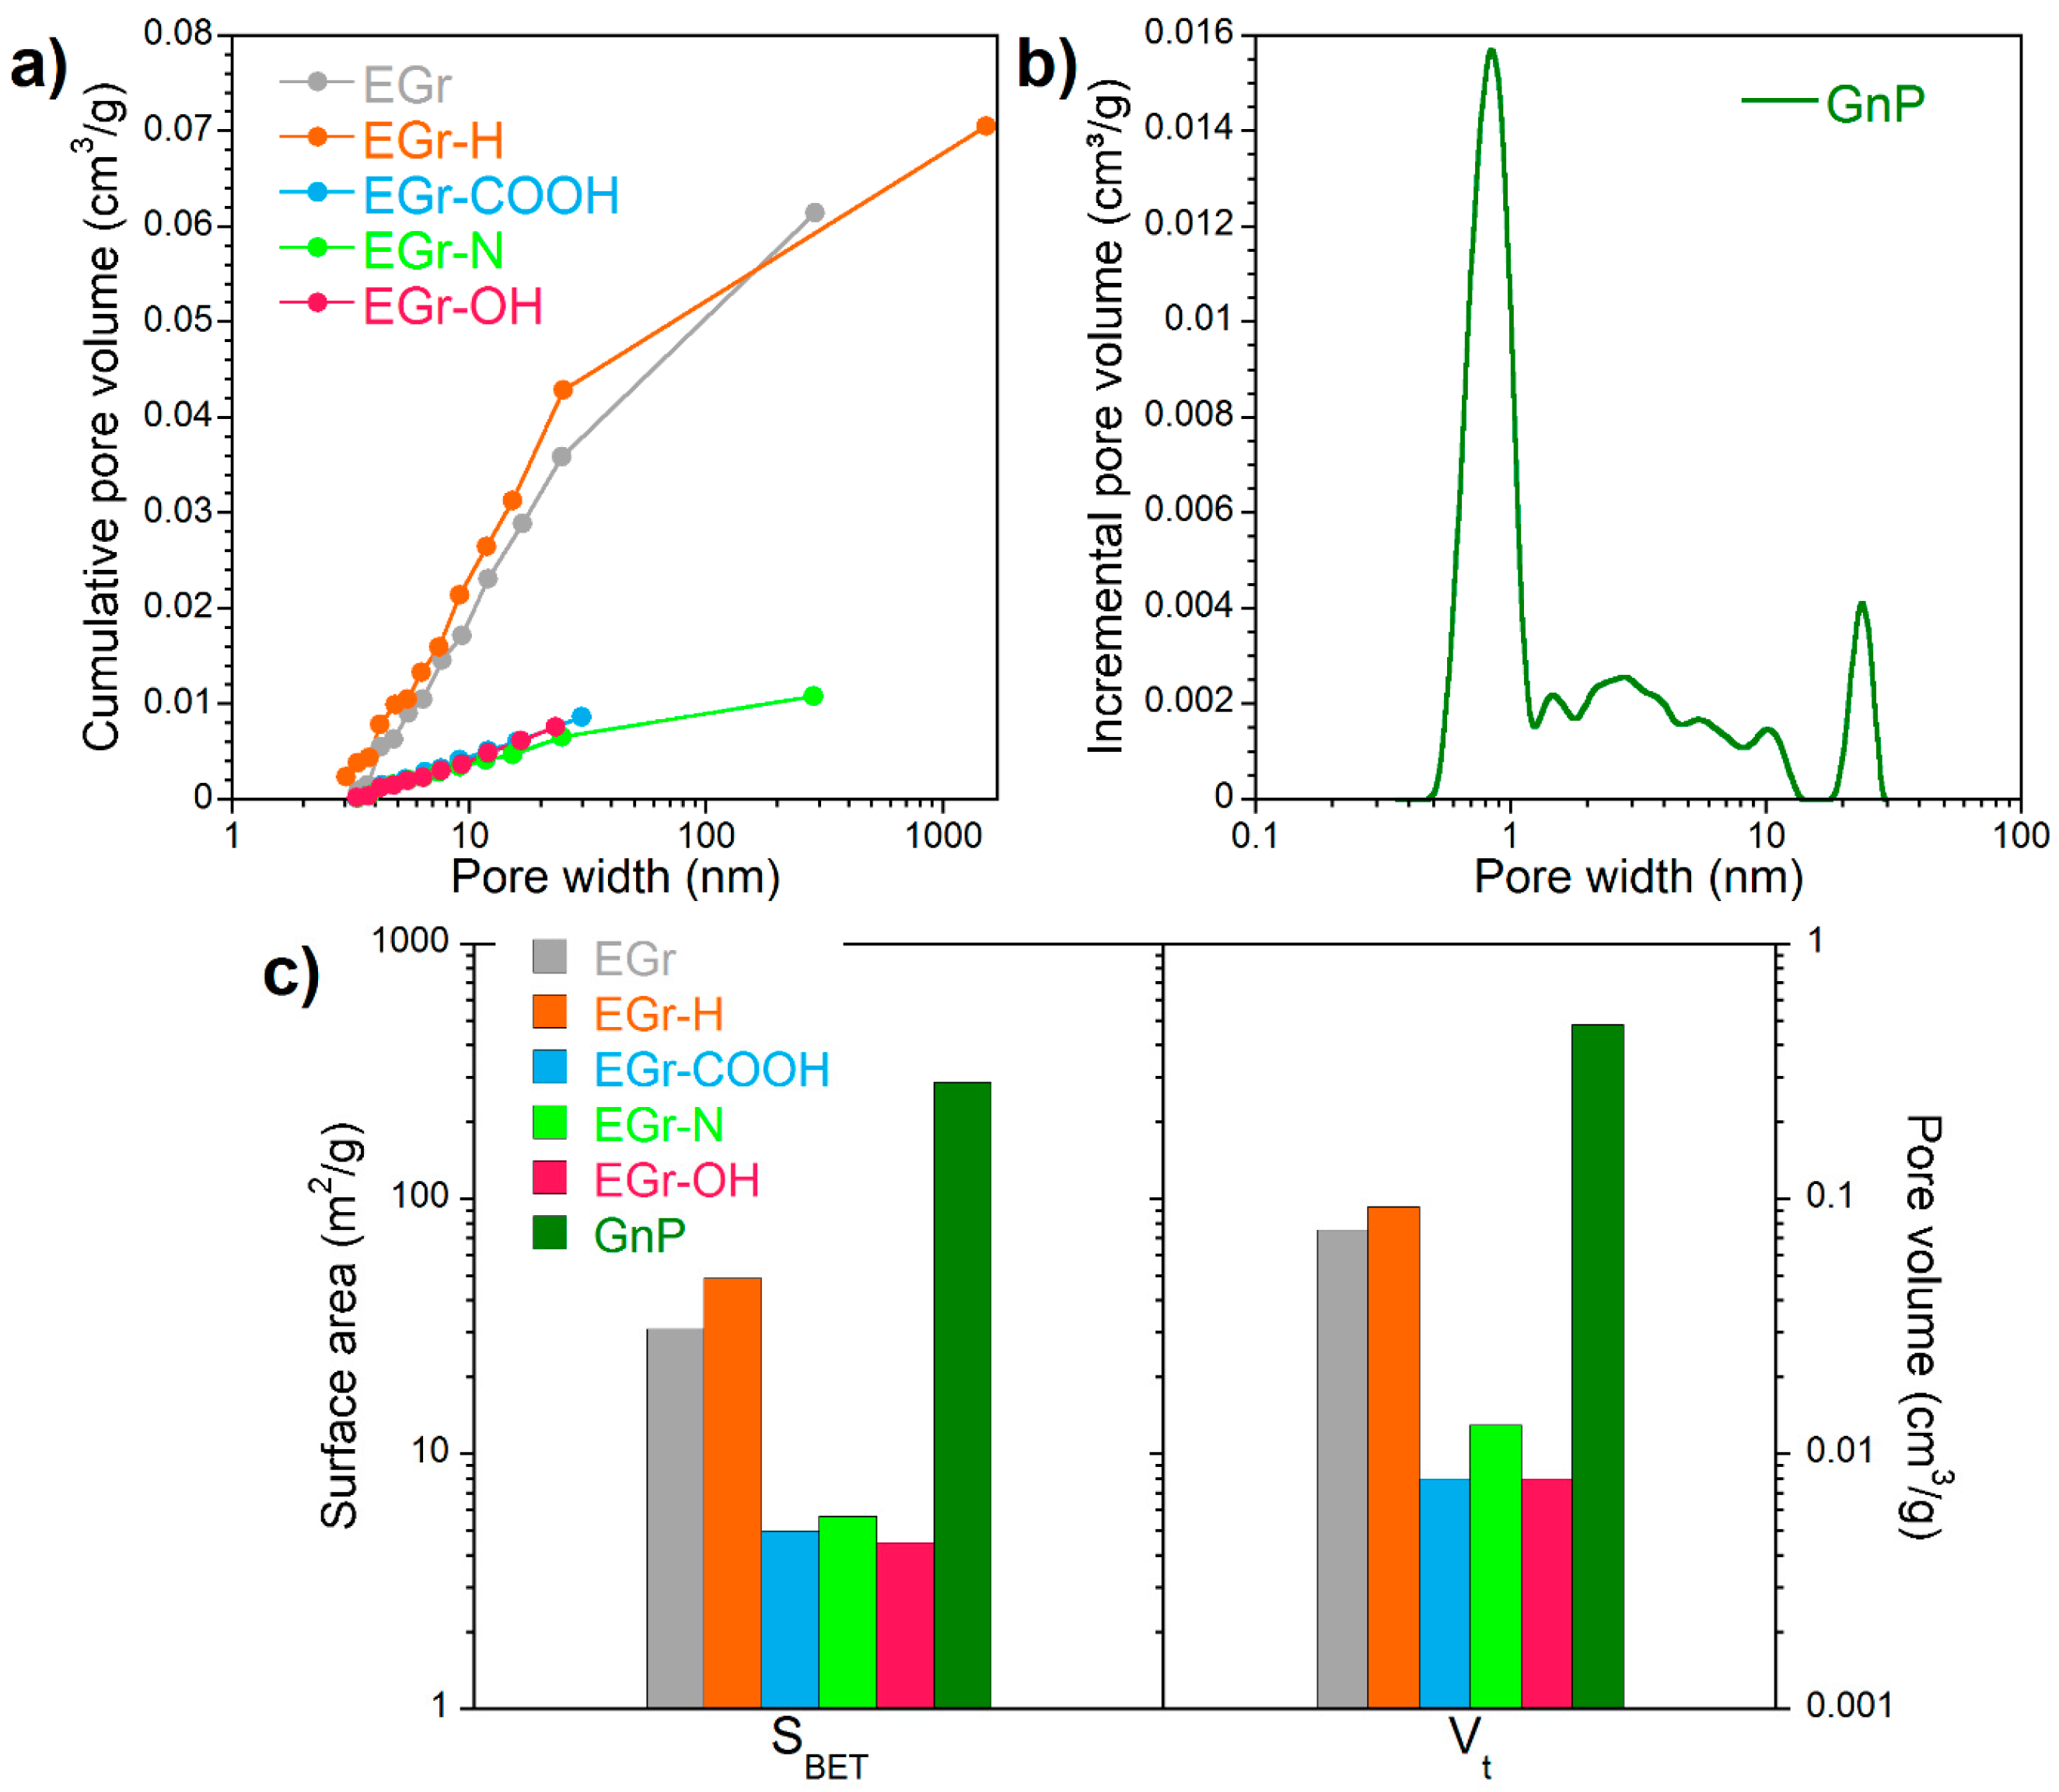
Figure 3.
Scanning electron microscopy (SEM) image of expanded graphite.

Figure 4.
The kinetics of bovine serum albumin (BSA) adsorption from phosphate-buffered saline (PBS): (a) on as-received (EGr) and heated at 900 °C (EGr-H); (b) carboxylated (EGr-COOH); (c) aminated (EGr-N) and (d) hydroxylated (EGr-OH) expanded graphite samples (mass loading ~100 mg; initial concentration of BSA 1 mg/mL; liquid phase volume 5 mL). Inset in Figure 4d is the crystal structure of Bovine Serum Albumin [36]. The experimental data was fitted using the pseudo-second-order kinetic model.

Figure 5.
The kinetics of BSA adsorption from PBS on the graphene nanoplatelets (mass loading ~100 mg; initial concentration of BSA 2 mg/mL; liquid phase volume 10 mL). Inside of the Figure is filter paper showing visible small particles post filtration. The experimental data was fitted using the pseudo-second-order kinetic model.
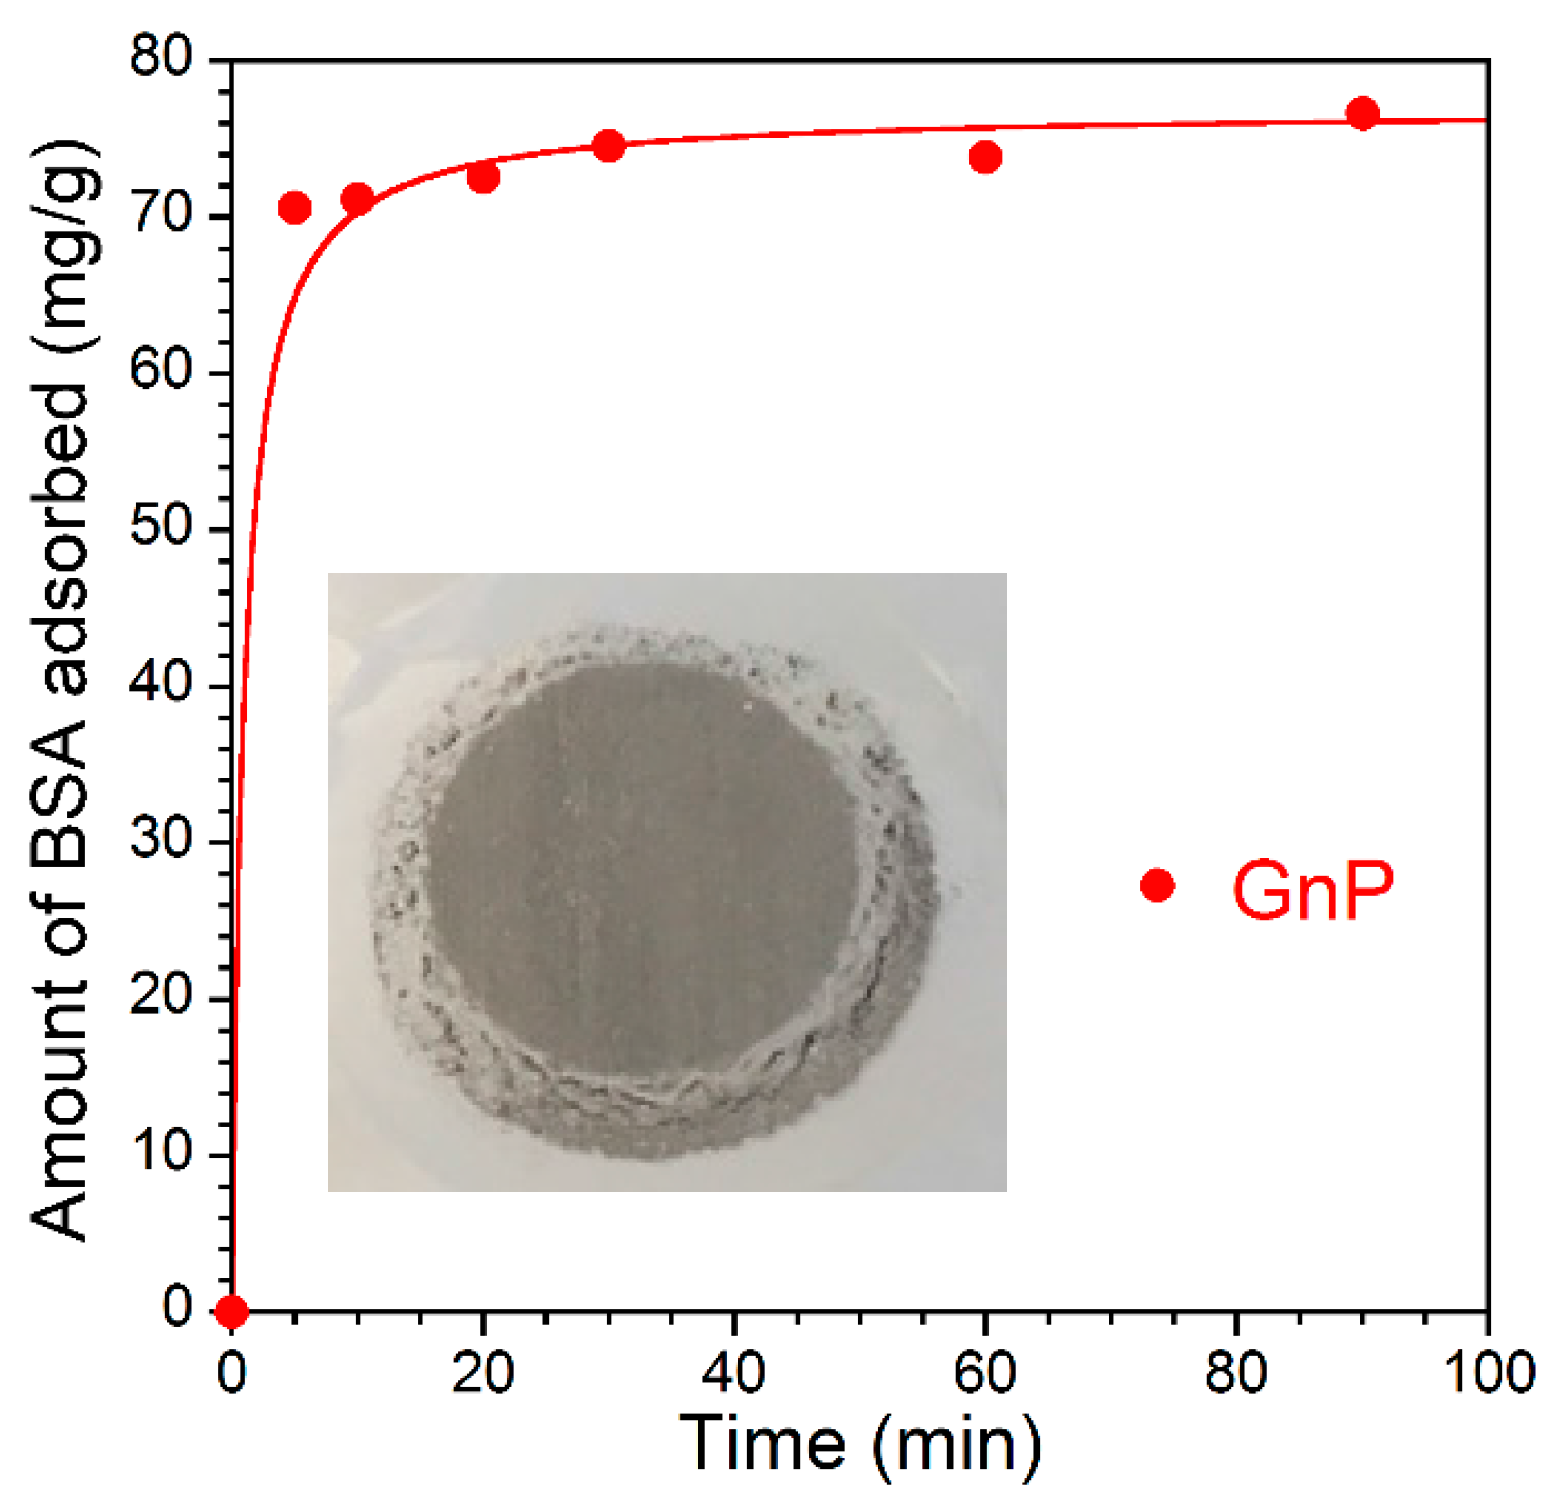
Figure 6.
BSA adsorption isotherms: (a) on as-received (EGr) and heated at 900 °C (EGr-H); (b) carboxylated (EGr-COOH, bottom layer) and aminated (EGr-N, bottom layer); (c) hydroxylated (EGr-OH) expanded graphite’s and (d) on the graphene nanoplatelets (as-received GnP) in the range of concentration (0.025–10.0 mg/mL) (Inside of the Figure: BSA adsorption isotherm in the range of concentration 0.025–1.0 mg/mL). The equilibrium data was fitted using the Freundlich model.

Table 1.
Atomic concentration of elements on the surface determined by X-ray photoelectron spectroscopy (XPS) for the materials studied.
Table 1.
Atomic concentration of elements on the surface determined by X-ray photoelectron spectroscopy (XPS) for the materials studied.
| Sample | Atomic Concentration (%) | ||
|---|---|---|---|
| C | O | N | |
| EGr | 97.2 | 2.8 | ND * |
| EGr-H | 97.3 | 2.7 | ND |
| EGr-COOH | 96.1 | 3.9 | ND |
| EGr-N | 96.8 | 2.0 | 1.2 |
| EGr-OH | 96.3 | 3.7 | ND |
| GnP | 92.1 | 7.9 | ND |
* Not detected.
Table 2.
Surface concentration (atomic %) of carbon, oxygen and nitrogen species obtained by deconvolution of C 1s, O 1s and N 1s core energy levels.
Table 2.
Surface concentration (atomic %) of carbon, oxygen and nitrogen species obtained by deconvolution of C 1s, O 1s and N 1s core energy levels.
| Energy (eV) | Bond Assignment | EGr | EGr-H | EGr-COOH | EGr-N | EGr-OH | GnP |
|---|---|---|---|---|---|---|---|
| C 1s | |||||||
| 284.8 | C-C (sp2, graphitic carbon) | 75.3 | 75.8 | 74.3 | 74.6 | 72.6 | 70.7 |
| 285.5 | C-N (carbon–nitrogen structures) | 14.5 | |||||
| 285.9–286.2 | C-O (phenolic, alcoxy, ether) | 12.4 | 12.3 | 12.1 | 5.2 | 14.5 | 12.2 |
| 286.9–287.0 | C=O (carbonyl or quinone) | 4.4 | 4.6 | 4.8 | 2.5 | 4.8 | 3.7 |
| 288.4 | O-C=O (carboxyl or ester) | 1.6 | 1.6 | 1.8 | 1.4 | 2.8 | |
| 289.7–290.0 | Carbonate, occluded CO, π—electrons in aromatic ring | 1.6 | 1.2 | 1.2 | 1.5 | 1.6 | |
| 291.3 | π–π transition | 1.9 | 1.8 | 1.9 | 1.5 | 1.1 | |
| O 1s | |||||||
| 531.8–532.0 | O=C (in carboxyl/carbonyl) | 1.5 | 1.5 | 2.4 | 1.1 | 1.6 | 4.1 |
| 533.2–533.5 | O-C (in phenol/epoxy/ether) | 1.3 | 1.2 | 1.5 | 0.9 | 2.1 | 3.9 |
| N 1s | |||||||
| 398.6 | N-6 (in pyridine) | 0.59 | |||||
| 400.8 | N-5 (in pyrrole/amine/amide) | 0.61 | |||||
Table 3.
Kinetic parameters for bovine serum albumin (BSA) adsorption from phosphate-buffered saline (PBS) on the initial and modified expanded graphite materials (mass loading ~100 mg; initial concentration of BSA 1 mg/mL; liquid phase volume 5 mL) and on the graphene nanoplatelets (GnP) (mass loading ~100 mg; initial concentration of BSA 2 mg/mL; liquid phase volume 10 mL). k2 is the rate constant of the pseudo-second-order adsorption rate equation; qe is the adsorption capacity at equilibrium; R2 is regression coefficient.
| Sample | Pseudo Second-Order | ||
|---|---|---|---|
| k2 (g mg−1 min−1) | qe (calc.) (mg/g) | R2 | |
| EGr | 0.39 | 5.1 | 0.9994 |
| EGr-H * | 0.040 | 6.5 | 0.9963 |
| EGr-COOH-BL | 0.024 | 9.6 | 0.9974 |
| EGr-COOH-TL | 0.35 | 4.4 | 0.9994 |
| EGr-N-BL | 0.26 | 12.8 | 0.9998 |
| EGr-N-TL | 0.025 | 11.2 | 0.9885 |
| EGr-OH | 0.18 | 11.0 | 0.9998 |
| GnP | 0.014 | 76.9 | 0.9995 |
* For EGr-H the kinetic parameters were calculated using the pseudo-second-order kinetic model at equilibrium time within 24 h.
Table 4.
Fitting parameters of BSA adsorption isotherms to Langmuir-Freundlich and Freundlich equations. The allowable error of the fitting parameters was 1%. qo is the maximum adsorption of BSA per gram of the adsorbent, K is the equilibrium constant, n represents the heterogeneity of the site energies and R2 is regression coefficient.
| Sample | Langmuir-Freundlich Isotherm Constants | Freundlich Isotherm Constants | |||||
|---|---|---|---|---|---|---|---|
| qo (gBSA/g) | K (L/mg) | n | R2 | KF [(mg/g)(L/mg)1/n] | n | R2 | |
| EGr | 9.3 | 0.0045 | 1.42 | 0.9909 | 4.3 | 1.42 | 0.9909 |
| EGr-H | 11.0 | 0.0035 | 1.36 | 0.9745 | 5.1 | 1.36 | 0.9744 |
| EGr-COOH-BL | 8.7 | 0.0013 | 1.01 | 0.9762 | 10.4 | 1.00 | 0.9761 |
| EGr-N-BL | 12.6 | 0.0015 | 1.11 | 0.9975 | 9.3 | 1.10 | 0.9975 |
| EGr-OH | 22.2 | 0.0036 | 1.47 | 0.9876 | 5.5 | 1.47 | 0.9877 |
| GnP | 1.3 | 1.75 × 10⁻⁵ | 0.23 | 0.9243 | 96.4 | 0.21 | 0.9252 |
© 2018 by the authors. Licensee MDPI, Basel, Switzerland. This article is an open access article distributed under the terms and conditions of the Creative Commons Attribution (CC BY) license (http://creativecommons.org/licenses/by/4.0/).
Share and Cite
MDPI and ACS Style
Seredych, M.; Mikhalovska, L.; Mikhalovsky, S.; Gogotsi, Y. Adsorption of Bovine Serum Albumin on Carbon-Based Materials. C 2018, 4, 3. https://doi.org/10.3390/c4010003
AMA Style
Seredych M, Mikhalovska L, Mikhalovsky S, Gogotsi Y. Adsorption of Bovine Serum Albumin on Carbon-Based Materials. C. 2018; 4(1):3. https://doi.org/10.3390/c4010003
Chicago/Turabian StyleSeredych, Mykola, Lyuba Mikhalovska, Sergey Mikhalovsky, and Yury Gogotsi. 2018. "Adsorption of Bovine Serum Albumin on Carbon-Based Materials" C 4, no. 1: 3. https://doi.org/10.3390/c4010003
Note that from the first issue of 2016, this journal uses article numbers instead of page numbers. See further details here.