1. Introduction
The Boehm titration (BT) is one of few methods that enables a quantification of specific oxygen-containing surface groups on carbon materials [
1,
2,
3]. It provides absolute values based on a chemical reaction. The quantification of the reactions is realized by titration. Although the method is in principle simple and cost-effective, other methods such as temperature programmed desorption (TPD), X-ray photoelectron spectroscopy (XPS) or elemental analysis (EA) are more popular nowadays. This is mainly because a full analysis by BT can be time-consuming and because variations in the measurement protocol can strongly influence the outcome of the analysis (low robustness). On the other hand, once a standard protocol is followed, the BT method can be considered as quite attractive. Goertzen and Oickle et al. [
4,
5] investigated several parameters for the BT method and provided a standardization for a manual titration with degassing of the analyte for two hours. This is done because CO
2 as impurity leads to the formation of additional basic species that influence the titration.
On the other hand, this effect is avoided when using Na
2CO
3 as a titration base in an indirect titration. This significantly increases the precision and reduces the practical effort for the BT method. Furthermore, the comparison of different reaction bases is facilitated. An alternative measurement protocol for the BT method is discussed in our related publication, see ref. [
6].
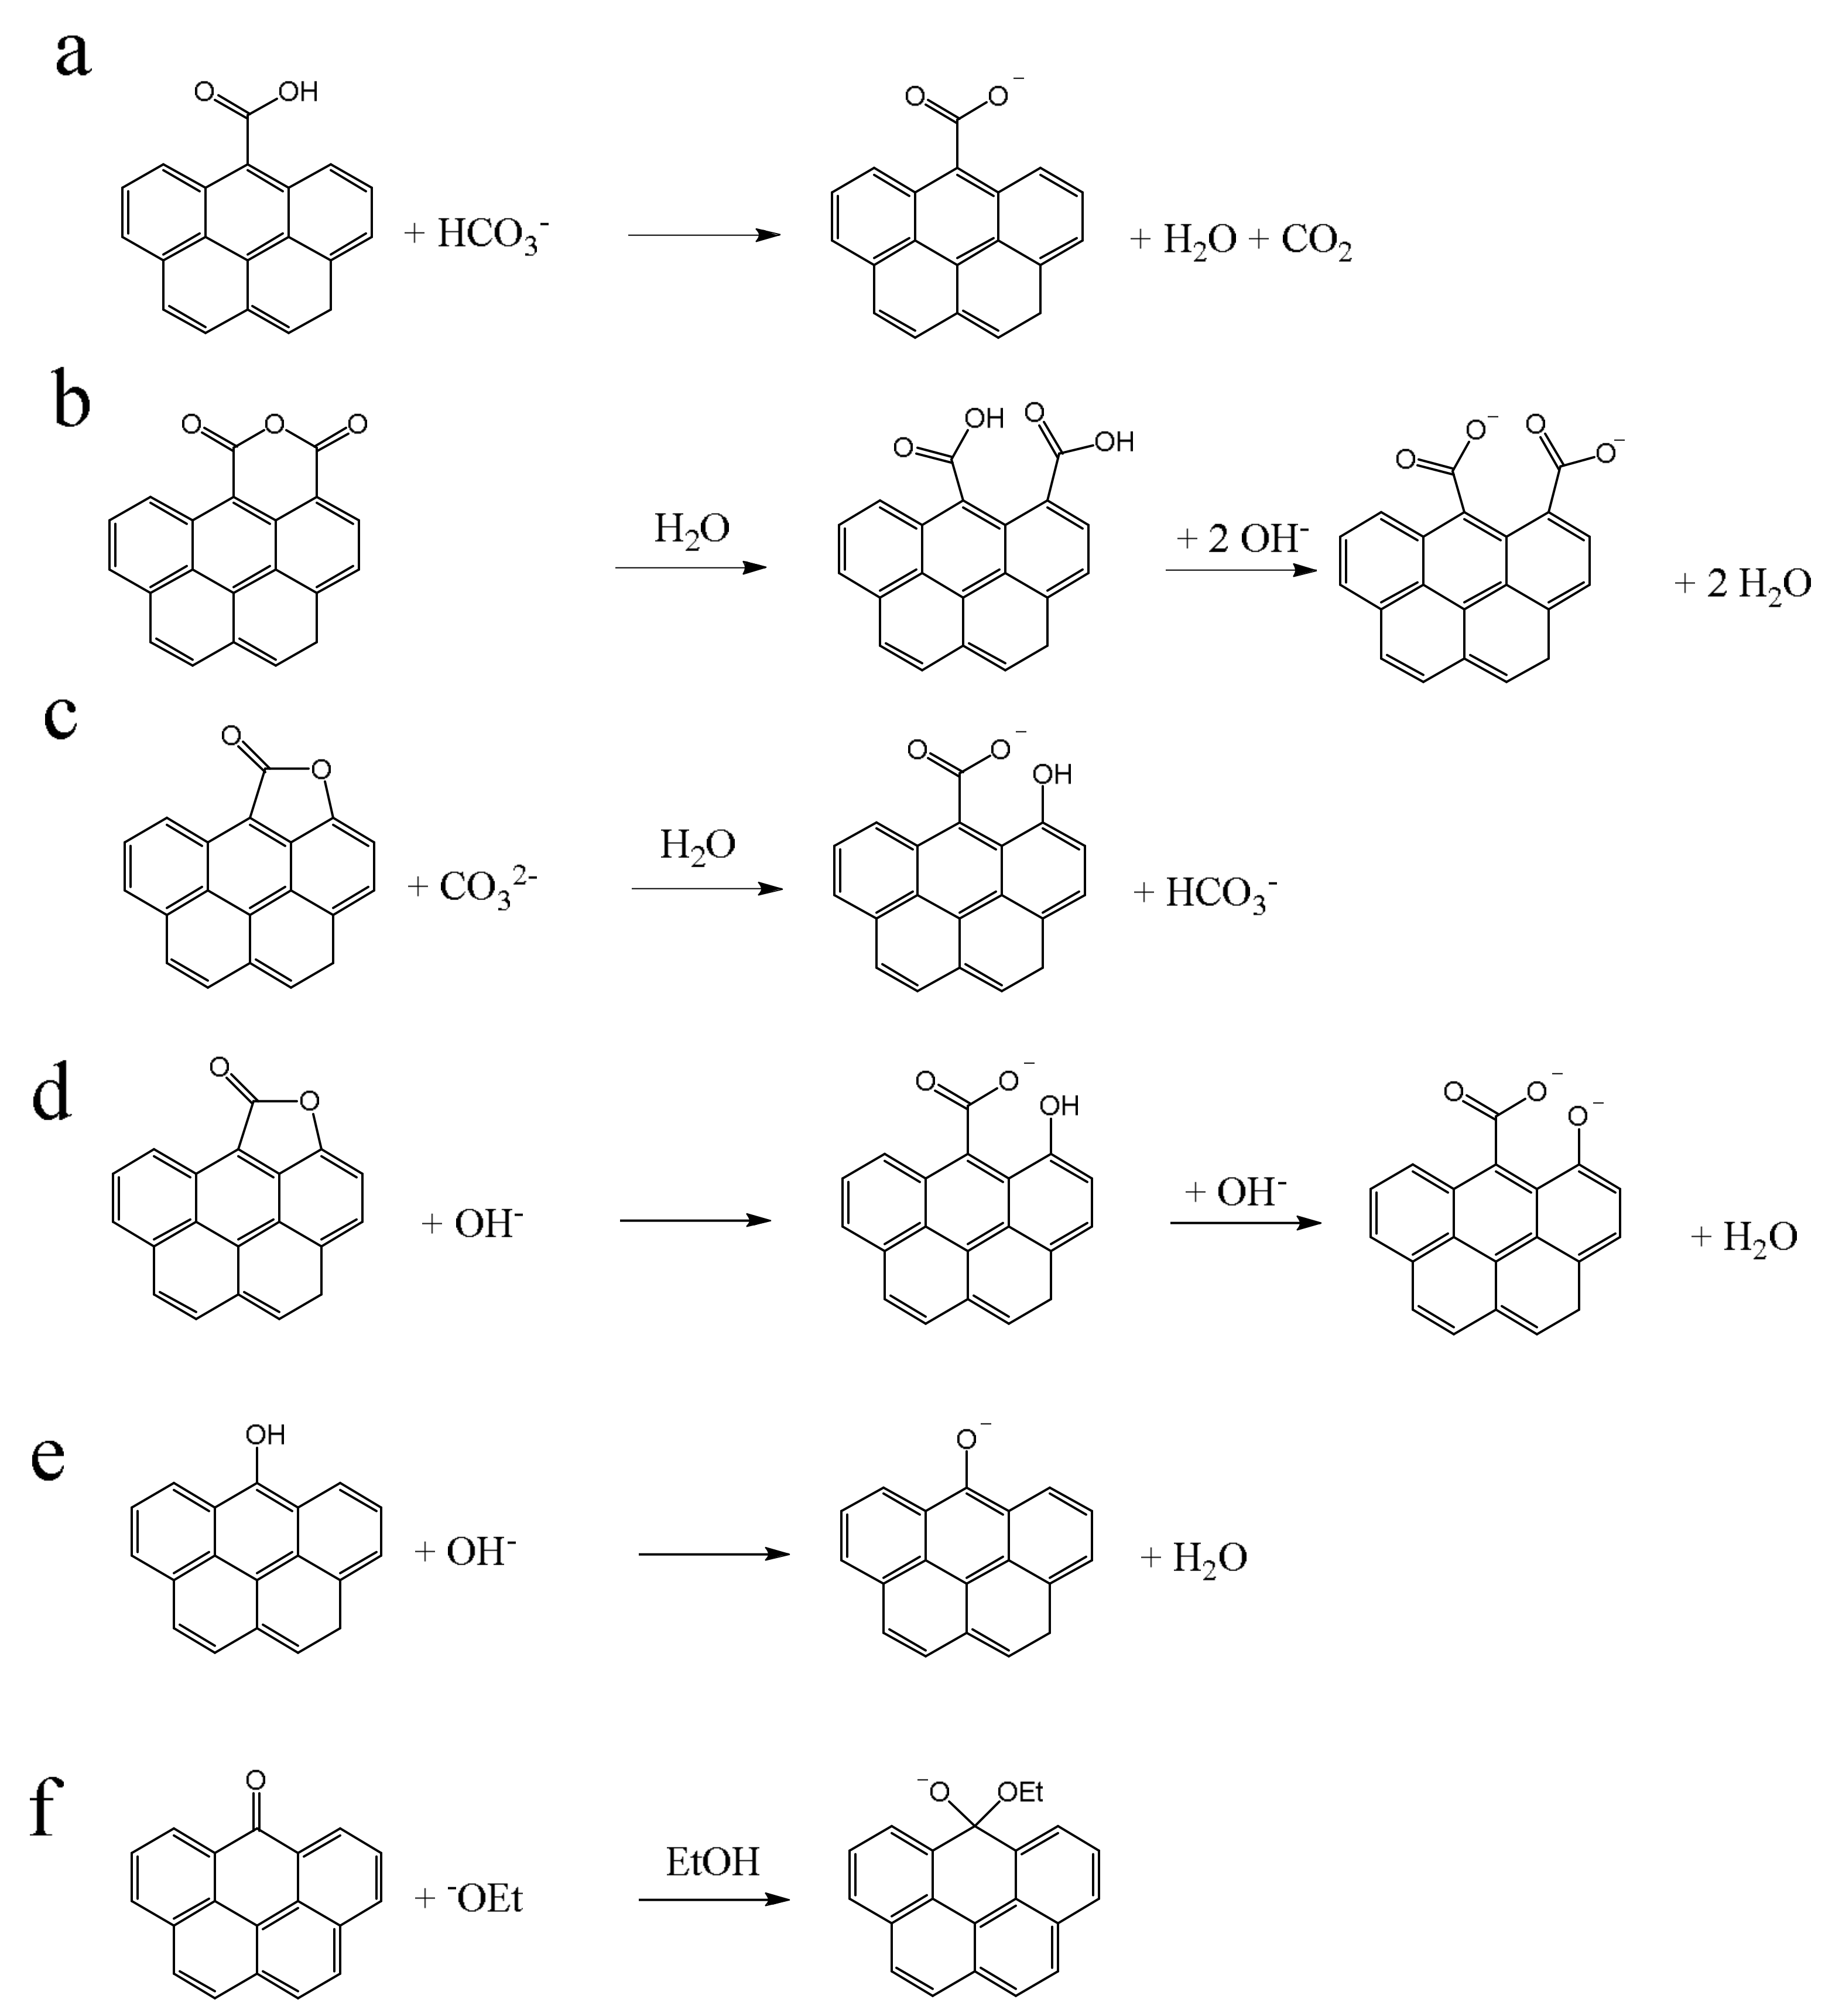
The oxygen-containing surface groups (for brevity only “surface groups” in the following) that can be analyzed by the BT method are shown in
Figure 1. By using selected bases of different strengths, different types of surface groups are distinguishable. These acidic oxygen groups are often denoted as Brønsted acids (H
+ donors) [
4,
7]. This applies to carboxyl groups and phenols (
Figure 1a,e). On the other hand, lactones have no proton that can be eliminated. The conversion of this oxygen group is a base induced hydrolysis [
3]. A hydroxide ion from a water molecule is attached to the cleaved bond and the released proton neutralizes the base. Correspondingly, one equivalent base is consumed during a cleavage of one equivalent lactone (
Figure 1c). To date, it has not been clarified whether NaOH first cleaves the lactone and subsequently deprotonates the resulting phenol. In this case, two equivalents NaOH would be consumed for one lactone (
Figure 1d). Anhydrides undergo also a hydrolysis, but no base consumption take place. The resulting carboxyl groups react as described below (
Figure 1b). Reactions of carbonyls can only occur by the reaction with NaOEt (
Figure 1f). The carbon atom of the carbonyl function C=O is Lewis acidic and therefore
−OEt can add as a Lewis base to form the deprotonated hemiacetal.
However, it is not possible to predict whether only a specific type of oxygen group reacts. This is because the p
Ka values of the groups strongly depend on their chemical environment [
8]. In salicylic acid, for example, the p
Ka value of the phenol group is 12.38 and in phenol only 9.99. This indicates that a strict allocation of oxygen groups to the reaction with specific bases is not possible. As a result, some phenol groups could be deprotonated even with Na
2CO
3 (p
Ka = 10.3). For this reason, a comparison with other quantification methods is necessary to assess the results of the BT.
In past decades, the BT method has been applied to a variety of carbon allotropes and materials. Active carbons [
9,
10,
11,
12,
13], carbon blacks [
1,
4,
5,
14], charcoals [
1], carbon nanotubes (CNTs) [
15,
16,
17,
18,
19,
20], carbon nano onions [
21], carbon fibers [
8] and nanodiamonds [
22] have been characterized, for example. In our related paper, CNTs have been selected as a model system to derive a standardized protocol for conducting the BT method [
6]. In this second study, the results will be systematically compared with carbon materials that have a very different particle morphology and porosity. Besides differences in the amounts of surface groups, it is foreseeable that morphology and porosity can have a strong impact on the speed and the degree of pore filling by the reaction solution in the BT method.
The most important types of carbon materials with large micropore volume and therefore high specific surface area (typically exceeding 1000 m
2 g
−1) are active carbons. The structure of active carbons is highly disordered and is described as turbostratic or non-graphitic [
23,
24]. Individual graphene sheets of irregular size are more or less randomly aligned to form stacks of up to a few nanometers in size. These stacks are connected by trigonal or tetragonal bonds in a disordered matrix [
25]. The preparation of active carbons is usually carried out by thermal treatment of organic matter under inert conditions (carbonization), followed by physical or chemical activation.
The structure of carbon blacks is also turbostratic even though the specific surface area (SSA) can be much lower than for other active carbons. They are produced by incomplete combustion of tars, oils, or volatiles, leading to layered, colloidal particles. They arise in the form of spheres around a nucleus with a size up to 300 nm [
26]. The particle spheres are assembled to aggregates. Around these aggregates a further carbon growth can take place. In this way, the primary particles are firmly connected. The aggregates themselves form agglomerates, which can reach sizes up to several hundred µm. Depending on the synthesis conditions, the properties of carbon blacks can be tuned over a very broad range.
Overall, the four carbon materials used in this study strongly differ in their structural properties and are therefore representative for the large variety in this materials class. To begin with, the porosity and morphology of the carbon samples are fully characterized and it is tested whether microporosity increases the required base treatment time due to slowed pore filling of the carbon material. The surface groups of the different carbons are quantified then and the results are compared with EA, TPD combined with mass spectrometry (TPD-MS) and thermogravimetric analysis (TGA), and XPS. It is also discussed whether the reaction base can reach surface groups in very small pores.
2. Materials and Methods
2.1. Materials and Solutions
Acid and base solutions were prepared or purchased as described in ref. [
6]. C-NERGY Super C65 was kindly provided by Imerys Graphite & Carbon (Bironico, Switzerland; Impurities: 2 ppm Fe, 1 ppm Ni, 0.01 Ash content). Baytubes MIV-05-185 were received from Bayer AG (Leverkusen, Germany; purity: >95%, wall number: 3–15, outer diameter: 13–16 nm, length: 1–10 µm). A purification of the CNTs was realized as described in ref. [
6]. The pure activated charcoal was purchased by Merck (Darmstadt, Germany; Product id: 1.02183.1000, Impurities: ≤1000 ppm Fe, ≤200 ppm Zn) and the supercapacitor activated carbon TF-B520 was received by MTI Corporation (Richmond, CA, USA; Impurities: 0.07 Ash content, ≤1000 ppm metal ions).
2.2. Oxidation of the Carbon Samples
All carbon materials were oxidized by an acid treatment (HNO3) to improve hydrophilicity and to generate surface groups that can be determined by the BT. Carbon samples (5 g) were oxidized with 500 mL conc. HNO3 (purchased by BDH Prolabo, Singapore) at 90 °C in a round-bottom flask for 2 h. Afterwards, they were washed with deionized H2O multiple times until the filtrate was pH neutral. The solids were dried over night at 120 °C. The achieved materials were ground through a 250 µm sieve to get a homogeneous material. The resulting oxidized carbon black (Cnergy Super C65) are labelled as aCB, the oxidized CNTs (MIV-05-185) as aCNTs, the oxidized activated charcoal as aAC1 and the oxidized active carbon (TF-B520) as aAC2. The complete removal of the acid after the oxidation was ensured for all carbon samples by an acid base titration similar to the indirect BT. Water was added to the carbon materials as reaction solution instead of a base.
All samples were stored in a desiccator until characterization.
2.3. Characterization Methods
The titration experiments were performed as described in the first publication and the attached standard operating procedure [
6]. 500 mg aCB, 250 mg aCNTs, 150 mg aAC1 and 100 mg aAC2 were used for each base treatment.
The elemental analysis (EA) was carried out in a Vario MICRO cube (Elementar Analysensysteme GmbH; Langenselbold, Germany). Coal from Choice Analytical (Galveston, TX, USA; FC28101: 90.10 m% C, 3.01 m% H, 0.56 m% N, 0.20 m% S) was used as standard for calibration. An Autosorb iQ3 TPX from Quantachrome (Odelzhausen, Germany) was used to measure the isotherms of the N2-physisoption. For the evaluation of isotherms, the Quantachrome ASiQwin Software was used (Data reduction parameters: aCB, aAC1, aAC2: N2 at 77 K on carbon (slit pores, QSDFT equilibrium model); aCNTs: (slit/cylindr. pores, QSDFT equilibrium model)). For X-ray photoelectron spectroscopy (XPS), a Quantum 2000 (PHI Co., Chanhassen, MN, USA) was used. The carbon samples were put on a Cu surface. The analysis was carried out using an Al Kα X-rays source (1486.6 eV). The parameters of the analysis were: 23.50 eV pass energy, 45° measurement angle, scan rate 0.2 eV/step. For the deconvolution of the C1s peak, the MultiPak software was used with symmetric Gaussian-Lorentzian peaks for all peaks beside the conjugated carbon peak, which was evaluated by an asymmetric Gaussian-Lorentzian peak. The spectra were corrected by a Shirley background subtraction. The temperature programmed desorption (TPD) was carried out in a NETZSCH STA 449 F1 Jupiter thermal microbalance (Selb, Germany). After adding the 5–15 mg samples to the apparatus, the measurement chamber was evacuated twice. Then the samples were heated with 10 K min−1 in 20 mL He min−1. For the analysis of the released components by mass spectrometry (MS), a QMS 403 D Aëolos detector (Selb, Germany) was used. The amounts of CO and CO2 were normalized per weight of the samples to achieve comparable results unaffected by the used masses.
3. Results and Discussion
3.1. Porosity and Structure of the Carbon Materials
Before applying the BT method, all carbon materials were characterized by N
2 physisorption (pores in nanometer scale) and scanning electron microscope (SEM) (macropores, morphology). As it is shown in
Figure 2, the chosen carbon materials are very different from each other and therefore represent the broad variety of carbon materials in general. To obtain reliable results for the BT method and ensure values above the limit of quantification (ten times the standard deviation) only carbon samples with fairly large surface areas are used. Low surface area materials such as graphite were therefore not investigated, as they would require sample amounts that were too large.
To obtain the SSA values and pore size distributions, the N
2 isotherms were evaluated by using a Density Functional Theory (DFT) method. This method describes the physisorption at a microscopic level based on statistical mechanics. This way, the complete isotherm as well as the pore size distribution over the whole micro-mesopore range is derived. Recent studies have shown that quenched solid DFT (QSDFT) enhances the fit of the isotherms and prevents the generation of typical cascade artifacts received by non-local DFT [
27]. The inhomogeneity of the carbon surface is included in the QSDFT as a roughness parameter. For the evaluations of the isotherms, a kernel based on slit pores was used. This kind of pores are characteristic for carbon blacks and other active carbons [
3,
9,
25]. In case of CNT samples, a DFT kernel for cylindrical pores larger than 2 nm was applied.
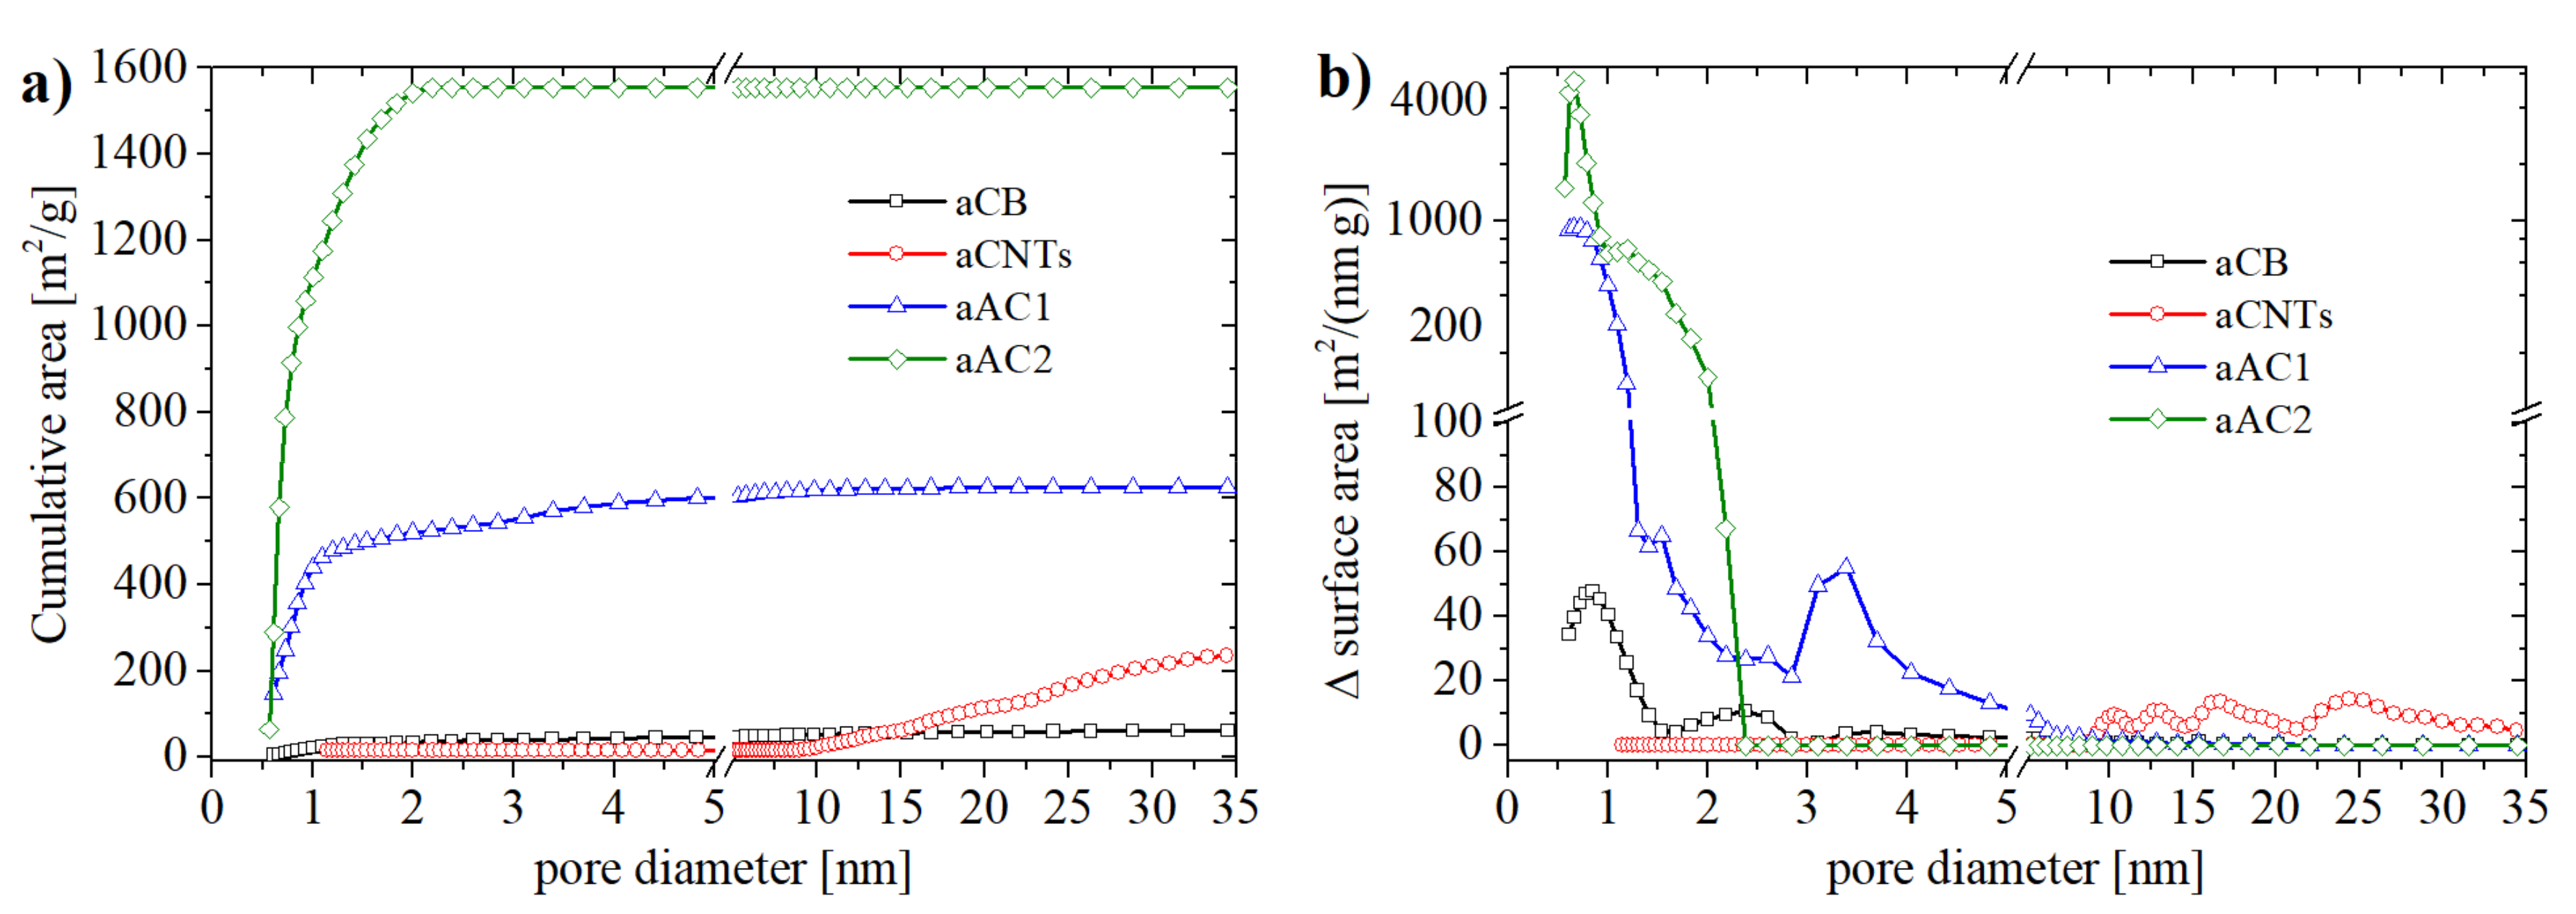
SSA values (BET) of the carbon materials were between 60 m
2 g
−1 (aCB) and 1760 m
2 g
−1 (aAC2). As can be seen in
Figure 2b, all carbon materials possessed a different pore size distribution. aCB and aAC2 were mainly microporous whereas aCB showed an increased number of pores with a diameter of 2.5 nm and a few pores with diameters up to 5 nm. The oxidized charcoal aAC1 contained, beside micropores, a significant amount of small mesopores with diameters between 3 and 4 nm. On the other hand, aCNTs showed no micropores. Their main pore size was between 10 and 30 nm which corresponds to the tube diameter at the lower end. The maximum at 25 nm is probably related to the distances between the individual tubes in the agglomerates.
Table S1 (in Supplementary Materials) summarizes all data derived from the N
2 physisorption measurements. Notably, the differences between BET and DFT method are only remarkable for aAC2 (DFT SSA 1550 m
2 g
−1).
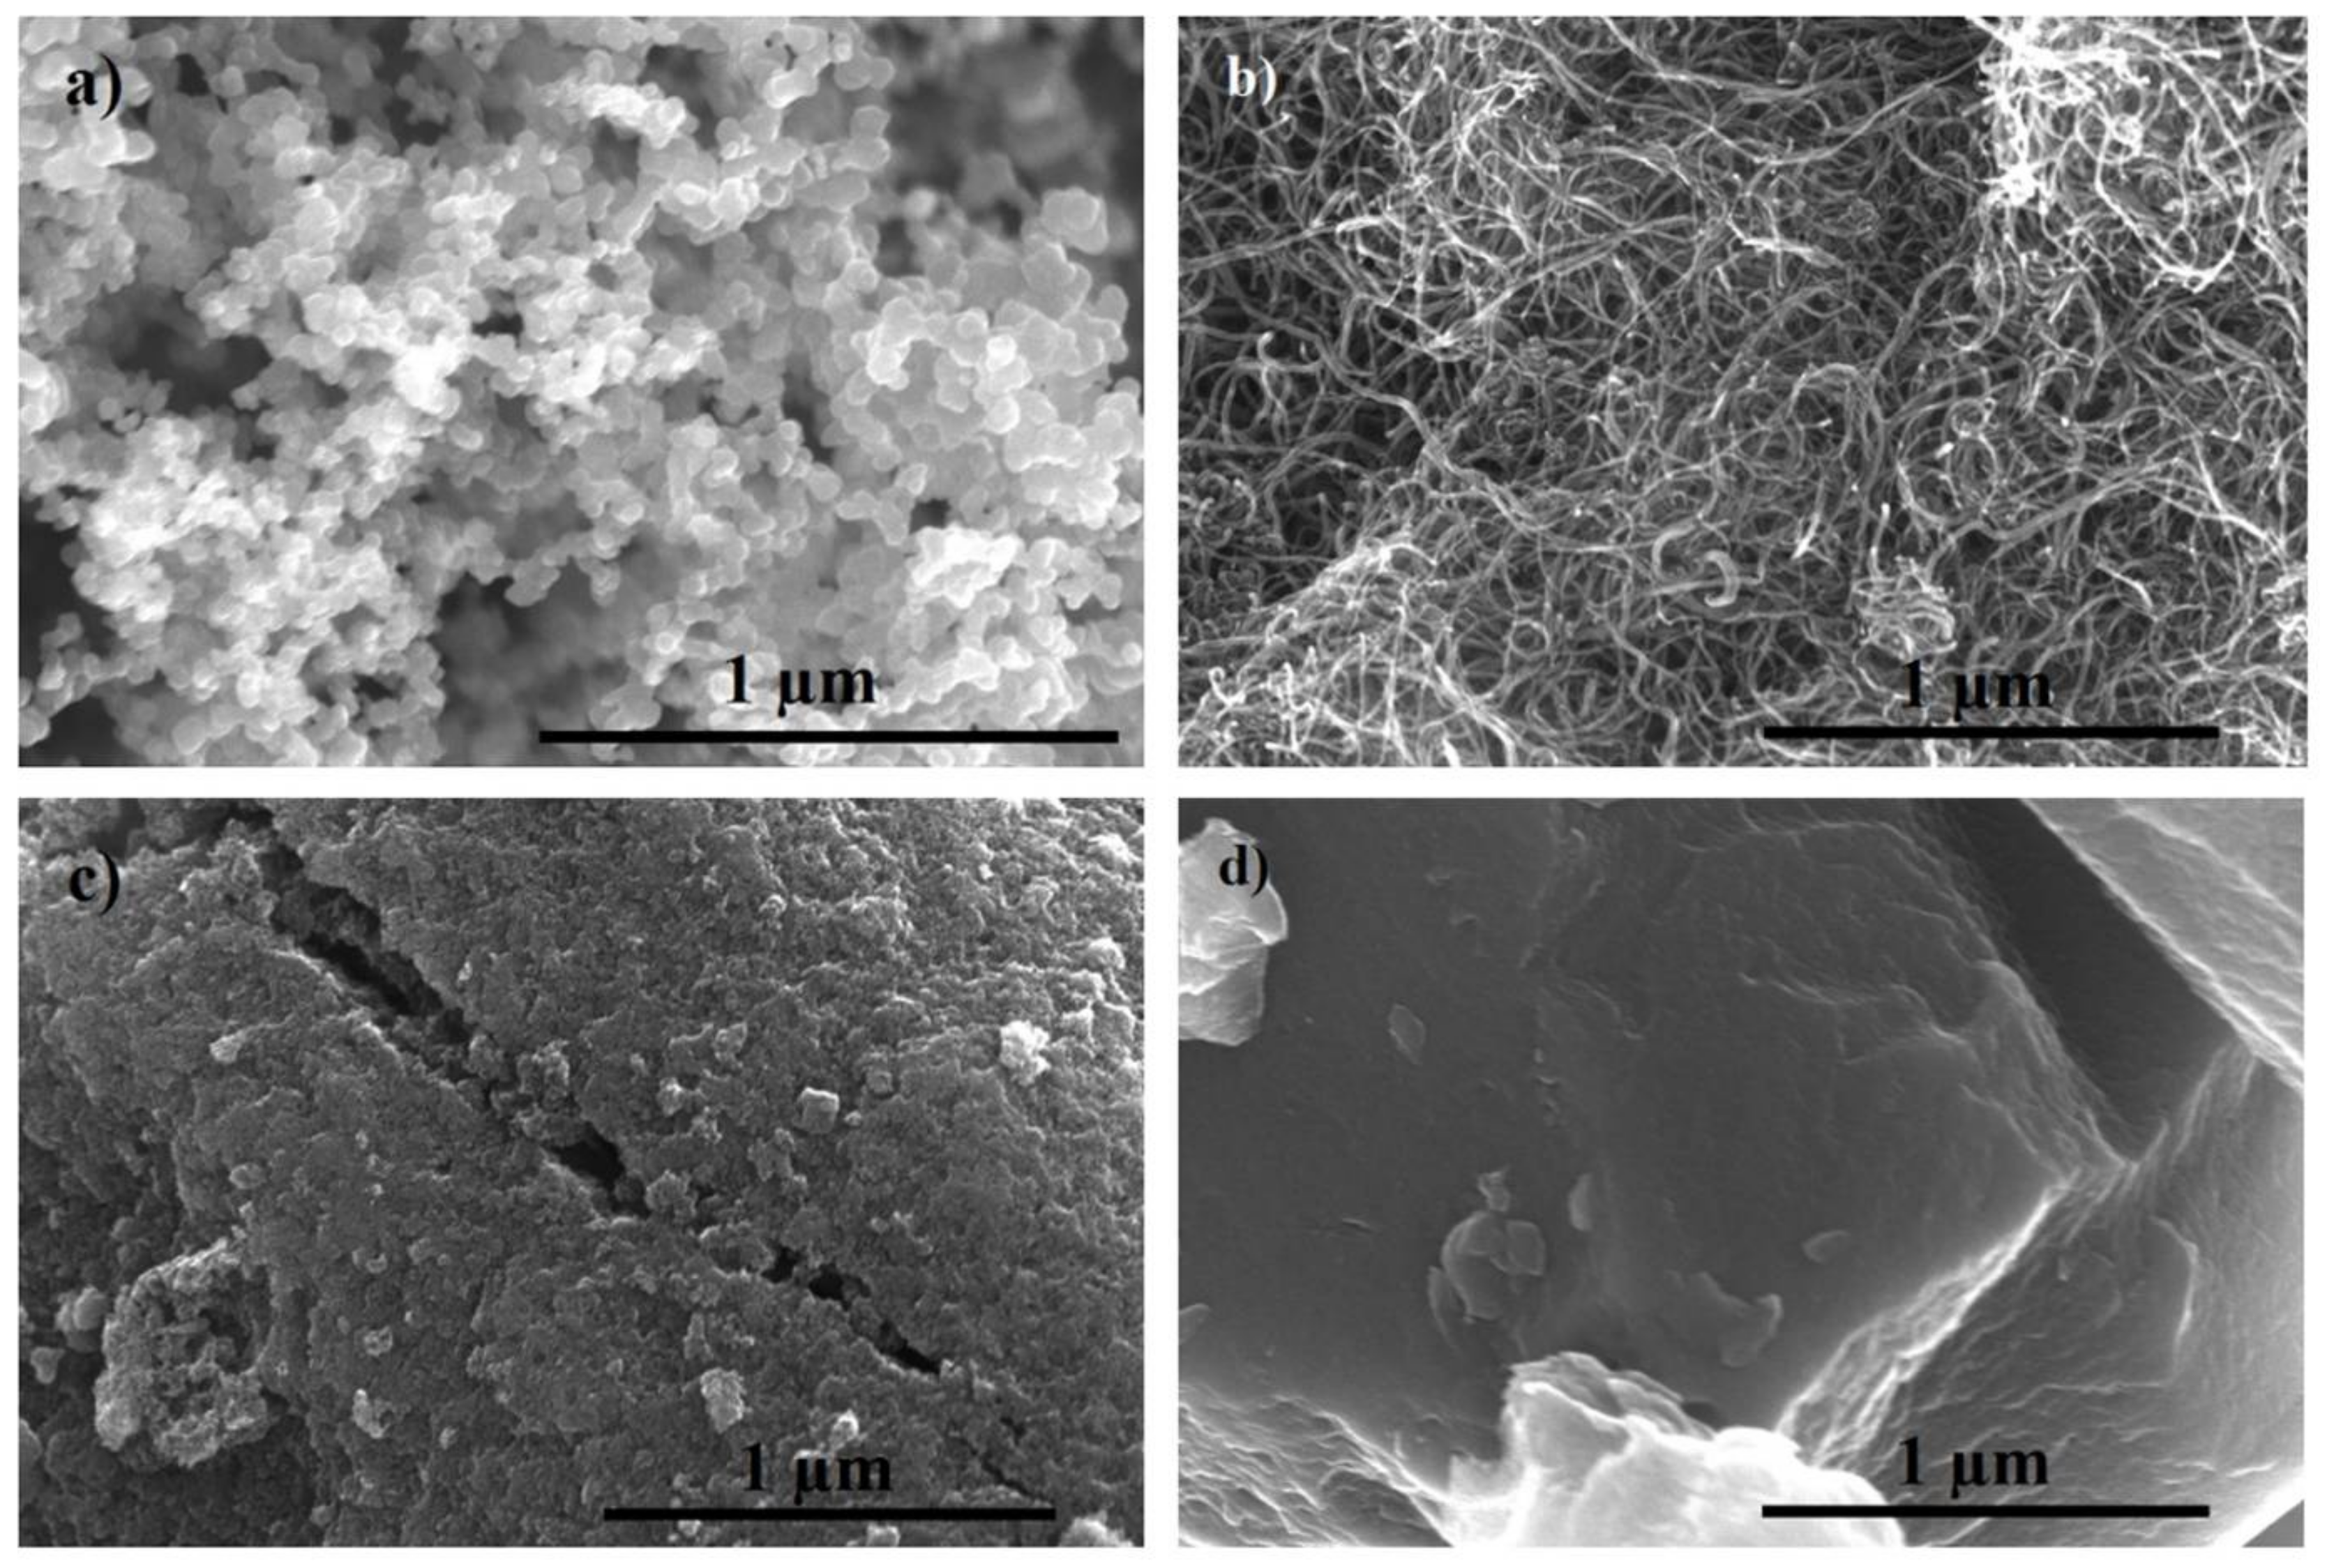
The morphology and macroscopic porosity of the samples are shown in
Figure 3. The CNT sample consisted of bundles of tubes that were several µm long and that were loosely aggregated to form a very open morphology. Such an open structure eases the accessibility for the base solution. A similar situation can be expected for aCB. The spherical primary particles (d < 100 nm) were fused to aggregates forming large open voids between them. In contrast, the active carbon samples had a much flatter and macroscopically denser surface. Especially aAC2, though the sample with the highest SSA value, does not show any notable macroporosity. One might expect that accessing the micropores of the active carbons might therefore take much longer.
3.2. Influence of the Carbon Structure on the Required Base Treatment Time
An important practical aspect of BT is the time required to complete the acid/base reaction. Considering the large differences in porosity and morphology of the samples, one may expect very different reaction times. For the CNTs it has been found that the reaction time is largely independent of the type of base and most of the reaction (>90%) took place within one hour [
6]. In this study, NaOH
(aq) was chosen as reaction base, as it is the strongest base and therefore reacts with all acidic oxygen groups.
The consumption of NaOH
(aq) as a function of time is shown in
Figure 4. Standard deviation was calculated from the four aliquots. For all samples, the results show that more than 75% of the surface groups reacted with the base within one hour. After 12 h approx. 95% are already reached. The change between day two and three is less than 0.5% for all samples, so one can safely assume that the reaction has completed. Apparently, the consumption asymptotically approaches a maximum. Longer reaction times would only lead to an increase that is in the range of the standard deviation of the titration method.
Nevertheless, some important differences between the carbon samples are evident. The reaction for the carbon black sample appeared to be the most rapid one though the standard deviation is largest. Whereas the large total porosity enables a fast reaction, the absolute amounts of base consumed in each experiment were small and therefore the standard deviation becomes significant (only 2% of the base were consumed compared to more than 30% for the active carbons). This is simply because the aCB had the smallest specific surface area (62 m2 g−1) among all carbon samples and therefore the least absolute amounts of surface groups. Although the amount of aCB used for the study was the largest among all samples (0.5 g) the results show that even larger amounts are necessary for obtaining more reliable results.
The behavior for the CNTs was somewhat surprising. Although the reaction was rapid at the beginning, it took the longest time to complete. This was not expected due to the highly porous network. It is not easy to rationalize this behavior but the results might indicate that the exterior of the tubes was easily reached by the base solution while the process of filling the interior of the tube (diameter in the range of a few nm) was slow. Two different processes would then determine the reaction time. Nevertheless, as most of the surface groups are at the outside of the multi-walled carbon nanotubes, base consumption is nearly completed (>90%) within one hour.
For the active carbons, the degree of the reaction was slightly below 80% (aAC1) and 90% (aAC2) after one hour. Twelve hours, however, were enough to complete the reaction by 95% or more. This is somewhat unexpected given the fact that the used active carbons were macroscopically much denser than the other samples. The results show that the active carbons were still rapidly infiltrated by the base solution, i.e., there was no need to unnecessarily prolong the treatment time. Taking all these results together, our findings indicate that hydrophilic carbon materials should be treated with the NaOH base solution for about 12 h to ensure that about ≥95% of the surface groups reacted.
3.3. Quantification of Oxygen-Containing Surface Groups
3.3.1. Elemental Analysis (EA Method)
The oxygen content of a carbon material can be estimated from well-established CHNS elemental analysis. This convenient and fast method determines the absolute amounts of the elements C, H, N, and S by burning the sample. The difference to the total weight corresponds to the amount of oxygen. By doing so, one assumes that the sample does not contain other elements. Any impurity will therefore falsify the result. Low-cost activated carbons may contain more impurities, for example. For our study, we can neglect this effect because all samples were pre-treated by acid and washed several times. It is worth noting that the oxygen content can also be determined directly by elemental analysis. This, however, requires pyrolysis of the sample and a different instrument setting.
In EA, the whole sample is probed. This means that not only oxygen groups at the surface, but also oxygen covalently bonded within the carbon structure is determined. Therefore, it may provide higher oxygen contents compared to the BT method. Moreover, EA is not selective for the different types of surface groups.
Results from EA are summarized in
Table 1. The oxygen contents were 0.8 wt % for aCB, 2.5 wt % for aCNTs, 16.8 wt % for aAC1 and 19.5 wt % for aAC2. For comparison, the table also shows the EA results of the carbon samples before the HNO
3 pre-treatment. It can be seen that the activation of the active carbons led to a significant increase in oxygen and nitrogen contents. Carbon black is the purest carbon among the samples. Its composition was only slightly changed by the acid treatment. Nevertheless, all samples became more hydrophilic by the acid treatment. It is important to note that CB was floating on NaOH solutions during the reaction time, whereas aCB was settling.
3.3.2. Boehm Titration (BT Method)
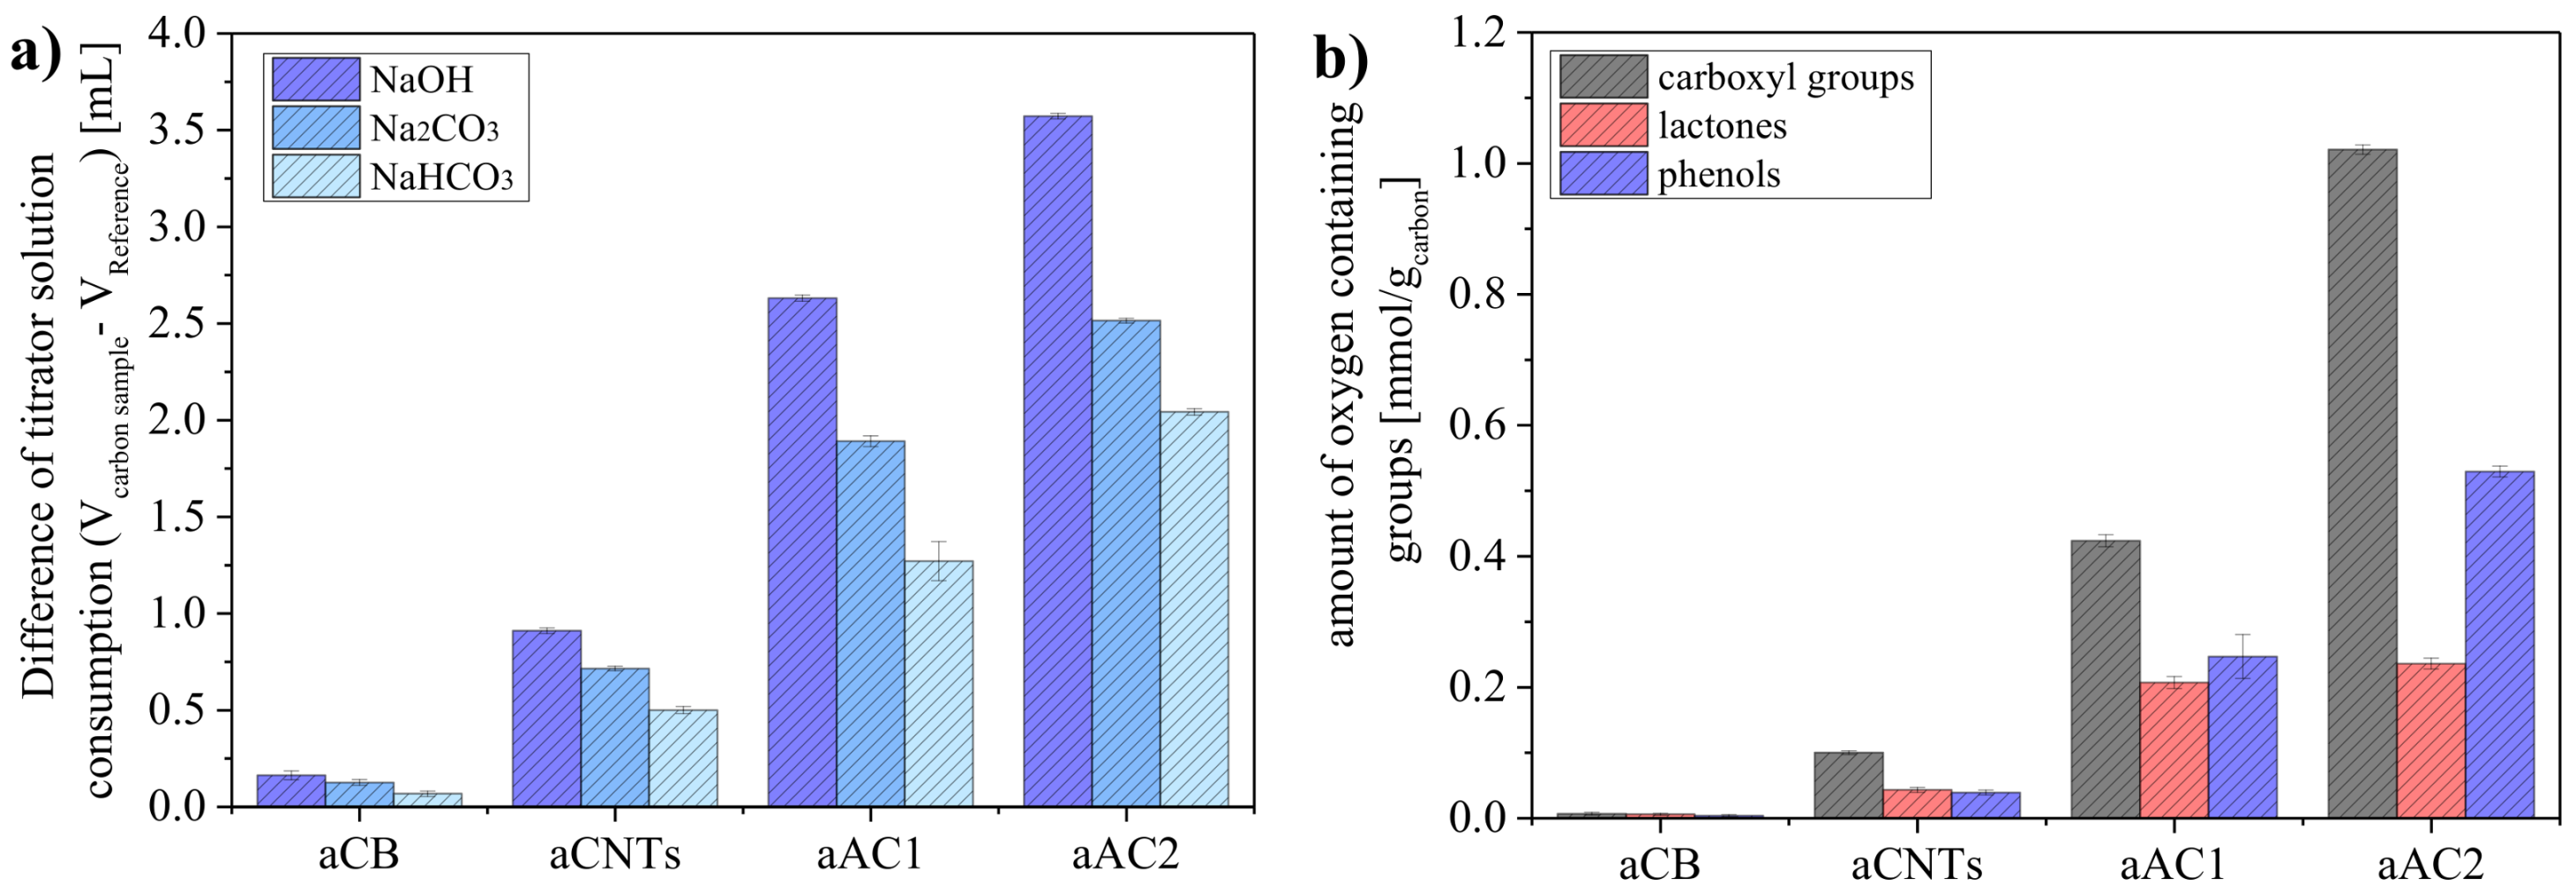
The differences in titration results between the reference base (0.01 N) and the carbon-treated bases (<0.01 N) corresponds to the amounts of surface groups on the samples (
Figure 5a). By using NaHCO
3, Na
2CO
3, and NaOH, different types of surface groups can be detected. As expected, the use of NaOH as the strongest base (highest p
Ka value) yielded the highest consumption of titrator solution.
As described before, the precision of the BT method depends on the absolute amounts of surface groups in a sample, i.e., the smaller the specific surface area, the more material should be analyzed. Therefore, 500 mg of aCB, 250 mg of aCNTs, 150 mg of aAC1 and 100 mg of aAC2 were used to quantify the surface groups reliability. This becomes especially important when distinguishing between the different types of surface groups (
Figure 5b). For aCB, only very small amounts of oxygen groups were obtained per gram (0.0067 mmol of carboxyl acid, 0.0058 mmol of lactone, and 0.0037 mmol of phenol). On the other hand, the value for carboxyl groups was already 1.02 mmol g
−1 at aAC2. The standard deviations were derived from triple determinations with four aliquots per sample. The deviations were very small, indicating a precise quantification of the surface groups by the BT method. Moreover, this indicates that the materials were all homogeneous powders.
By using NaHCO
3, Na
2CO
3, and NaOH as bases, it is only possible to quantify the amount of acidic surface groups. It is worth mentioning, however, that there are also several studies on determining basic surface groups via the BT method. Mostly, researchers avoid the determination of quinone and pyrone with NaOEt, as it was described in the original study from H.P. Boehm [
1]. The required use of dried ethanol instead of water as a solvent and the corresponding higher vapor pressure make it difficult to reach a high precision. To avoid a different solvent, an acid treatment with HCl is often used similar to the base treatments. It has to be noted that this approach is not straightforward as one only determines an “overall basicity” and not specific groups. The reason is that instead of a chemical reaction only an interaction between H
+ and the π-electron system of the carbon structure takes place [
3].
3.3.3. Thermal Programmed Desorption (TPD-MS Method)
In a typical TPD experiment, the carbon sample is heated under a protective atmosphere. The different types of oxygen-containing surface groups decompose at specific temperatures to CO2 (carboxyl groups, anhydrides, lactones) or CO (phenols, quinones, anhydrides, ethers). The released gases can be distinguished by a mass spectrometer connected to the TPD setup, for example. Quantification, however, is cumbersome, as the detector needs to be calibrated. Alternatively, one can conduct the TPD experiment in a thermal microbalance (TGA) setup. This way, quantification becomes feasible by relating the detected amounts of CO2 and CO to the mass loss of the sample and therefore quantify the results.
The TGA results up to 800 °C are shown in
Figure 6. Total mass losses of 0.85 wt % for aCB, 3.31 wt % for aCNTs, 16.44 wt % for aAC1 and 19.98 wt % for aAC2 were detected from which the oxygen contents can be calculated (considering the fraction of oxygen content in the released gases CO and CO
2).
Combined with MS data, deconvolution of the data was realized by gauss functions to determine the amounts of surface groups as described in ref. [
28] (see
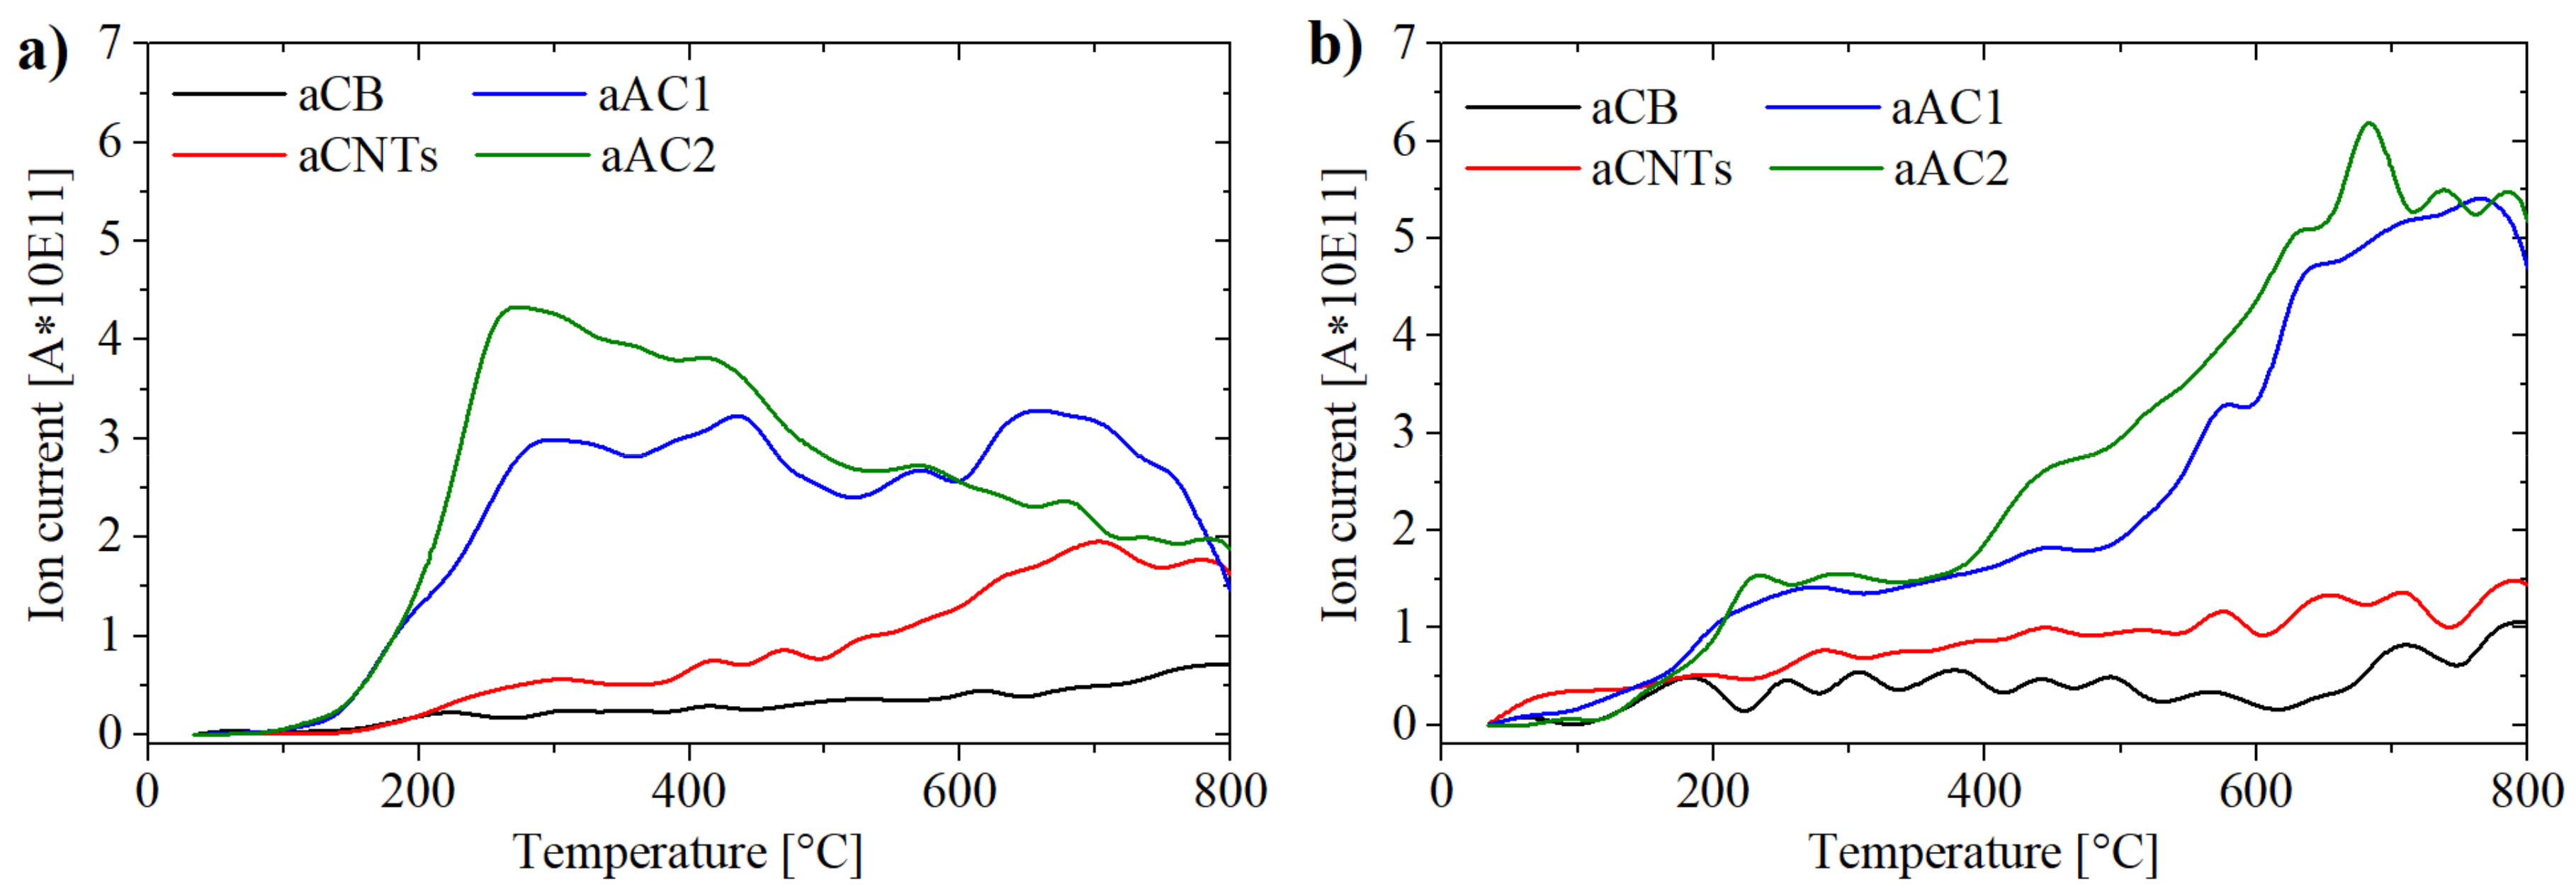
Supplementary Materials Figure S3). Due to the curve shape (
Figure 7), this procedure is mainly an approximation. The maxima of the peak gauss functions for the CO
2 curve were set to 250–280 °C for carboxyl groups, 420–450 °C for anhydrides, 550–600 °C for lactones I and 650–700 °C for lactones II (
Figure S3). Two separate peaks had been used for lactones, so that the overall fit did not deviate too much from the curve obtained in practice. The placement of the peaks was adjusted to the detected local maxima for aAC1 and aAC2 (
Figure 7a). The obtained temperatures were in line with literature values [
28,
29]. For the CO curve, the anhydrides were set to the same position as for the CO
2 curve, due to the release of one CO and one CO
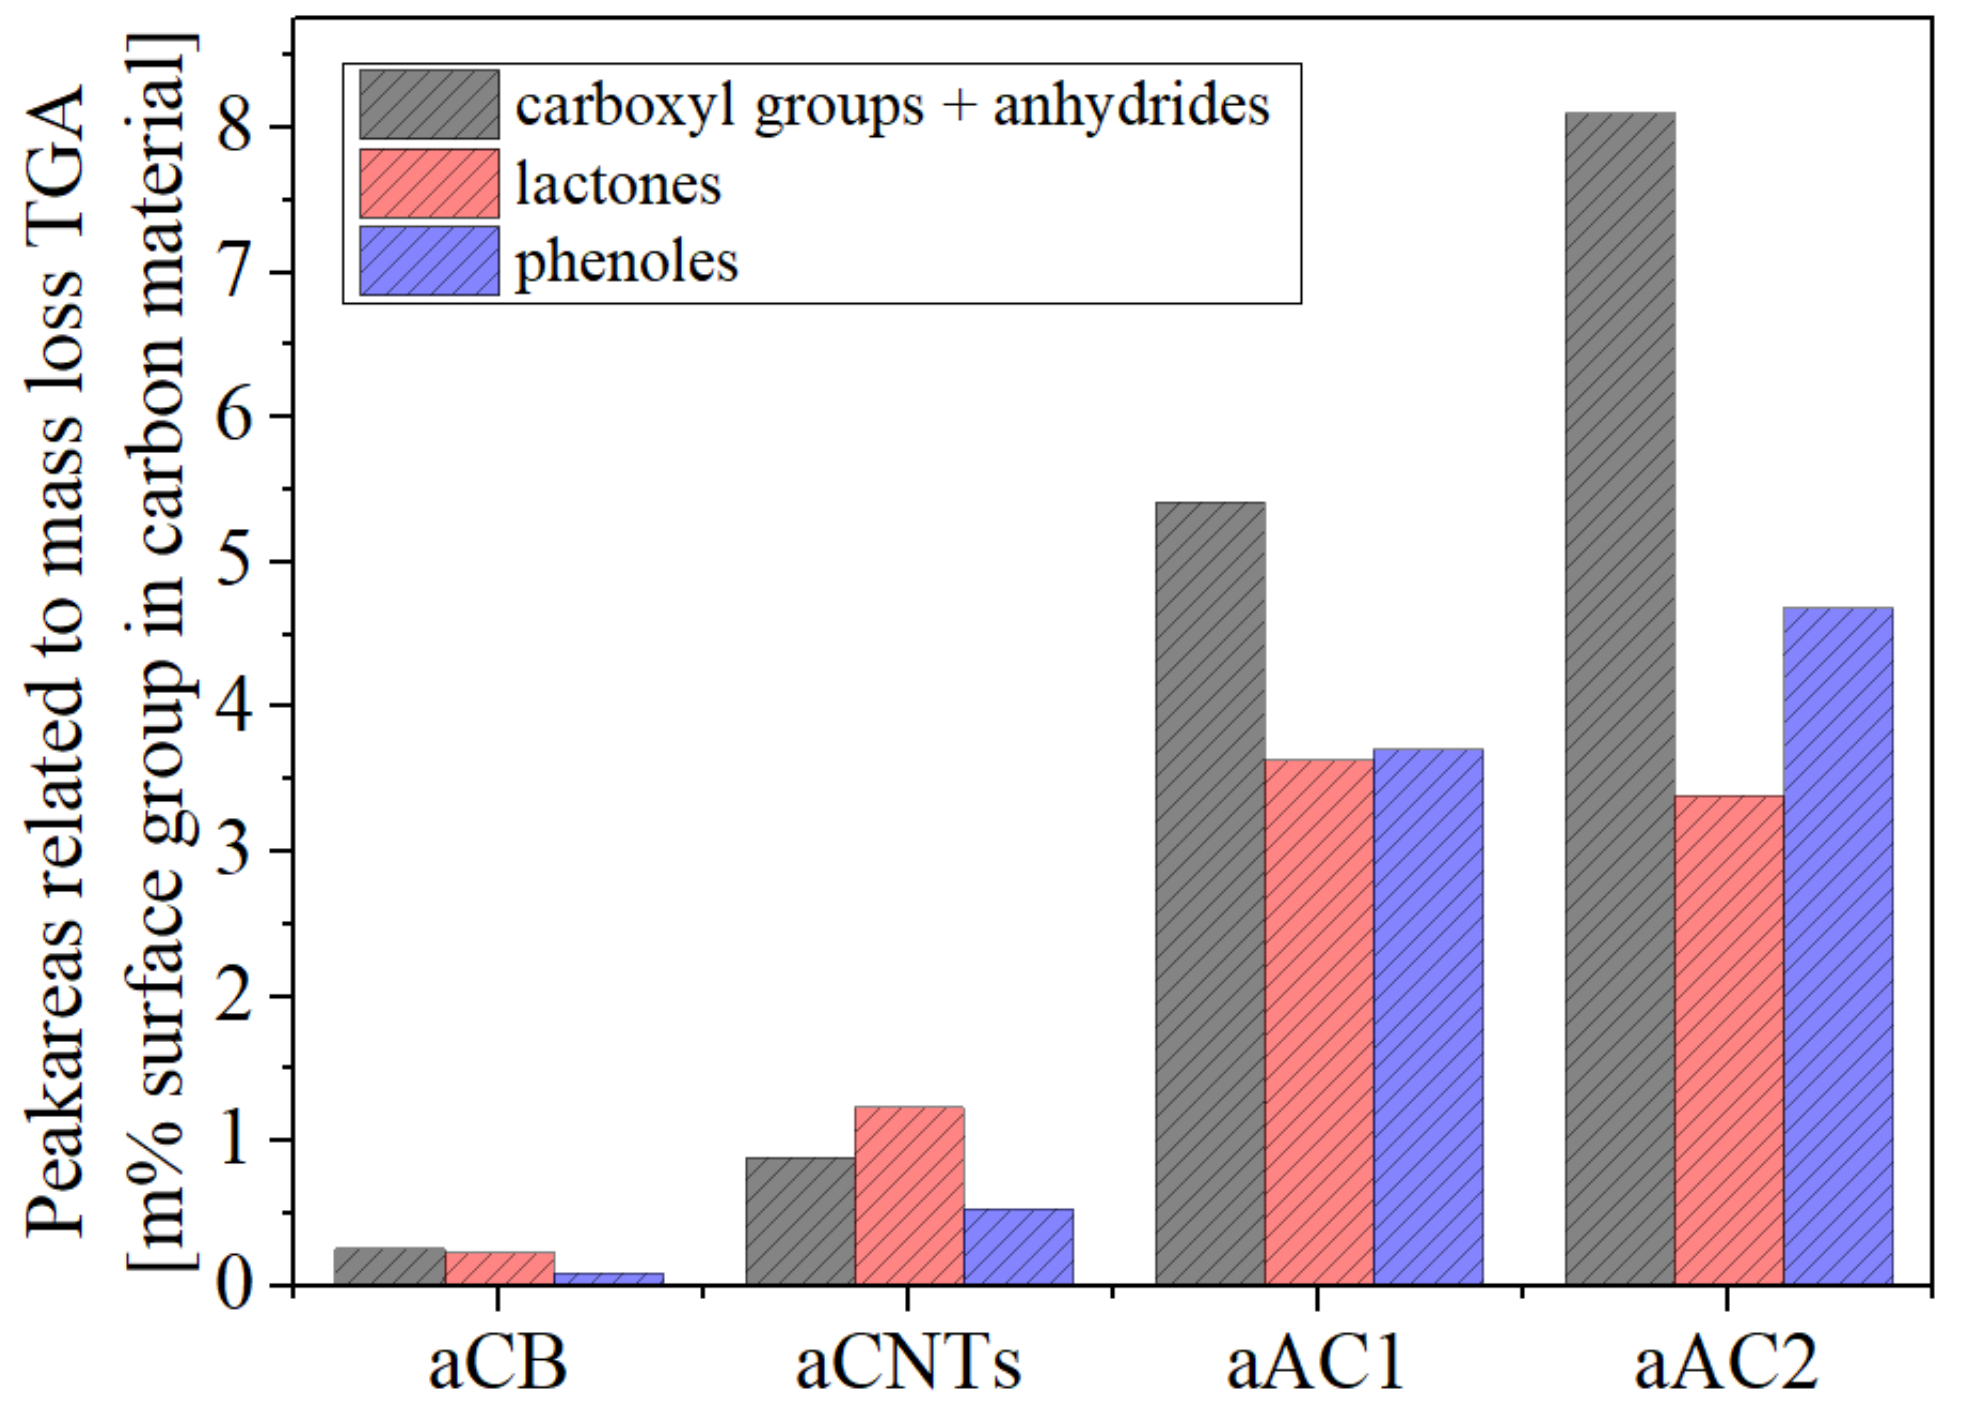
2 molecule for one anhydride group. Apart from that, a peak for phenols (650–700 °C) and a peak for quinones (825–850 °C) were used. Since the measurement could only be realized up to 800 °C, a quantification of quinone and other basic groups was not possible. However, the involvement in the deconvolution was necessary to improve consistency between the measured data and the overall fit. Nevertheless, the accuracy for the quantification of phenols is likely the lowest. The results of the deconvolution for each specific surface group are shown in
Figure 8.
3.3.4. X-ray Photoelectron Spectroscopy (XPS Method)
XPS is a very surface sensitive method and probes the composition of the sample surface within a depth of a few nanometers, i.e., only the outer surface and therefore a very small fraction of a powder sample is analyzed. It provides information on types and amounts of oxygen surface groups by their included atoms. Since the nature of the bonds also influences the spectra, it is possible to differentiate between the differently bonded atoms of one element. The C1s peak, for example, shows a shoulder towards higher binding energies. Attached oxygen on carbon atoms leads to a lower electron density that increases the binding energy. The ratio of the different types is accessible by deconvolution of the relevant spectra.
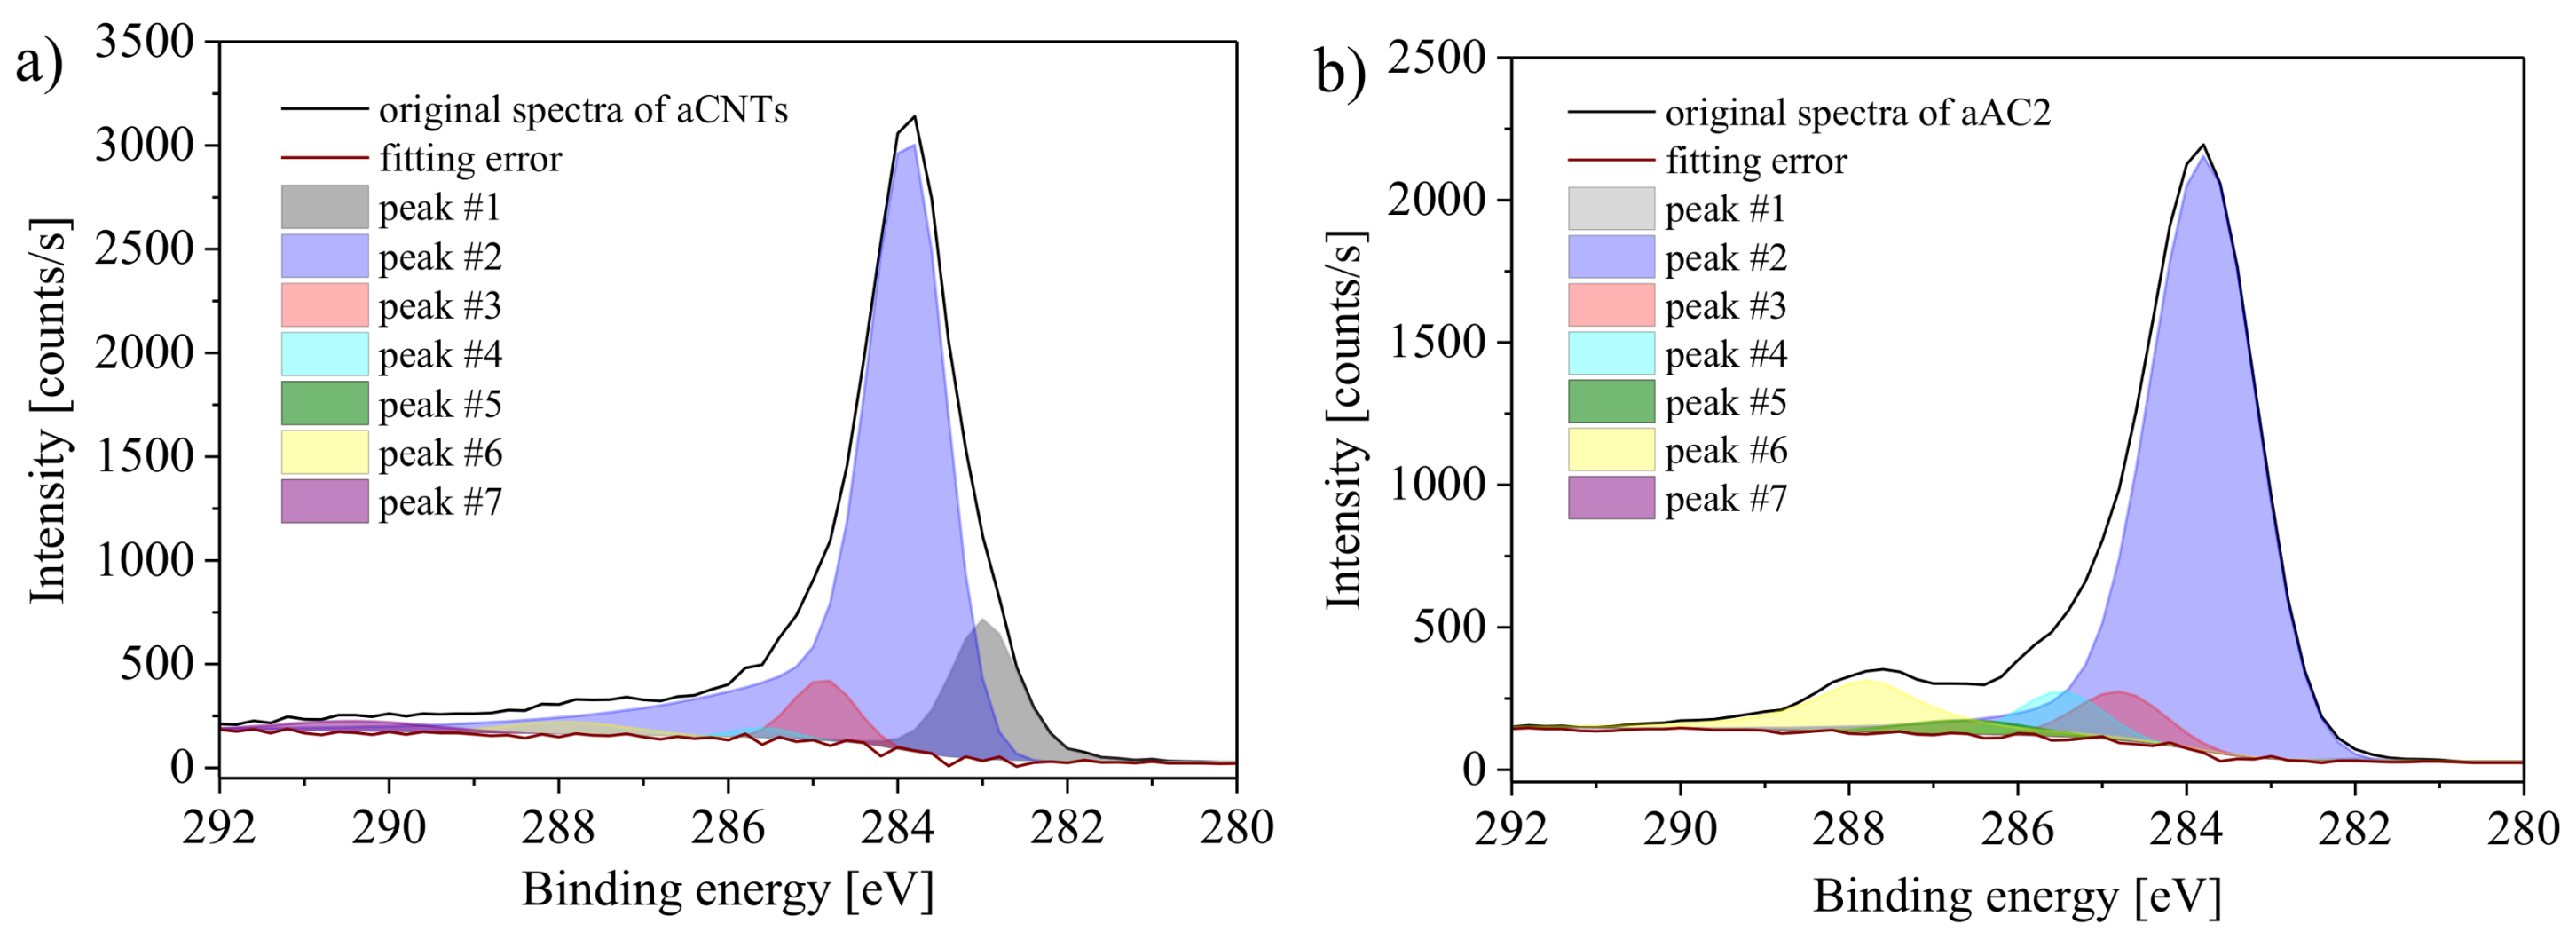
Figure 9 shows the deconvolution of the C1s peak for the samples aCNTs and aAC2. The peak centers of the Gaussian-Lorentzian peaks were set according to the literature [
30,
31,
32]. The peaks were assigned as follows:
Peak #1 (283.8 ± 0.1 eV): vacancy carbon,
Peak #2 (284.9 ± 0.1 eV): conjugated carbon,
Peak #3 (285.9 ± 0.1 eV): non-conjugated carbon,
Peak #4 (286.6 ± 0.1 eV): C–O (phenols, lactones, ethers),
Peak #5 (287.7 ± 0.1 eV): C=O (quinones, pyrones),
Peak #6 (288.8 ± 0.1 eV): O–C=O (carboxyl groups, lactones),
Peak #7 (291.4 ± 0.1 eV): π-π*.
In order to obtain the most meaningful results, a deconvolution of the spectra was used that enables the best agreement between the oxygen amounts obtained by deconvolution and the oxygen amount calculated from the ratio of the C1s and O1s peak areas. By doing that, not all peaks had significant peak areas for all carbon materials. The π-π* signal, for example, arose only for the samples aCNTs and aAC1. The rather uncommon peak located at 283.3 eV was mainly necessary for aCB and aCNTs to recreate the shape of the spectra between 283 and 285 eV (lowest fitting error). A signal at this position has been ascribed to carbon atoms close to vacancies [
32].
It is worth noting, however, that evaluating the C1s spectrum is not straightforward as the C1s signal is commonly used as reference point for XPS data analysis (most samples that are air-exposed contain so-called adventitious carbon as impurity). Furthermore, it is difficult to unequivocally quantify specific oxygen groups because different fits can lead to very similar overall spectra. Therefore, although the method is quite powerful and sensitive, it may also be quite subjective.
In addition to the general limitations, carbon atoms in different surface groups possess identical chemical environments, which can be easily seen from
Figure 1. This leads to an indistinguishability of some groups. In contrast to the overlap of groups at the same binding energies, lactones are detected at two different binding energies. One of its carbon atoms is bonded to both included oxygen atoms, which results in a higher binding energy (peak #6). The other carbon atom is only bonded to the bridging oxygen atom, which causes a lower binding energy (peak #4). As a result, one group influences two peaks and a high accuracy of the quantification of individual groups is not possible. Nevertheless, the spectra provide reasonable estimates. Notable differences between the different carbon materials can be identified. Results of the XPS measurements are summarized in
Table 2.
3.4. Overall Comparison–Accuracy of the Quantification
As mentioned before, the accuracy of the BT can only be derived by comparing the results in reference to other analytical methods. However, the individual analysis methods are based on different physical and chemical principles. EA, XPS, TPD and the physisorption of N2 are called “dry” methods because the quantification takes place on dry samples. On the other hand, the BT analyzes the samples by chemical reactions in aqueous solutions (“wet” analysis). This can influence the accessibility of the surface groups significantly. For example, the non-oxidized carbon black is hydrophobic and the base solution therefore does not wet the surface.
Besides the classification in wet and dry methods, all methods show general specific characteristics, advantages and disadvantages that are summarized in
Table 3.
The table shows that the different methods do not probe the same fraction of the sample and provide not the same information depth. Depending on the application in mind, one or the other methods might be more suitable. Nevertheless, the combined results from EA, TPD, and XPS provide a broad data base for discussing the accuracy of the BT method.
3.4.1. Absolute Amounts of Surface Groups
All methods except EA provided information on the type and amounts of surface groups. Based on these results, the total amount of oxygen in the different samples was calculated. For the BT method, this was done by summarizing the quantities of the detected surface groups and multiplying with the molecular weight of oxygen within the functional group. For the TPD method, the oxygen content was calculated from the mass loss related to the detected amount of CO and CO
2 (calculation example in
Supplementary Materials). For the XPS method, the ratio of the O1s to the C1s peak area, corrected by Scofield factors, was used. For the EA method, the oxygen content was simply defined as the difference between the sample amount (100%) and the contents of the elements C, H, N and S. Results are summarized in
Table 4 and show that the same trends are obtained for EA, TPD and the BT method, i.e., the least oxygen amount was found for aCB, the largest amount for aAC2.
The absolute values, however, significantly deviate from each other. In all cases, the BT method provides the lowest values, followed by TPD and EA. Considering
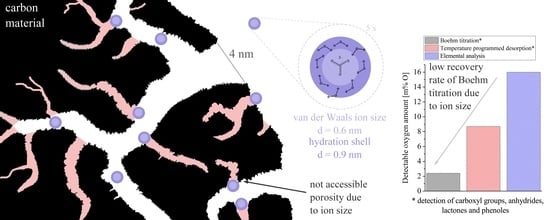
Table 3, the results can be rationalized. As one extreme, EA probes the whole sample, i.e., all surface groups as well as the interior of the sample particles. It is therefore not surprising that this method leads to the largest oxygen amounts. The other extreme is the BT method that probes inner and outer surfaces accessible to the reaction base and is only sensitive to certain surface groups. For the BT and TPD method, although both determine the same surface groups, results for the latter are much larger by factors of two to ten, depending on the sample. Although TPD also probes the interior of particles, a second important factor explaining these differences may relate to the pore size of the carbon material. In the BT method, only the surface groups that are accessible by the base solution (or more precisely the base ions) can be detected. For the carbonate anion, a van der Waals radius of 250–300 pm can be estimated by adding the C–O bond length to the van der Waals radius of the oxygen [
33]. Since the base ions possess a negative charge, a solvation shell is formed in which water aligns with the hydrogen atom facing the base ions. This increases the effective volume of the ion. The molar volume of hydrated carbonate anions has been estimated to 267 cm
3 mol
−1, which corresponds to a diameter of about 0.95 nm considering a single hydrated ion [
34]. In addition, the water molecules must have a certain distance to the carbon atoms in the pores. This distance is reported to be 0.15 nm for CNTs [
35]. This suggests that solvated carbonate ions cannot easily enter all micropores and some surface groups therefore cannot be detected. In addition, the surface groups themselves can hinder the diffusion. Their negative partial charge leads to a repulsion of the anions.
The worst agreement between BT and TPD is found for the aCB sample. Here, also the poor wetting properties might hinder a complete pore filling. This underlines that BT titration is only effective when the sample is sufficiently hydrophilic.
Interestingly, XPS results do not follow the same trend as found for the other methods. Here, the oxygen content of aCB is found to be higher as compared to aCNTs. It is difficult to explain this finding, but, as mentioned above, XPS probes only the very top surface of the sample and results might be influenced by surface impurities. This might also explain the surprisingly high oxygen contents for the samples with the smallest surface areas.
3.4.2. Ratios between Different Surface Groups
Although qualitative proof for surface functionalization is relatively easy by the applied methods, it is of greater interest to know which surface groups are most frequently present. For this, the ratio of the different oxygen groups has to be determined, which is more challenging.
In this validation, the results from the BT method were compared to results from XPS and TPD. Referring to this, the main problem is that interferences (overlaps) are present that complicate the differentiation between certain surface groups. For example, anhydrides are hydrolyzed by water into two carboxyl groups. Accordingly, distinguishing between anhydrides and carboxyl groups is not possible by the BT method. Moreover, the BT method is only sensitive to acidic groups and the used bases are not necessarily as specific to certain groups as ideally assumed. The p
Ka values of the surface groups can differ due to their chemical environment. For carboxyl groups, p
Ka values between 0 and 7 are found in organic compounds depending on their chemical environment [
36]. As a result, some of these groups would not react with NaHCO
3 (p
Ka value of 6.4). For further discussion, however, the classical definitions made by H.P. Boehm will be used. In XPS, interferences are also present with respect to the binding energy of the atoms within some groups. For example, carbon atoms within carboxyl groups and lactones both have high binding energies. Carbon atoms within ethers, phenols and lactones show the same low binding energies. Interferences in the TPD appear due to the different stability of groups by their chemical environment. This makes it impossible to predict whether one or two different groups will be decomposed at a specific temperature. In addition, the desorption of gases can be delayed caused by macro kinetic processes within the pore system of the carbon materials.
Beside the interferences, the results of all used analysis methods indicate that the oxidized carbon materials contain different ratios of the specific oxygen groups even though they have been treated with the same oxidation process. This shows that the chemical activity of tested carbon materials is different and is therefore structure dependent. For example, aAC2 contained more phenols than lactones whereas aCNTs showed higher lactone proportions. However, all materials showed high amounts of carboxyl groups.
Generally, the results of the BT and TPD method (
Figure 5 and
Figure 8) are in line in terms of the ratio between the surface groups. From the results, two things stand out as a difference. First, sample aAC1 and aCB showed significantly increased values for all groups in TPD compared to the other two carbons. Secondly, the lactone content in the TPD was significantly larger for aCNTs and aAC2 compared to the other oxygen groups. Especially with regard to the lactones, it is difficult to determine which of the methods leads to a greater accuracy. Two facts point towards a lower accuracy in the TPD. First, due to the deconvolution of the CO
2 curve and thus the mathematical processing of a practically obtained amount of CO
2, the quantification by means of TPD is generally more prone to failure. Second, the lactones are quantified over a broad range at high temperature. It is quite possible that other decomposition reactions also led to a release of CO
2.
Unfortunately, the XPS enables only the quantification of atoms with different chemical environments. A direct allocation to specific surface groups is not possible due to the many interferences. However, regarding the amount of phenols and carboxyl groups, the XPS results support the ratio found by TPD and BT. The peak #3 has almost half the peak area of peak #5 for aCB, aCNTs and aAC2, which indicates a little bit more than twice as many carboxyl groups as phenols (
Table 3). Only for aAC1, the peak #3 is significantly higher and has a size of 80% of the peak #5. This higher ratio of phenols could also be found in TPD and BT.
Compared to TPD and BT, the XPS have the advantage to quantify basic groups. The evaluation of peak #4 (C=O) indicates, that aCB and aCNTs had less basic groups than the limit of detection. aAC1 and aAC2 showed about 2%, which is a comparatively low amount regarding the whole oxygen amount of approx. 15%. However, this indicates, that the HNO3 treatment preferably generates acidic surface groups.
It can be summarized that especially regarding the ratio of the surface groups the results from the TPD and XPS are in accordance with the results of the BT method. Carboxyl groups were most prevalent (except for aCNTs) and phenols were above the level of lactones. Consequently, the BT allows a relative quantification and it is surely derivable which of the acidic oxygen groups is most or least present on the material.
4. Conclusions
Four structurally very different carbon materials with varying morphology and specific surface were analyzed by the BT method and results were compared with other analytical methods (TPD-MS, XPS, and EA). Total oxygen contents and, when possible, type and ratio of surface groups were determined. For the BT method, surface area and porosity of the carbon materials did not significantly influence the required time for treating the samples with the base solution. After one day, more than 97% of the accessible groups were reacted. This means that a broad range of carbon(nano)materials can be conveniently analyzed by the BT method. All samples were equally pre-treated so one expects that the total oxygen content increases with the specific surface area of the sample. This trend was confirmed by the BT, TPD-MS, and EA methods. Total oxygen contents increased in the order aCB < aCNTs < aAC1 < aAC2. The total amounts of oxygen, however, strongly deviated between the different methods. The BT method provided the smallest values followed by TPD and EA. Results from XPS are somewhat different. By absolute numbers, they are closest to results for EA though the oxygen content for aCB was higher than for aCNTs.
BT and TPD method were applied to determine the ratio of the different surface groups. The most frequent surface groups were carboxyl groups followed by phenols and finally lactones. Agreement between the different methods as well as fundamental differences were discussed in view of the analytical technique and the studied carbon materials.
With BT, a generally higher precision of the results can be achieved compared to XPS or TPD-MS. The ratio of the amount of oxygen groups can be calculated directly from the obtained base consumption. No complex data interpretation such as deconvolution of total spectra is needed. On the other hand, a certain level of hydrophilicity is required. Otherwise the reaction base would not be able to penetrate the whole material. In the case of microporous carbon samples, the accessibility of the surface groups could be hindered because of the too large diameter of the base ions. Both would lead to a detection of reduced absolute values. Besides, a larger sample amount is needed compared to the other methods, especially in the case of low surface area materials.
Remembering that all applied methods probe different volumes or parts of the sample, the BT method is especially attractive in case one wants to determine the fraction of surface groups that is accessible to aqueous solution, e.g., in applications such as water treatment or supercapacitors.


