Article

Optimization of Arthrospira platensis (Spirulina) Growth: From Laboratory Scale to Pilot Scale

1
Commissariat à l’Energie Atomique et aux Energies Alternatives (CEA Cadarache), Groupe Biomasse 3G, F-13108 Saint-Paul-lez-Durance, France
2
Microphyt, 713 Route de Mudaison, F-34670 Baillargues, France
3
Commissariat à l’Energie Atomique et aux Energies Alternatives (CEA Cadarache), Centre National de la Recherche Scientifique, Aix Marseille Université, UMR7265, Institut de Biosciences et Biotechnologies Aix Marseille, F-13108 Saint-Paul-lez-Durance, France
4
Spiruline de la côte bleue, Les fortunés, Route des Bassins, F-13180 Gignac-la-Nerthe, France
*
Author to whom correspondence should be addressed.
Fermentation 2017, 3(4), 59; https://doi.org/10.3390/fermentation3040059
Submission received: 12 October 2017 / Revised: 1 November 2017 / Accepted: 2 November 2017 / Published: 7 November 2017
(This article belongs to the Special Issue Cultivation and Downstream Processing of Algal Biomass)

Abstract

:
Arthrospira platensis (Spirulina) is the most cultivated microalga worldwide. Improving its cultivation in terms of biomass productivity, quality, or production cost could significantly impact the Spirulina industry. The objectives of this paper were defined as to contribute to this goal. Spirulina biomass productivity was investigated through medium choice. A modified Zarrouk’s medium was selected as it gave higher final dry weights and longer sustained growth than Hiri’s and Jourdan’s media. Then, in order to reduce Spirulina production cost, modified Zarrouk’s medium was rationalized by testing different dilutions. It was found that modified Zarrouk’s medium could be diluted up to five times without impacting the growth rates in a 28-days batch cultivation. Higher dry weights were even observed after 21 days of batch cultivation (1.21 g/L for 20%-modified Zarrouk’s medium in comparison to 0.84 g/L for modified Zarrouk’s medium). Iron uptake was then investigated as one of the major contributors to Spirulina nutritional quality. An increase in iron content was obtained by replacing iron sulfate by iron EDTA at a concentration of 10 mgFe/L (2.11 ± 0.13 mgFe/gbiomass for EDTA-FeNa,3H2O at 10 mgFe/L compared to 0.18 ± 0.13 for FeSO4,6H2O at 2 mgFe/L). Impact of light intensity on Spirulina biomass productivity was also investigated in a 2 L Photobioreactor (PBR). Specific growth rates were calculated for Photosynthetically Photon Flux Densities (PPFD) from 85 to 430 µmol/m2/s. At 430 µmol/m2/s, photoinhibition was not observed and the specific growth rate was maximum (0.12/day). Finally, a 40-day cultivation experiment was conducted in a 1000 L PBR giving a maximum daily areal productivity of 58.4 g/m2/day. A techno-economic analysis gave production cost two to 20 times higher for PBR (from 18.71 to 74.29 €/kg) than for open ponds (from 3.86 to 9.59 €/kg) depending on Spirulina productivity.

Graphical Abstract

1. Introduction

Arthrospira platensis is an aquatic, filamentous cyanobacterium which is often classified as a blue/green microalga. The common name of its commercialized biomass is “Spirulina” (the name used in this paper) which production makes this microorganism to be the most cultivated worldwide [1]. The Spirulina production has been estimated to be between 3000 and 20,000 tons/year.
In 2014, in France, 105 Spirulina farmers were registered in the association “Fédération des Spiruliniers de France”. Spirulina is considered to be a nutraceutical due to its high nutritional quality (proteins, essential amino acids and fatty acids, polysaccharides, carotenoids, vitamins, and iron) [2]. Spirulina is almost exclusively produced in open ponds which are low-cost, and easy to build and operate. However, the difficulty of these systems are the low biomass productivity [3,4], less than 15 g/m2/day, the difficultly to maintain optimal cultivation parameters, their high evaporation rates and their weakness towards contamination [5]. However, Arthrospira platensis is a cyanobacterium growing at elevated pH (9.5 to 11.0 with an optimum at 10.5 [6]) and is, therefore, less subject to contaminations [7].
Cultivation medium has a great impact on the productivity of biomass and other compounds of interest. For example, nitrogen concentration in the medium [8] (optimum at 2.5 g/L) and also nitrogen source (urea better than ammonium or nitrate) [9] has a great effect on Spirulina productivity. Additionally, a phosphate concentration of 250 mg/L in the form of K2HPO4 was found to optimize biomass production [10]. A study showed that Zarrouk’s medium (ZM) was the best medium in terms of biomass productivity, while modified Blue-Green 11 medium (BG11) gave the highest chlorophyll, carotenoid, phycocyanin, and allophycocyanin contents [11]. The authors also observed the maximum content of phycoerythrin in synthetic human urine (SHU) medium. However the differences observed by the authors were not significant (less than 10% for most of the results for experiments not performed in triplicates). ZM was also selected over 5 other media (Rao’s, CFTRI, OFERR, revised media, and Bangladesh medium No. (3) for its higher Spirulina biomass productivity [12].)
Three media from the literature were selected in this study: Zarrouk’s [13], Hiri’s [14], and Jourdan’s [15] media (ZM, HM, and JM, respectively). They were compared based on their biomass productivity. Spirulina media contain generally high concentrations of nutrients which impact their cost. Media with reduced cost can be as effective as ZM in terms of final biomass concentration, chlorophyll and protein content [16]. Reduction of the medium cost by dilution with ultrapure water was then tested.
Initial biomass concentration was previously described to have an effect on biomass productivity for the microalga Haematococcus pluvialis [17]. An initial biomass concentration of 0.5 g/L was found to optimize asthaxanthin productivity. The influence of the initial biomass concentration in a batch cultivation on the growth of Spirulina was also studied.
Spirulina media have generally low iron concentration (2 mgFe/L for ZM and HM, and 0.2 mgFe/L for JM). Using typical iron content value of 1 mgFe/g [18], maximal theoretical biomass concentrations are only 0.2, 2, and 2 g/L for JM, ZM, and HM, respectively (assuming that iron is always bio-available for Spirulina). Iron is a very important element in human nutrition since anemia is the most common food deficiency concerning two billions people worldwide [19]. Despite low iron concentrations in its cultivation media, Spirulina contains high amount of iron [20] (0.58–1.8 g/kgbiomass). Therefore, an experiment was designed to increase the Spirulina’s iron content by using higher iron concentrations in the medium and by using two different sources of Fe-EDTA.
Light intensity has a great impact on Spirulina productivity. Two independent studies found that Spirulina final biomass concentration productivity was the highest at the highest photosynthetically photon flux density (PPFD) they used (around 60 µmol/m2/s) [10,21]. Light saturation was not reached; an increase in biomass productivity could certainly be achievable with PPFD higher than 60 µmol/m2/s. The effect of PPFD) from 85 to 430 µmol/m2/s on the growth of Spirulina was, therefore, studied.
Finally, a 40-day cultivation run was performed in a 1000 L-photobioreactor (PBR) during spring 2015 for evaluating the possibility of growing Spirulina in PBRs in order to improve Spirulina biomass productivity.

2. Materials and Methods

2.1. Strain

Arthrospira platensis from Paracas (Peru, strain no. 14067 from Limnologie, Rennes, France) was used in this study. It was selected for its higher growth rates (data not shown) in comparison to another Arthrospira platensis strain (Arthrospira platensis from Lonar, India, strain no. 14039, Limnologie, Rennes, France).
Modified versions of three media designed for Spirulina growth were used in this study: JM, HM, and ZM. Their composition is shown in Table 1. A modification of these media were done for comparison purposes and practical reasons. The same trace elements solution was used for these three media: the Hutner’s solution without iron [22]. Its composition is: 50 mg/L of EDTA; 11.4 mg/L of H3BO3; 22 mg/L of ZnSO4,7H2O; 5.06 mg/L of MnCl2,4H2O, 1.61 mg/L of CoCl2,6H2O; 1.57 mg/L of CuSO4,5H2O; and 1.1 mg/L of Mo7O24(NH4)6,4H2O. These minerals were diluted in ultrapure water (Purelab Ultra, Veolia Water STI, Le Plessis Robinson, France).
Fe-EDTA solutions were obtained from Akzo Nobel (Dissolvine® E-Fe-13 with 13% of EDTA-FeNa,3H2O, Amsterdam, The Netherlands) and Plantin (Ferro 8 with 8% of EDTA-FeNH4, Courtezon, France).

2.2. Culture Conditions

Spirulina cultures were grown in incubation shakers (HT Multitron Pro from Infors, Baar, Switzerland) which were set to 120 RPM, 32 °C, and 11 µmol/m2/s as PPFD.
Lab-scale 2 L-photobioreactors from Diachrom Biotechnology (Bottmingen, Switzerland) were used for assessing the effect of light intensity on the growth of Spirulina. Temperature was controlled at 32 °C and agitation was set to 50 RPM. Light was delivered by 4000 K white LEDs (LCW 45M from Osram, Munich, Germany). Light intensities were measured using a light meter ULM-500 and a Spherical Micro Quantum Sensor US-SQS/L both from Walz (Effeltrich, Germany). PPFD varied from 85 to 430 µmol/m2/s (volumetric average value on the whole reactor filled with ultrapure water).
Spirulina was also cultivated in a 1000 L tubular Camargue PBR from Microphyt [23] located in a greenhouse. The PBR, oriented north-south, consists of a 240 m piping serpentine glass circuit, with a 76 mm inside diameter and 4.5 mm wall thickness, folded horizontally in 24 straight runs with a vertical height of 3 m and a width of 0.3 m, forming a 10 m long tubular fence. The 1000 L Camargue PBR has a specific area of 8.84 m2/m3.

2.3. Growth Data

The dry weight was measured after desiccation on pre-weighed filters with a porosity of 0.7 µm (Sartorius Stedim, Göttingen, Germany): 10 mL of Spirulina cultures were filtered and rinsed twice with the same volume of ultrapure water. The prefilters were maintained at 80 °C overnight in a ventilated oven.
Optical density was measured at 880 nm (OD880) in order to reduce the influence of the pigments absorption (mainly chlorophylls and phycocyanin) with an Epoch 2 Microplate Spectrophotometer from BioTek Instruments, Inc. (Winooski, VT, USA).
Productivities and nutrient consumption rates were calculated using the following formula, with t being the time and At being the dry weight or the nutrient concentration:
Rate   of   A t 1 t 2 = A t 2 A t 1 t 2 t 1

2.4. Biomass Analyses

Iron content was measured using inductively-coupled plasma (ICP) coupled with atomic emission spectrometry (AES) using an ICP-AES Vista MPX (Agilent Technologies, Santa Clara, CA, USA). Fifty milliliters of Spirulina culture were centrifuged at 4750 rpm, 4 °C for 10 min. The iron content in the supernatant was measured. Then, the pellet was washed twice with 15 mL of a 10 mM EDTA solution. The resulting 2 × 15 mL (separated by centrifugation) was analyzed for its iron content from which the adsorbed iron content of the biomass could be deducted. Finally, the washed pellet was hydrolyzed for 24 h at 80 °C in 1 mL of 70% nitric acid (ICP grade, JT Baker) and then diluted to 6 mL with ultrapure water. The hydrolysate was analyzed for its iron content from which the internalized iron content of the biomass could be deducted. The iron concentrations were determined using standard curve obtained by analyzing ICP grade iron standard solutions.
The C/N ratio was determined using an organic elemental analyzer (Thermo Scientific FLASH™ 2000 CHNS/O, Thermo Fisher Scientific, Waltham, MA, USA).

3. Results and Discussion

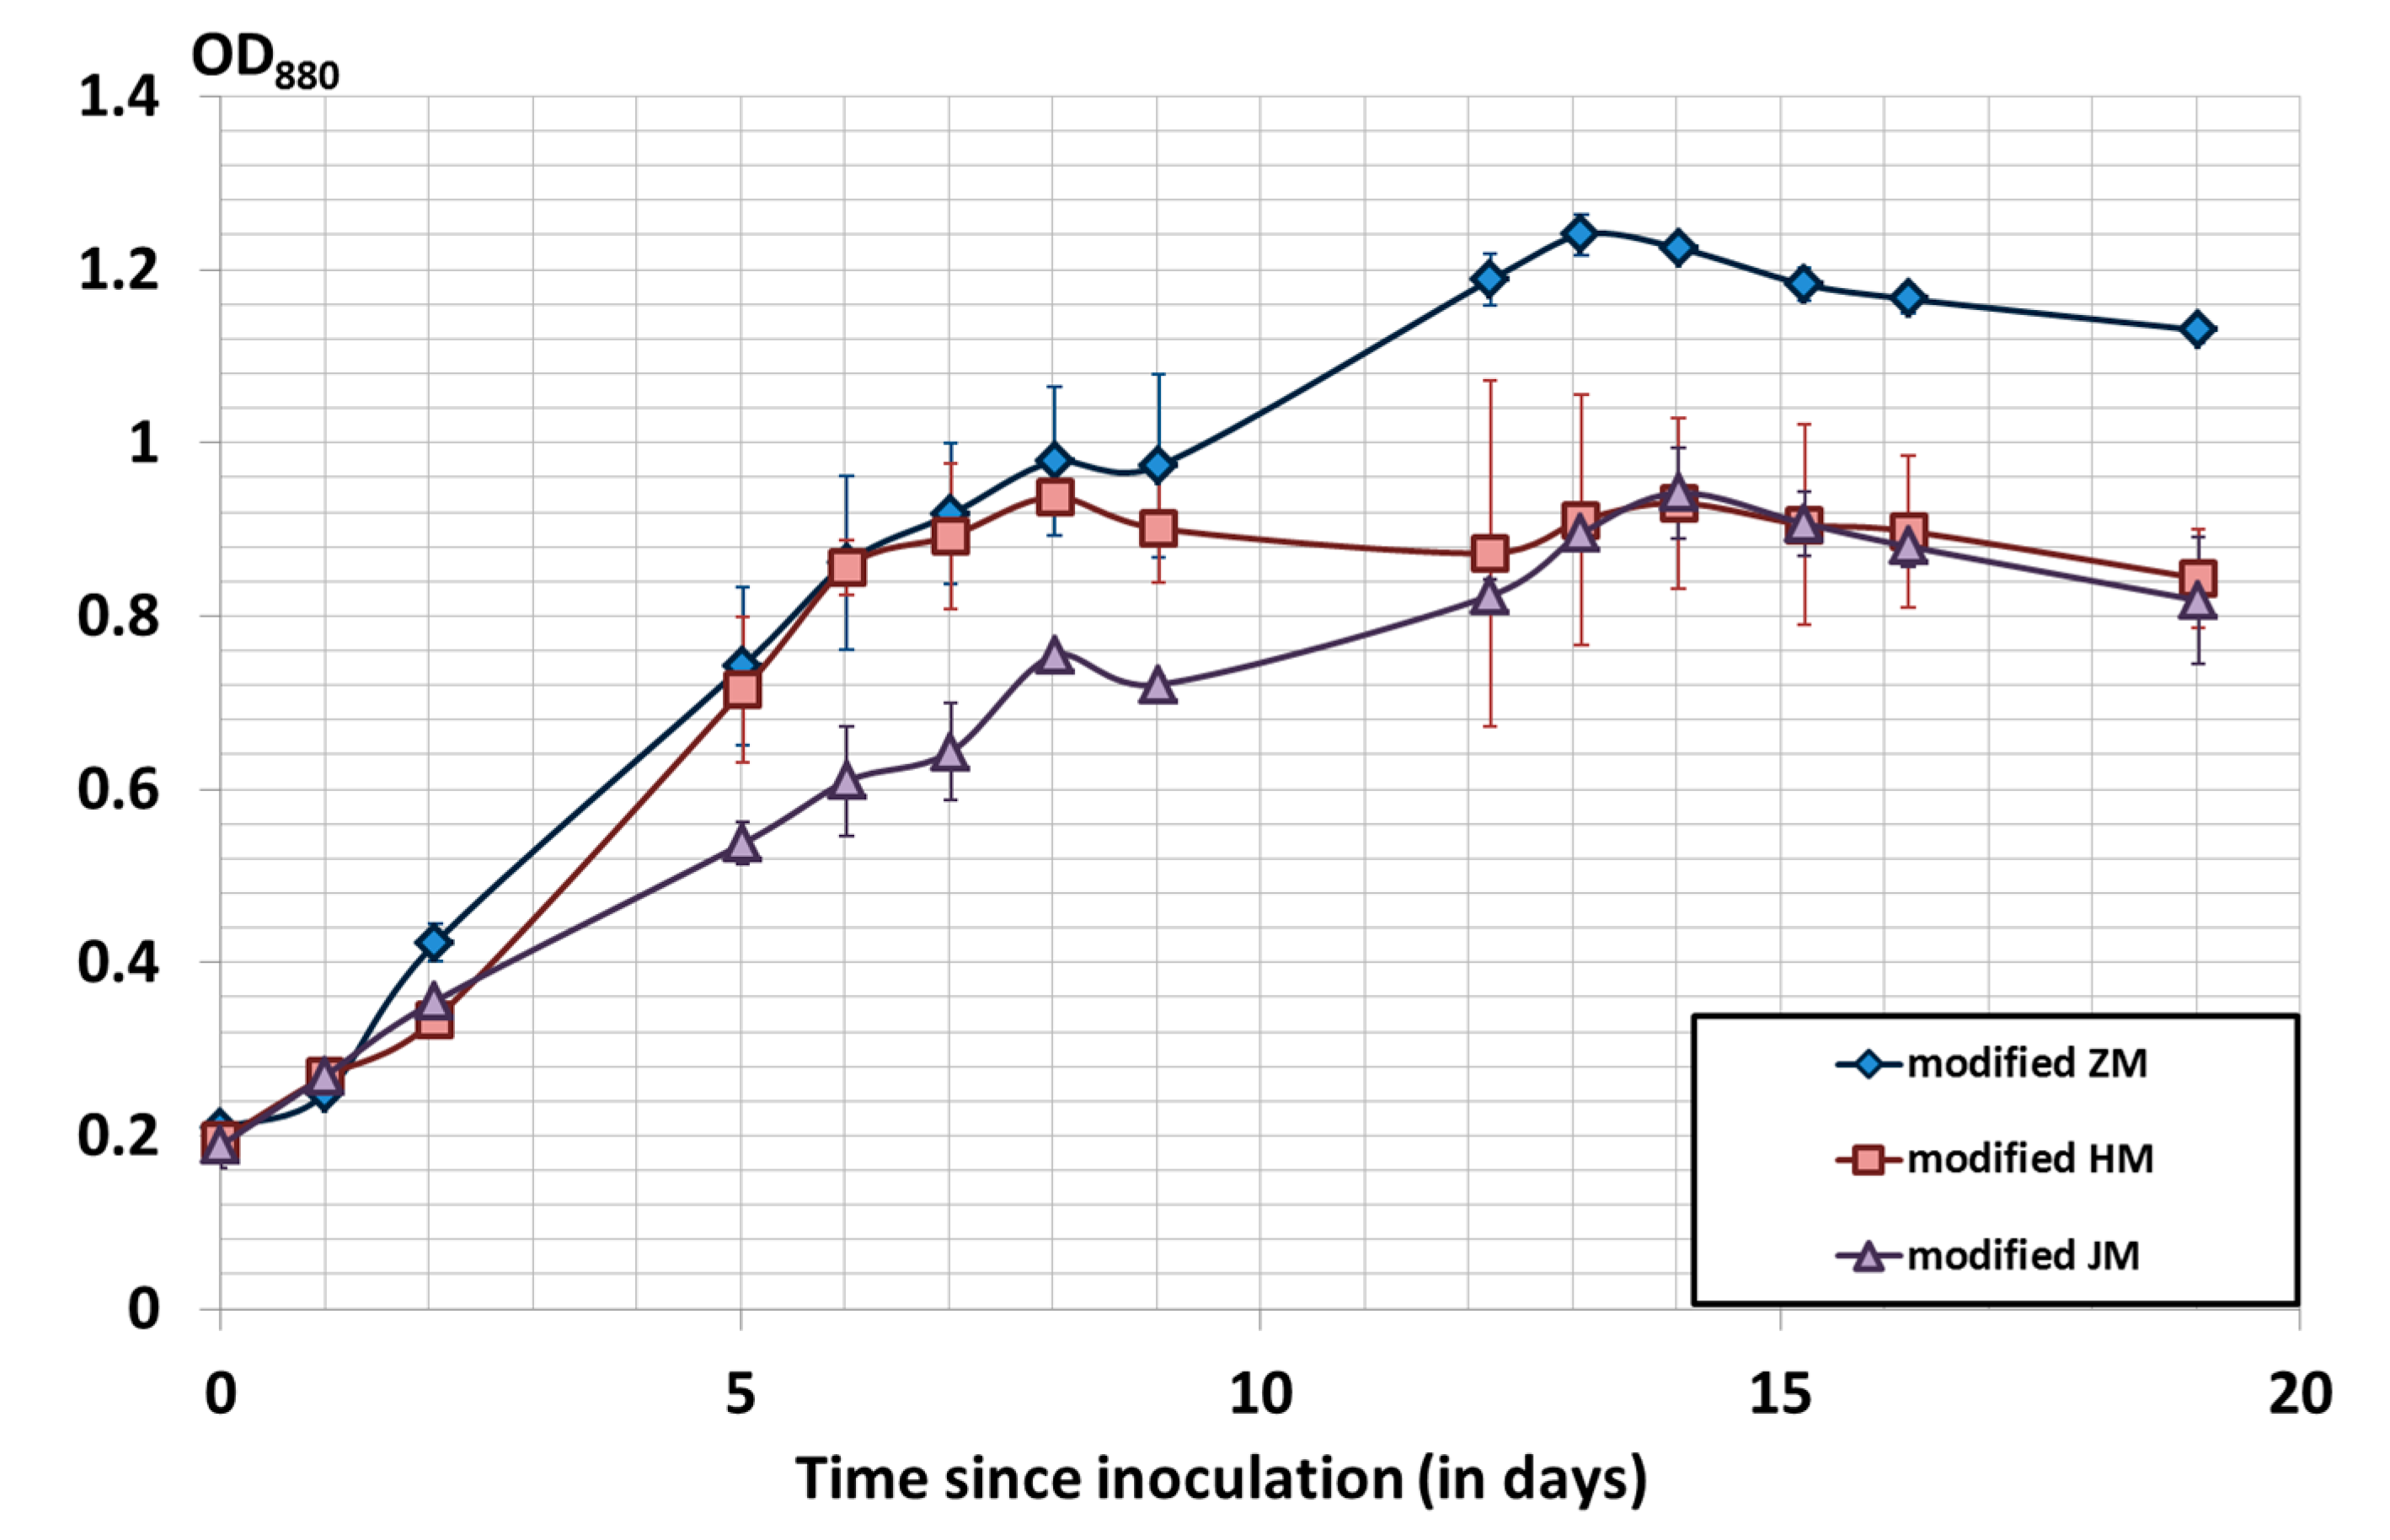
3.1. Culture Media Comparison

Media conventionally used in lab-scale experiments and by Spirulina producers were compared in triplicates, i.e., modified ZM, modified HM and modified JM. Pre-cultures were done in each medium for acclimation. Growth curves are shown in Figure 1. For 10 days, modified ZM and HM showed similar growth curves with higher optical density than modified JM. This difference could be a consequence of the higher sodium bicarbonate concentrations in those two media in comparison to modified JM (twice less sodium bicarbonate). Then, after 10 days, growth continued for modified ZM but not for modified HM. The higher N, P, and S content in modified ZM could explain this more sustained growth. Modified ZM also showed a higher biomass productivity (91.5 ± 4.0 mg/L/day from day 0 to day 13) than modified HM (80.5 ± 1.6 mg/L/day) and modified JM (77.9 ± 3.4 mg/L/day). Modified ZM was then selected for the cultivation experiments. These results were in accordance to another study where the use of ZM gave a higher final dry weight than SHU and modified BG11 media [11].

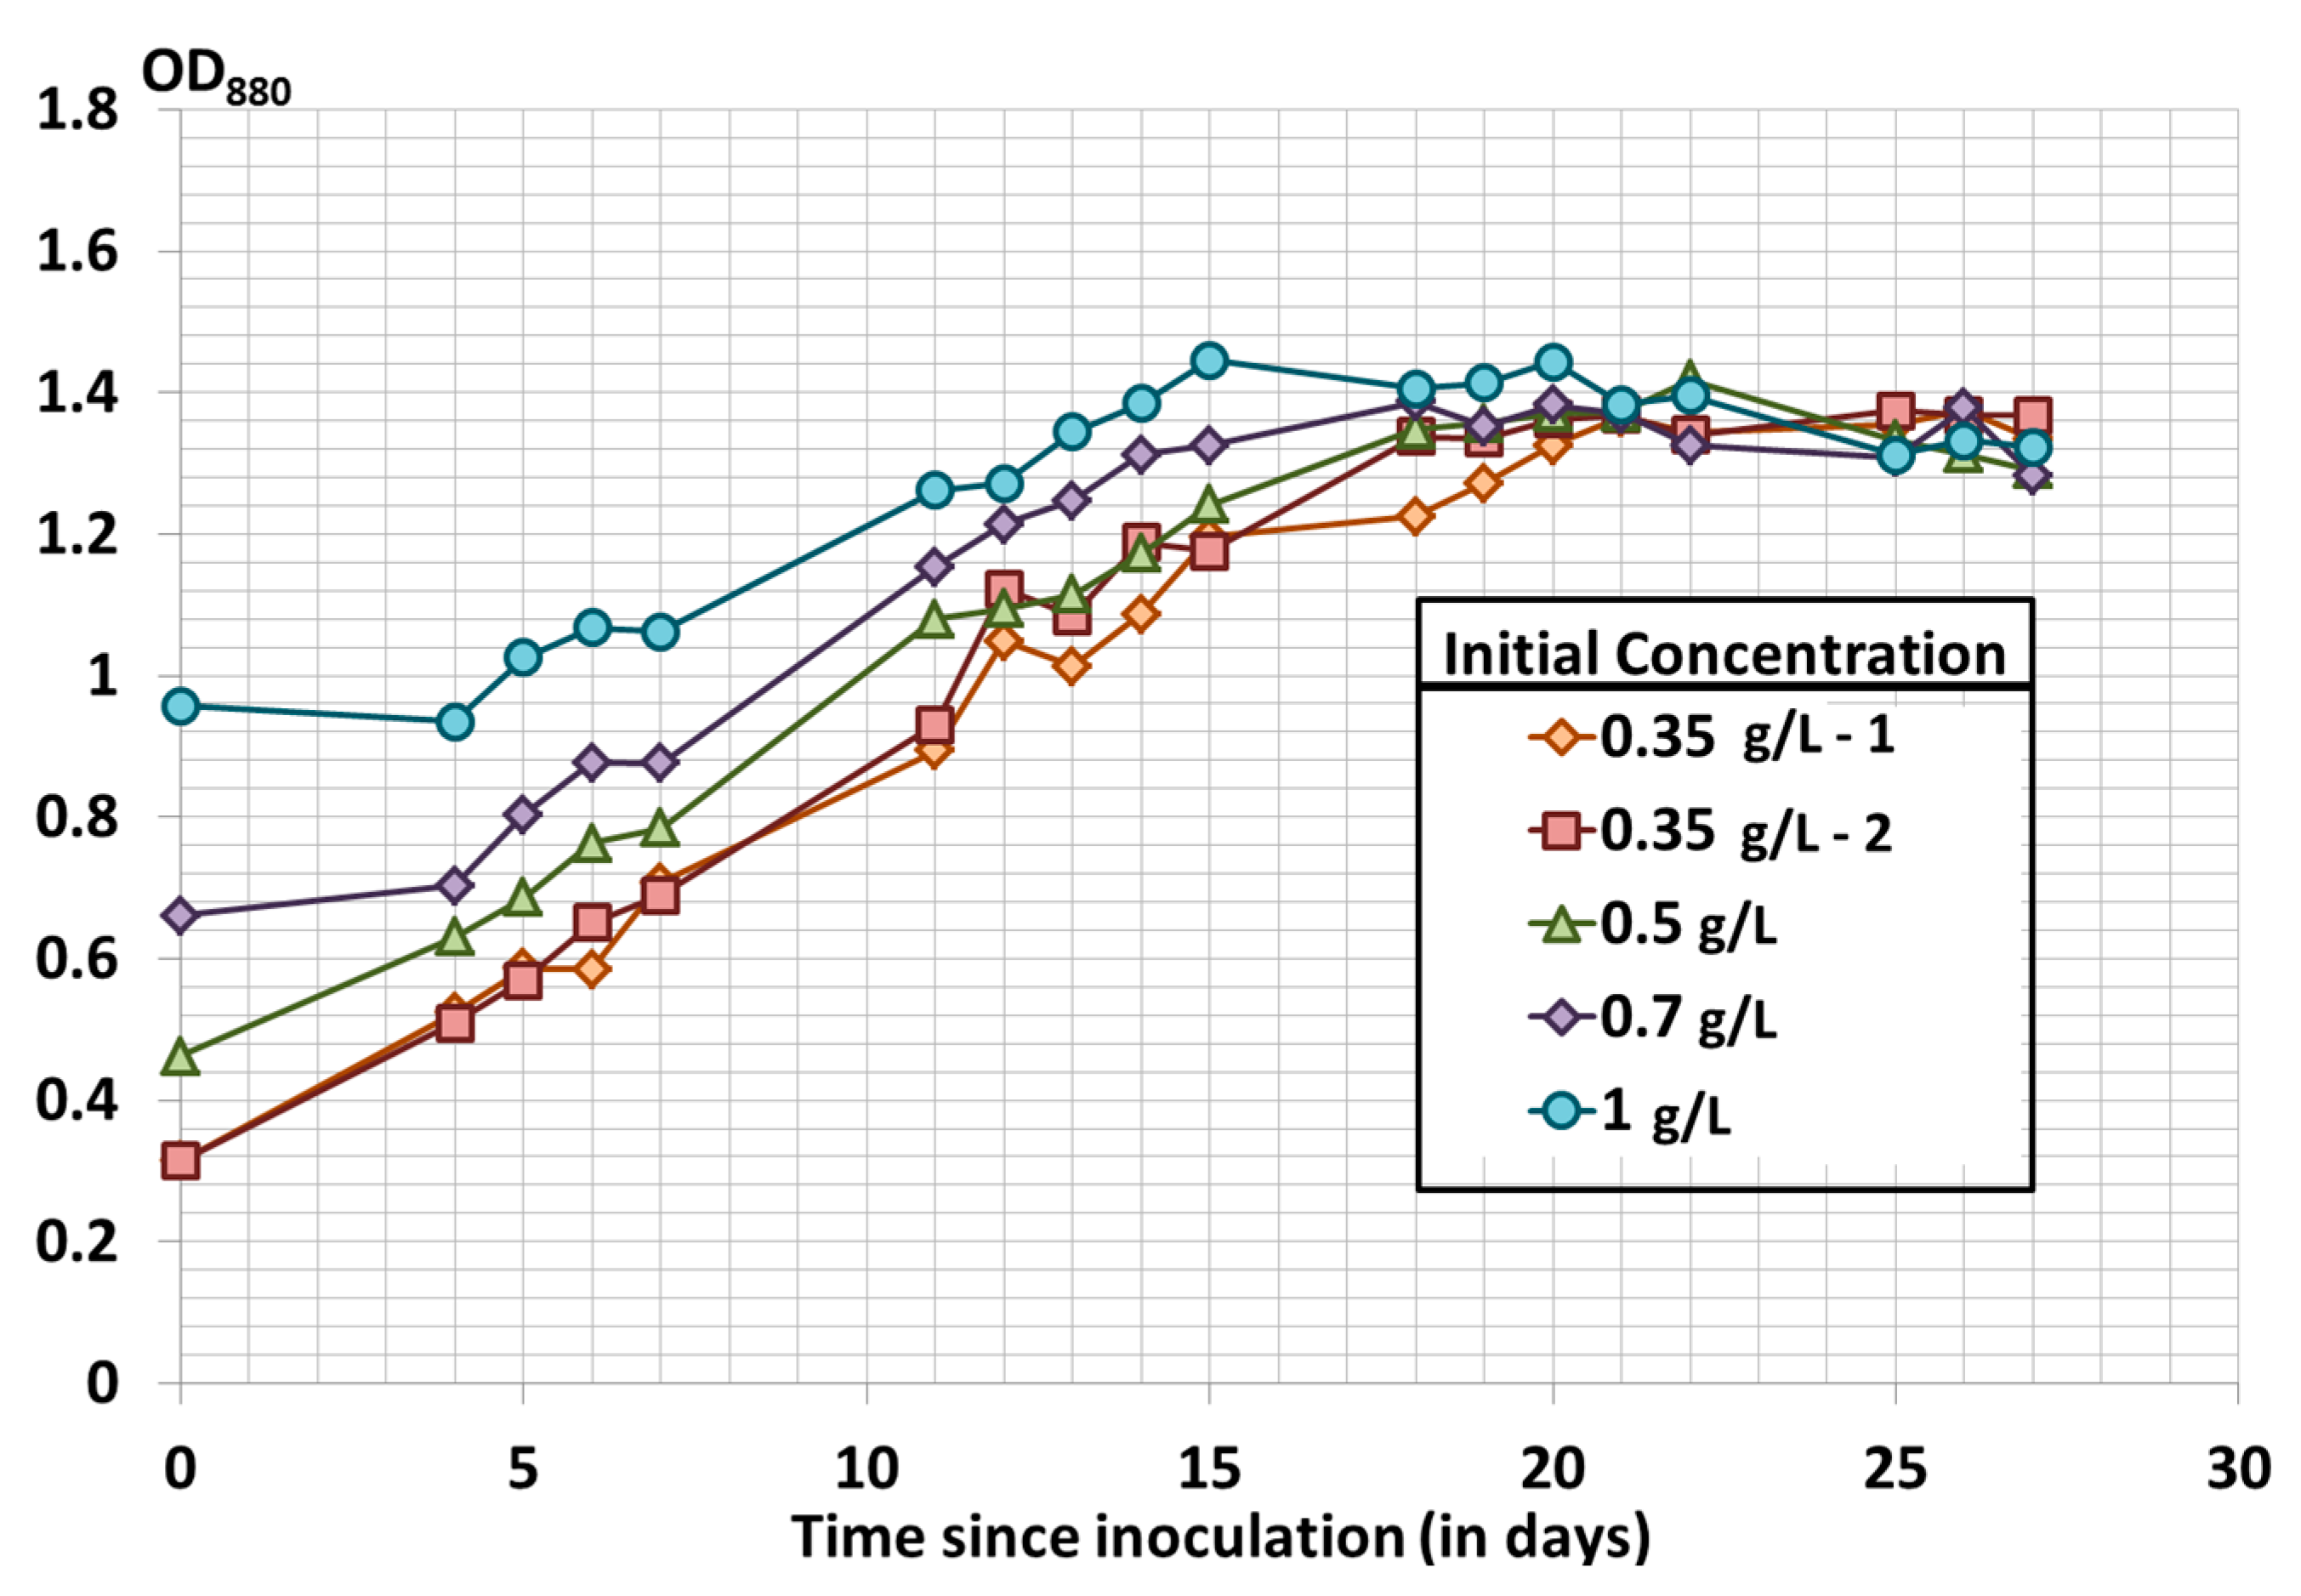
3.2. Effect of the Initial Biomass Concentration on Spirulina Growth Using Modified Zarrouk’s Medium

The influence of the initial biomass concentration was tested with modified ZM (no replicate). As shown in Figure 2, there is no significant difference in the final OD880 for all experiments. All growth curves reached their stationary phase after 20 days with similar OD880. This was possibly due to higher growth rates measured for culture experiment started at lower initial concentration (Table 2) as this could imply more light availability per cell leading to higher growth rates. In a similar study it was found that higher initial biomass concentrations led to lower growth rates due to the shadowing effect [24].
However, the final biomass concentrations were slightly higher when the initial biomass concentration was also higher (Table 2). Similar optical density measurements and different biomass concentrations meant that a change occurred in the biomass optical properties due to different biomass composition. This should be further investigated as a mean to advantageously modify the biomass composition.

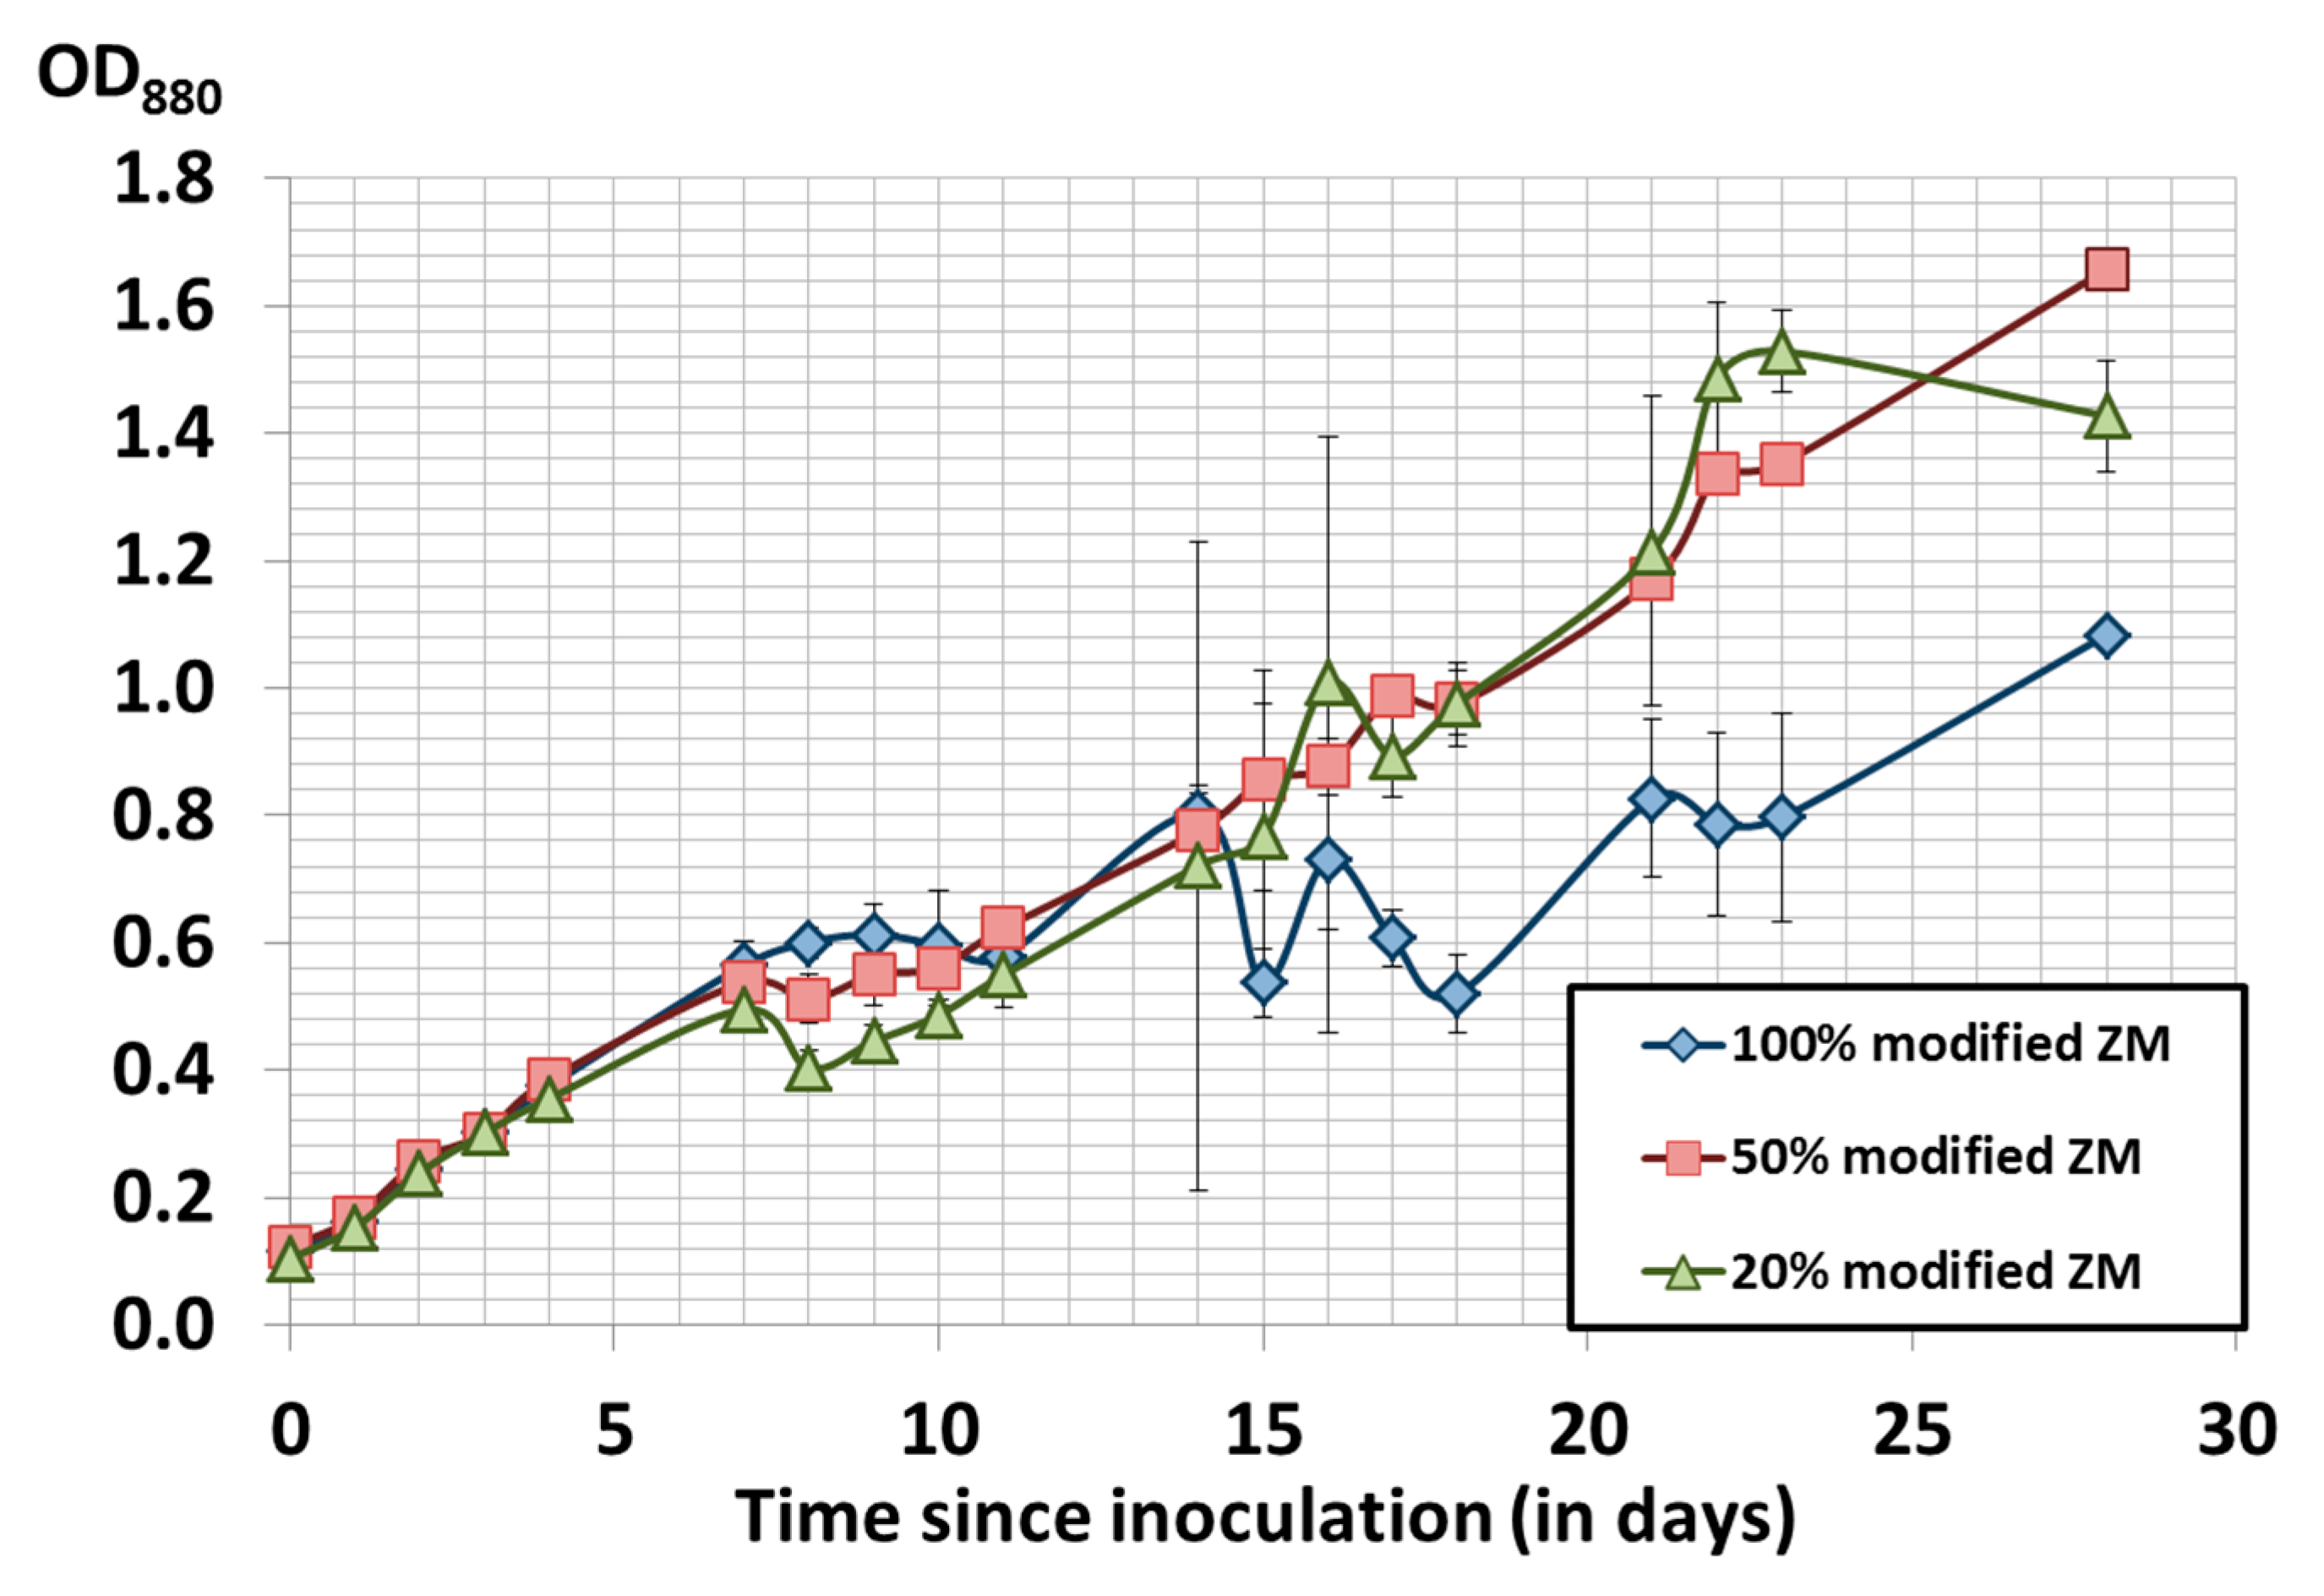
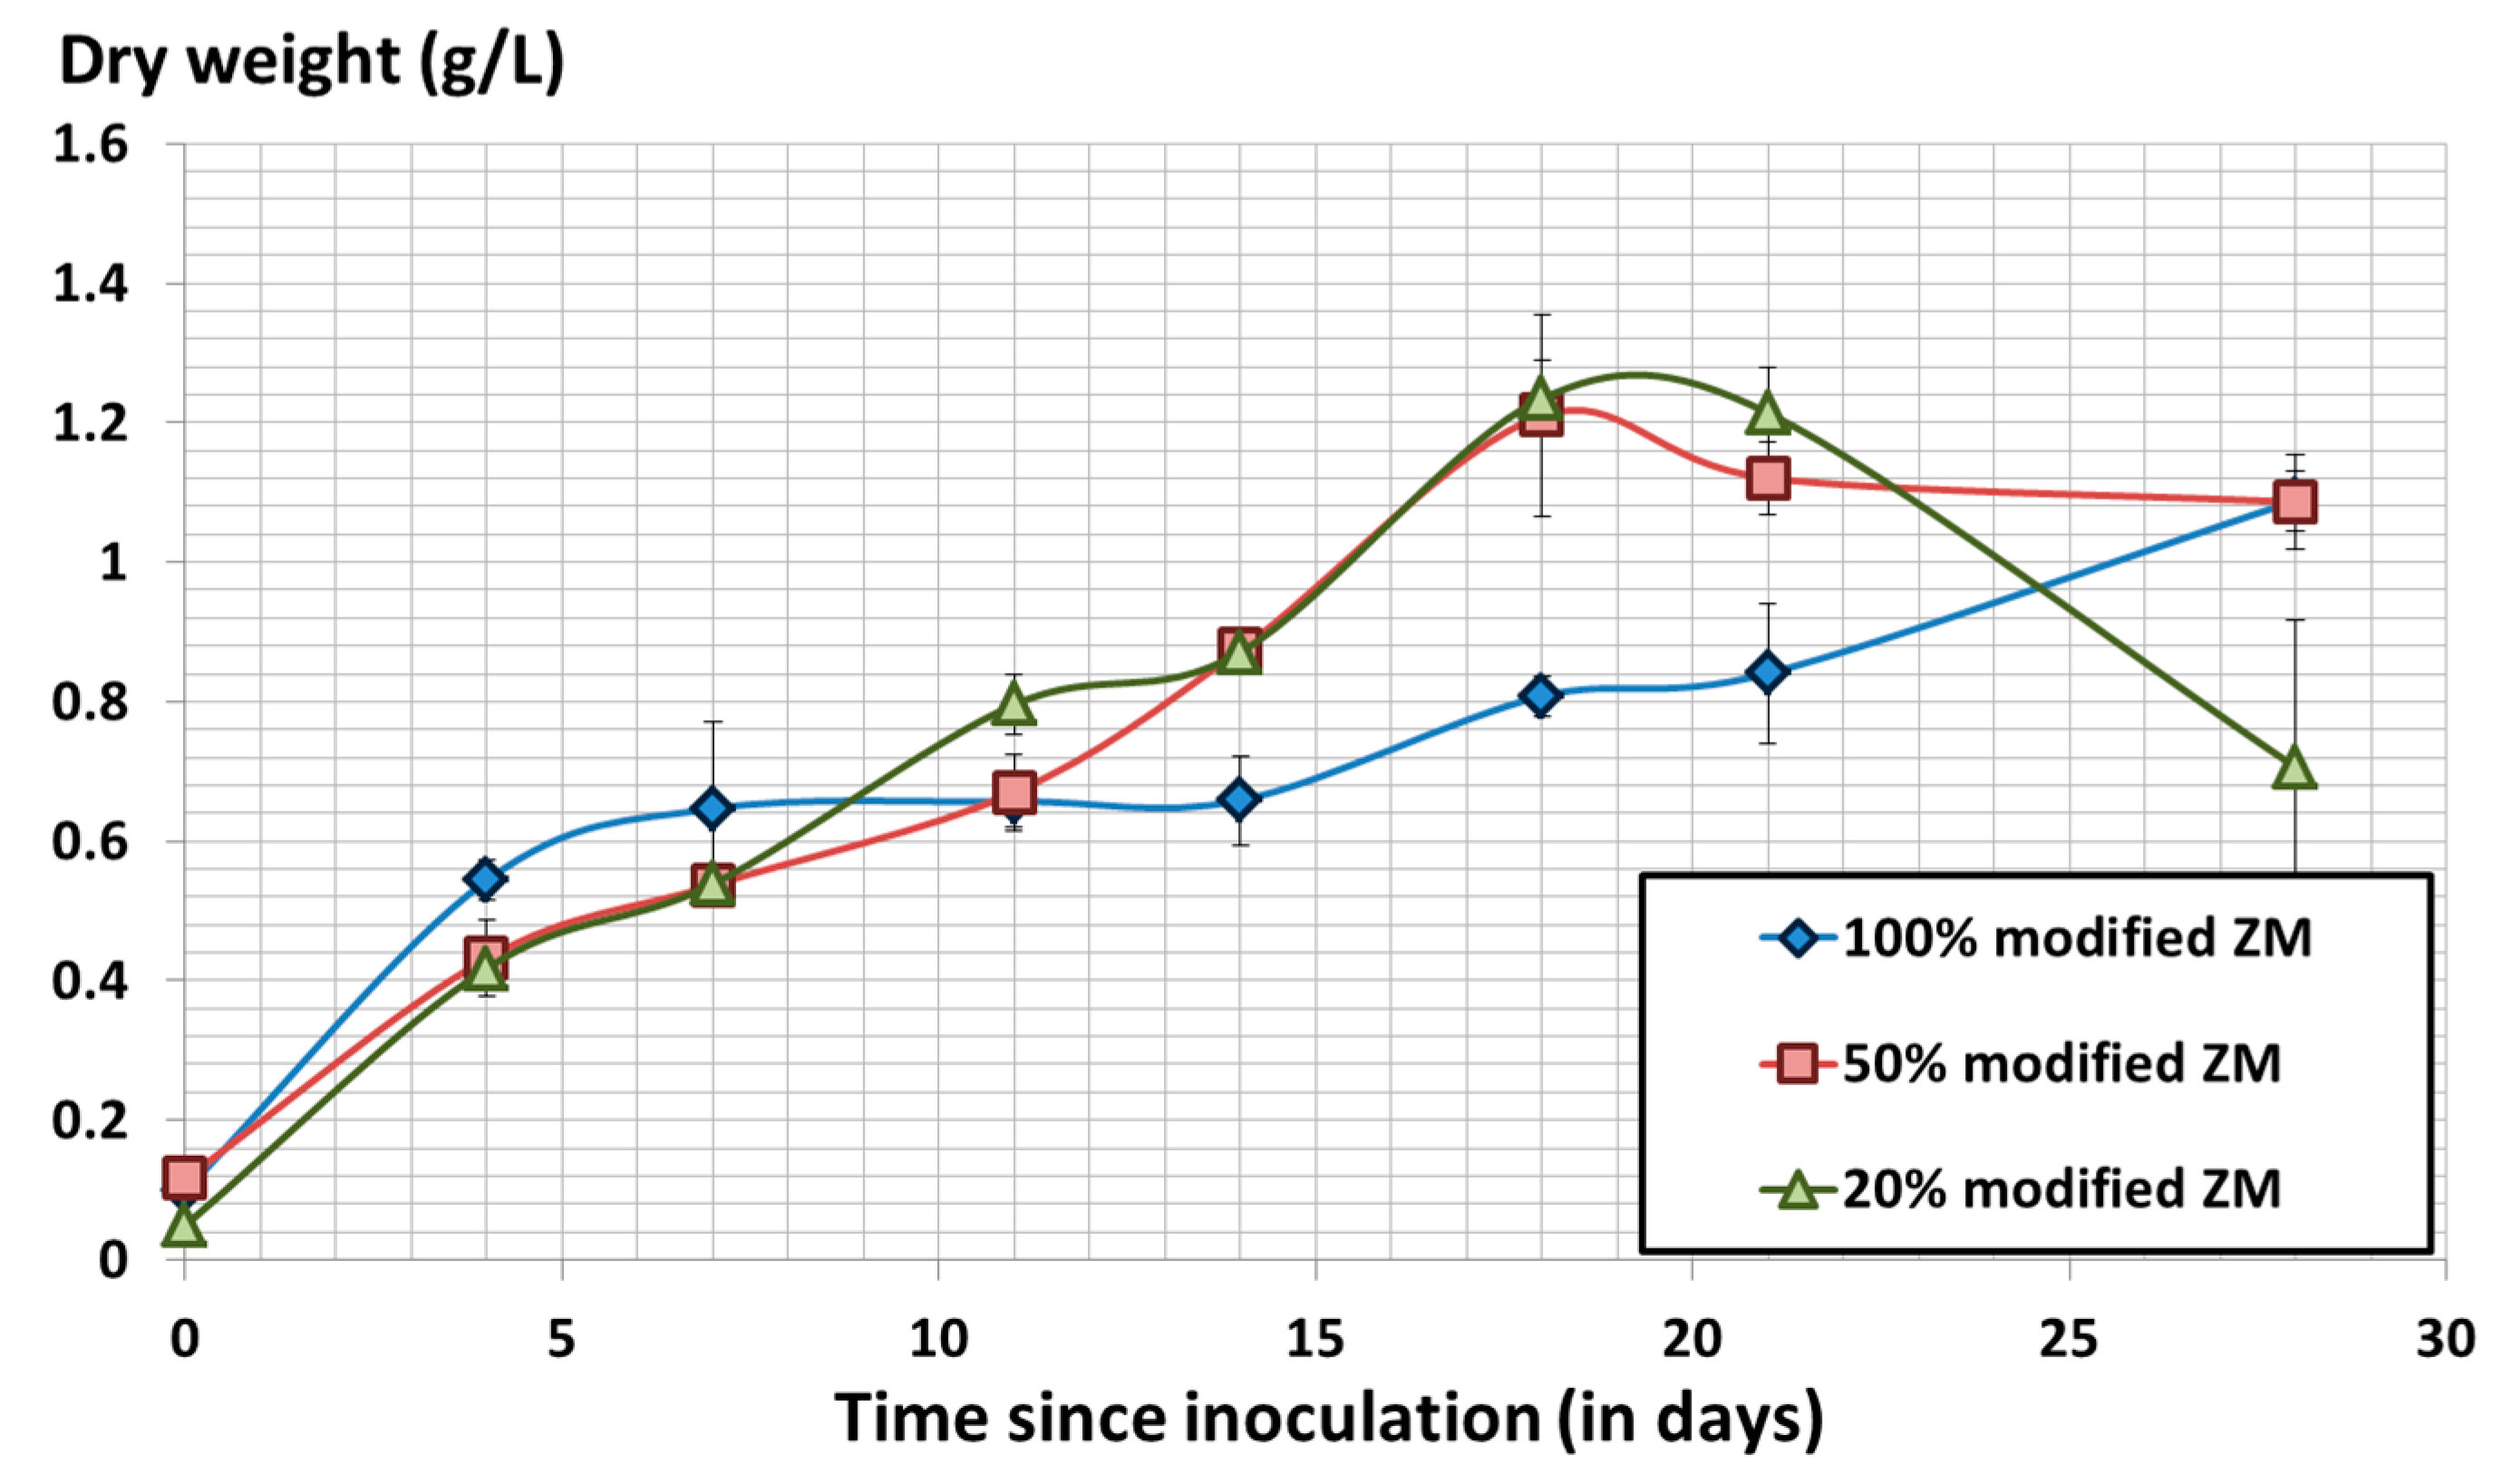
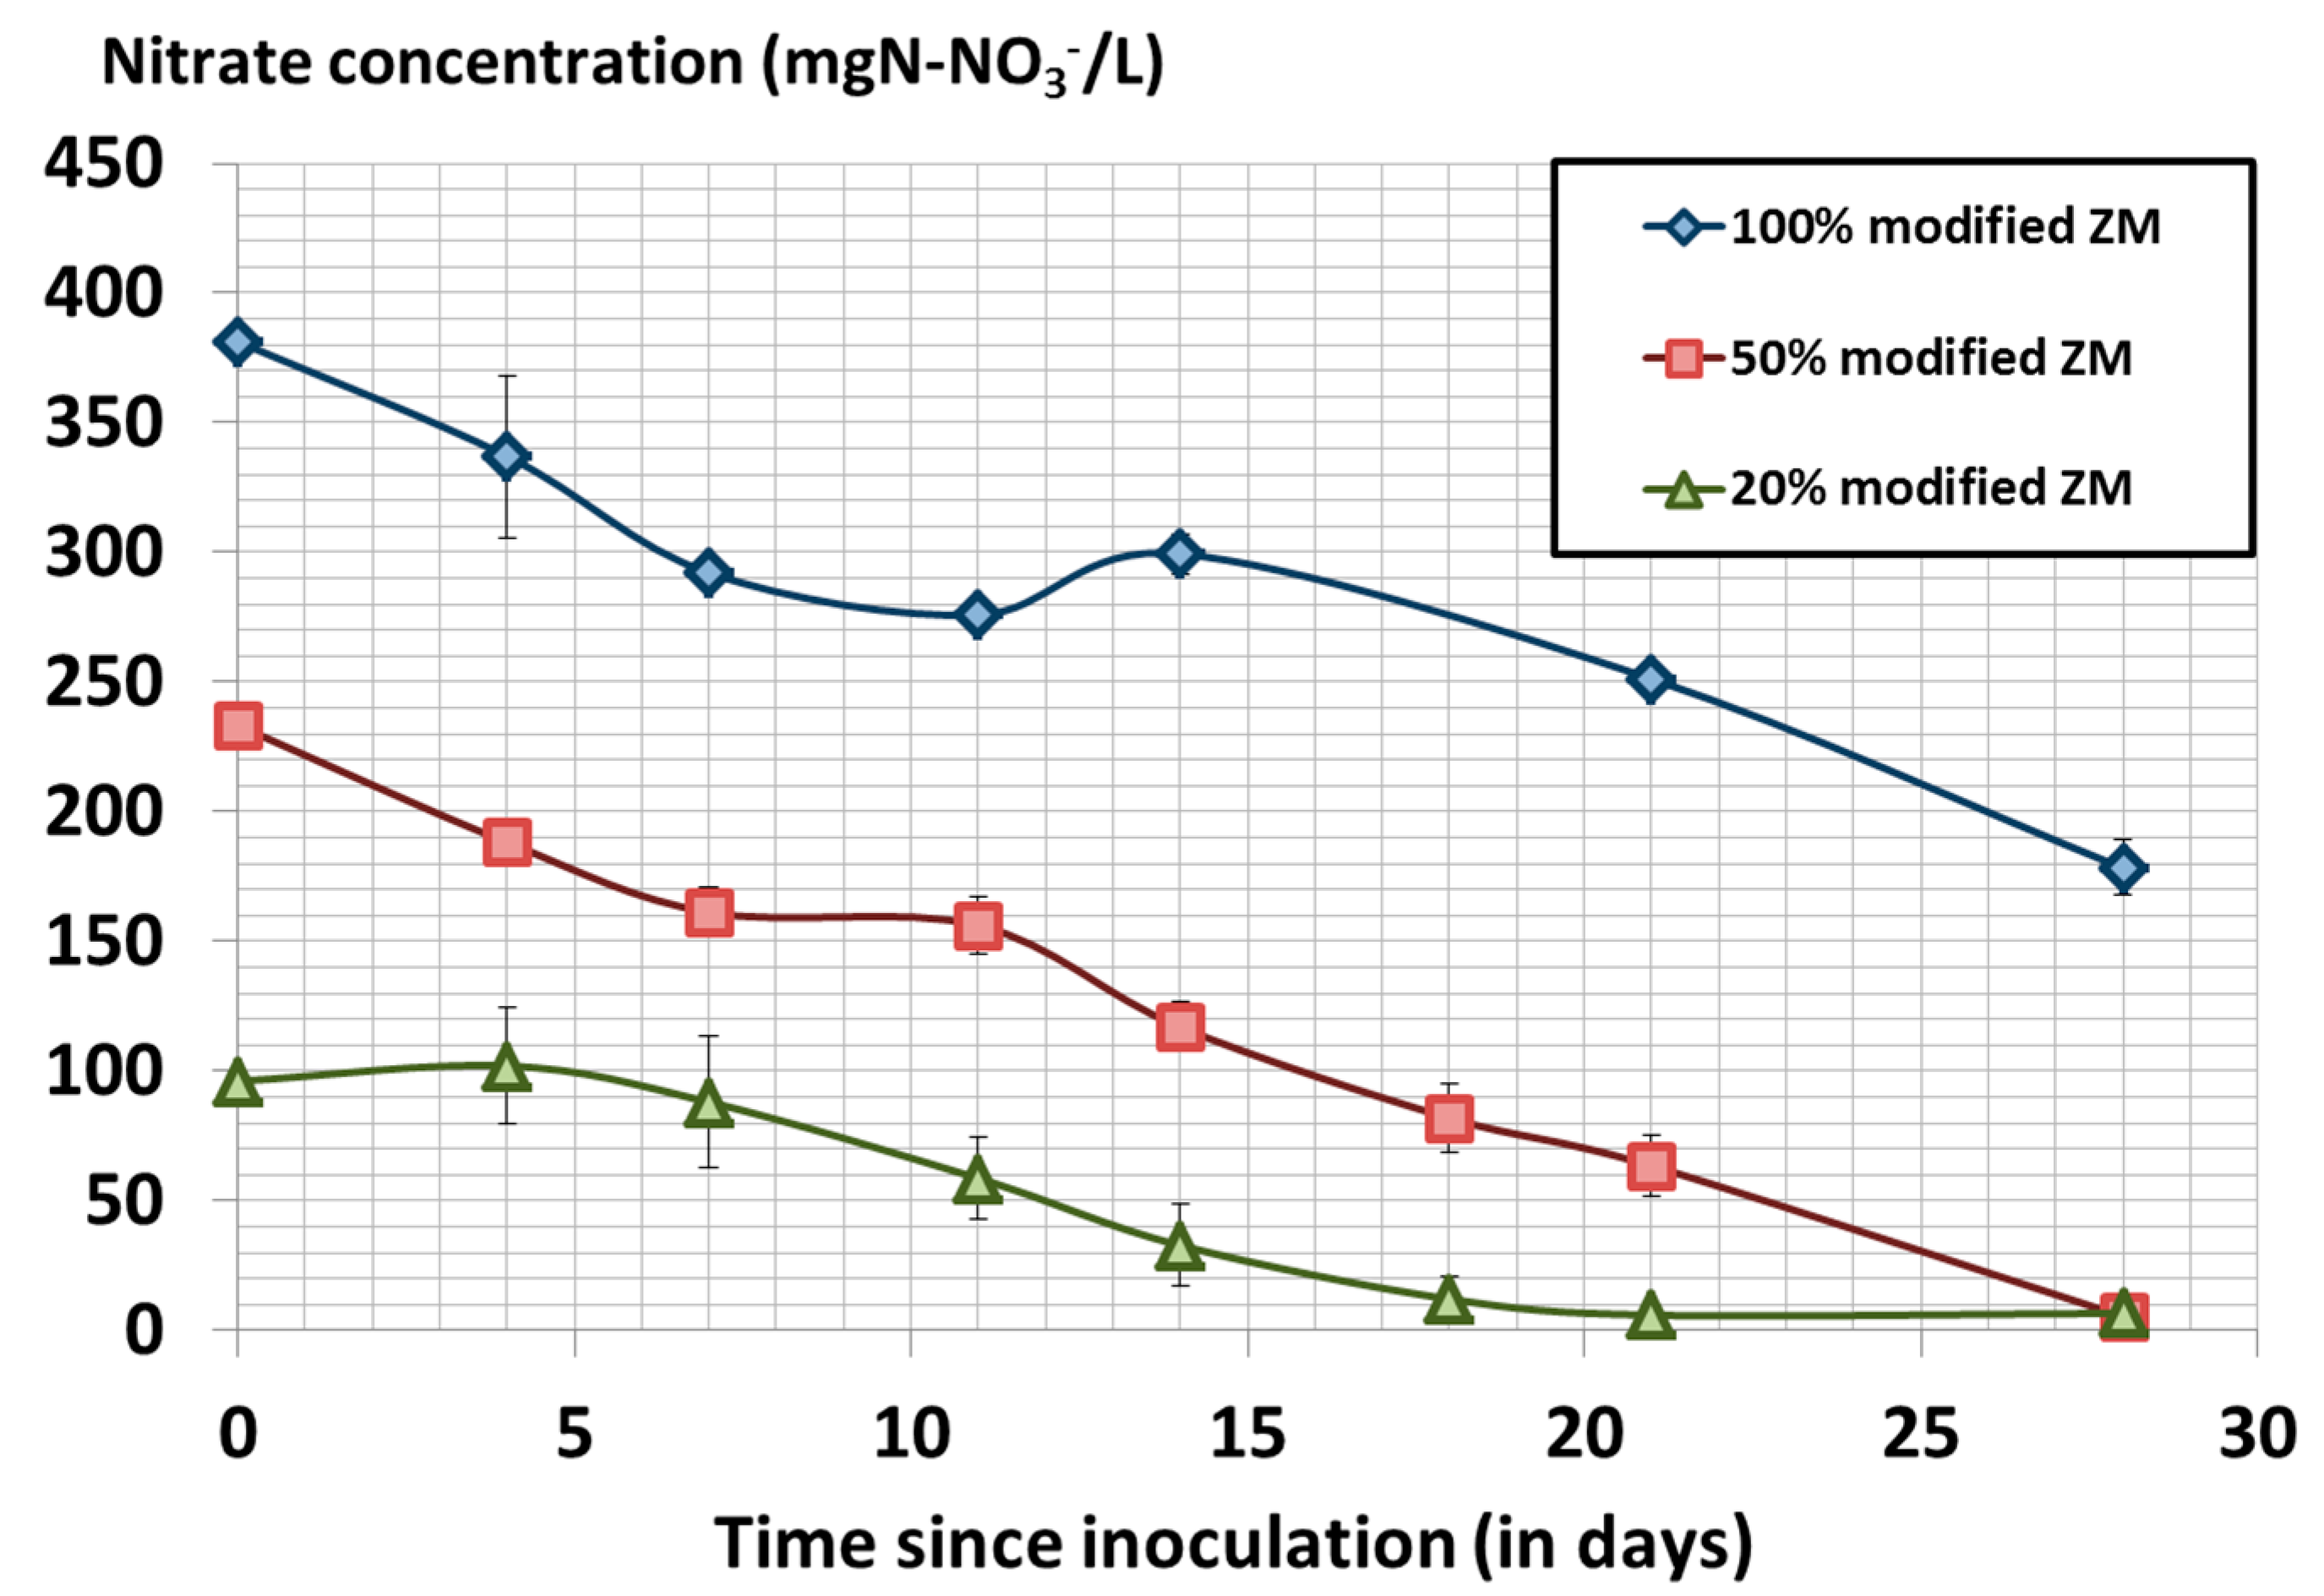
3.3. Cost Optimization of Modified Zarrouk’s Medium Composition

Modified ZM gave better growth than the other two media tested but it contains higher amounts of various chemicals leading to significant increased costs. The nitrogen content of modified ZM can theoretically lead to a maximal biomass concentration of 4.6 g/L for Spirulina (if nitrogen was the only limiting element). This would be 74, 31, and 395 g/L for phosphorus, sulfur, and potassium, respectively. These calculations were based on the elemental analyses of three Spirulina strains [25].
Therefore, dilution of modified ZM was investigated in order to reduce the cost of the cultivation. A growth experiment was conducted using 100%-, 50%-, and 20%-modified ZM (diluted using ultrapure water), in triplicate. Pre-cultures were done in each medium for acclimation. It was found that the 20%-modified ZM showed the best growth (OD880 readings), quite similar to the 50%-modified ZM (Figure 3). The same behavior was found for the dry weight curves (Figure 4), except the drop observed with the 20%-modified ZM at the end of the cultivation. The decrease of the dry weight was found to occur earlier (around day 20 in comparison to day 23 for optical densities) and to be steeper. The decline phase is indeed detected earlier in dry weight than in optical density measurements. Cell fragments may still be accounted in optical density measurements since they still have absorbance, but will pass through the 0.7 µm glass-fiber prefilters and not be accounted for in the dry weight.
The average of daily growth rates from day 0 to day 15 was higher for 20% and 50%-modified ZM (0.145 and 0.142/day, respectively) than for 100%-modified ZM (0.094/day). Similarly, the average biomass productivity from day 0 to day 21 was found to be higher for 20% ZM than in the two other media (Table 3). However, when calculated from day 0 to day 24, the average biomass productivity is lower for the 20%-modified ZM than for the 50%- and 100%-modified ZM. In continuous cultivation experiments (concentration of 0.4 g/L, media renewal rate between 40% and 60% and duration of 60 days), Radmann et al. also found higher growth rates for a 20% ZM (0.138/day) in comparison to a undiluted ZM (0.134/day) [26].
Nitrate was found to be the limiting nutrient in the experiments leading to the decline phase around day 20 for the 20%-modified ZM (Figure 5). The average nutrient consumption rates (nitrate, phosphate, and sulfate) were calculated (Table 3). These consumption rates tend to decrease with increasing dilution rate. This tendency is less pronounced for nitrates but very rapid for phosphates (10 times lower consumption rates for 20% and 50% diluted modified ZM in comparison to undiluted modified ZM). This could mean that Spirulina growth is more effective in diluted medium, enhancing the interest for using 20%- and 50%-modified ZM. The next step would be to use a design of experiment to optimize nitrate, phosphate and sulfate concentrations. Impressive results were obtained on other microalgae strains (such as Chlorella protothecoides with 40% increase of biomass concentration and 85% of lipid concentration using a response surface method [27]) which could inspire Spirulina cultivation optimization.

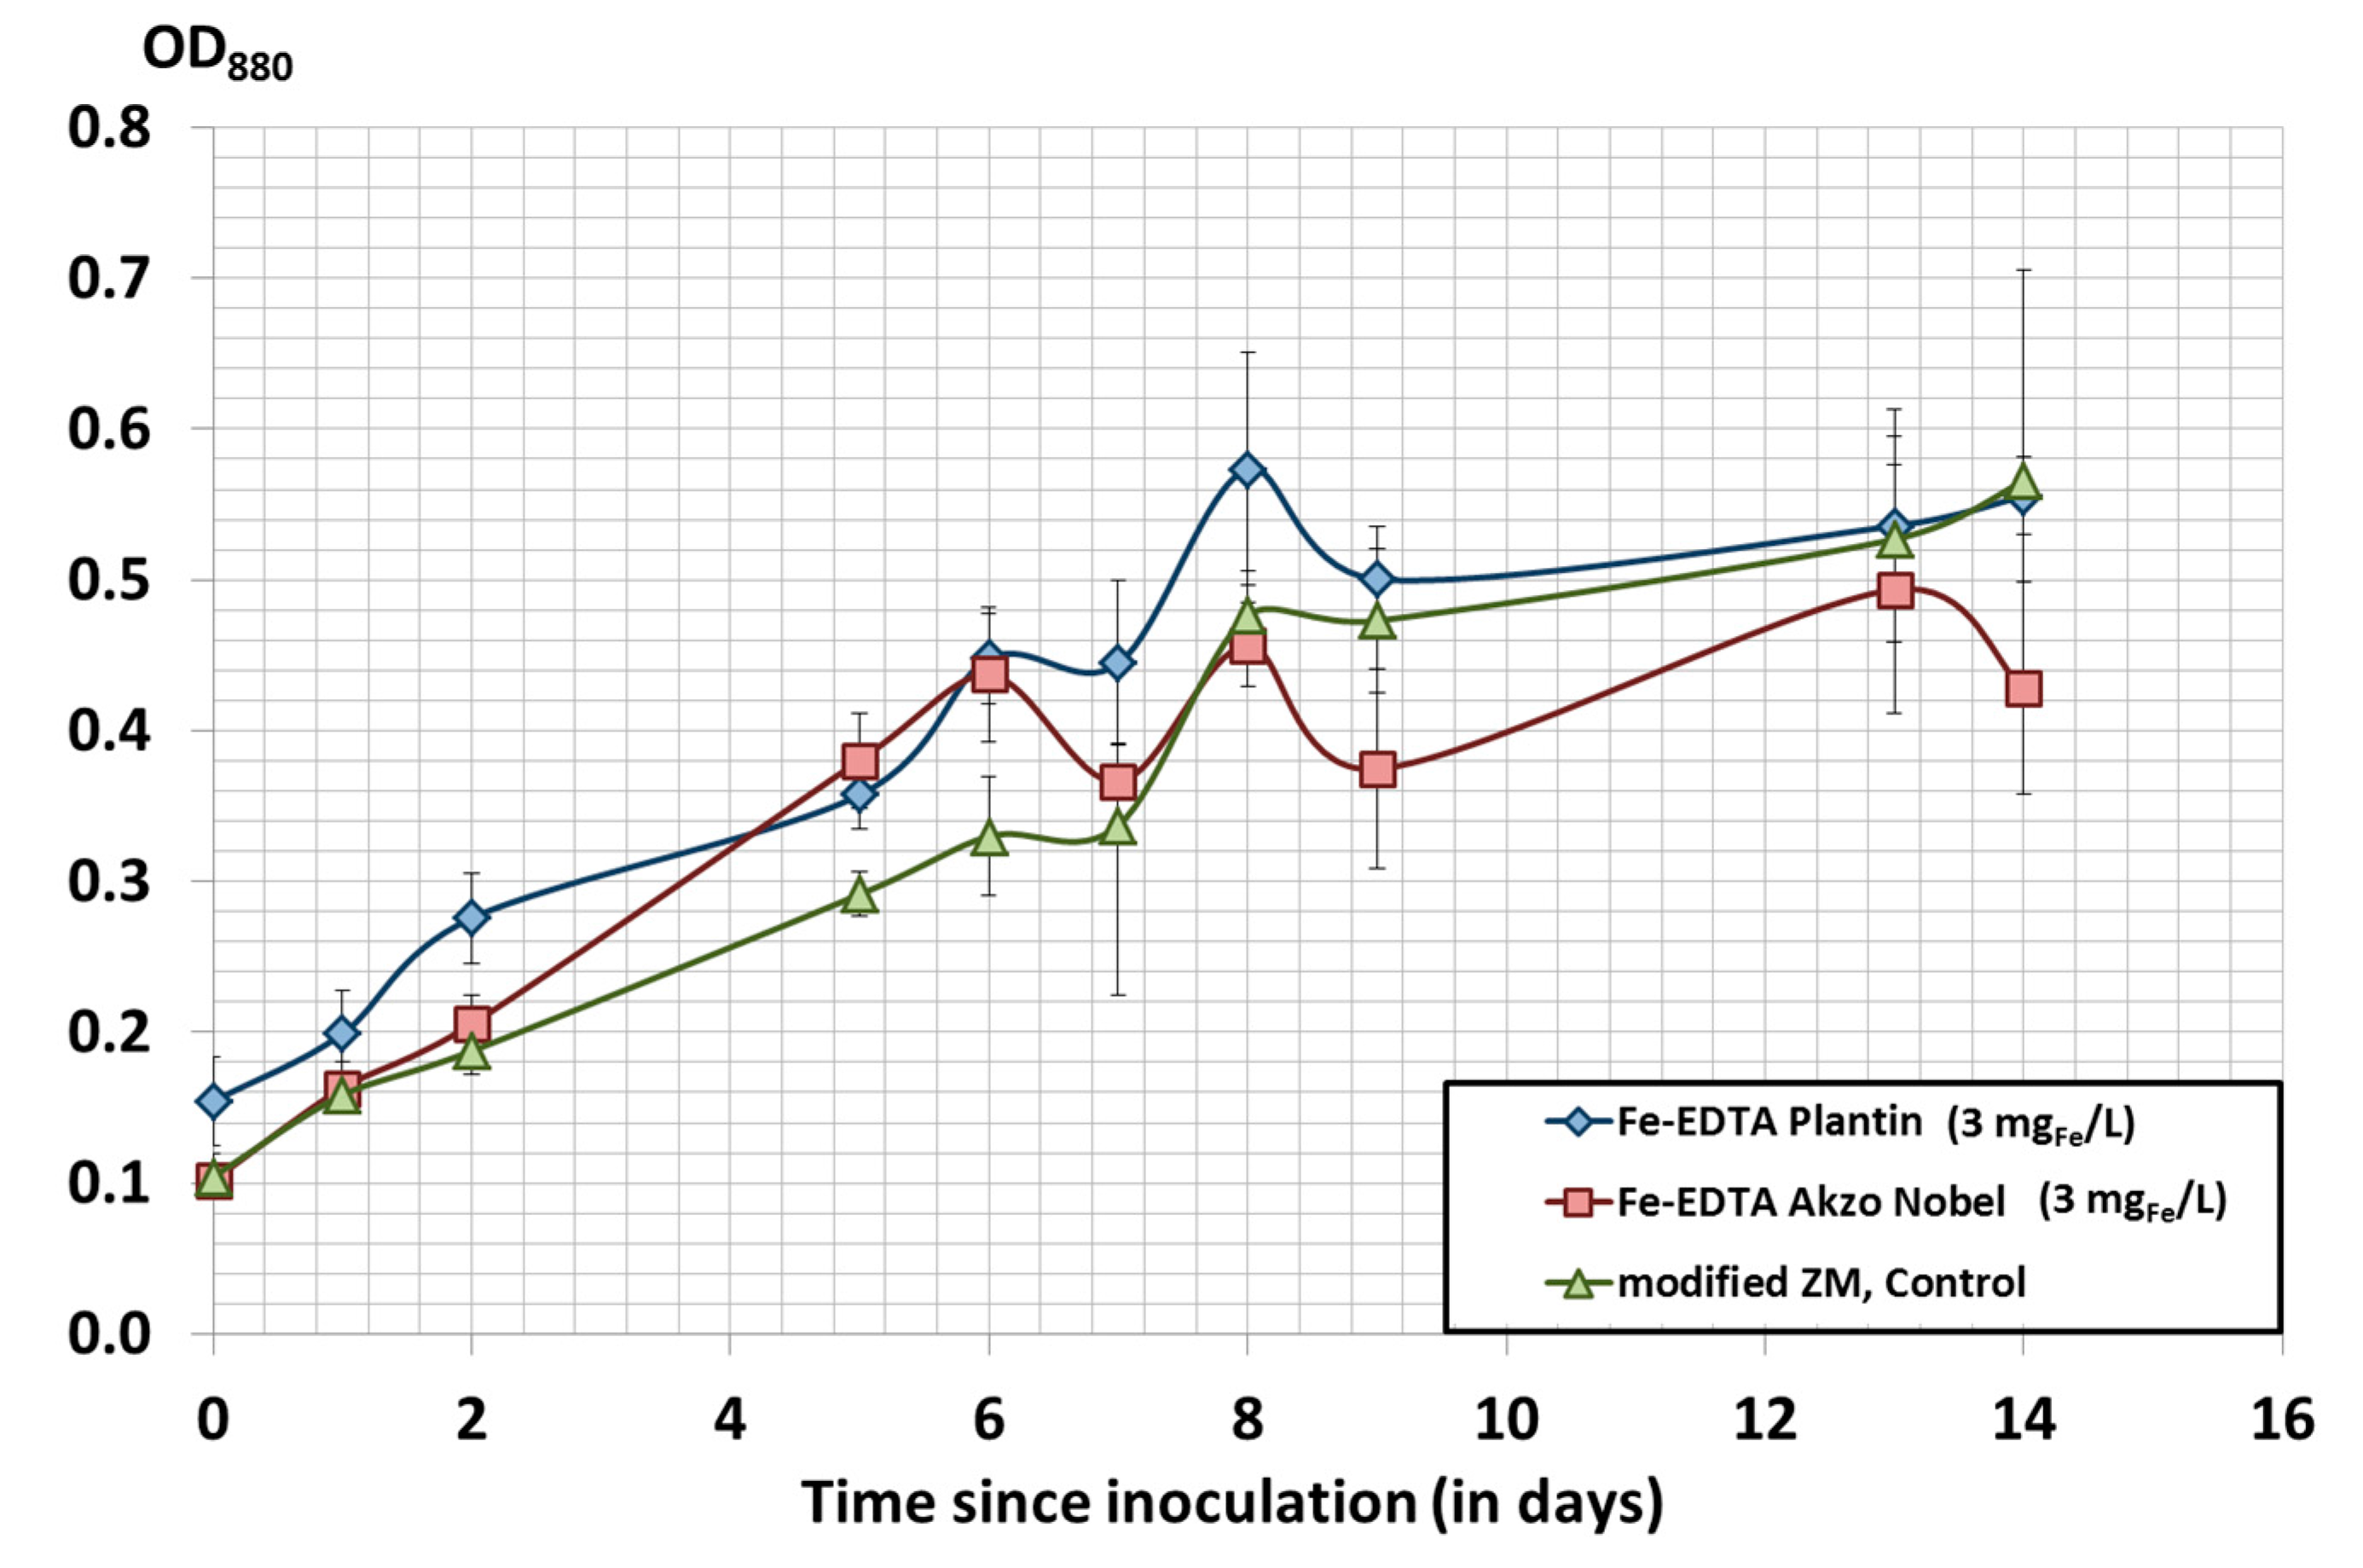
3.4. Iron Source and Iron Content in Spirulina

Spirulina is a source of highly available iron with a 6.5 times more available iron than beef meat [28]. Increasing iron content in Spirulina could lead to a very beneficial increase of its nutritional value.
Modified ZM contains iron in the form of FeSO4,6H2O (2 mgFe/L) stabilized with EDTA (50 mg/L). The opportunity to use commercial formulations of Fe-EDTA was tested in Spirulina cultivation experiments using Fe-EDTA from Plantin and Akzo Nobel at two different concentrations (3 and 10 mgFe/L) in duplicates. Figure 6 and Figure 7 show the growth curves in OD880 for these experiments. Concentration of 3 mgFe/L of Fe-EDTA did not impact significantly the growth of Spirulina (Figure 6). However, at 10 mgFe/L, Spirulina growth was slightly inhibited, especially after 10 days (Figure 7). Nevertheless, the Spirulina iron content was significantly increased when Fe-EDTA concentration in the medium was increased from 3 to 10 mgFe/L for the Plantin solution (Table 4). Iron mass balances were not always coherent with large disparities over the duplicates. However, the Spirulina iron content (internalized iron) showed three consistent behaviors. First, Fe-EDTA increased the iron content. Then, higher Fe-EDTA concentrations in the medium increased the iron content. And, Fe-EDTA solution from Plantin led to higher iron content in comparison to the solution from Akzo-Nobel at 10 mgFe/L. This difference could be explained by Fe-EDTA counter-ion which is NH4+ for the Plantin solution and Na+ for the Akzo-Nobel solution. Further studies should be conducted on the counter-ion effect on iron accumulation, as well as on the chelating agent (EDDHA, DTPA for example).

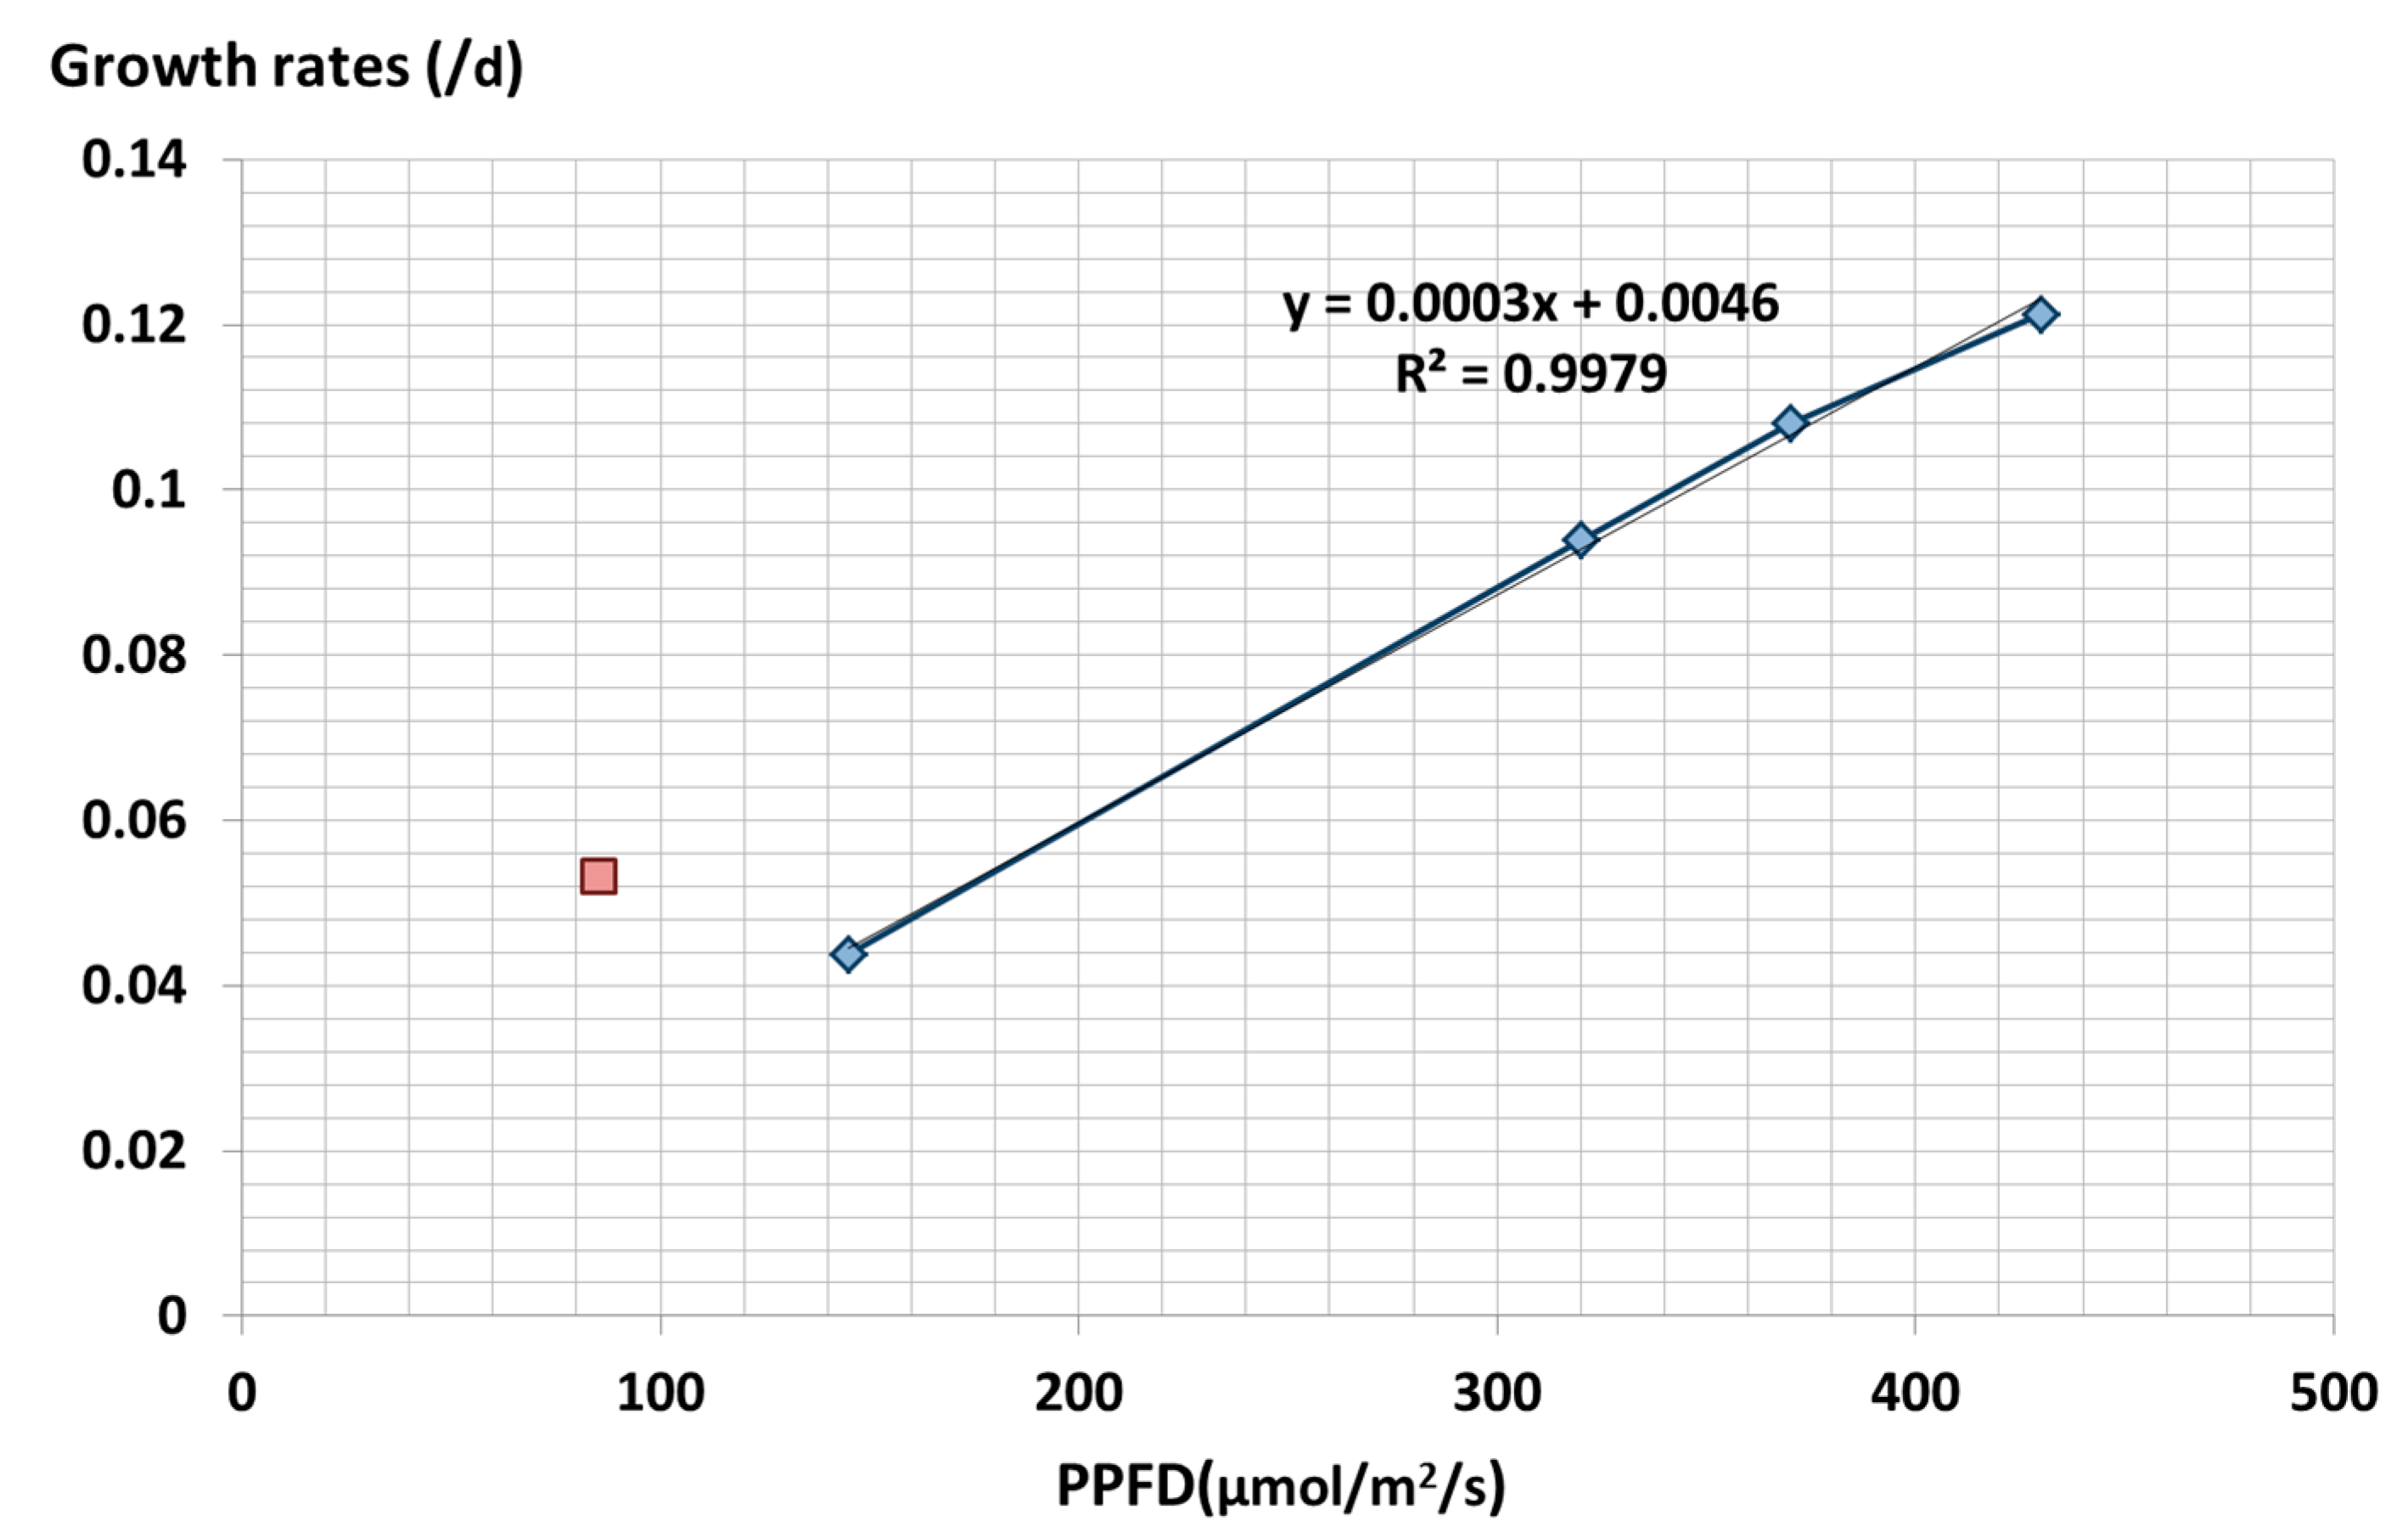
3.5. Effect of Light Intensity on Spirulina Growth

The effect of PPFD on the growth of Spirulina was investigated in 2 L PBRs running in batch mode. Five PPFDs from 85 to 430 µmol/m2/s were tested. As predicted, the higher the light intensity, the faster the growth. A linear relationship was found between growth rates and light intensity (Figure 8), except for the first point at 85 µmol/m2/s. Light saturation could not be reached at 430 µmol/m2/s, while some studies found photoinhibition around 300 µmol/m2/s [29] or 432 µmol/m2/s [30]. These differences might be explained by different Spirulina strain and different lighting conditions. However, Figure 8 shows a curving of the specific growth rate line near 400 µmol/m2/s meaning that it is reaching photoinhibition.

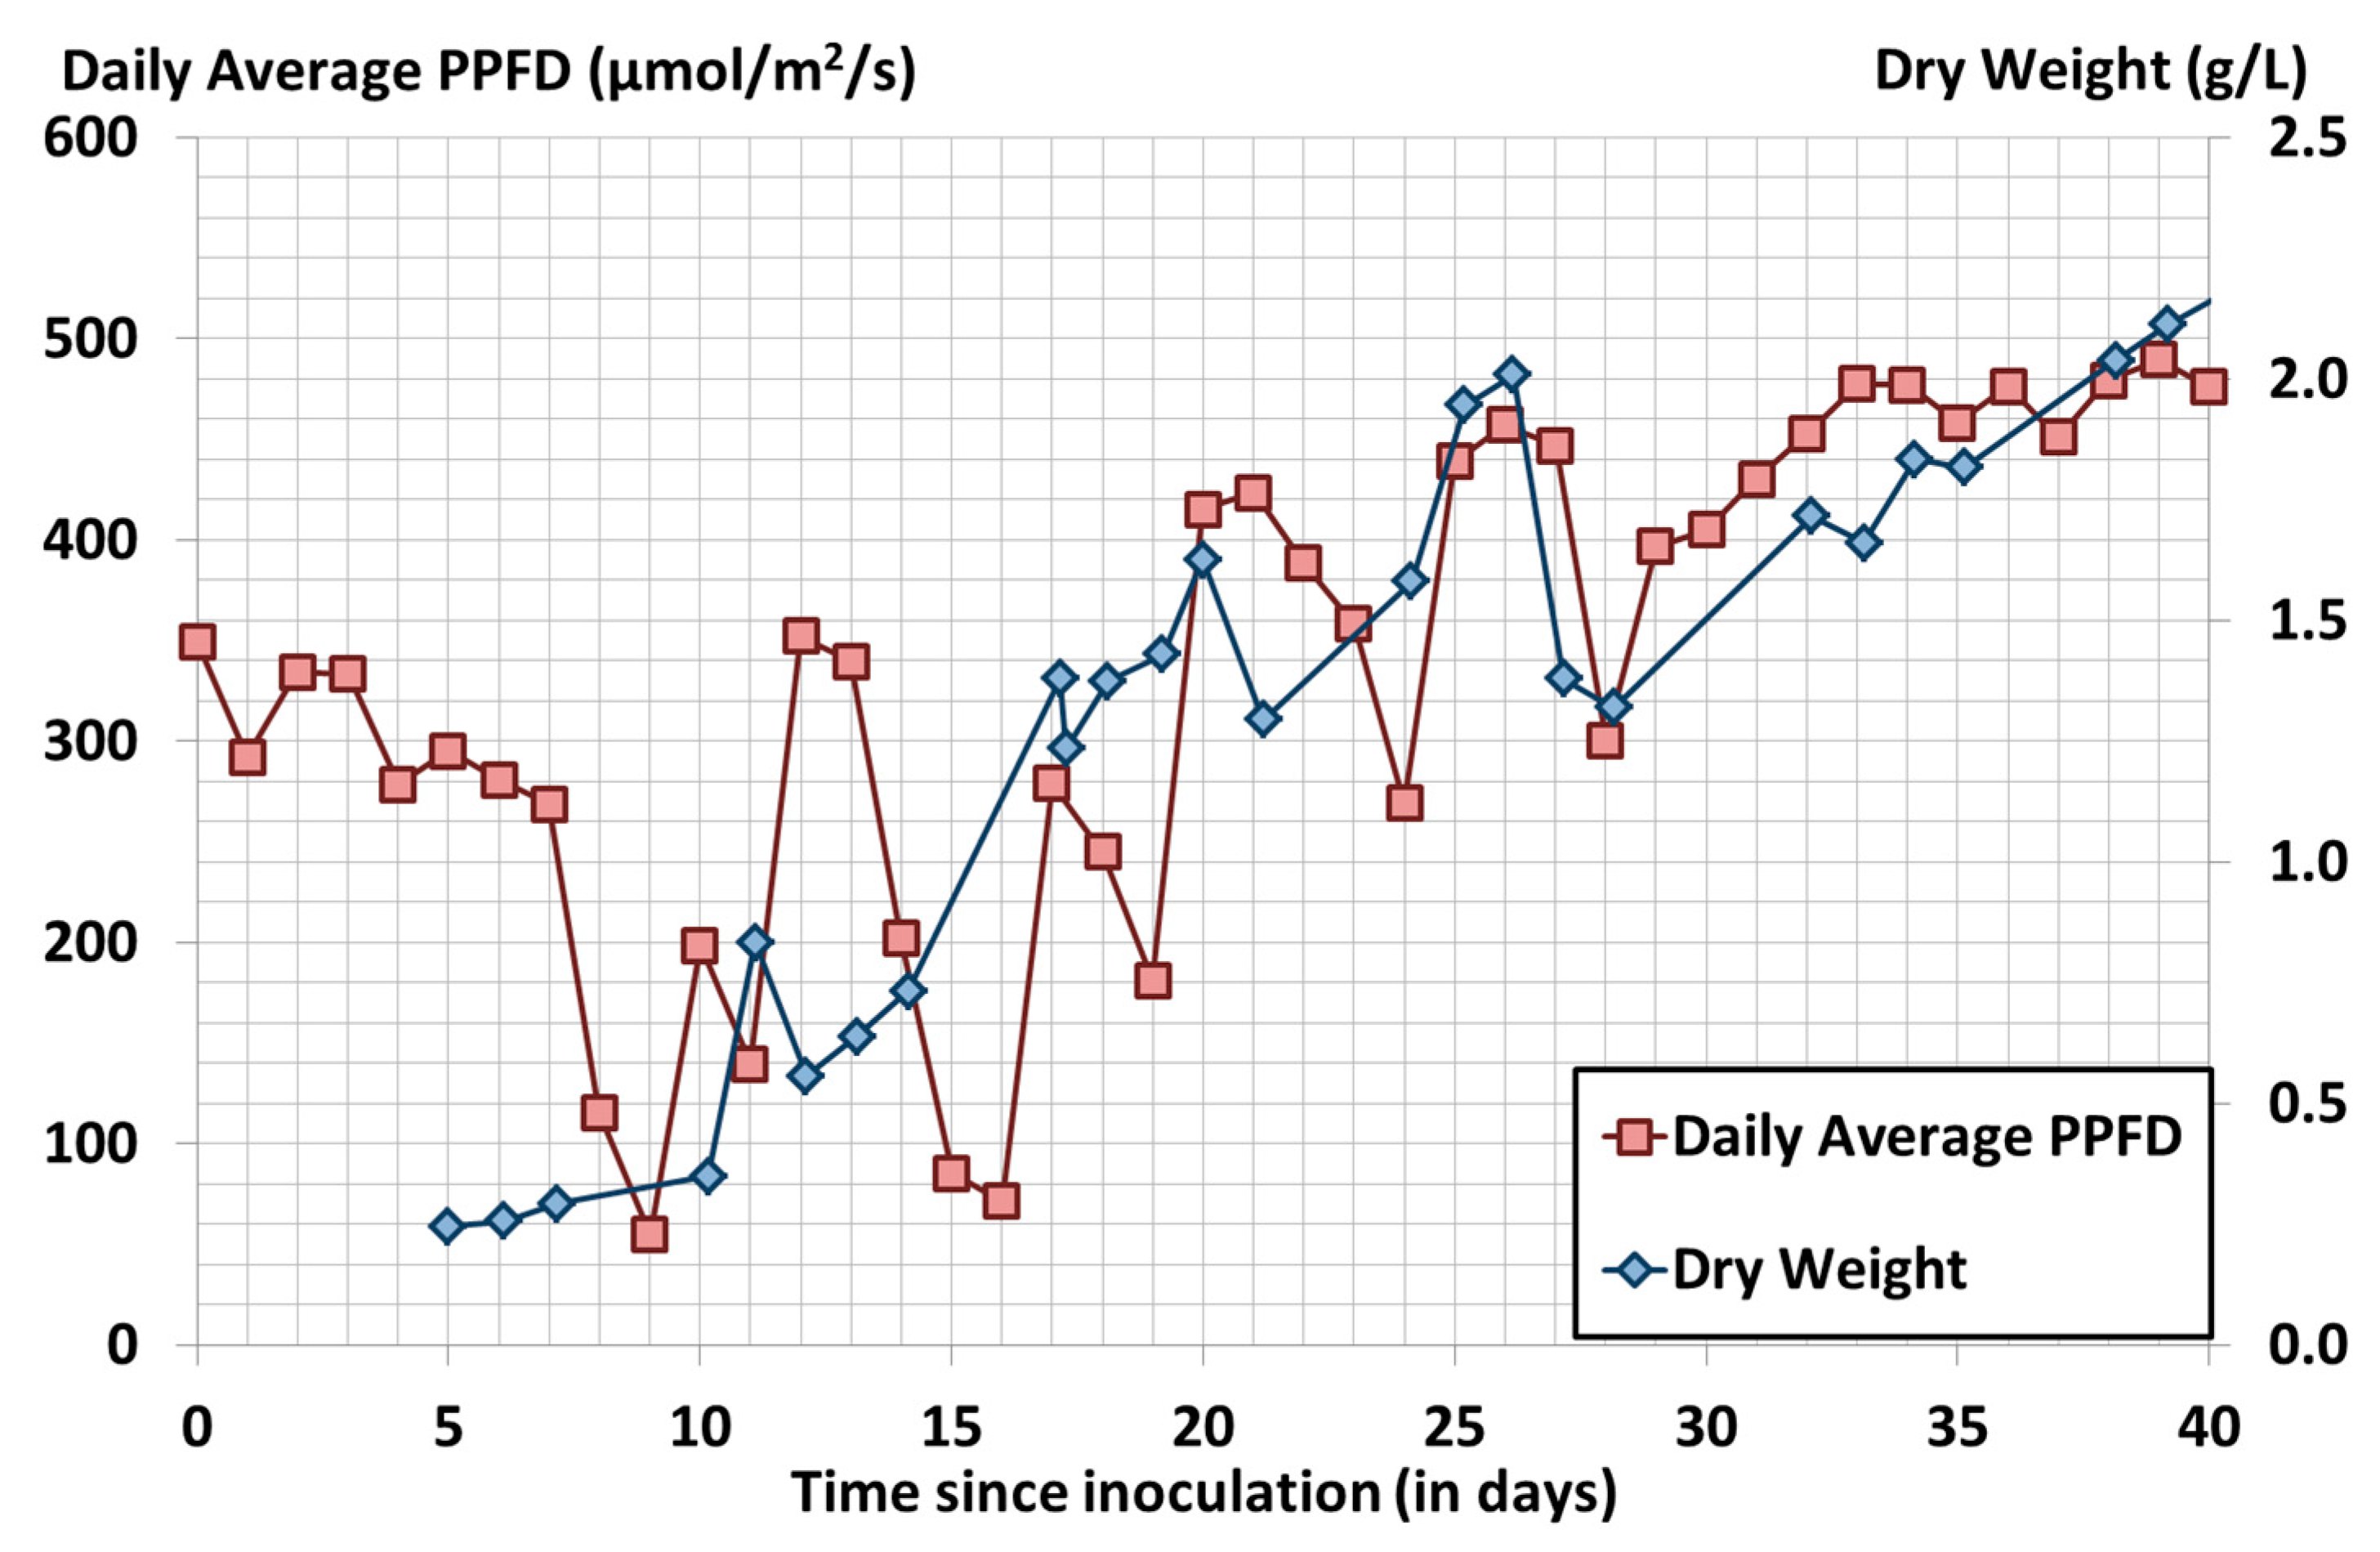
3.6. Spirulina Cultivation Run in a 1000 L Camargue PBR

During 40 days, between the 11 March 2015 and 15 April 2015, a Spirulina cultivation was conducted in a 1000 L tubular Camargue PBR located in a 60 m2 greenhouse (Figure 9). A fed-batch mode was used with harvesting and medium supplementation during days 12, 21, and 27 in order to maintain sufficient nutrients for the growth.
The daily average temperature varied slightly between 19.7 °C and 27.6 °C (daily average diurnal temperature between 20.7 °C and 33.3 °C and daily average nocturnal temperature between 15.3 °C and 22.6 °C).
Average volumetric and areal productivities varied during the experiment with a minimum from day 5 to 10 (20 mg/L/day or 2.26 g/m2/day) and a maximum between day 10 and 11 (520 mg/L/day or 58.4 g/m2/day), with averages of 55 mg/L/day and 6.19 g/m2/day from day 5 to 40.

3.7. Cost Comparison: PBR and Open Ponds

The model described in a previous work [31] was used to compare the production cost of Spirulina in open ponds and in PBRs. Typical productivities in open ponds cultivating Spirulina are in the range of 4 to 7 g/m2/day (weekly production from 46.5 kg to 77 kg in a 1750 m2 open pond during the year 2015). Three productivities were tested in the model: 4, 7, and 10 g/m2/day for open ponds, and 10, 25, and 40 g/m2/day for PBRs. Capital costs (CAPEX) were estimated at 50 €/m2 for open ponds and 1000 €/m2 for PBR. These more realistic values are, therefore, quite different from the initial model which was designed for extrapolation purposes. Open ponds have a depth of 25 cm and are agitated by paddlewheels at a velocity of 25 cm/s. An evaporation rate of 2.2 m/year was also assumed. Residence time for both open ponds and PBRs was set to seven days. Air was supplemented by 2% CO2 at a rate of 7 L/min/m3 for PBR [23] and 2.7 L/min/m3 for open ponds. Additional pumping for liquid circulation was also implemented for PBR (0.3 m/s) [23]. The model does not account for further processing (harvesting by filtration and/or drying) since the processes will be similar for both PBRs and open ponds. Results are shown in Table 5. Production costs are significantly higher in PBR due to their higher CAPEX. However, the model does not account for the higher production quality in PBR. The productivity has a higher impact on specific energy consumption in PBRs than in open ponds. However, these energy specific consumptions are similar to the caloric value of Spirulina (5.67 kWh/kg) [32]. This means that if high productivities can be obtained, energy applications (where energy return on investment, EROI, has to be above 1) could be considered.

4. Conclusions

Spirulina cultivation can be improved though three criteria: productivity, quality, and cost. Spirulina biomass productivity can be significantly improved by using the appropriate medium. Indeed, modified ZM was found to provide higher biomass productivity than the two other media tested (modified HM and modified JM). To reduce Spirulina production cost, dilutions of the modified ZM were tested and it was shown that modified ZM could be diluted up to five times without impacting the biomass productivity up to 21 days after inoculation. These results also suggest that improvements are still possible and that a design of experiments approach for optimizing Spirulina medium would be highly beneficial for productivity but also production cost. Spirulina biomass productivity could not be increased by increasing the initial biomass concentration in a batch culture. However, higher light intensity was found to increase Spirulina growth rate for PPFD up to, at least, 430 µmol/m2/s.
Spirulina biomass nutritional quality can be improved by increasing its iron content. Using Fe-EDTA at a concentration of 10 mgFe/L allows an increase of the Spirulina iron content from around 0.4 mgFe/g to more than 2 mgFe/g. Improvements could also be expected by using different chelating agents since Fe-EDTA stability ranged from pH 4.0 to 6.3 and Spirulina cultures have pH ranging from 9.5 to 11.0.
Cultivation of Spirulina in a 1000 L pilot-scale tubular PBR was investigated as it could improve biomass productivity. Indeed, values up to 58.4 g/m2/day were observed during the 40-day cultivation. However, a cost analysis resulted in higher production cost for PBR (from 18.71 to 75.29 €/kg) than for open pond cultivation (from 3.86 to 9.59 €/kg). Low production cost, high biomass productivity and high biomass quality are difficult to combine. Equilibrium has to be found which will be driven by the market that is addressed (i.e., human nutrition, cosmetic, therapeutic, etc.).

Acknowledgments

The authors are very grateful to the editor for offering the opportunity to publish a paper in Special Issue entitled “Cultivation and Downstream Processing of Microalgal Biomass”.

Author Contributions

Florian Delrue, Emilie Alaux, Lagia Moudjaoui, Gatien Fleury, Martin Petitjean and Jean-François Sassi conceived and designed the experiments; Florian Delrue, Emilie Alaux, Lagia Moudjaoui, Clément Gaignard, Gatien Fleury, Amaury Perilhou, Pierre Richaud performed the experiments; Florian Delrue and Emilie Alaux analyzed the data; Pierre Richaud performed the ICP analyses; Florian Delrue, Emilie Alaux, Pierre Richaud and Jean-François Sassi wrote the paper.

Conflicts of Interest

The authors declare no conflict of interest.

References

  1. Benemann, J. Microalgae for Biofuels and Animal Feeds. Energies 2013, 6, 5869–5886. [Google Scholar] [CrossRef]
  2. Belay, A.; Ota, Y.; Miyakawa, K.; Shimamatsu, H. Current knowledge on potential health benefits of Spirulina. J. Appl. Phycol. 1993, 5, 235–241. [Google Scholar] [CrossRef]
  3. Jiménez, C.; Cossío, B.R.; Labella, D.; Niell, F.X. The Feasibility of industrial production of Spirulina (Arthrospira) in Southern Spain. Aquaculture 2003, 217, 179–190. [Google Scholar] [CrossRef]
  4. De Bhowmick, G.; Subramanian, G.; Mishra, S.; Sen, R. Raceway pond cultivation of a marine microalga of Indian origin for biomass and lipid production: A case study. Algal Res. 2014, 6, 201–209. [Google Scholar] [CrossRef]
  5. Stephenson, A.L.; Kazamia, E.; Dennis, J.S.; Howe, C.J.; Scott, S.A.; Smith, A.G. Life-cycle assessment of potential algal biodiesel production in the United Kingdom: A comparison of raceways and air-lift tubular bioreactors. Energy Fuels 2010, 24, 4062–4077. [Google Scholar] [CrossRef]
  6. Richmond, A.; Grobbelaar, J.U. Factors affecting the output rate of Spirulina platensis with reference to mass cultivation. Biomass 1986, 10, 253–264. [Google Scholar] [CrossRef]
  7. Vonshak, A.; Richmond, A. Mass production of the blue-green alga Spirulina: An overview. Biomass 1988, 15, 233–247. [Google Scholar] [CrossRef]
  8. Çelekli, A.; Yavuzatmaca, M. Predictive modeling of biomass production by Spirulina platensis as function of nitrate and NaCl concentrations. Bioresour. Technol. 2009, 100, 1847–1851. [Google Scholar] [CrossRef] [PubMed]
  9. Soletto, D.; Binaghi, L.; Lodi, A.; Carvalho, J.C.M.; Converti, A. Batch and fed-batch cultivations of Spirulina platensis using ammonium sulphate and urea as nitrogen sources. Aquaculture 2005, 243, 217–224. [Google Scholar] [CrossRef]
  10. Markou, G.; Chatzipavlidis, I.; Georgakakis, D. Effects of phosphorus concentration and light intensity on the biomass composition of Arthrospira (Spirulina) platensis. World J. Microbiol. Biotechnol. 2012, 28, 2661–2670. [Google Scholar] [CrossRef] [PubMed]
  11. Marrez, D.A.; Naguib, M.M.; Sultan, Y.Y.; Daw, Z.Y.; Higazy, A.M. Impact of Culturing Media on Biomass Production and Pigments Content of Spirulina platensis. Int. J. Adv. Res. 2013, 1, 951–961. [Google Scholar]
  12. Pandey, J.P.; Tiwari, A.; Mishra, R.M. Evaluation of biomass production of spirulina maxima on different reported media. J. Algal Biomass Util. 2010, 1, 70–81. [Google Scholar]
  13. Zarrouk, C. Contribution à L’étude D’une Cyanophycée: Influence de Divers Facteurs Physiques et Chimiques sur la Croissance et la Photosynthèse de Spirulina maxima (Setch et Gardner) Geitler. Ph.D. Thesis, Faculté des Sciences de l’Université de Paris, Paris, France, 1966. [Google Scholar]
  14. Doumandji, A.; Boutekrabt, L.; Saidi, N.A.; Doumandji, S.; Hamerouch, D.; Haourai, S. Etude de l’impact de l’incorporation de la spirulinae sur les propriétés nutritionnelles, technologiques et organoleptiques du couscous artisanal. Nat. Technol. 2012, 6, 40–50. [Google Scholar]
  15. Jourdan, J.P. Manuel de Culture Artisanale Pour la Production de Spiruline; Anteanna Technologies: Genève, Switzerland, 2016. [Google Scholar]
  16. Madkour, F.F.; El-Wahab Kamil, A.; Nasr, H.S. Production and nutritive value of Spirulina platensis in reduced cost media. Egypt. J. Aquat. Res. 2012, 38, 51–57. [Google Scholar] [CrossRef]
  17. Wang, J.; Sommerfeld, M.R.; Lu, C.; Hu, Q. Combined effect of initial biomass density and nitrogen concentration on growth and astaxanthin production of Haematococcus pluvialis (Chlorophyta) in outdoor cultivation. Algae 2013, 28, 193–202. [Google Scholar] [CrossRef]
  18. Tokuşoglu, Ö.; Üunal, M.K. Biomass Nutrient Profiles of Three Microalgae: Spirulina platensis, Chlorella vulgaris, and Isochrisis galbana. J. Food Sci. 2003, 68, 1144–1148. [Google Scholar] [CrossRef]
  19. World Health Organization. Iron Deficiency Anemia. 2001. Available online: http://www.who.int/nutrition/publications/en/ida_assessment_prevention_control.pdf?ua=1 (accessed on 20 December 2016).
  20. Hosseini, S.M.; Khosravi-Darani, K.; Mozafari, M.R. Nutritional and medical applications of spirulina microalgae. Mini Rev. Med. Chem. 2013, 13, 1231–1237. [Google Scholar] [CrossRef] [PubMed]
  21. Godoy Danesi, E.D.; Rangel-Yagui, C.O.; Sato, S.; Monteiro de Carvalho, J.C. Growth and content of Spirulina platensis biomass chlorophyll cultivated at different values of light intensity and temperature using different nitrogen sources. Braz. J. Microbiol. 2011, 42, 362–373. [Google Scholar] [CrossRef] [PubMed]
  22. Hutner, S.H.; Provasoli, L.; Schatz, A.; Haskins, C.P. Some approaches to the study of the role of metals in the metabolism of microorganisms. Proc. Am. Philos. Soc. 1950, 94, 152–170. [Google Scholar]
  23. Muller-Feuga, A.; Lemar, M.; Vermel, E.; Pradelles, R.; Rimbaud, L.; Valiorgue, P. Appraisal of a horizontal two-phase flow photobioreactor for industrial production of delicate microalgae species. J. Appl. Phycol. 2012, 24, 349–355. [Google Scholar] [CrossRef]
  24. Gitelson, A.; Qiuang, H.; Richmond, A. Photic volume in photobioreactors supporting ultrahigh population densities of the photoautotroph Spirulina platensis. Appl. Environ. Microbiol. 1996, 62, 1570–1573. [Google Scholar] [PubMed]
  25. Ortega-Calvo, J.J.; Mazuelos, C.; Hermosin, B.; Saiz-Jimenez, C. Chemical composition of Spirulina and eukaryotic algae food products marketed in Spain. J. Appl. Phycol. 1993, 5, 425–435. [Google Scholar] [CrossRef]
  26. Radmann, E.M.; Reinehr, C.O.; Costa, J.A.V. Optimization of the repeated batch cultivation of microalga Spirulina platensis in open raceway ponds. Aquaculture 2007, 265, 118–129. [Google Scholar] [CrossRef]
  27. Cheng, K.-C.; Renc, M.; Ogden, K.L. Statistical optimization of culture media for growth and lipid production of Chlorella protothecoides UTEX 250. Bioresour. Technol. 2013, 128, 44–48. [Google Scholar] [CrossRef] [PubMed]
  28. Puyfoulhoux, G.; Rouanet, J.M.; Besançon, P.; Baroux, B.; Baccou, J.C.; Caporiccio, B. Iron availability from iron-fortified spirulina by an in-vitro digestion/Caco-2 cell culture model. J. Agric. Food Chem. 2002, 49, 1625–1629. [Google Scholar] [CrossRef]
  29. Kebede, E.; Ahlgren, G. Optimum growth conditions and light utilization efficiency of Spirulina platensis (= Arthrospira fusiformis) (Cyanophyta) from Lake Chitu, Ethiopia. Hydrobiologia 1996, 332, 99–109. [Google Scholar] [CrossRef]
  30. Olaizola, M.; Duerr, E.O. Effects of light intensity and quality on the growth rate and photosynthetic pigment content of Spirulina platensis. J. Appl. Phycol. 1990, 2, 97–104. [Google Scholar] [CrossRef]
  31. Delrue, F.; Setier, P.A.; Sahut, C.; Cournac, L.; Roubaud, A.; Peltier, G.; Froment, A.K. An economic, sustainability, and energetic model of biodiesel production from microalgae. Bioresour. Technol. 2012, 111, 191–200. [Google Scholar] [CrossRef] [PubMed]
  32. Torr, S.S.; Reddy, H.; Deng, S.; Hoffmann, J.; Spangsmark, D.; Madsen, L.B.; Holm-Nielsen, J.B.; Rosendahl, L.A. Hydrothermal liquefaction of Spirulina and Nannochloropsis salina under subcritical and supercritical water conditions. Bioresour. Technol. 2013, 131, 413–419. [Google Scholar] [CrossRef] [PubMed]
Figure 1. OD880 of Spirulina for three different media: modified ZM (blue diamonds), modified HM (red squares) and modified JM (purple triangles), in triplicate. Error bars are the standard deviations of the biological triplicates.
Fermentation 03 00059 g001
Figure 2. OD880 measurements of Spirulina for four different initial dry weights in modified ZM: 0.35 g/L (orange diamonds and red squares, duplicate), 0.5 g/L (green triangles), 0.7 g/L (purple diamonds), and 1 g/L (blue circles). No replicates.
Fermentation 03 00059 g002
Figure 3. OD880 measurements of Spirulina grown in 100% (blue diamonds), 50% (red squares), and 20% (green triangles) modified ZM, triplicates. Error bars are standard deviations of the biological triplicates.
Fermentation 03 00059 g003
Figure 4. Dry weights of Spirulina grown in 100% (blue diamonds), 50% (red squares), and 20% (green triangles) modified ZM, triplicates. Error bars are standard deviations of the biological triplicates.
Fermentation 03 00059 g004
Figure 5. Nitrate concentrations in mgN-NO3/Lin 100% (blue diamonds), 50% (red squares), and 20% (green triangles) modified ZM growing Spirulina, triplicates.
Fermentation 03 00059 g005
Figure 6. OD880 measurements of Spirulina grown using Fe-EDTA from Plantin at 3 mgFe/L (blue diamonds), Fe-EDTA from Akzo-Nobel at 3 mgFe/L (red squares) and modified ZM (control, 2 mgFe/L in the form of FeSO4,6H2O with 50 mg/L of EDTA, green triangles), in duplicate. Error bars are standard deviations of the biological duplicates.
Fermentation 03 00059 g006
Figure 7. OD880 measurements of Spirulina grown using Fe-EDTA from Plantin at 10 mgFe/L (blue diamonds), Fe-EDTA from Akzo-Nobel at 10 mgFe/L (red squares) and modified ZM (control, 2 mgFe/L of iron in the form of FeSO4,6H2O with 50 mg/L of EDTA, green triangles), in duplicate. Error bars are standard deviations of the biological triplicates.
Fermentation 03 00059 g007
Figure 8. Spirulina growth rates with respect to PPFD. The correlation (blue diamonds) does not include the first point at 85 µmol/m2/s (red square). No replicate.
Fermentation 03 00059 g008
Figure 9. Daily average PPFD (measured inside the greenhouse) and dry weights for Spirulina grown in a 1000 L Camargue PBR. No replicates.
Fermentation 03 00059 g009
Table 1. Modified ZM, HM, and JM composition.
ChemicalsModified ZM [13] (g/L)Modified HM [14] (g/L)Modified JM [15] (g/L)
NaHCO316.8168
NaCl101
(NH4)3PO400.10.2
MgSO4,6H2O0.20.10.2
FeSO4,6H2O0.010.010.001
K2SO410.51
CaCl2,2H2O0.040.10.1
CH4N2O00.10.009
KNO3001
NaNO32.500
K2HPO40.500
Hutner’s solution without iron1 mL1 mL1 mL
Major Elements ConcentrationsModified ZM [13] (mg/L)Modified HM [14] (mg/L)Modified JM [15] (mg/L)
Carbonate CO32−12,00011,4305710
Nitrogen N41247143
Phosphorus P892346
Sulfur S238120237
Table 2. Final dry weights (day 27) and productivity between day 7 and day 15 for different initial dry weights in modified ZM.
Initial Dry Weight (g/L)Final Dry Weight (g/L)Productivity between Day 7 and Day 15 (in mg/L/day)
0.352.7667.7
0.352.9367.5
0.52.9963.5
0.73.0762.5
13.4053.2
Table 3. Average nutrient consumption rate for 100%, 50%, and 20%-modified ZM.
ZM ProportionAverage Consumption RateAverage Productivity (mg/L/day)
Nitrate (mgN/L/day)Phosphate (mgP/L/day)Sulfate (mgS/L/day)From Day 0 to Day 21 From Day 0 to Day 24
100%7.25 ± 0.102.38 ± 0.061.39 ± 0.1136.9 ± 3.234.4 ± 1.5
50%8.13 ± 0.100.26 ± 0.241.06 ± 0.2447.8 ± 2.534.6 ± 2.4
20%6.42 ± 0.910.38 ± 0.120.60 ± 0.7153.5 ± 5.423.5 ± 7.5
Table 4. Iron mass balance for the Spirulina cultivation experiments using Fe-EDTA formulations from Plantin and Akzo Nobel at 3 and 10 mgFe/L of iron in comparison to the control, modified ZM.
Iron Mass BalanceResidual in Supernatant (mgFe/L)Adsorbed (mgFe/L)Internalized (mgFe/L)Sum (mgFe/L)Adsorbed (mgFe/g)Internalized (mgFe/g)
Initial iron concentration of 3 mgFe/L
Fe-EDTA Plantin 10.1242.3240.5032.952.5010.32
Fe-EDTA Plantin 20.0812.3530.5322.9662.7210.541
Fe-EDTA Akzo Nobel 10.0622.3590.4242.8452.5070.451
Fe-EDTA Akzo Nobel 20.0742.3490.532.9542.9250.67
Control 1 (2 mgFe/L)0.0960.6280.120.8440.4920.094
Control 2 (2 mgFe/L)0.0450.3420.2070.5940.4530.273
Initial iron concentration of 10 mgFe/L
Fe-EDTA Plantin 18.482N.C.0.690N.C.N.C.2.015
Fe-EDTA Plantin 25.3571.0290.7437.1303.0492.204
Fe-EDTA Akzo Nobel 11.5576.0110.4618.03011.7020.898
Fe-EDTA Akzo Nobel 27.5440.4430.2968.2820.8890.593
Control 1 (2 mgFe/L)0.0020.4030.2380.6440.6260.369
Control 2 (2 mgFe/L)N.C.N.C.0.233N.C.N.C.0.357
N.C.: Not consistent, values out-of-range which were not reflecting real values.
Table 5. Production cost and specific energy consumption for Spirulina cultivation in open ponds and PBR for different productivities.
Techno-Economic AnalysisProductivity (g/m2/day)Production Cost (€/kg)Energy Consumption (kWh/kg)
Open ponds49.594.26
75.493.51
103.863.20
PBR1074.296.33
2529.823.00
4018.712.18

