Tuning of the Carbon-to-Nitrogen Ratio for the Production of l-Arginine by Escherichia coli


Biochemical Process Engineering, Division of Chemical Engineering, Department of Civil, Environmental and Natural Resources Engineering, Luleå University of Technology, SE-971 87 Luleå, Sweden
*
Authors to whom correspondence should be addressed.
Fermentation 2017, 3(4), 60; https://doi.org/10.3390/fermentation3040060
Submission received: 6 October 2017
/
Revised: 4 November 2017
/
Accepted: 6 November 2017
/
Published: 10 November 2017
(This article belongs to the Special Issue Bioconversion Processes)
Abstract
:l-arginine, an amino acid with a growing range of applications within the pharmaceutical, cosmetic, food, and agricultural industries, can be produced by microbial fermentation. Although it is the most nitrogen-rich amino acid, reports on the nitrogen supply for its fermentation are scarce. In this study, the nitrogen supply for the production of l-arginine by a genetically modified Escherichia coli strain was optimised in bioreactors. Different nitrogen sources were screened and ammonia solution, ammonium sulphate, ammonium phosphate dibasic, and ammonium chloride were the most favourable nitrogen sources for l-arginine synthesis. The key role of the C/N ratio for l-arginine production was demonstrated for the first time. The optimal C/N molar ratio to maximise l-arginine production while minimising nitrogen waste was found to be 6, yielding approximately 2.25 g/L of l-arginine from 15 g/L glucose with a productivity of around 0.11 g/L/h. Glucose and ammonium ion were simultaneously utilized, showing that this ratio provided a well-balanced equilibrium between carbon and nitrogen metabolisms.
1. Introduction
l-arginine is a semi-essential amino acid commonly used in pharmaceutical, nutraceutical, and cosmetic industries [1]. It can also be used as animal feed or fertilizer [2]. Corynebacterium glutamicum and C. crenatum have been commonly used for the microbial production of l-arginine [3,4,5,6]. Environmental concerns prompt a sustainable use of raw materials that are widely available, easily renewable, and that do not compete with food production. One such feedstock is lignocellulosic biomass which mainly consists of cellulose, hemicellulose, and lignin [7]. In contrast to the cellulose fraction, the hemicellulose fraction can include several additional monosaccharides besides glucose, i.e., xylose, mannose, galactose, rhamnose, and arabinose, where the composition and structure vary depending on the species and origin of the lignocellulose source. Cost-efficient use of this feedstock requires a microorganism able to use both five and six carbon sugars. However, neither C. glutamicum nor C. crenatum strains naturally metabolize five-carbon sugars. On the other hand, Escherichia coli is able to use pentoses as well as hexoses for the fermentative production of several different molecules with an industrial value [8,9,10]. Combined with its fast growth, its robustness and the availability of molecular tools for its genetic engineering, E. coli is also a candidate for l-arginine production. An E. coli strain able to produce nearly 12 g/L of l-arginine with a yield of 0.17 garginine/gglucose was recently engineered [11].
l-arginine biosynthesis is a nitrogen-requiring process since this amino acid consists of 32% nitrogen. Moreover, nitrogen, required for protein synthesis, is a vital nutrient for cell growth. Nitrogen represents 14% of the cell dry mass in growing E. coli [12]. Sufficient nitrogen to support growth and high l-arginine production must therefore be provided during fermentation.
However, after a certain threshold, the addition of ammonium sulphate, a common nitrogen source, was detrimental for the production of lysine and succinate by C. glutamicum [13,14] and that of l-threonine and l-phenylalanine by E. coli [15,16]. In addition, an excessive supply of nitrogen might result in large nitrogen wastes, which pose serious environmental threats such as global warming, thinning of the stratospheric ozone layer, and biodiversity loss [17,18,19,20,21]. Despite the fact that the supply of nitrogen is clearly a key parameter in the fermentation process and must be finely adjusted, studies on nitrogen for l-arginine production are lacking.
It is well known that the carbon-to-nitrogen (C/N) ratio is a crucial parameter in some microbial processes, such as biogas production [22,23,24] and lipid production by oleaginous yeasts [25,26]. It has also been demonstrated that the C/N ratio has a great influence on growth and metabolite production for a variety of microorganisms [27,28].
Based on fermentation data, transcriptional RNA level, and enzyme activity, it has also been shown that the E. coli metabolism is affected by the C/N ratio [29]. The importance of optimizing the C/N ratio in E. coli fermentations has further been demonstrated for heterologous gene expression [30] and for the production of the amino acid l-threonine, where the C/N molar ratio resulting in the best production was 69 [15].
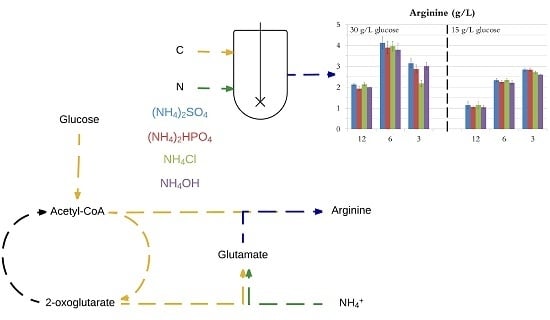
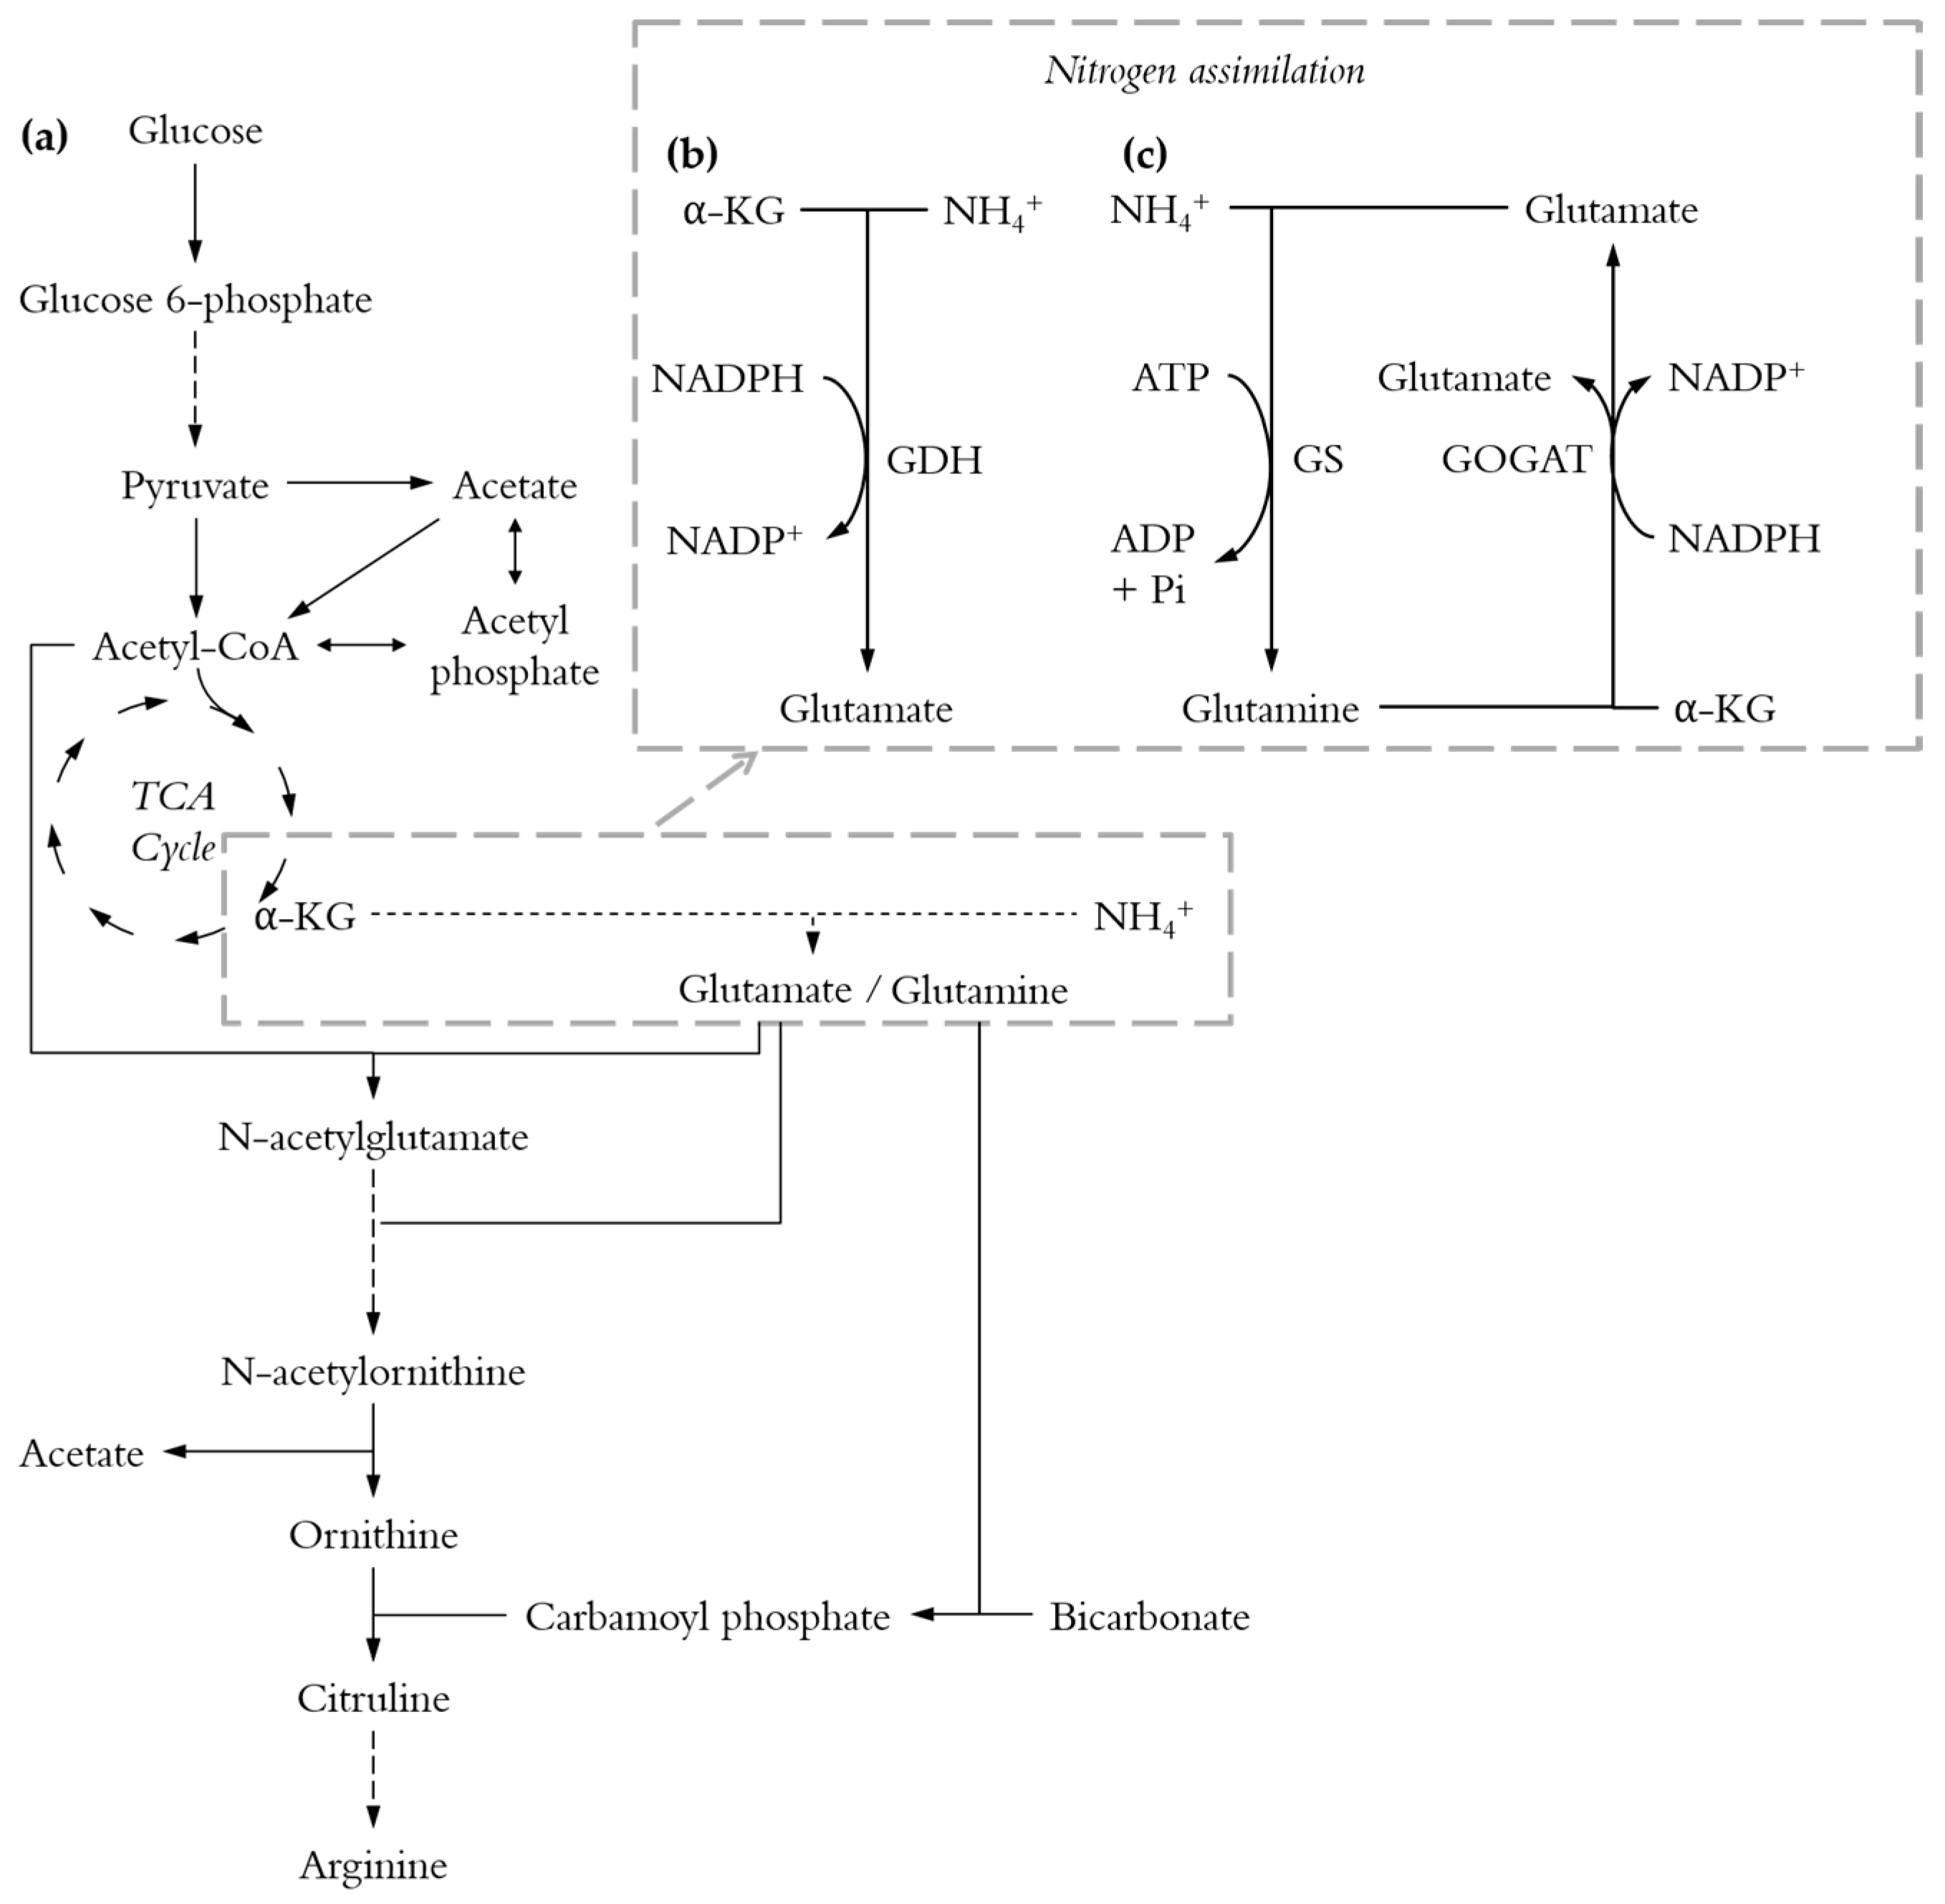
The carbon to nitrogen ratio is of such importance because the metabolisms of carbon and nitrogen are tightly linked where their assimilation is coordinated and controlled by the availability of both nutrients [29,31,32,33]. Indeed, E. coli possesses two pathways for nitrogen assimilation (Figure 1b,c) and both pathways require 2-oxoglutarate, one of the key intermediates of the TCA cycle, to convert ammonia into glutamate [34]. The C/N ratio might be of even greater significance for the biosynthesis of l-arginine which involves both acetyl-CoA (the starting point of the TCA cycle) and glutamate (Figure 1a).
As a substantial amount of nitrogen is required for the fermentative production of l-arginine, high-cost organic nitrogen sources, such as yeast extract or tryptone, would not be suitable for large-scale production. Only enterohemorrhagic E. coli strains have been shown to grow on urea, a low-cost organic nitrogen source, whereas other strains have not displayed any urease activity [35,36].
In this work, various inorganic nitrogen sources were screened and the most suitable ones were used to investigate, for the first time, the effect of the C/N ratio on the production of l-arginine. Batch fermentations in minimal medium were performed in bioreactors using a genetically modified E. coli strain.
2. Materials and Methods
2.1. Microorganism
The strain E. coli SJB009 previously engineered to have an enhanced l-arginine production ability was used [11]. This strain is derived from E. coli K-12 C600. Genes responsible for l-arginine catabolism (adiA, speC and speF) and for the repression of the l-arginine biosynthesis genes (argR) were knocked-out. In E. coli, the first enzyme of the dedicated pathway for l-arginine biosynthesis (encoded by argA) is sensitive to feedback inhibition by l-arginine. In the strain SJB009, a variant (argA214) coding for a feedback resistant enzyme was introduced and overexpressed, and the wild type argA was deleted. Finally, the l-arginine export gene (argO) was overexpressed. Stock cultures of the strain were stored at −80 °C in 15% glycerol.
2.2. Seed Cultures for Fermentations
Shake flasks containing 100 mL Luria Bertani (LB) medium were sterilized at 121 °C for 20 min and then inoculated with 500 μL stock cultures and incubated at 32 °C and 200 rpm for 12 h. The cells were harvested by centrifugation at 4 °C and 5000 rpm for 10 min. The cells were then washed twice by resuspension in phosphate-buffered saline solution (pH 7) and centrifugation under the same conditions. Subsequently, the cells were resuspended in 25 mL sterilised fermentation medium described below and aseptically inoculated into the bioreactors.
2.3. Fermentations
Duplicate batch fermentations were performed in 1 L bioreactors (Biobundle 1 L, Applikon Biotechnology) with a working volume of 700 mL. In order to avoid interactions with nitrogen contained in complex media, the cultivations were carried out in a defined medium consisting of (per liter): 3 g KH2PO4, 12.8 g Na2HPO4·7H2O, 0.5 g NaCl, 1 g MgSO4·7H2O, 20 mg FeSO4·7H2O*, 12 mg MnSO4·7H2O*, 1 mg CaCl2*, 0.25 g antifoam, and 20 mg tetracycline·HCl* (*: added after sterilisation at 121 °C for 20 min). The reactors contained either 30 or 15 g/L of glucose and an appropriate amount of the nitrogen source to obtain the desired C/N molar ratio. They represent the ratios of the molar concentration of carbon (from glucose) to that of nitrogen.
Prior to the fermentation, the pH was adjusted to 7 using 2 M HCl or 5 M NaOH when necessary. The temperature was set to 32 °C and the stirring speed to 500 rpm [11]. Throughout the fermentation, the pH was maintained at 7 with automatic addition of 5 M NaOH and the dissolved oxygen level at 50% with automatic addition of 5 vvm of air. Samples were regularly taken for cell growth, glucose, ammonium ion, l-arginine, and acetic acid measurements.
In the first step, fermentations were performed with an initial glucose concentration of 15 g/L to screen for potential nitrogen sources for l-arginine production by E. coli. Seven inorganic nitrogen sources were compared using a C/N ratio of 6: ammonia solution (NH4OH), ammonium carbonate ((NH4)2CO3), ammonium chloride (NH4Cl), ammonium nitrate (NH4NO3), ammonium phosphate dibasic ((NH4)2HPO4), ammonium sulphate ((NH4)2SO4), and sodium nitrate (NaNO3). The carbon atom from the carbonate group of ammonium carbonate was not taken into consideration to calculate the C/N ratio. In addition, one organic nitrogen source, monosodium glutamate, was assessed at three different concentrations (2.5, 5, and 10 g/L).
In the second step, the most efficient nitrogen sources were used to compare three C/N molar ratios (3, 6, and 12) at two initial glucose concentrations (15 and 30 g/L).
2.4. Cell Growth Analyses
The dry cell weight (DCW) was determined by washing cells contained in 5 mL fermentation broth and measuring their weight after drying in a furnace at 80 °C for 24 h.
2.5. Substrates, Products and By-Products Analyses
The samples were centrifuged for 10 min at 4 °C and 10,600× g and the supernatant was filtered through 0.2 μm filters.
Glucose, l-arginine, and glutamate were analysed with the Dionex AAA-Direct™ system (Thermo Scientific, Waltham, MA, USA): a high-pressure ion chromatography system (Dionex-ICS 5000+ HPIC, Thermo Scientific) equipped with an electrochemical detector (ICS-5000+ ED, Thermo Scientific), an anion exchange column (AminoPac PA10 Analytical Column, Thermo Scientific), and a guard column (AminoPac PA10 Guard Column, Thermo Scientific). Analyses were performed at ambient conditions, with deionized water and 250 mM NaOH as eluents (for glutamate 1 M sodium acetate was also used) and a flow rate of 0.75 mL/min.
Acetic acid, the main by-product formed during fermentation [11], was quantified by HPLC using refractive index detection. The cation exchange column (Aminex HPX87-H, BioRad, Hercules, CA, USA) and guard column (Micro-Guard IG Cation H Cartridge, BioRad) were maintained at 65 °C. The mobile phase was 5 mM H2SO4 at a flow rate of 0.6 mL/min.
Ammonium ion concentration (NH4+) was determined using a colorimetric test based on the Nessler method (MQuant™, Merck, Darmstadt, Germany). The samples were diluted to contain no more than 400 mg/L ammonium and subsequently analysed.
3. Results and Discussion
3.1. Comparison of Nitrogen Sources
The effect of different inorganic nitrogen sources on E. coli growth and l-arginine production was investigated with an initial glucose concentration of 15 g/L and a C/N ratio of 6. Monosodium glutamate was also tested as nitrogen source at various concentrations. The results obtained with all sources studied are summarized in Table 1.
Under those conditions, ammonia solution, ammonium chloride, ammonium phosphate dibasic, and ammonium sulphate all yielded a bit over 2.2 g/L of l-arginine with a productivity of about 0.1 g/L/h. These nitrogen sources also resulted in similar cell growth, in terms of both maximum dry cell weight and specific growth rate.
The use of ammonium carbonate also resulted in similar l-arginine production (2.11 g/L), but the cells grew and produced l-arginine more slowly (0.06 h−1 and 0.08 g/L/h, respectively).
Neither growth nor l-arginine production occurred during fermentation with sodium nitrate, demonstrating the need for an ammonium-containing nitrogen source. This was expected since it has been determined that E. coli cannot normally utilize nitrate aerobically [37]; although cell growth and xylanase production have been reported for a different E. coli strain [30].
Accordingly, only the nitrogen from the ammonium group was taken into account when adjusting the C/N ratio with ammonium nitrate. With this nitrogen source, the final cell density (2.31 g/L) was comparable to what was achieved with other ammonium salts; however, the growth rate was a bit lower (0.06 h−1), less l-arginine was produced (1.44 g/L), and the productivity was much lower (0.05 g/L/h).
As glutamate is the main precursor to l-arginine biosynthesis (Figure 1a), it was reasoned that a supply of nitrogen directly in this form might boost l-arginine production. The sodium glutamate was used at three different concentrations: 10 g/L, 5 g/L, and 2.5 g/L; with a glucose concentration of 15 g/L. After five days, no growth was observed in the fermentations with 10 g/L and 5 g/L monosodium glutamate. At a monosodium glutamate concentration of 2.5 g/L, only very weak growth occurred. In the three cases, no l-arginine production was detected, showing that glutamate is not suitable as the sole nitrogen source. Poor growth of a variety of E. coli strains on glucose when glutamate (at about 1.5 g/L) was the sole nitrogen source has been reported in a recent study [38]. It has been observed that under those conditions, TCA cycle intermediates accumulate, leading to the inhibition of the signalling molecule cAMP levels, thereby impairing cell growth. This accumulation was suggested to be caused by an imbalance between carbon and nitrogen due to a slow glutamate uptake combined with a rapid glucose consumption.
3.2. Comparison of C/N Ratios
The C/N ratio is an important parameter in many microbial processes. In order to determine its influence on l-arginine production by E. coli, three different ratios were tested: 3, 6, and 12. Each ratio was studied with an initial glucose concentration of 30 g/L and 15 g/L, respectively, to check whether the results obtained were solely due to the C/N ratio or to the changes in nitrogen concentration.
The four inorganic nitrogen sources that were found to be the most effective for this fermentation were used: ammonium sulphate, ammonium phosphate dibasic, ammonium chloride, and ammonia solution. Using different nitrogen sources for each ratio enabled a thorough comparison of those sources and ensured that the observed effects were dependent on the amount of ammonium rather than on one particular counterion.
The DCW and l-arginine concentration for every source, each taken when the highest l-arginine concentration was reached, are presented in Figure 2. In addition, the productivity, the glucose consumption rate, and the l-arginine yields from glucose and ammonium are provided in supporting information.
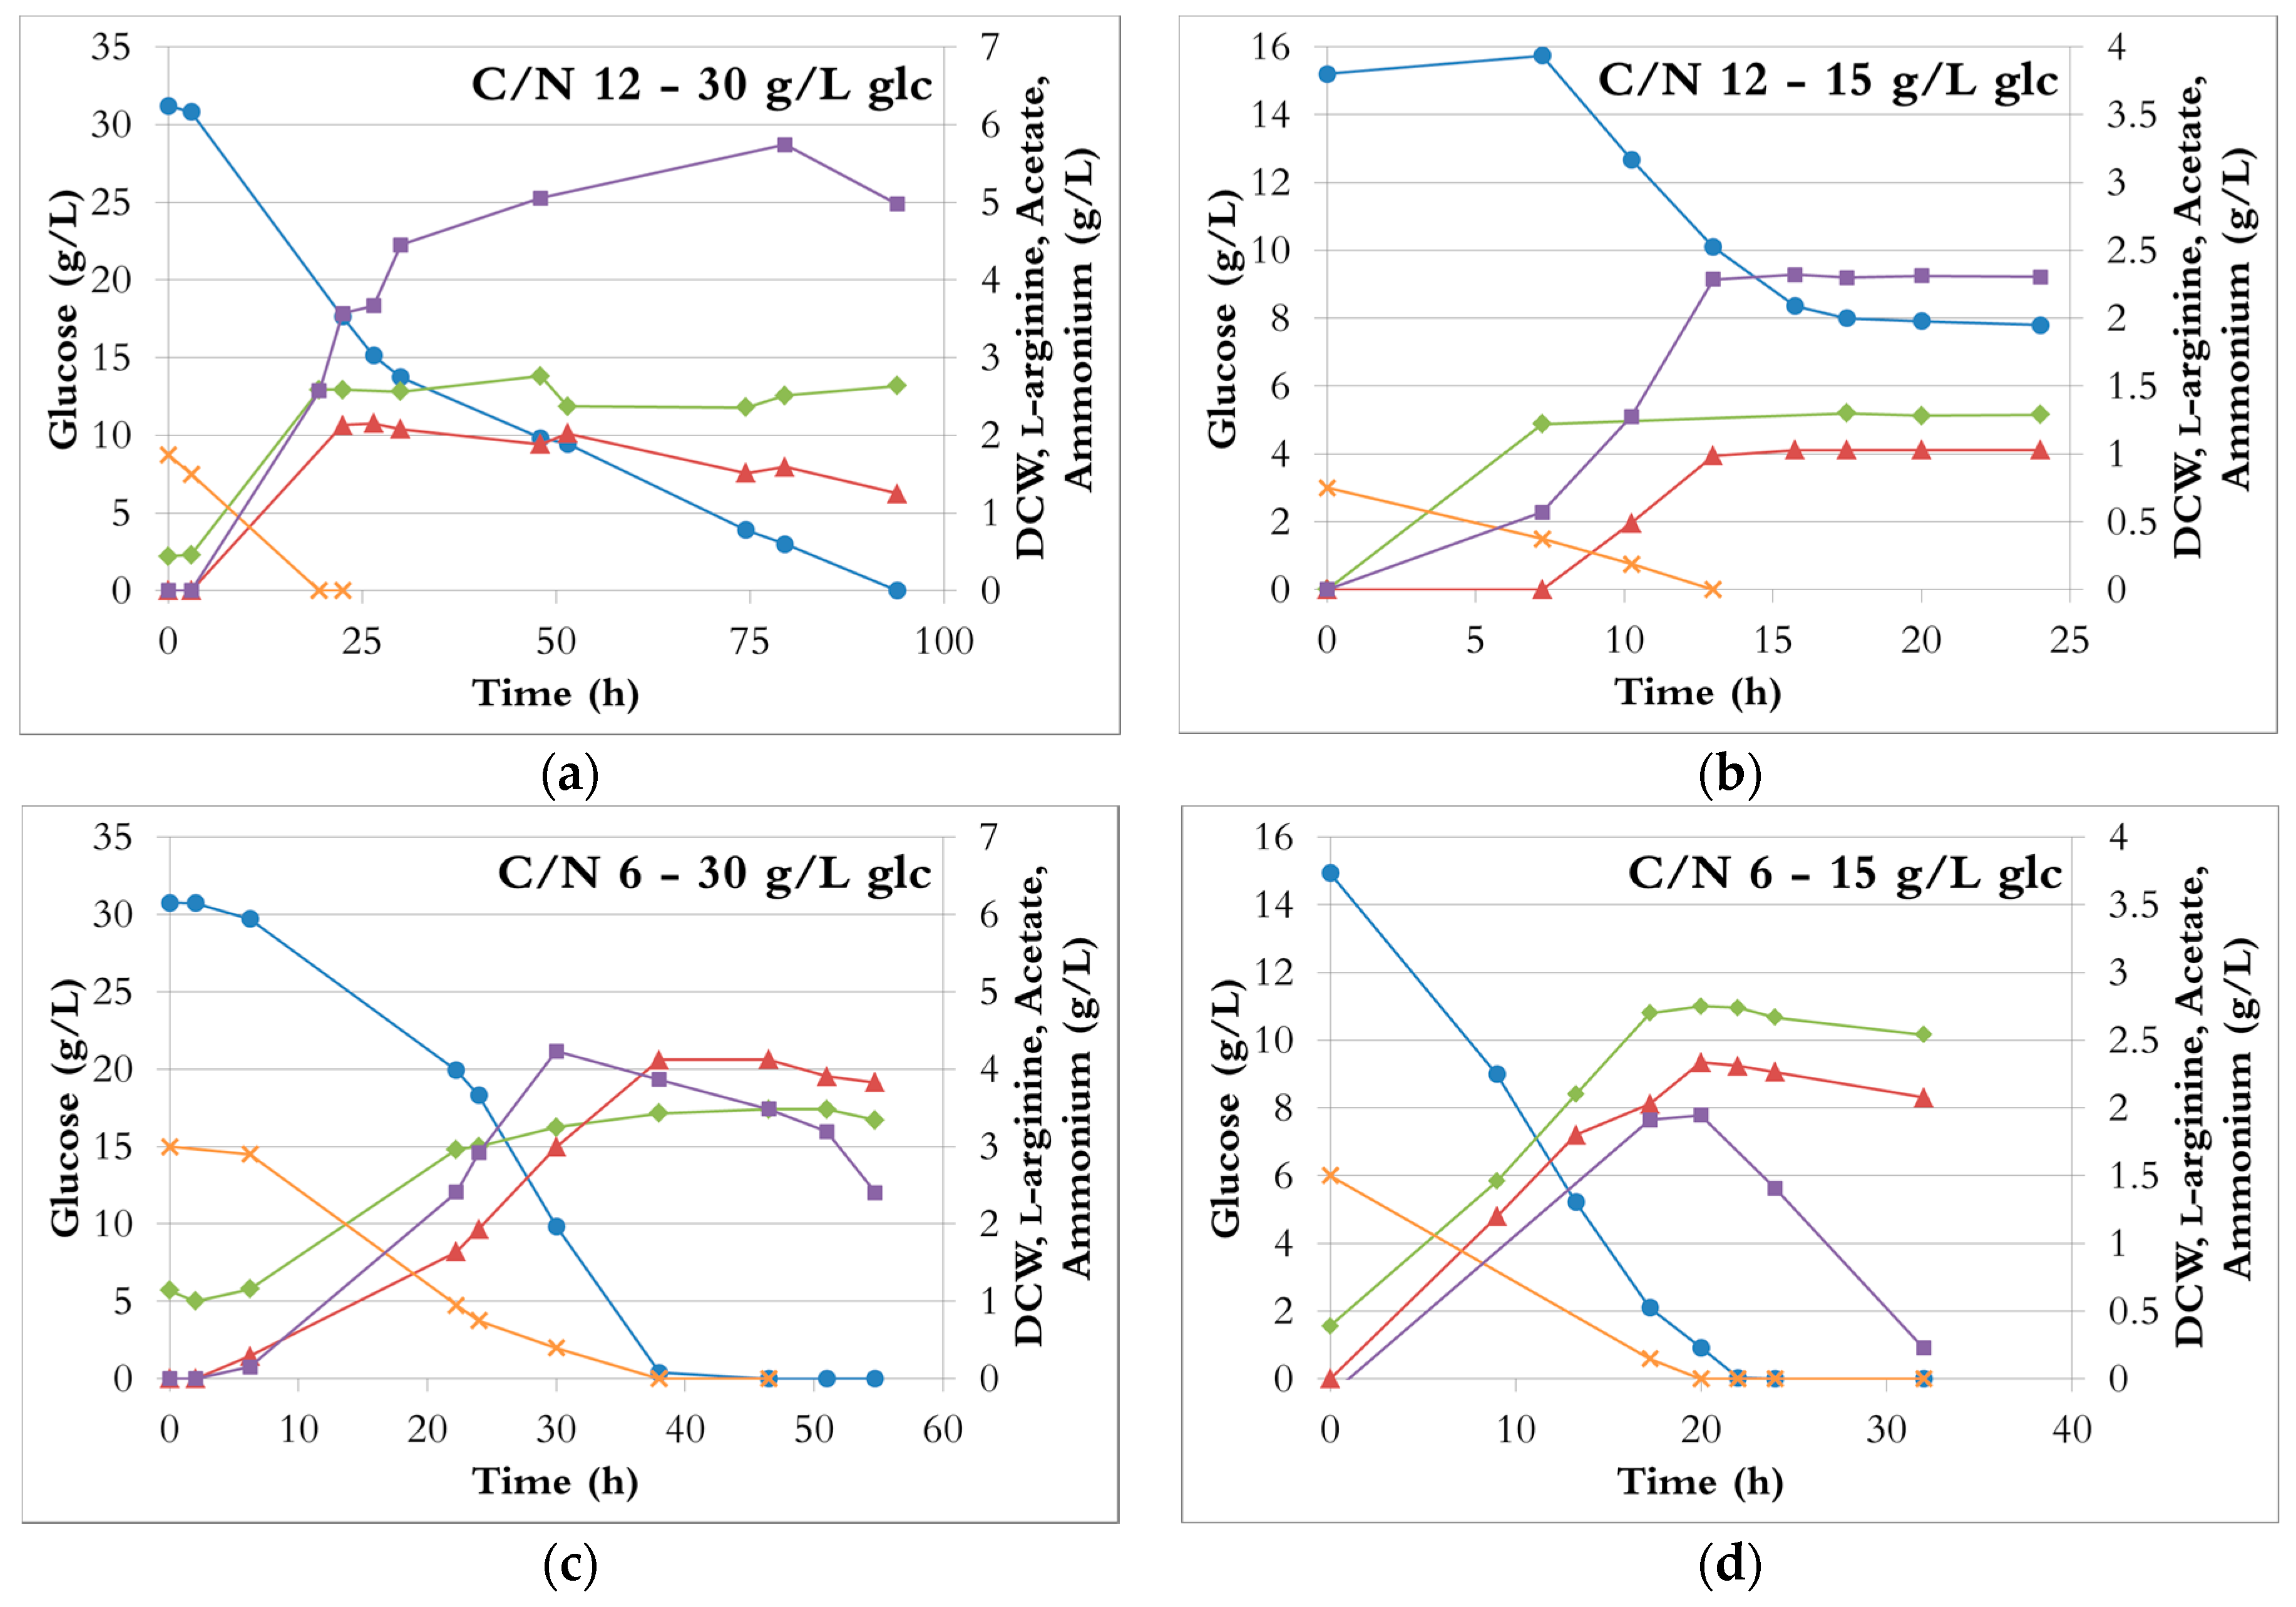
Ammonia solution, ammonium chloride, ammonium dibasic phosphate, and ammonium sulphate were nearly equally suitable for l-arginine production by E. coli in minimal medium. Indeed, at each ratio, the different fermentation results were relatively similar for each nitrogen source (Figure 2), with the exception of ammonium chloride showing somewhat lower productivities. For any given C/N ratio, the fermentation profiles were almost identical regardless of the nitrogen source. The curves of cell growth, glucose, l-arginine, and acetate concentration during fermentations with ammonium sulphate are shown as examples in Figure 3.
At a C/N ratio of 12 (Figure 3a,b), ammonium was depleted in less than 20 h and 14 h when the initial glucose concentration was 30 g/L and 15 g/L, respectively. Both cell growth and l-arginine production stopped with the depletion of ammonia, although about half of the glucose was still unused. With both 30 g/L and 15 g/L initial glucose, the DCW (around 2.4 g/L and 1.3 g/L, respectively) and the l-arginine concentrations (around 2 g/L and 1 g/L, respectively) were the lowest obtained (Figure 2). These results therefore indicate that a C/N ratio of 12 provides insufficient nitrogen for efficient fermentation. In the fermentation with 30 g/L glucose, the cells used the remaining glucose after cell growth and l-arginine production stopped, likely due to utilization of l-arginine as a poor nitrogen source (l-arginine concentration is decreasing) [38], and only acetate was produced. In the fermentation with 15 g/L glucose, neither glucose uptake nor acetate production occurred after ammonia depletion. It can be speculated that a longer time might have been needed for the cells to adapt to the new conditions (no ammonia available), possibly because the cell density was very low (1.3 g/L).
At a C/N ratio of 6, ammonium and glucose were nearly simultaneously depleted after 40 h (30 g/L initial glucose, Figure 3b) and 20 h (15 g/L initial glucose, Figure 3d). The DCW increased by either 50% (30 g/L initial glucose) or 100% (15 g/L initial glucose) compared to a C/N ratio of 12 (Figure 2 and Figure 3a). In both cases, l-arginine production almost doubled and reached 3.9 ± 0.1 g/L and 2.3 ± 0.1 g/L, from 30 and 15 g/L glucose, respectively (Figure 2b). Hence, a C/N ratio of 6 seemed to be suitable for l-arginine production.
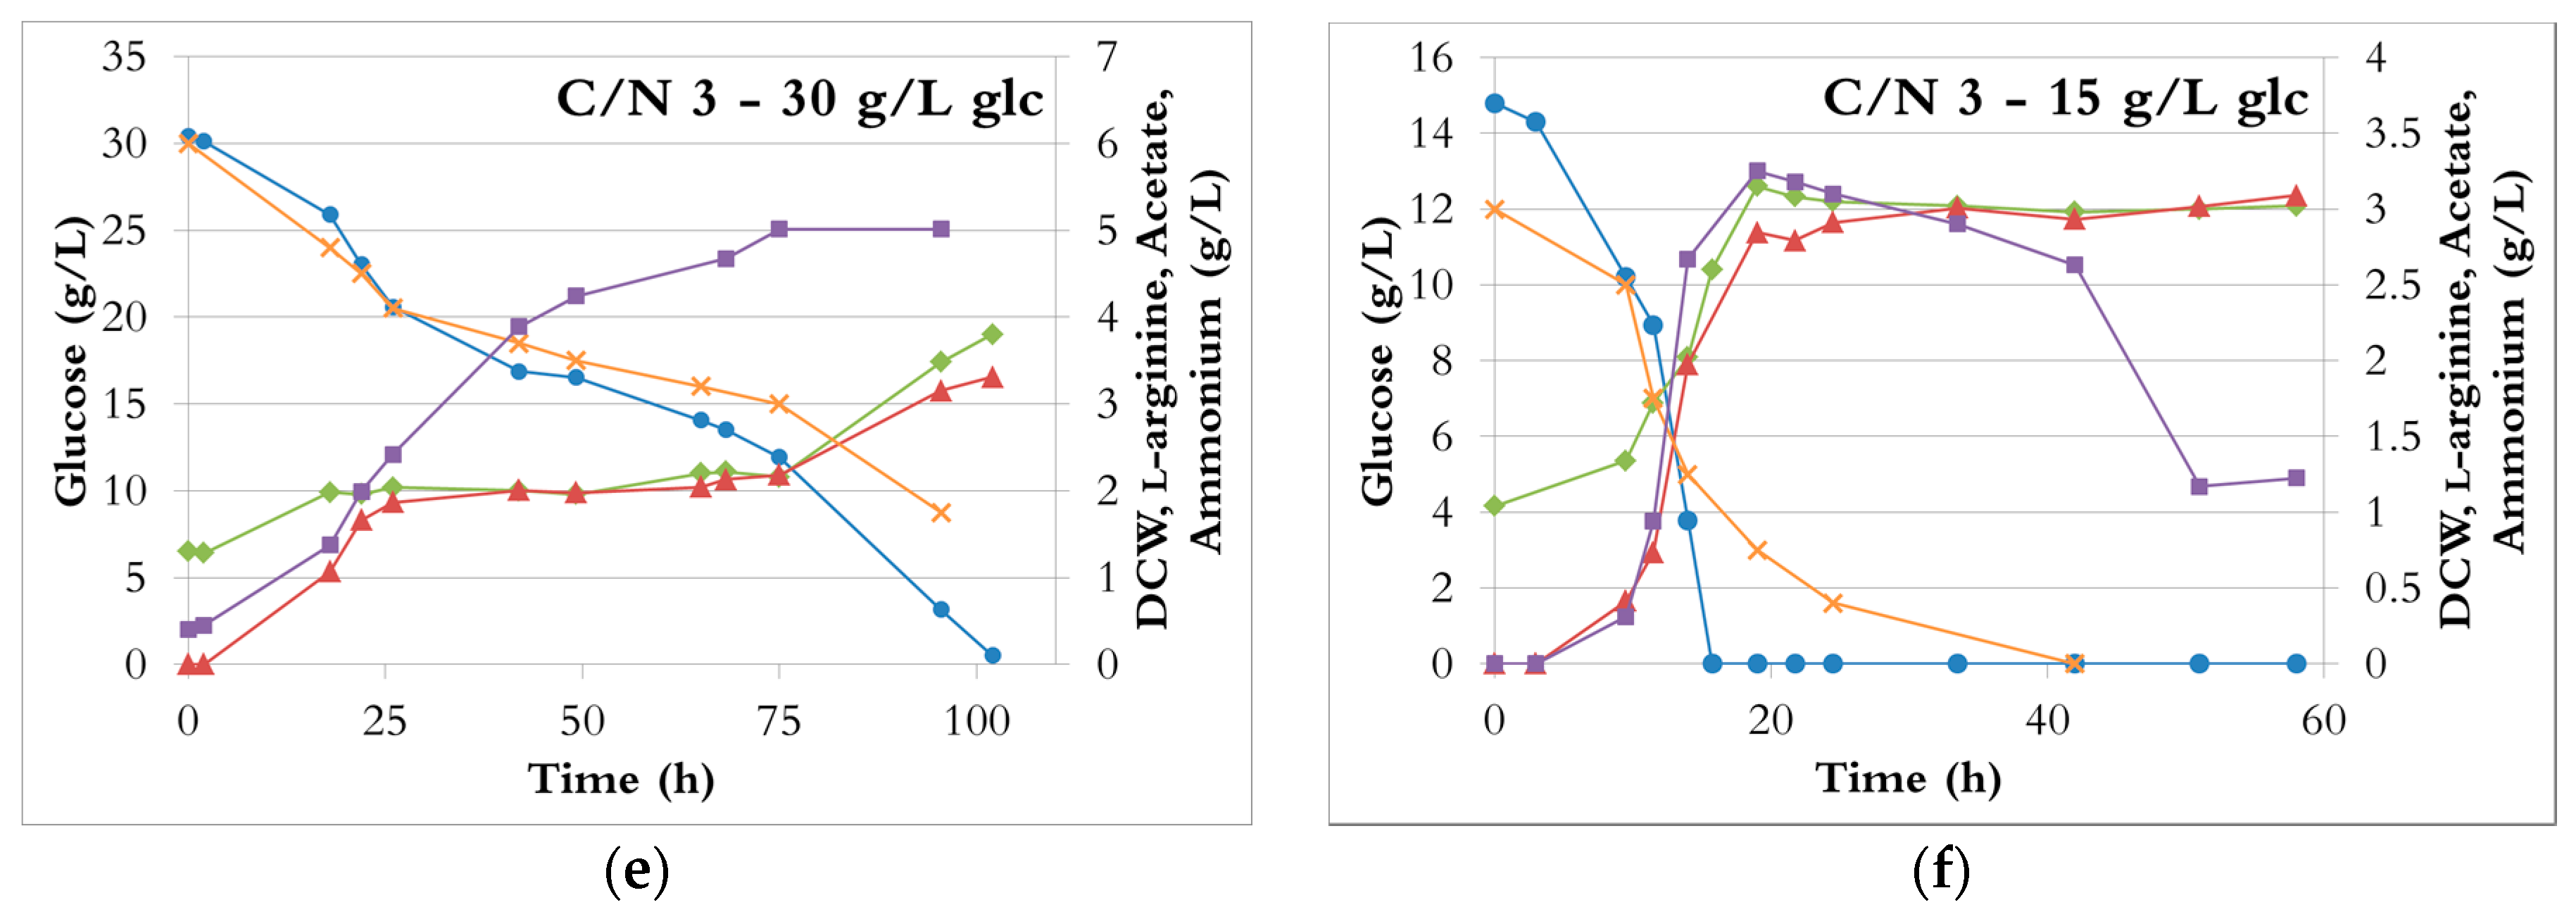
At a C/N ratio of 3, with an initial glucose concentration of 15 g/L, the glucose was rapidly depleted (16–24 h), while a third of the ammonium was still available (Figure 3f). After glucose exhaustion, the cells slowly used acetate and gradually consumed all the ammonium, albeit at a decreasing rate, but neither growth nor l-arginine production occurred. Even though the ammonium provided was doubled compared to a C/N ratio of 6, the l-arginine production (2.8 ± 0.1 g/L) was only increased by about 25%; the l-arginine yields from ammonium were thus significantly lower (Figure S1b). However, the productivities were increased by 30 to 60% depending on the nitrogen source (Figure S2b).
With the same ratio but 30 g/L initial glucose, cells stopped growing and producing l-arginine after approximately 25 h, although about two thirds of the glucose and of the ammonium were left in the broth (Figure 3e). Glucose and ammonium consumption rates dropped while acetate was still rapidly produced. Cells resumed a normal behaviour after a 50 h lag; at that time, the ammonium concentration was down to 3 g/L and the glucose concentration to about 12 g/L. The glucose was the limiting nutrient and was depleted in 25 h, whereas 25% of the ammonium was still unused. Cell growth and l-arginine production were halted. In the end, the cells had grown to similar or higher densities than at a C/N ratio of 6 (Figure 2a), but needed three times longer to reach it (e.g., Figure 3c,e). On the other hand, the l-arginine production (2.8 ± 0.4 g/L) was at least 25% lower than at a C/N ratio of 6. Compared to a C/N of 6 or 12, the volumetric productivities and the glucose consumption rates dropped by 80% (Figure S2). The lowest l-arginine yields from glucose (0.11 ± 0.01 mol/mol) and ammonium (0.07 ± 0.01 mol/mol) were obtained (Figure S1).
Consequently, a C/N ratio of 3 resulted in a waste of ammonium, not only because much was yet unused when the highest l-arginine concentration was reached, but also because the rest was not efficiently utilised for l-arginine production.
It is not clear why the cells started to grow and produce l-arginine normally and then experienced a long lag phase before resuming normal activity. However, the fact that fermentation was hampered with 30 g/L initial glucose but not with 15 g/L suggests that it is the high concentration of ammonium, or the combination of the high concentrations of ammonium and glucose, rather than the C/N ratio itself, that had such a detrimental effect. A negative impact of excessive ammonium on fermentation has been observed in other studies [15,16,39]. For instance, increasing the initial ammonium sulphate concentration from 10 g/L to 20 g/L resulted in a nearly six-fold decline in L-phenylalanine production and productivity [16]. A further increase of the ammonium sulphate concentration (30 g/L) caused a 17-fold drop of these parameters compared to 10 g/L of ammonium sulphate. Here, similar results were obtained since the production and productivity of l-arginine decreased five-fold when increasing the ammonium sulphate from 13.2 g/L to 26.4 g/L (C/N ratio of 6 and 3, respectively, 30 g/L initial glucose).
In most fermentations, the cells were able to use the acetate they had previously excreted as the sole carbon source (Figure 3). However, this merely permitted cell survival and supported neither cell growth nor l-arginine production.
Looking more closely into the acetate production is interesting since acetate is the main by-product during l-arginine production [11]. Conditions that minimise its formation are desirable. Indeed acetate can be toxic for cells [40] and its production requires carbon that might otherwise be used for l-arginine production. Acetate formation cannot be completely avoided since l-arginine biosynthesis requires the split of N-acetylornithine into ornithine and acetate (Figure 1a). However, this only accounts for 1 mole of acetate per mole of l-arginine and most of the acetate is produced from acetyl-CoA or pyruvate (Figure 1a).
Regardless of the C/N ratio, around 4 g/L were produced with 30 g/L initial glucose and 2 to 3 g/L with 15 g/L initial glucose. However, the mechanism behind acetate formation cannot be the same at all C/N ratios. Indeed, half as much l-arginine is produced with a ratio of C/N equal to 12 compare to one of 6 (Figure 2b). Therefore, half as much of the total acetate comes from the split of N-acetylornithine (Figure S3) and the production of acetate relative to that of l-arginine is twice as high (Figure S3c). Moreover, the acetate yields from glucose with a C/N ratio of 12 are about twice as high than those from a C/N ratio of 6 (Figure S3d).
Together, these results show that at a C/N ratio of 12 a majority of glucose is diverted toward acetate formation via acetyl-CoA and pyruvate. This could be because less α-ketoglutarate is needed for nitrogen assimilation, leading to a more active TCA cycle and thus more NADH production. Too much NADH results in an increase in pyruvate concentration and inhibition of the TCA cycle. Acetate formation represents an alternative for carbon utilization resulting in less NADH formation [41].
A C/N ratio of 6 resulted in the lowest ratios of acetate to l-arginine (around 3 mol/mol), which confirms that this ratio provides a good balance between the carbon and the nitrogen metabolism.
For a C/N ratio of 3, with 15 g/L glucose, the acetate yield from glucose, the acetate to l-arginine ratio, and the acetate formed from the l-arginine pathway are sensibly similar to those with a C/N of 6 (Figure S3b–d). However, with 30 g/L, more acetate is formed from acetyl-CoA and/or pyruvate with a C/N ratio of 3 than with a C/N ratio of 6, although the acetate yields are similar or even slightly lower for a C/N of 3. Once again, this shows that a high ammonium concentration in that case has a negative impact on the fermentation.
An initial C/N ratio of 6 was the most suitable for this fermentation, resulting in good growth and l-arginine production with reasonably low acetate formation. It should be noted that a lower initial glucose concentration leads to higher l-arginine yields from both glucose (0.17 ± 0.01 vs. 0.14 ± 0.01 mol/mol) and ammonium (0.17 ± 0.02 vs. 0.13 mol/mol) (Figure S1).
4. Conclusions
Ammonia solution, ammonium sulphate, and ammonium phosphate dibasic were the most effective nitrogen sources for l-arginine production. Ammonium chloride was nearly as good but resulted in slightly lower productivities. The ammonium carbonate yielded a reasonable l-arginine concentration but at a significantly lower productivity. The other nitrogen sources tested gave either poor l-arginine production (ammonium nitrate) or no production (sodium nitrate, monosodium glutamate).
This study highlights the limitations of a batch process for the large scale microbial production of l-arginine. Indeed, with 15 g/L glucose, a C/N ratio of 3 resulted in the highest productivities; however, maintaining this ratio for a higher glucose concentration is not feasible as it implies an excessive ammonium source concentration, as observed here with 30 g/L glucose.
With a C/N ratio of 3 and 15 g/L glucose, only two thirds of the ammonium was consumed by the time glucose was exhausted. In a fed-batch or continuous process, a C/N of 3 in the inflowing medium would therefore most likely result in the accumulation of the nitrogen source to toxic levels. A C/N ratio of 12 is not recommended for these processes as it favors glucose conversion to acetate rather than to l-arginine.
A C/N ratio of 6, however, provided an excellent balance between the carbon and the nitrogen metabolism during batch fermentations. Both the glucose and the ammonium source were efficiently used for l-arginine production and simultaneously depleted. This suggests that this ratio would be well suited for either fed-batch or continuous fermentations.
In addition, it was shown that using a lower initial glucose concentration (15 g/L) resulted in higher l-arginine yields from glucose and ammonium and reduced acetate formation.
Under the optimal conditions (C/N ratio of 6, initial glucose of 15 g/L), about 2.29 g/L of l-arginine was formed at a productivity of 0.11 g/L/h; l-arginine yields were 0.17 mol/mol from both glucose and ammonium.
Supplementary Materials
The following are available online at www.mdpi.com/2311-5637/3/4/60/s1.
Acknowledgments
The authors would like to thank Kempestiftelserna and Bio4Energy, a strategic research environment appointed by the Swedish government, for supporting this work.
Author Contributions
Mireille Ginésy conceived, designed, and conducted the experiments, analysed the data, and wrote the paper. Daniela Rusanova-Naydenova contributed to samples analysis by ion chromatography and revised the manuscript. Ulrika Rova participated in the experimental design and revised the manuscript.
Conflicts of Interest
The authors declare no conflict of interest.
References
- Loscalzo, J. l-arginine and atherothrombosis. J. Nutr. 2004, 134, 2798S–2800S; discussion 2818S–2819S. [Google Scholar] [PubMed]
- Öhlund, J.; Näsholm, T. Low nitrogen losses with a new source of nitrogen for cultivation of conifer seedlings. Environ. Sci. Technol. 2002, 36, 4854–4859. [Google Scholar] [CrossRef] [PubMed]
- Chen, M.; Chen, X.; Wan, F.; Zhang, B.; Chen, J.; Xiong, Y. Effect of Tween 40 and DtsR1 on l-arginine overproduction in Corynebacterium crenatum. Microb. Cell Fact. 2015, 14, 119. [Google Scholar] [CrossRef] [PubMed]
- Nakayama, K.; Yoshida, H. Fermentative production of l-arginine. Agric. Biol. Chem. 1972, 36, 1675–1684. [Google Scholar] [CrossRef]
- Dou, W.; Xu, M.; Cai, D.; Zhang, X.; Rao, Z.; Xu, Z. Improvement of l-arginine production by overexpression of a bifunctional ornithine acetyltransferase in Corynebacterium crenatum. Appl. Biochem. Biotechnol. 2011, 165, 845–855. [Google Scholar] [CrossRef] [PubMed]
- Park, S.H.; Kim, H.U.; Kim, T.Y.; Park, J.S.; Kim, S.; Lee, S.Y. Metabolic engineering of Corynebacterium glutamicum for l-arginine production. Nat. Commun. 2014, 5, 4618. [Google Scholar] [CrossRef] [PubMed]
- Anwar, Z.; Gulfraz, M.; Irshad, M. Agro-industrial lignocellulosic biomass a key to unlock the future bio-energy: A brief review. J. Radiat. Res. Appl. Sci. 2014, 7, 163–173. [Google Scholar] [CrossRef]
- Ghosh, D.; Hallenbeck, P.C. Fermentative hydrogen yields from different sugars by batch cultures of metabolically engineered Escherichia coli DJT135. Int. J. Hydrog. Energy 2009, 34, 7979–7982. [Google Scholar] [CrossRef]
- Dien, B.S.; Nichols, N.N.; Bothast, R.J. Recombinant Escherichia coli engineered for production of l-lactic acid from hexose and pentose sugars. J. Ind. Microbiol. Biotechnol. 2001, 27, 259–264. [Google Scholar] [CrossRef] [PubMed]
- Andersson, C.; Hodge, D.; Berglund, K.A.; Rova, U. Effect of different carbon sources on the production of succinic acid using metabolically engineered Escherichia coli. Biotechnol. Prog. 2007, 23, 381–388. [Google Scholar] [CrossRef] [PubMed]
- Ginesy, M.; Belotserkovsky, J.; Enman, J.; Isaksson, L.; Rova, U. Metabolic engineering of Escherichia coli for enhanced arginine biosynthesis. Microb. Cell Fact. 2015, 14, 29. [Google Scholar] [CrossRef] [PubMed]
- Neidhardt, F.C.; Ingraham, J.L.; Low, K.B.; Magasanik, B.; Schaechter, M.; Umbarger, H. Escherichia coli and Salmonella Typhimurium: Cellular and Molecular Biology; American Society for Microbiology: Washington, DC, USA, 1987; Volume 2. [Google Scholar]
- Haleem Shah, A.; Hameed, A.; Ahmad, S.; Majid Khan, G. Optimization of culture conditions for l-lysine fermentation by Corynebacterium glutamicum. J. Biol. Sci. 2002, 2, 151–156. [Google Scholar]
- Jeon, J.M.; Rajesh, T.; Song, E.; Lee, H.W.; Lee, H.W.; Yang, Y.H. Media optimization of Corynebacterium glutamicum for succinate production under oxygen-deprived condition. J. Microbiol. Biotechnol. 2013, 23, 211–217. [Google Scholar] [CrossRef] [PubMed]
- Chen, N.; Huang, J.; Feng, Z.B.; Yu, L.; Xu, Q.Y.; Wen, T.Y. Optimization of fermentation conditions for the biosynthesis of l-threonine by Escherichia coli. Appl. Biochem. Biotechnol. 2009, 158, 595–604. [Google Scholar] [CrossRef] [PubMed]
- Yuan, P.; Cao, W.; Wang, Z.; Chen, K.; Li, Y.; Ouyang, P. Enhancement of l-phenylalanine production by engineered Escherichia coli using phased exponential l-tyrosine feeding combined with nitrogen source optimization. J. Biosci. Bioeng. 2015, 120, 36–40. [Google Scholar] [CrossRef] [PubMed]
- Hahn, J.; Crutzen, P.J. The role of fixed nitrogen in atmospheric photochemistry. Philos. Trans. R. Soc. Lond. Ser. B 1982, 296, 521–541. [Google Scholar] [CrossRef]
- Kinzig, A.P.; Socolow, R.H. Human impacts on the nitrogen cycle. Physics Today 1994, 47, 24–31. [Google Scholar] [CrossRef]
- Sutton, M.A.; Howard, C.M.; Erisman, J.W.; Billen, G.; Bleeker, A.; Grennfelt, P.; van Grinsven, H.; Grizzetti, B. The European Nitrogen Assessment: Sources, Effects and Policy Perspectives; Cambridge University Press: Cambridge, UK, 2011. [Google Scholar]
- Galloway, J.N. The global nitrogen cycle: Changes and consequences. Environ. Pollut. 1998, 102, 15–24. [Google Scholar] [CrossRef]
- Ramaswamy, V.; Boucher, O.; Haigh, J.; Hauglustaine, D.; Haywood, J.; Myhre, G.; Nakajima, T.; Shi, G.; Solomon, S.; Betts, R.E.; et al. Radiative Forcing of Climate Change; Houghton, J.T., Callander, B.A., Varney, S.K., Eds.; Cambridge University Press: New York, NY, USA, 2001. [Google Scholar]
- Dioha, I.; Ikeme, C.; Nafi’u, T.; Soba, N. Effect of carbon to nitrogen ratio on biogas production. IRJNS 2013, 1, 1–10. [Google Scholar]
- Wu, X.; Yao, W.; Zhu, J.; Miller, C. Biogas and CH4 productivity by co-digesting swine manure with three crop residues as an external carbon source. Bioresour. Technol. 2010, 101, 4042–4047. [Google Scholar] [CrossRef] [PubMed]
- Wang, X.; Yang, G.; Feng, Y.; Ren, G.; Han, X. Optimizing feeding composition and carbon–nitrogen ratios for improved methane yield during anaerobic co-digestion of dairy, chicken manure and wheat straw. Bioresour. Technol. 2012, 120, 78–83. [Google Scholar] [CrossRef] [PubMed]
- Sattur, A.P.; Karanth, N.G. Production of microbial lipids: II. Influence of C/N ratio—model prediction. Biotechnol. Bioeng. 1989, 34, 868–871. [Google Scholar] [CrossRef] [PubMed]
- Ykema, A.; Verbree, E.C.; Kater, M.M.; Smit, H. Optimization of lipid production in the oleaginous yeast Apiotrichum curvatum in wheypermeate. Appl. Microbiol. Biotechnol. 1988, 29, 211–218. [Google Scholar] [CrossRef]
- Kalil, M.S.; Alshiyab, H.S.; Yusoff, W.M.W. Effect of nitrogen source and carbon to nitrogen ratio on hydrogen production using C. acetobutylicum. Am. J. Biochem. Biotechnol. 2008, 4, 393–401. [Google Scholar] [CrossRef]
- Wang, D.; Wei, G.; Nie, M.; Chen, J. Effects of nitrogen source and carbon/nitrogen ratio on batch fermentation of glutathione by Candida utilis. Korean J. Chem. Eng. 2010, 27, 551–559. [Google Scholar] [CrossRef]
- Kumar, R.; Shimizu, K. Metabolic regulation of Escherichia coli and its gdhA, glnL, gltB D mutants under different carbon and nitrogen limitations in the continuous culture. Microb. Cell Fact. 2010, 9, 8. [Google Scholar] [CrossRef] [PubMed]
- Mohd Rusli, F.; Mohamed, M.S.; Mohamed, R.; Puspaningsih, N.N.T.; Ariff, A. Kinetics of xylanase fermentation by recombinant Escherichia coli DH5a in shake flask culture. Am. J. Biochem. Biotechnol. 2009, 5, 110–118. [Google Scholar]
- Commichau, F.M.; Forchhammer, K.; Stülke, J. Regulatory links between carbon and nitrogen metabolism. Microb. Cell Fact. 2006, 9, 167–172. [Google Scholar] [CrossRef] [PubMed]
- Mao, X.J.; Huo, Y.X.; Buck, M.; Kolb, A.; Wang, Y.P. Interplay between CRP-cAMP and PII-Ntr systems forms novel regulatory network between carbon metabolism and nitrogen assimilation in Escherichia coli. Nucleic Acids Res. 2007, 35, 1432–1440. [Google Scholar] [CrossRef] [PubMed]
- Doucette, C.D.; Schwab, D.J.; Wingreen, N.S.; Rabinowitz, J.D. alpha-ketoglutarate coordinates carbon and nitrogen utilization via Enzyme I inhibition. Nat. Chem. Biol. 2011, 7, 894–901. [Google Scholar] [CrossRef] [PubMed]
- Helling, R.B. Pathway choice in glutamate synthesis in Escherichia coli. J. Bacteriol. 1998, 180, 4571–4575. [Google Scholar] [PubMed]
- Nakano, M.; Iida, T.; Ohnishi, M.; Kurokawa, K.; Takahashi, A.; Tsukamoto, T.; Yasunaga, T.; Hayashi, T.; Honda, T. Association of the urease gene with enterohemorrhagic Escherichia coli strains irrespective of their serogroups. J. Clin. Microbiol. 2001, 39, 4541–4543. [Google Scholar] [CrossRef] [PubMed]
- Monk, J.M.; Charusanti, P.; Aziz, R.K.; Lerman, J.A.; Premyodhin, N.; Orth, J.D.; Feist, A.M.; Palsson, B.Ø. Genome-scale metabolic reconstructions of multiple Escherichia coli strains highlight strain-specific adaptations to nutritional environments. Proc. Natl. Acad. Sci. USA 2013, 110, 20338–20343. [Google Scholar] [CrossRef] [PubMed]
- Kobayashi, M.; Ishimoto, M. Aerobic inhibition of nitrate assimilation in Escherichia coli. Z. Allg. Mikrobiol. 1973, 13, 405–413. [Google Scholar] [CrossRef] [PubMed]
- Bren, A.; Park, J.O.; Towbin, B.D.; Dekel, E.; Rabinowitz, J.D.; Alon, U. Glucose becomes one of the worst carbon sources for E. coli on poor nitrogen sources due to suboptimal levels of cAMP. Sci. Rep. 2016, 6. [Google Scholar] [CrossRef] [PubMed]
- Xu, F.; Gage, D.; Zhan, J. Efficient production of indigoidine in Escherichia coli. J. Ind. Microbiol. Biotechnol. 2015, 42, 1149–1155. [Google Scholar] [CrossRef] [PubMed]
- Luli, G.W.; Strohl, W.R. Comparison of growth, acetate production, and acetate inhibition of Escherichia coli strains in batch and fed-batch fermentations. Appl. Environ. Microbiol. 1990, 56, 1004–1011. [Google Scholar] [PubMed]
- Eiteman, M.A.; Altman, E. Overcoming acetate in Escherichia coli recombinant protein fermentations. Trends Biotechnol. 2006, 24, 530–536. [Google Scholar] [CrossRef] [PubMed]
Figure 1.
Simplified pathways for l-arginine biosynthesis. Long-dashed lines: multi-step reactions; short-dashed lines: several possible pathways; α-KG: α-ketoglutarate. (a) Pathway from glucose to l-arginine; (b) The glutamate dehydrogenase (GDH) pathway; (c) The glutamine synthetase-glutamate synthase (GS-GOGAT) pathway.

Figure 2.
The influence of C/N ratio on fermentation. (NH4)2SO4 in blue; (NH4)2HPO4 in red; NH4Cl in green; NH4OH in purple.—(a) DCW; (b) l-arginine production.
Figure 2.
The influence of C/N ratio on fermentation. (NH4)2SO4 in blue; (NH4)2HPO4 in red; NH4Cl in green; NH4OH in purple.—(a) DCW; (b) l-arginine production.
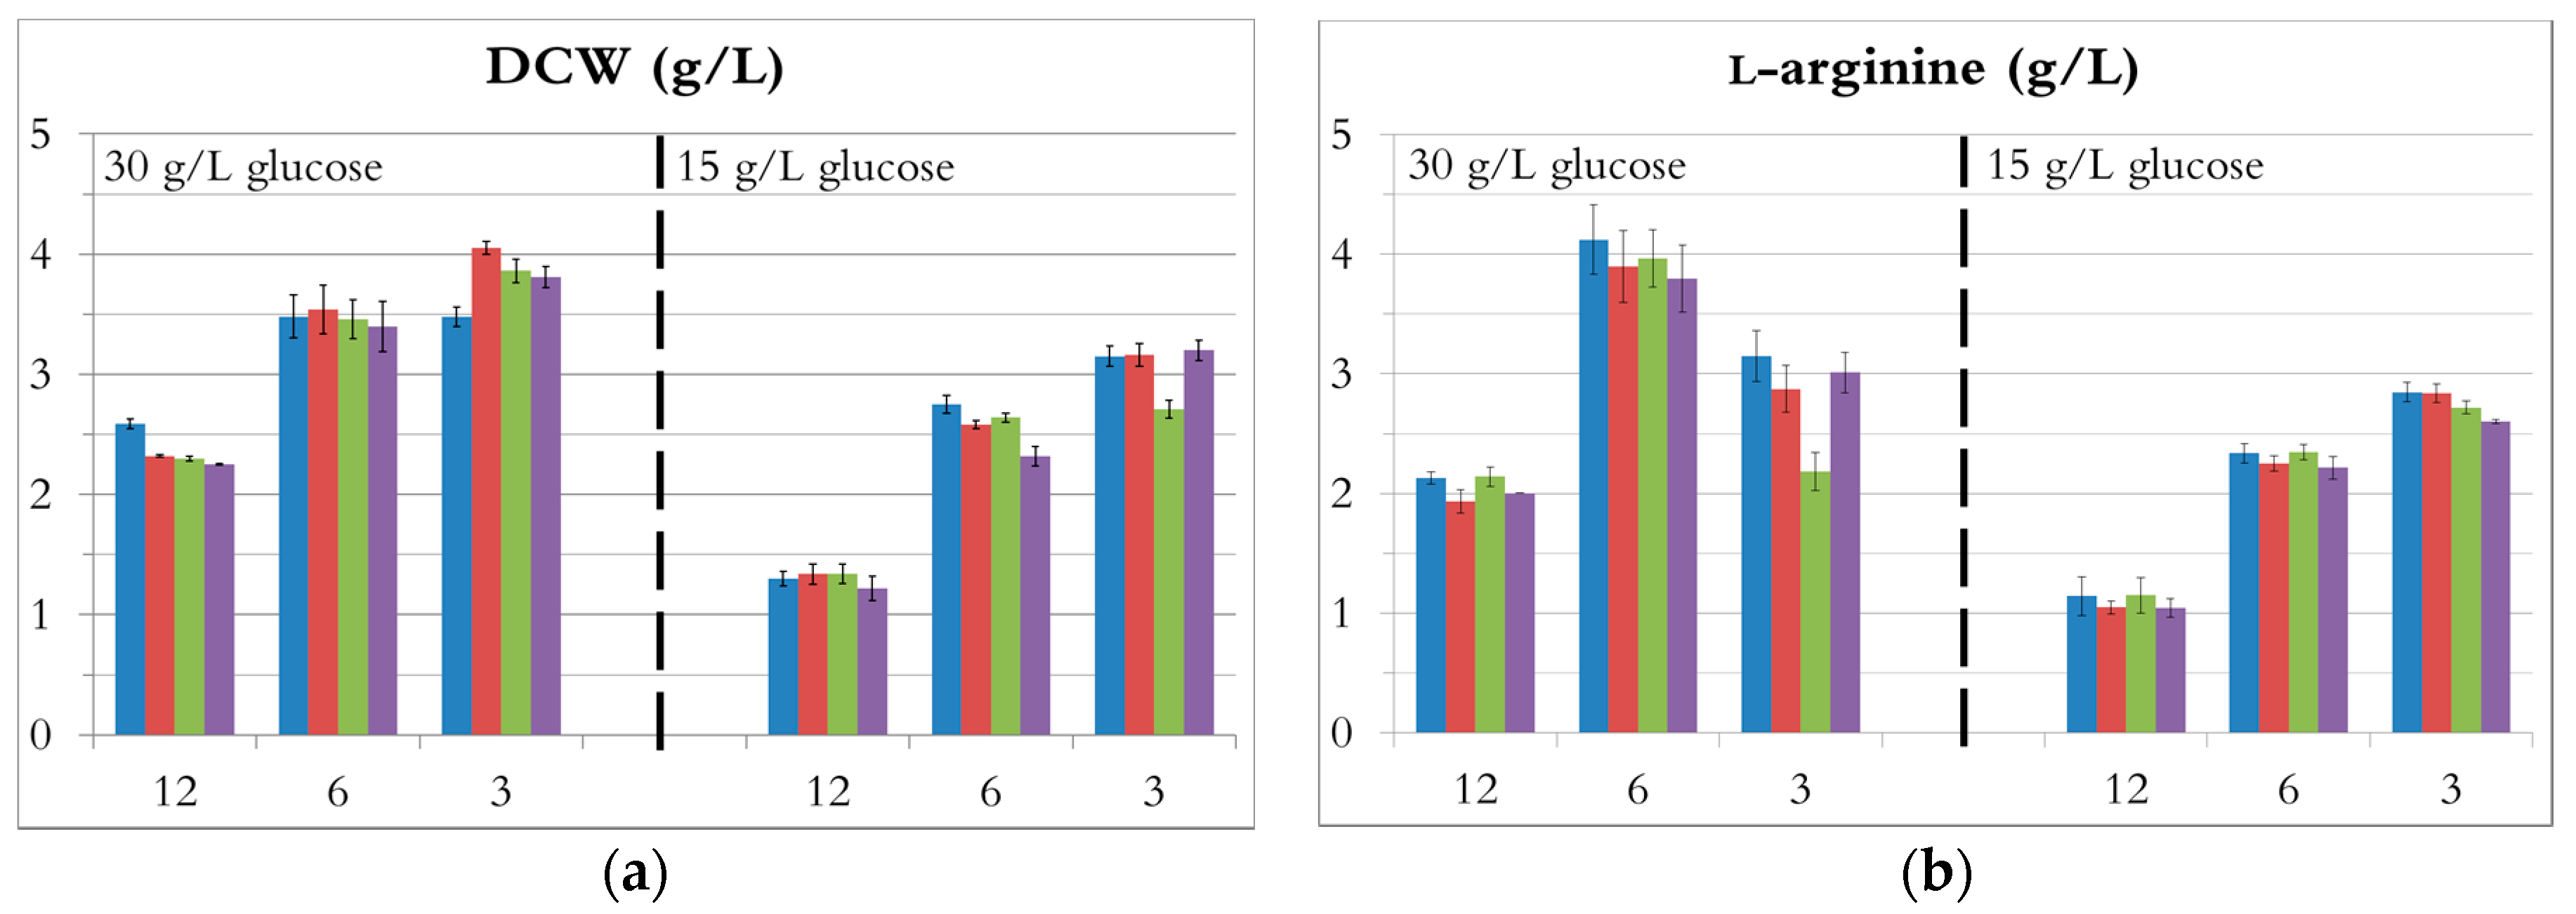
Figure 3.
The fermentation profiles with different C/N ratios during growth in bioreactors with ammonium sulphate as the sole nitrogen source. Blue circle: glucose; green tilted square: dry cell weight; red triangle: L-arginine; purple square: acetate; orange cross: ammonium. (a) C/N ratio of 12, 30 g/L glucose; (b) C/N ratio of 12, 15 g/L glucose; (c) C/N ratio of 6, 30 g/L glucose; (d) C/N ratio of 6, 15 g/L glucose; (e) C/N ratio of 3, 30 g/L glucose; (f) C/N ratio of 3, 15 g/L glucose.


Table 1.
Summary of fermentation results for the different nitrogen sources. Duplicate bioreactor cultivations in minimal medium, 15 g/L initial glucose, 32 °C, 500 rpm, air at 5 vvm, pH 7. Ammonium salts and ammonia solution were provided so as to have a C/N ratio of 6. Results are given as means ± standard deviations.
| Nitrogen Source | μ (1/h) | DCW (g/L) | l-arginine (g/L) | Qp (g/L/h) |
|---|---|---|---|---|
| Ammonia solution | 0.10 ± 0.01 | 2.35 ± 0.08 | 2.30 ± 0.09 | 0.12 ± 0.01 |
| Ammonium carbonate | 0.06 * | 2.08 ± 0.02 | 2.11 ± 0.01 | 0.08 * |
| Ammonium chloride | 0.09 * | 2.18 ± 0.03 | 2.23 ± 0.06 | 0.12 ± 0.01 |
| Ammonium nitrate | 0.06 * | 2.31 ± 0.12 | 1.44 ± 0.11 | 0.05 * |
| Ammonium phosphate dibasic | 0.09 * | 2.25 ± 0.03 | 2.25 ± 0.06 | 0.13 ± 0.02 |
| Ammonium sulphate | 0.09 ± 0.01 | 2.30 ± 0.10 | 2.41 ± 0.08 | 0.13 ± 0.01 |
| Sodium nitrate | nd | nd | nd | nd |
| Monosodium glutamate 10 g/L | nd | nd | nd | nd |
| Monosodium glutamate 5 g/L | nd | nd | nd | nd |
| Monosodium glutamate 2.5 g/L | 0.01 * | 0.52 ± 0.02 | nd | nd |
* standard deviation was lower than 0.01. nd: not detected. μ: specific growth rate; DCW: dry cell weight; Qp: volumetric productivity.
© 2017 by the authors. Licensee MDPI, Basel, Switzerland. This article is an open access article distributed under the terms and conditions of the Creative Commons Attribution (CC BY) license (http://creativecommons.org/licenses/by/4.0/).
Share and Cite
MDPI and ACS Style
Ginésy, M.; Rusanova-Naydenova, D.; Rova, U. Tuning of the Carbon-to-Nitrogen Ratio for the Production of l-Arginine by Escherichia coli. Fermentation 2017, 3, 60. https://doi.org/10.3390/fermentation3040060
AMA Style
Ginésy M, Rusanova-Naydenova D, Rova U. Tuning of the Carbon-to-Nitrogen Ratio for the Production of l-Arginine by Escherichia coli. Fermentation. 2017; 3(4):60. https://doi.org/10.3390/fermentation3040060
Chicago/Turabian StyleGinésy, Mireille, Daniela Rusanova-Naydenova, and Ulrika Rova. 2017. "Tuning of the Carbon-to-Nitrogen Ratio for the Production of l-Arginine by Escherichia coli" Fermentation 3, no. 4: 60. https://doi.org/10.3390/fermentation3040060
Note that from the first issue of 2016, this journal uses article numbers instead of page numbers. See further details here.