Cytosolic Redox Status of Wine Yeast (Saccharomyces Cerevisiae) under Hyperosmotic Stress during Icewine Fermentation

1
Cool Climate Oenology and Viticulture Institute, Brock University, St. Catharines, ON L2S 3A1, Canada
2
Centre for Biotechnology, Brock University, St. Catharines, ON L2S 3A1, Canada
3
Department of Biological Sciences, Brock University, St. Catharines, ON L2S 3A1, Canada
*
Author to whom correspondence should be addressed.
Fermentation 2017, 3(4), 61; https://doi.org/10.3390/fermentation3040061
Submission received: 30 October 2017
/
Revised: 10 November 2017
/
Accepted: 13 November 2017
/
Published: 18 November 2017
(This article belongs to the Special Issue Yeast Biotechnology 2.0)
Abstract
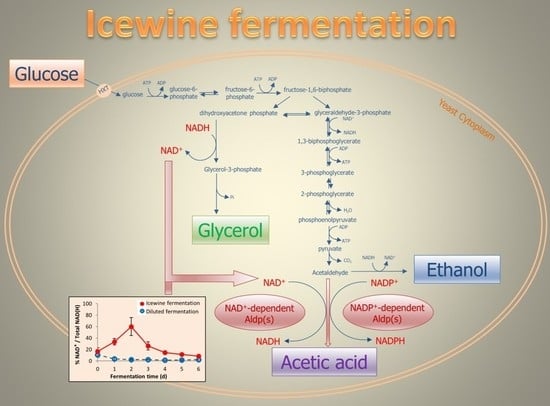
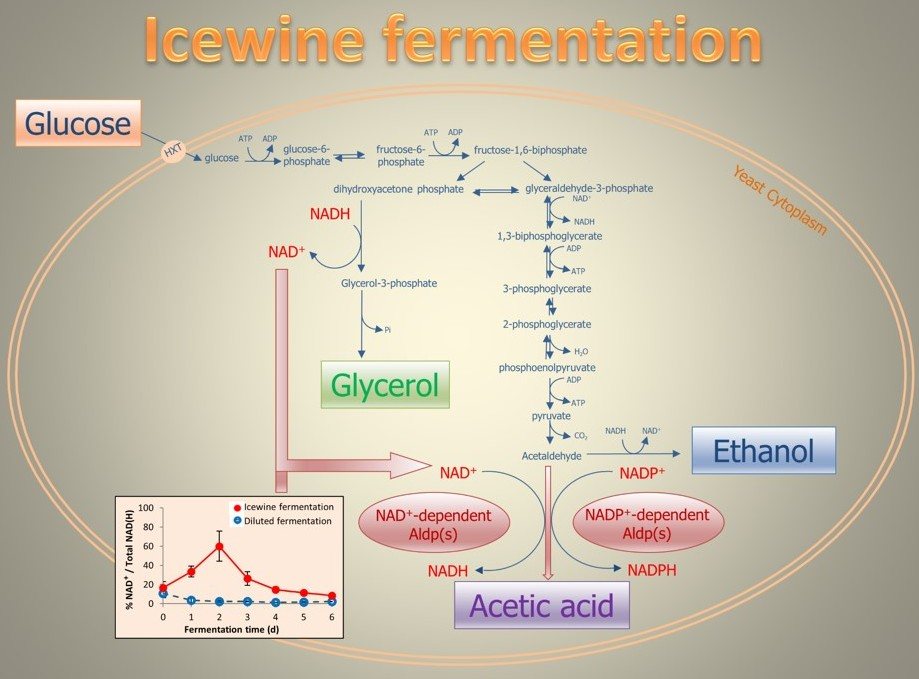
:Acetic acid is undesired in Icewine. It is unclear whether its production by fermenting yeast is linked to the nicotinamide adenine dinucleotide (NAD+/NADH) system or the nicotinamide adenine dinucleotide phosphate (NADP+/NADPH) system. To answer this question, the redox status of yeast cytosolic NAD(H) and NADP(H) were analyzed along with yeast metabolites to determine how redox status differs under Icewine versus table wine fermentation. Icewine juice and dilute Icewine juice were inoculated with commercial wine yeast Saccharomyces cerevisiae K1-V1116. Acetic acid was 14.3-fold higher in Icewine fermentation than the dilute juice condition. The ratio of NAD+ to total NAD(H) was 24-fold higher in cells in Icewine fermentation than the ratio from the dilute juice condition. Conversely, the ratio of NADP+ to total NADP(H) from the dilute fermentation was 2.9-fold higher than that in the Icewine condition. These results support the hypothesis that in Icewine, increased NAD+ triggered the catalysis of NAD+-dependent aldehyde dehydrogenase(s) (Aldp(s)), which led to the elevated level of acetic acid in Icewine, whereas, in the dilute condition, NADP+ triggered NADP+-dependent Aldp(s), resulting in a lower level of acetic acid. This work, for the first time, analyzed the yeast cytosolic redox status and its correlation to acetic acid production, providing a more comprehensive understanding of the mechanism of acetic acid production in Icewine.
1. Introduction
Icewine is a sweet dessert wine produced from grapes naturally frozen on the vine. The low temperature during harvesting and pressing (below −8 °C in Canada), traps the water crystals in grape berries, resulting in Icewine juice that is extremely concentrated in soluble solids including sugar, acids, and nitrogen compounds [1]. In Canada, the minimum concentration of soluble solids in Icewine juice for fermentation must reach 35 °Brix [2], but juice between 38 and 42 °Brix is commonly used for Icewine production [3]. Such a high concentration of sugar in Icewine juice places yeast cells under extreme hyperosmotic stress, resulting in prolonged fermentation times and a high concentration of volatile acidity (mainly in the form of acetic acid) [4].
Acetic acid present at high levels is a spoilage compound in wine. In Canada, the maximum allowed acetic acid concentration in Icewine is 2.1 g L−1, whereas in table wines it is 1.3 g L−1 [2]. The average acetic acid concentration in commercial Canadian Icewines was found to be 1.30 g L−1, but ranged from 0.49 to 2.29 g L−1 [5]. Acetic acid also contributes to the formation of another undesired aromatic compound, ethyl acetate, which is described as having a solvent-like aroma such as that found in nail polish remover [6,7]. Nurgel et al. reported that the ethyl acetate concentration in commercial Canadian Icewines ranged from 0.086 to 0.369 g L−1 , with an average value of 0.240 g L−1 [5], and some wines testing over the sensory threshold in Icewine of 0.198 g L−1 [6].
Acetic acid production appears linked to the osmotic stress yeast are placed under. During Icewine fermentation, the highly concentrated juice places yeast cells under extreme hyperosmotic stress. In response, Saccharomyces cerevisiae produces glycerol as an intracellular osmolyte to counteract the high osmolarity [8]. During glycerol formation, the oxidized cofactor NAD+ is produced, while dihydroxyacetone phosphate is reduced to glycerol-3-phosphate, leading to a potential redox imbalance for the NAD+/NADH cofactor system. Because of the lack of transhydrogenase in yeast to convert reducing equivalents between the NAD(H) system and the NADP(H) system, yeasts must rely on metabolite formation to maintain the redox balance [9,10]. Acetic acid has been suggested as a potential metabolite that yeast cells can produce to balance the excess NAD+ produced during glycerol formation under hyperosmotic stress [8,11,12]. The high level of acetic acid present in Icewine may also be due to the downregulation of ACS genes encoding for acetyl-CoA synthetases [13]. In S. cerevisiae, acetic acid is an intermediate to form the central metabolite, acetyl-CoA, catalyzed by acetyl-CoA synthetases in the pyruvate dehydrogenase (PDH) pathway [14]. Heit et al. found that ACS1 and ACS2 were downregulated 19.0-fold and 11.2-fold, respectively, in S. cerevisicea K1-V1116 yeasts fermenting Icewine juice compared to diluted juice, suggesting that the lower consumption of acetic acid to form the downstream metabolites during Icewine fermentation contributes to elevated acetic acid production in Icewine [13].
The results from current literature are not in agreement concerning which Aldp isoform is responsible for acetic acid production during sugar fermentations, as different Aldps have distinct cofactor specificities and play different roles for acetic acid production in yeast metabolism [11,12,13,15]. S. cerevisiae contain five aldehyde dehydrogenases [16]. Two cytosolic isoforms are NAD+-dependent (Ald2p and Ald3p) [16], and one is NADP+-dependent (Ald6p) [17]. Ald2p oxidizes 3-aminopropanal to β-alanine, required for pantothenic acid production [18]. Ald6p has been identified as the main cytosolic aldehyde dehydrogenase responsible for acetic acid production in S. cerevisiae strains during the fermentation of glucose [15,19,20,21], although both mitochondrial NADP+-dependent Ald5p [22] and NAD+/NADP+-dependent Ald4p [23] have been reported to contribute. Ald6p was linked to acetic acid generation under osmotic stress to NADPH production to compensate for the downregulation of genes in the pentose phosphate pathway [15], thus questioning the linkage of acetic acid production under osmotic stress to glycerol formation and NADH requirements. However, Noti et al. found ALD6 to be only slightly upregulated in some strains during the first two hours of exposure to 235 g/L sugar [21]. Contrary to these reports, additional studies have linked acetic acid to ALD3 expression and the NAD+/NADH cofactor system during fermentation [11,12,24] with a temporal relationship between acetaldehyde increase, ALD3 expression, and acetic acid production when fermenting juice at 401 g/L sugar [11,12]. ALD3 was the only isoform upregulated by acetaldehyde stress during fermentation [12]. To reconcile these differences, we hypothesize that the main Aldp responsible for acetic acid production throughout fermentation relates back to the starting sugar concentration in the juice, and the ongoing redox requirements of the cell throughout fermentation.
In S. cerevisiae, the NAD(H) and NADP(H) cofactor systems play important roles as electron donors/acceptors in more than 300 biochemical oxidation and reduction reactions [25]. NAD(H) is mainly involved in catabolic reactions such as glycolysis, glycerol production, and nitrogen uptake and consumption [26,27]. NADP(H) is predominantly involved in anabolic processes including the pentose phosphate pathway, which provides substrates for the synthesis of nucleic acids (RNA and DNA) and some amino acids [28], and has been indicated to be growth rate-dependent [29,30].
This study monitored daily changes in the two cofactor systems, NAD(H) and NADP(H), during the first week of fermentation when acetic acid is rapidly produced by S. cerevisiae K1-V1116. The fermentations were conducted in both Icewine juice and dilute Icewine juice, which mimics a table wine fermentation. The different ratios of oxidized cofactor to total cofactor for these two systems provides further evidence of which aldehyde dehydrogenases are involved in acetic acid production during Icewine versus dilute juice fermentation.
2. Materials and Methods
2.1. Yeast Strain and Juices
The commercial wine yeast S. cerevisiae K1-V1116 (Lalvin, Montreal, QB, Canada) was used for fermentations. Vidal Icewine juice was purchased from Huebel Grapes Estates Ltd. (Niagara-on-the-Lake, ON, Canada) and stored at −35 °C until required for use. The juice was thawed at 7 °C for 24 h, and racked off, followed by filtration through coarse, medium, and fine pore size pad filters using the Bueno Vino Mini Jet filter (Vineco, St. Catharines, ON, Canada). The juice was then filtered through a 0.45-μm membrane cartridge filter (Millipore, Etobicoke, ON, Canada). Sterile filtered Icewine juice (39.4 °Brix, 433 ± 5 g L−1 reducing sugars) was used for Icewine fermentation, and diluted to 20.0 °Brix (201 ± 1 g L−1 reducing sugars) for dilute juice fermentations, which mimics table wine fermentation.
2.2. Fermentation Setup and Sampling
Dried wine yeast K1-V1116 was prepared using the stepwise acclimatization procedure described in Pigeau and Inglis [11]. A volume of 30 mL of the acclimatized starter culture was used to inoculate 2 L of Icewine juice (39.4 °Brix) and dilute Icewine juice (20.0 °Brix), reaching a final yeast inoculation rate of 0.5 g dry weight L−1. Fermentations were incubated at 17 °C in triplicate and continued until sugar consumption stopped for three consecutive days for Icewine fermentations, or until the sugar level was below 3 g L−1 for dilute juice fermentations. After stirring the fermentations for 5 min to ensure homogeneity, 100 mL of sample was removed daily and analyzed for cofactors in the first week of fermentation. Samples (5 mL) were also taken for metabolite analysis every day during the first week, every other day in the second week, and every third day in the following weeks until the fermentations stopped. Samples were centrifuged and the supernatants were stored at −30 °C until metabolite analysis was performed.
2.3. Analysis for Metabolites
Soluble solids were determined by ABBE bench top refractometer (model 10450; American Optical, Buffalo, NY, USA). Acidity was determined by pH measurement using a sympHony pH meter (model B10P; VWR, Mississauga, ON, Canada), and titratable acidity by titration against 0.1 mol L−1 NaOH to an endpoint of pH 8.2 [31]. Reducing sugars, ammonia nitrogen, amino nitrogen, glycerol, acetaldehyde, and acetic acid were determined with Megazyme assay kits (K-FRUGL, K-AMIAR, K-PANOPA, K-GCROL, K-ACHD, K-ACET; Megazyme International Ireland, Ltd., Bray, Co. Wicklow, Ireland). Ethanol was determined by gas chromatography (model 6890; Agilent Technologies Inc., Palo Alto, CA, USA) with a flame ionization detector and a capillary column (Agilent 122-7032 DB-Wax, 30 m × 250 µm diameter, 0.25 µm film thickness), using 0.1% 1-butanol as an internal standard. All metabolite measurements were performed in duplicate on each fermentation replicate. Metabolite production during the course of fermentation was calculated by the difference in the respective metabolite concentration measured between the time zero point (immediately after inoculation) and at each sampling time point during the course of fermentations. Normalized metabolite production was determined by dividing the final metabolite production by the final sugar consumed. Metabolite daily production rate was calculated as: daily production rate = (metabolite concentration on the sampling day − metabolite concentration on the previous day) / (sugar concentration on the previous day − sugar concentration on the sampling day).
2.4. Analysis for Enzyme Cofactors
To collect yeast cells, 100 mL of sample was centrifuged at 5108× g for 10 min at 4 °C; the pellet was washed once with 2 mL sterile deionized water and re-centrifuged. The pellet was re-suspended in 2 mL g−1 (yeast wet weight) of Tris-dithiothreitol (DTT) buffer (100 mM Tris-H2SO4, pH 9.4; 10 mM DTT; sterile filtered) and incubated for 30 min at 30 °C with gentle shaking at 0.059× g. The treated cells were then collected by centrifugation at 1464× g for 5 min at 4 °C. The pellet was re-suspended in 2 mL spheroplast buffer (1.2 M sorbitol; 20 mM potassium phosphate, pH 7.4; sterile filtered) and centrifuged as in the previous step. Cells were then added to a mixture containing 10 mg of Zymolyase-100T g−1 of yeast wet weight and 4 mL spheroplast buffer. The mixture was incubated for 60 min at 35 °C with shaking at 0.059× g. Following Zymolyase digestion, the spheroplasts were collected by centrifugation at 1464× g for 5 min at 4 °C, washed twice in spheroplast buffer, and pelleted as before. The spheroplasts were then re-suspended in ice-cold cell lysis buffer (0.6 M mannitol; 20 mM 4-(2-hydroxyethyl)piperazine-1-ethanesulfonic acid (HEPES)-KOH, pH 7.4; 1 mM phenylmethylsulfonyl fluoride (PMSF); 0.1% w/v fatty acid free-bovine serum albumin (BSA); sterile filtered) and disrupted using a pre-chilled Dounce homogenizer on ice. The volume of cell lysis buffer applied was 3.5 mL for yeast samples from diluted fermentation, and 2.0 mL for samples from Icewine fermentation. The lysate was then quickly transferred to pre-chilled centrifuge tubes and fractionated at 9682× g for 10 min at 4 °C to separate the cytosolic fraction. A small portion (200 µL) of the supernatant was immediately mixed with 200 µL of Component E from the Amplite Fluorimetric NAD/NADH or NADP/NADPH Ratio Assay Kits (15263, 15264; AAT Bioquest Inc., Sunnyvale, CA, USA) and incubated for 10 min to extract NAD+ or NADP+. This sample was also diluted serially by a mixture of cell lysis buffer and Component E (at a 1:1 ratio) to ensure that the sample concentration would be within the linear range of the calibration curves of both kits. The rest of the supernatant was kept on ice for the measurement of the sum of NAD+ and NADH or the sum of NADP+ and NADPH, and serial dilution was also performed for this sample using cell lysis buffer. All samples were then tested by the abovementioned fluorimetric kits in duplicate on each fermentation replicate according to the manuals. The percentage of oxidized cofactor of either the NAD(H) or NADP(H) system was calculated as: percentage of oxidized cofactor = concentration of oxidized cofactor / (concentration of oxidized cofactor + concentration of reduced cofactor) × 100%.
2.5. Statistical Analysis
XLSTAT-Pro by Addinsoft (New York, NY, USA) was used for statistical analysis. Analysis of variance (ANOVA) with Fisher’s Least Significant Difference (LSD) test (p < 0.05) was used to evaluate differences between variables and mean separation, respectively.
3. Results
3.1. Fermentation Kinetics
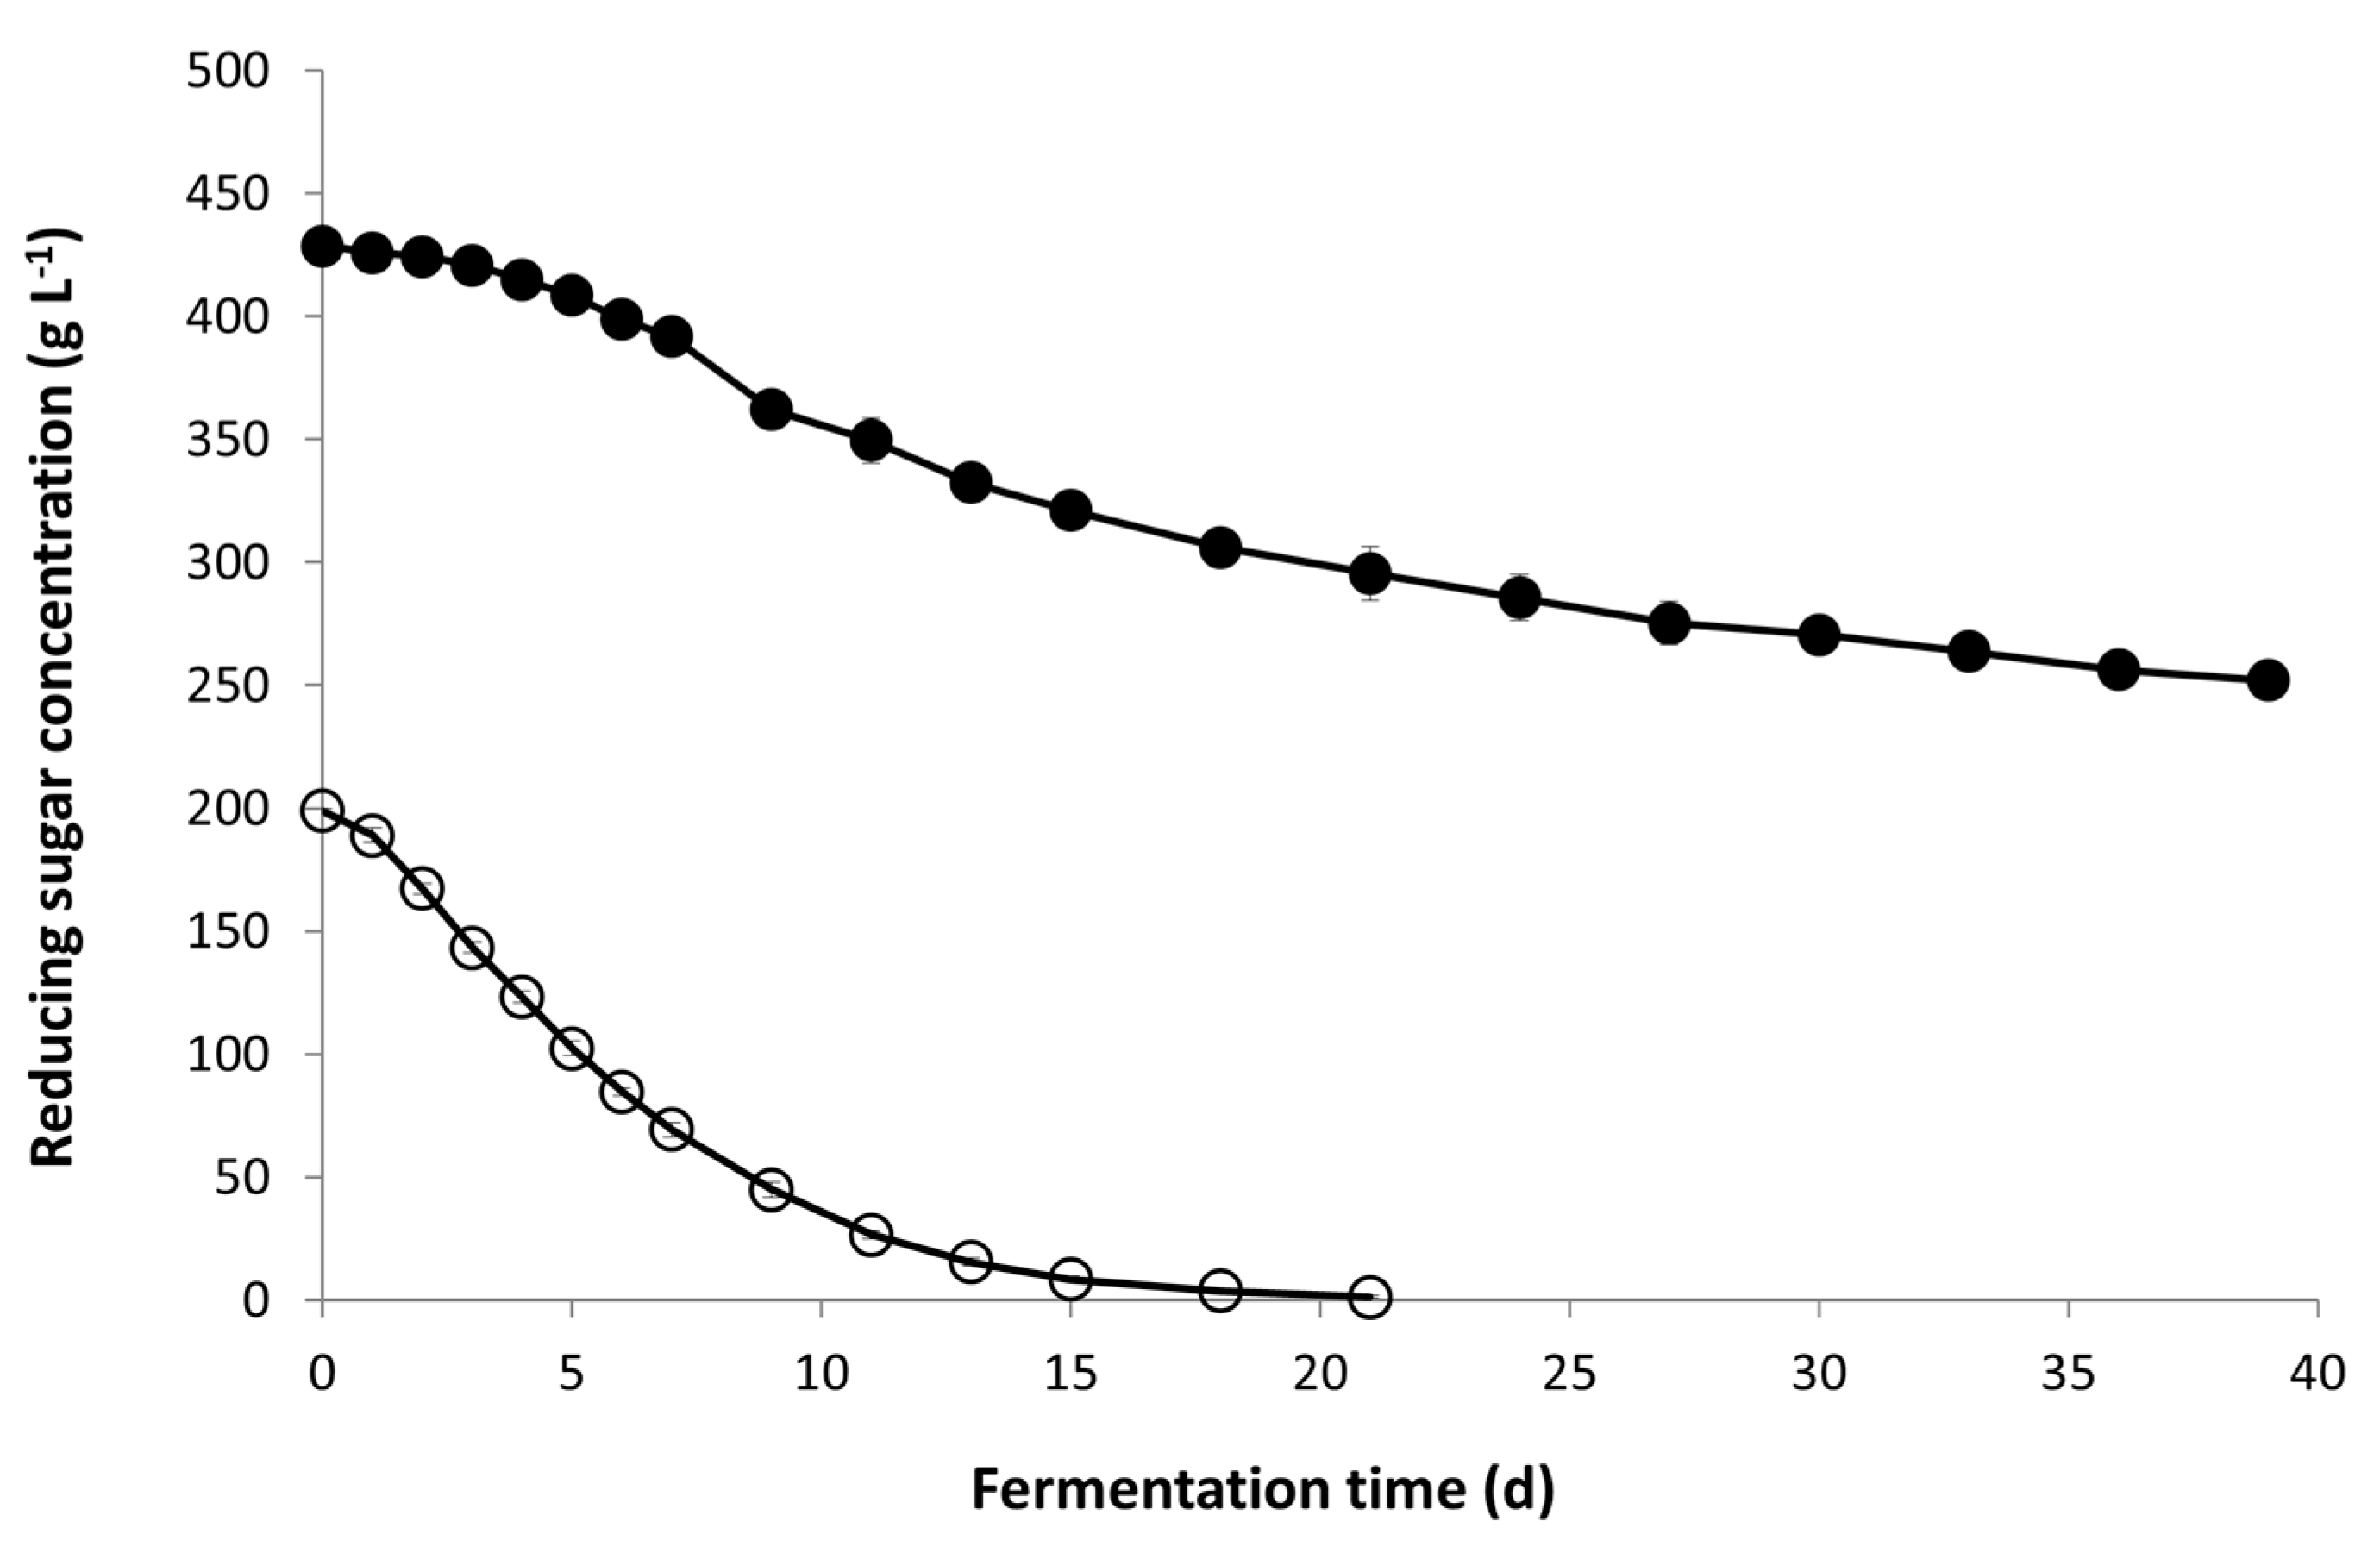
The composition of Icewine juice in comparison to the dilute juice indicates that the starting sugar concentration is over 400 g L−1 in the Icewine juice and concentrated in all other juice components including acidity, yeast assimilable nitrogen, glycerol, acetaldehyde, and acetic acid (Table 1). Yeast cells exposed to a greater level of hyperosmotic stress from fermentable sugars in the Icewine fermentation consumed sugar very slowly in the first week and stopped before half of the original sugar concentration was consumed on Day 39 (Figure 1). Conversely, in the diluted condition, yeast cells rapidly consumed sugar right after inoculation with only 1 g L−1 of sugar left in the final wine on Day 21 (Figure 1 and Table 2).
3.2. Yeast Metabolite Production
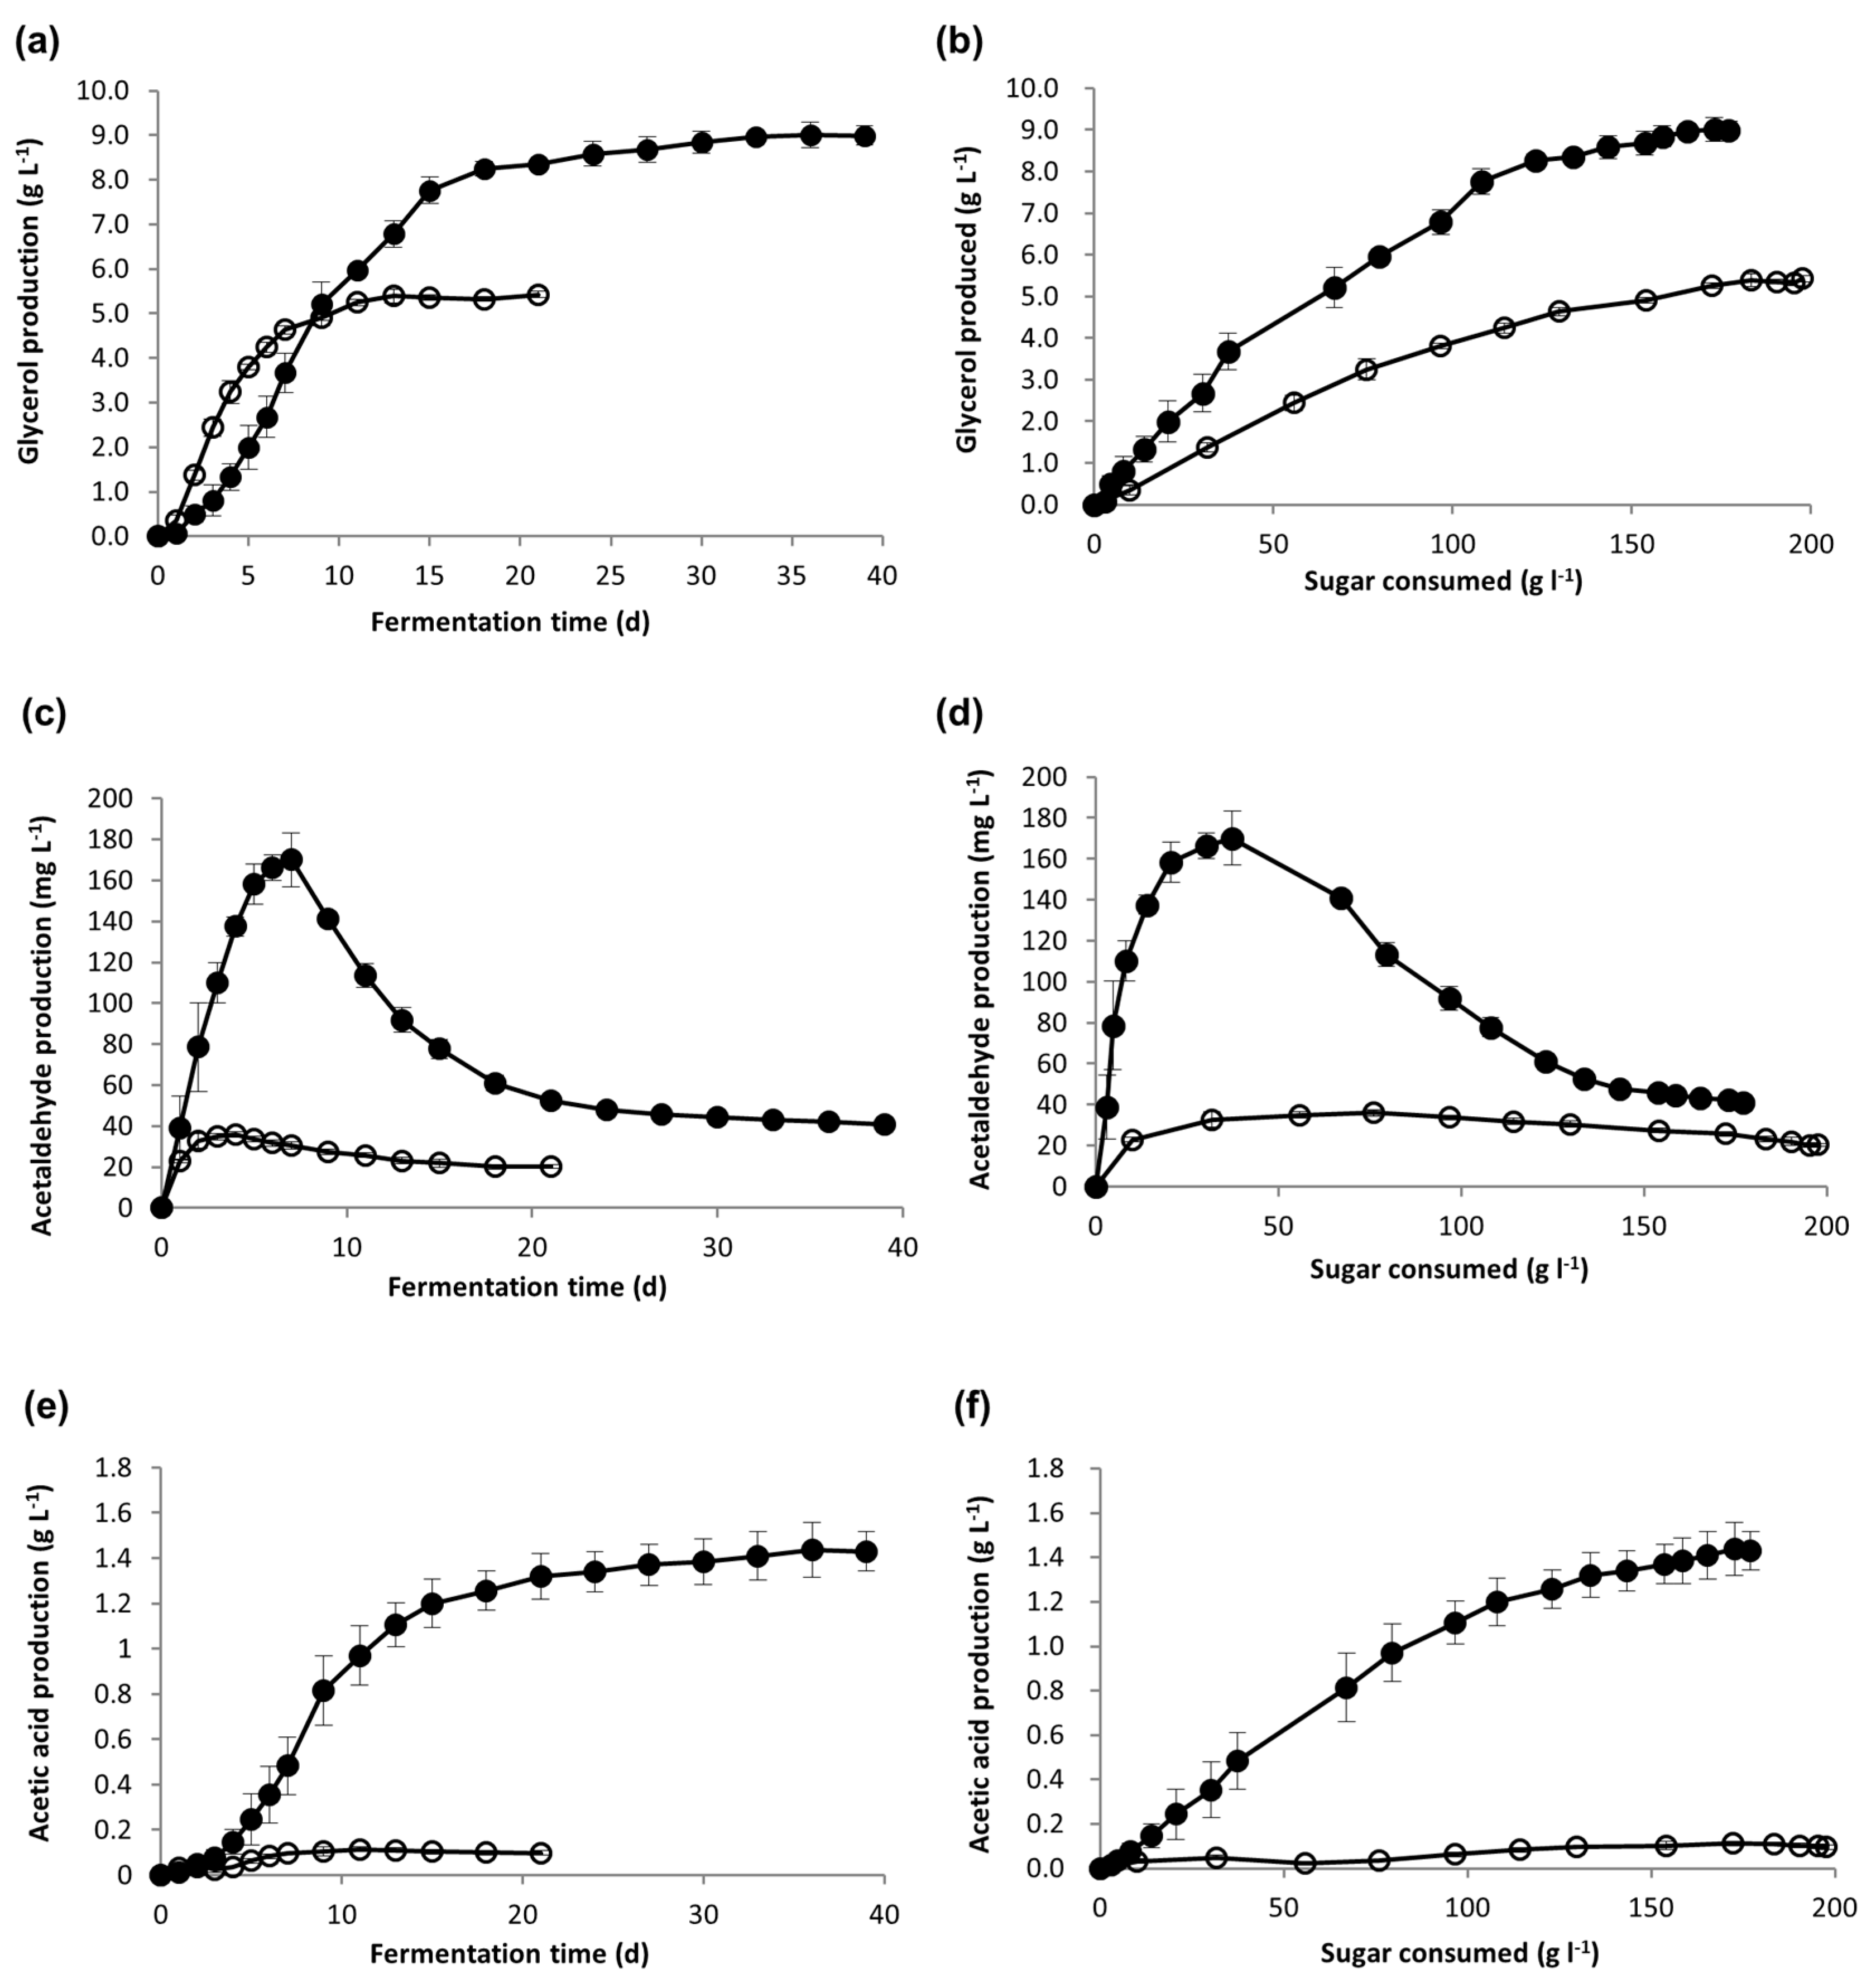
Metabolite production was monitored as a function of time (Figure 2a,c,e), but because yeast consumes sugar at different rates, these metabolites were also plotted as a function of sugar consumed (Figure 2b,d,f) for direct comparison between the two conditions. Yeast produced higher levels of glycerol and acetic acid during Icewine fermentation as a function of sugar consumed, showing a 1.9-fold increase in glycerol and 16.5-fold increase in acetic acid when normalized to sugar consumed (Table 3). The peak concentration of acetaldehyde production was 4.7-fold higher in the Icewine fermentation compared to the dilute fermentation, and then declined when acetaldehyde was consumed for the formation of either ethanol or acetic acid (Figure 2c,d).
3.3. Ratio of Coenzyme Concentration
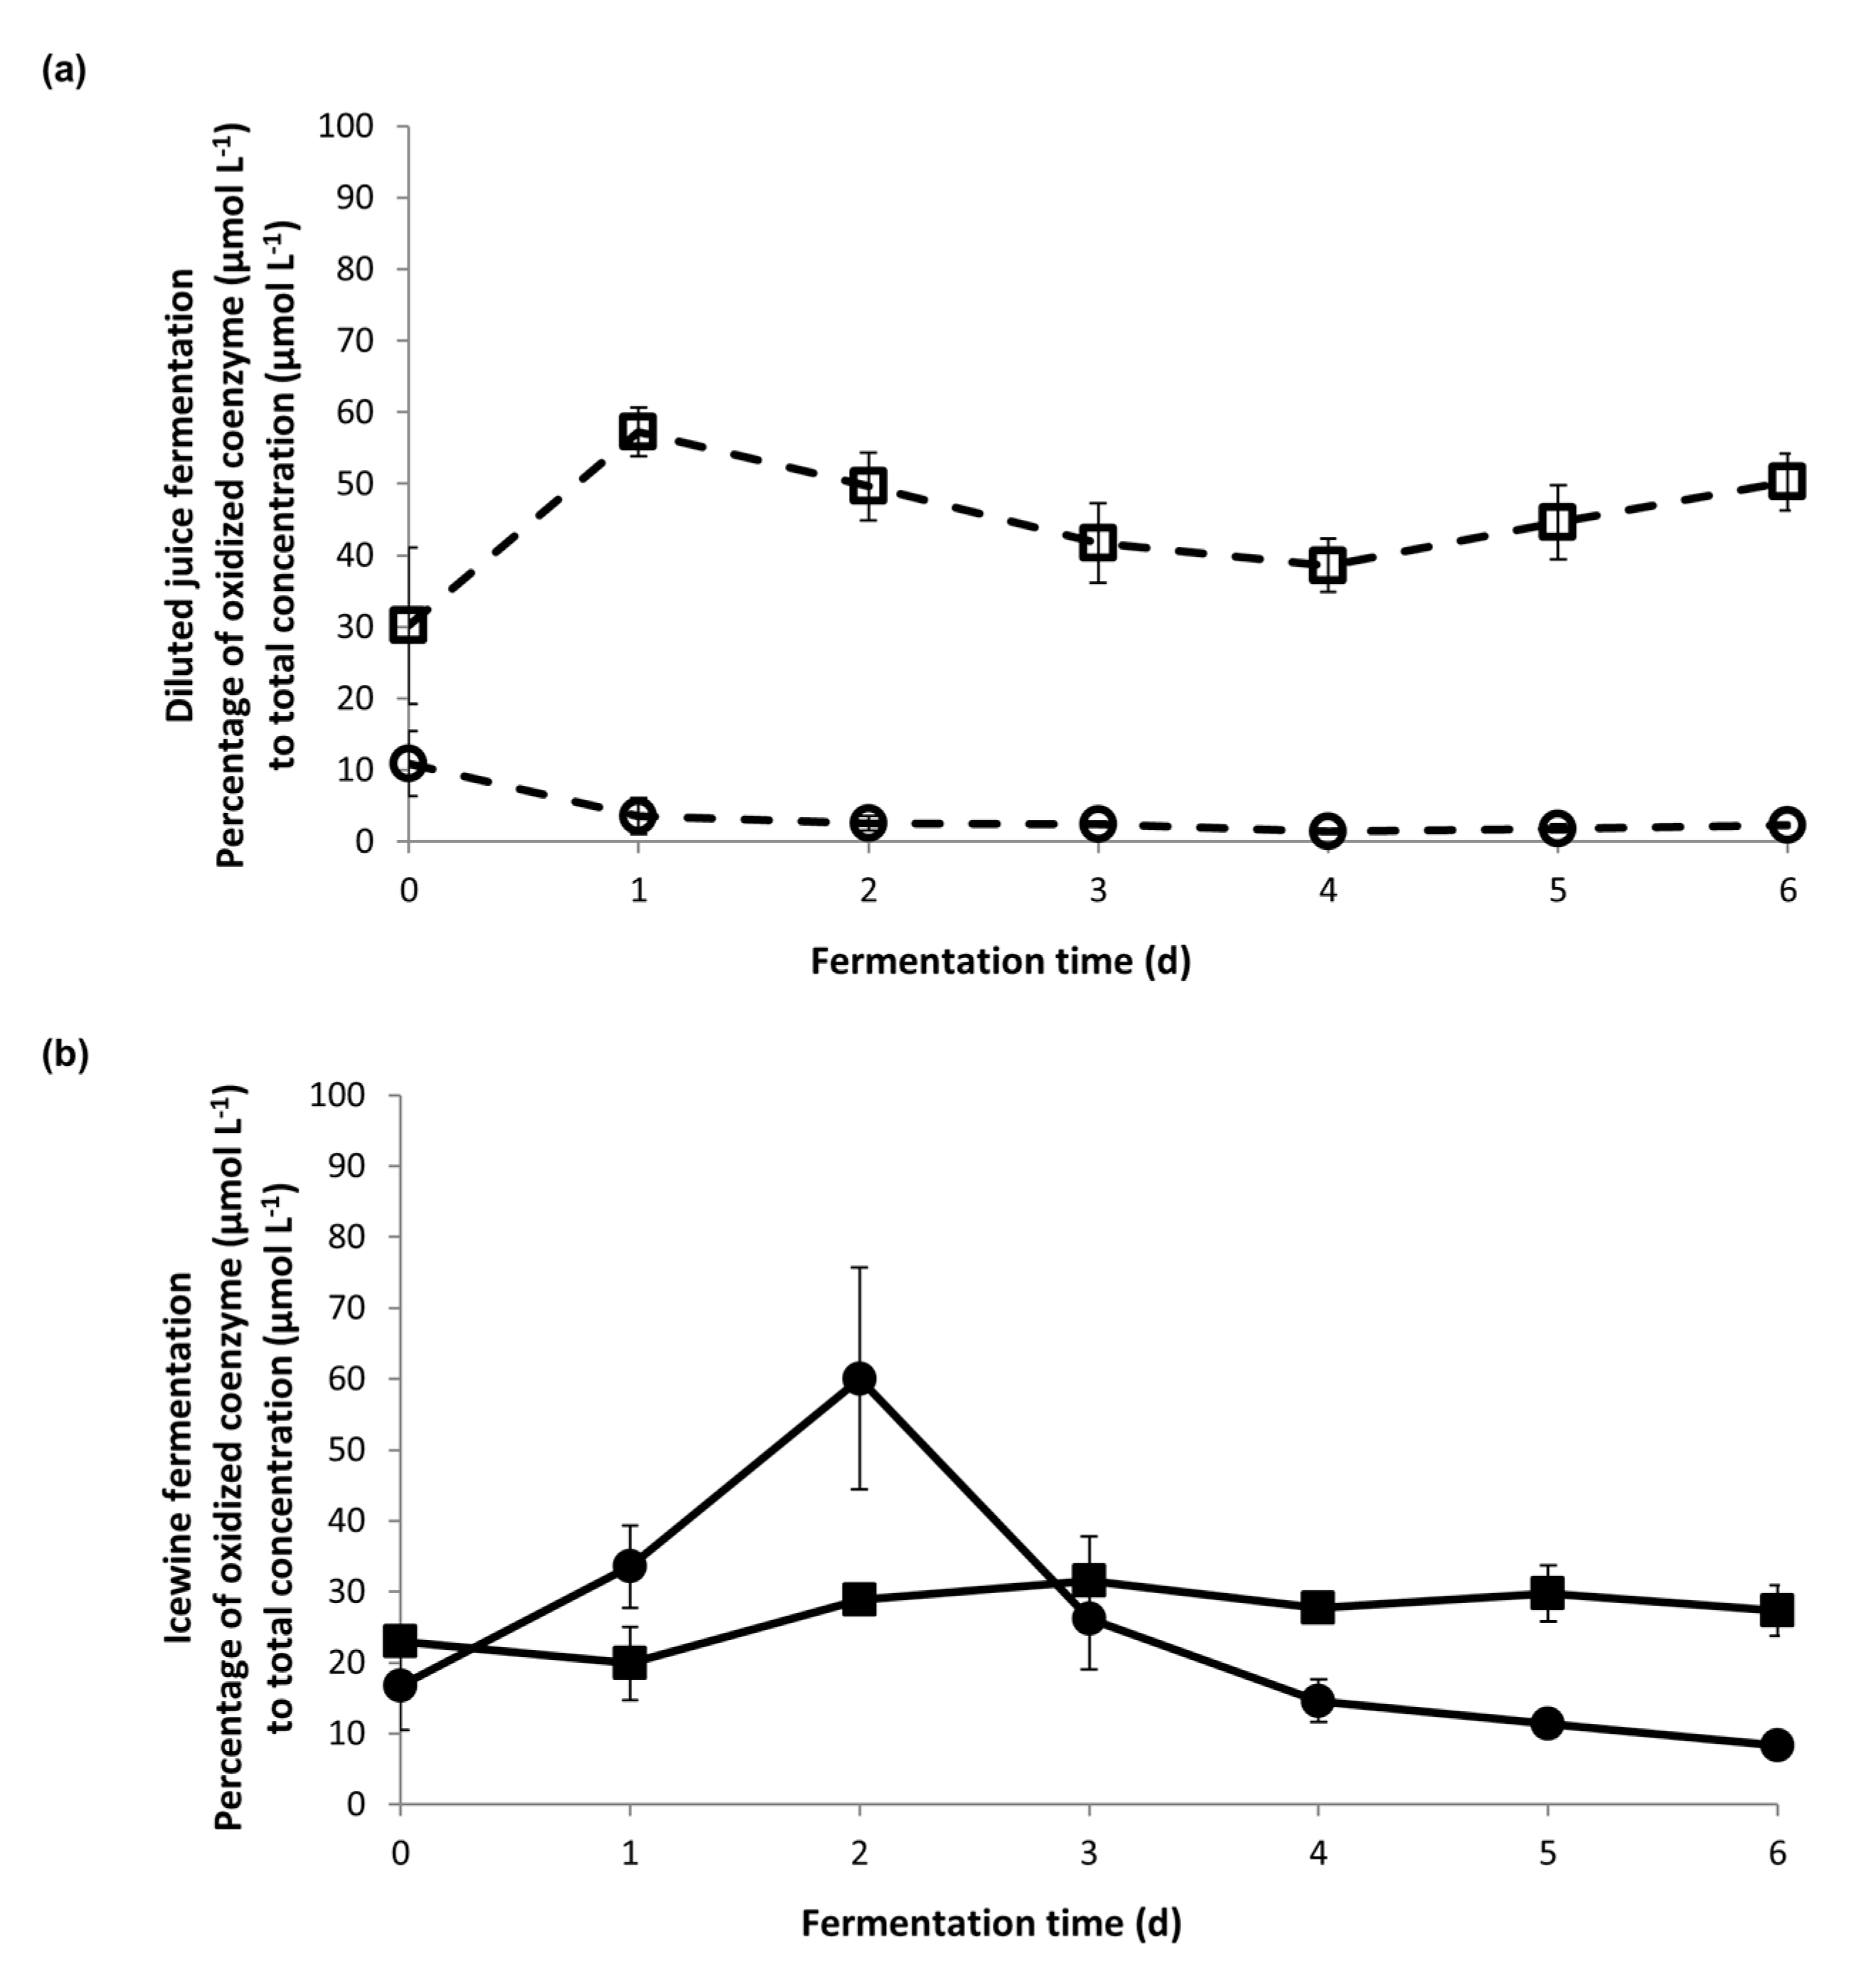
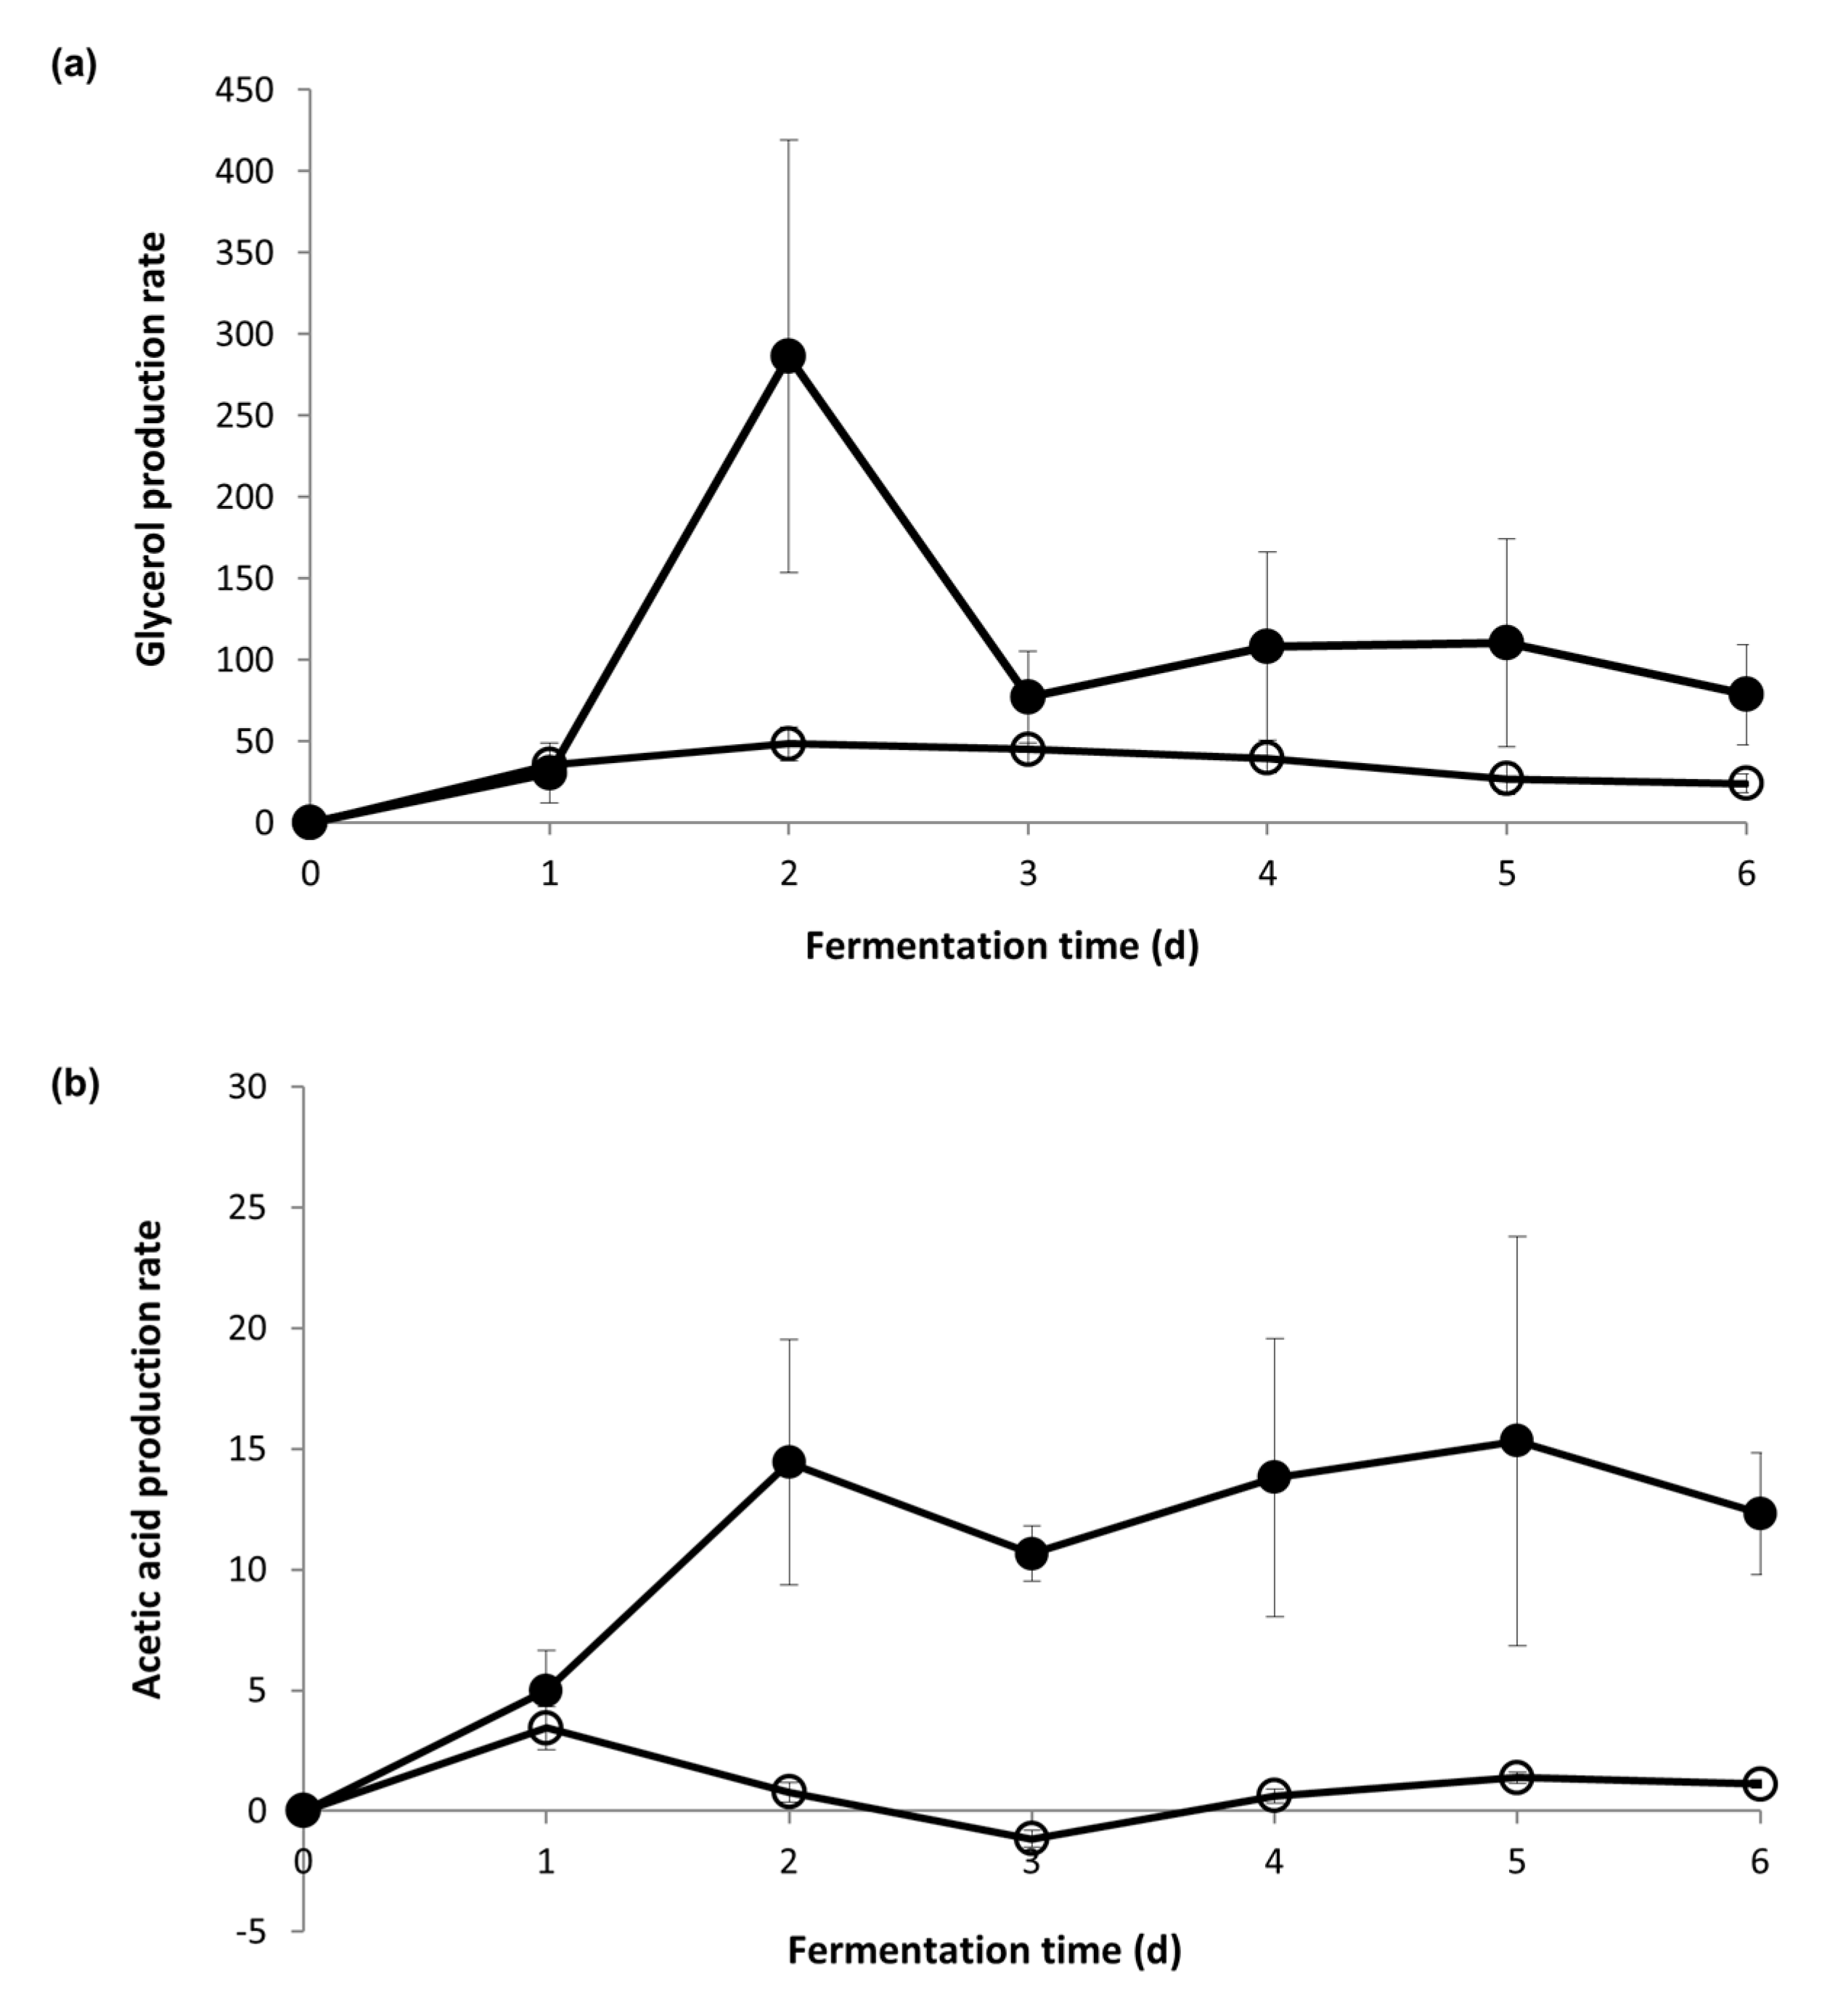
The cytosolic coenzymes from both the NAD(H) and NADP(H) systems were analyzed in the first week of fermentation, when yeast cells adapted to the hyperosmotic stress under the two different sugar concentrations. The percentage of the cofactors in their oxidized form were plotted against time (Figure 3). The percentages were then linked to the daily production rate of glycerol and acetic acid (Figure 4) to understand the correlation between redox status and metabolite production under hyperosmotic stress.
During the dilute fermentation, the percent of cytosolic NADP+, which ranged from 30.2–57.2% over the course of fermentation, was consistently higher than the percent of cytosolic NAD+, which was only 3.6% from Day 1 onward (Figure 3a). The percent of the cytosolic NADP+ was consistently lower in the Icewine condition (between 19.9–31.6%, Figure 3b) compared to the dilute juice condition (between 30.2–57.2%, Figure 3a), showing a 2.9-fold higher level in the dilute juice condition on Day 1. It appears that the cytosolic NADP+-dependent Ald6p has a larger contribution to the low acetic acid production in the dilute juice condition over NAD+-dependent forms of Aldp (Figure 4b).
However, a very different redox profile resulted during the Icewine fermentation (Figure 3b). During Icewine fermentation, the percent of cytosolic NAD+ increased over the first two days of fermentation, peaking on Day 2 at 60.1% and remaining much higher over the remainder of the fermentation (Figure 3b) in comparison to the dilute juice fermentation (Figure 3a), showing a 24-fold increase in the Icewine condition. This spike in NAD+ corresponded to the increased production rate of glycerol in the Icewine condition (Figure 4a) and the increased production rate of acetic acid (Figure 4b). The redox profile supports the hypothesis of cytosolic NAD+-dependent Aldp(s) contributing to the elevated acetic acid in Icewine fermentation along with the cytosolic NADP+-dependent Ald6p.
4. Discussion
Increased acetic acid production during high sugar fermentation in S. cerevisiae may be due to metabolic regulation driven by the redox status of the cell, substrate availability, or product usage, or due to the transcriptional regulation of genes altering enzyme concentrations involved in the synthesis or usage of acetic acid, or a combination of all these factors.
Past studies have linked acetic acid production during fermentation to either the NADP+ cofactor system [15] or the NAD+ cofactor system [11,12,13] based on ALD gene expression patterns encoding aldehyde dehydrogenases that have different cofactor requirements. We report here, for the first time, the cytosolic redox status of both cofactor systems during fermentation at two different sugar levels.
We have previously reported increased substrate availability for the aldehyde dehydrogenases during high sugar fermentations (acetaldehyde levels quickly rise during Icewine fermentation) [11,12,13], which was also found in this present study, along with increased expression of ALD3 encoding a cytosolic NAD+-dependent isoform over that found during dilute juice fermentation [11,12,13]. ALD3 was also the only ALD expression stimulated by acetaldehyde stress during fermentation [12]. We now report that the percent of oxidized cofactor NAD+ on Day 2 of fermentation was 24-fold higher in the Icewine condition versus the dilute juice condition and 2.1-fold higher than the percent of oxidized cofactor NADP+ on Day 2 of Icewine fermentation. Taken together, our results further confirm a role for NAD+-dependent Aldp isoforms along with NADP+-dependent Aldp isoforms in producing elevated levels of acetic acid during the high sugar fermentations of Icewine production.
In evaluating the cytosolic redox status of fermenting yeast at two different sugar levels (201 versus 433 g L−1 of sugar in our present study), the discrepancy in the literature in reporting the Aldp responsible for acetic acid production during fermentation may have been due to the starting sugar concentration in the media used for fermentation. Our data supports other published work where the NADP+-dependent isoform Ald6p was identified as the main aldehyde dehydrogenase responsible for acetic acid production when sugar concentrations were at or below 200 g L−1 sugar [15,19,20,21]. However, under high sugar conditions of 400 g L−1, Erasmus et al. linked acetic acid generation to NADPH production via Ald6p to compensate for the downregulation of genes in the pentose phosphate pathway [15], questioning the linkage of acetic acid production under osmotic stress to glycerol formation and NADH requirements. Based on the cytosolic redox status of yeast fermenting Icewine juice at 433 g L−1 sugar, as well as our previous ALD expression analysis during Icewine fermentation [11,12,13], it appears that both Ald6p and Ald3p contribute to acetic acid during Icewine fermentation. Our data supports a linkage of acetic acid production under the high osmotic stress of Icewine fermentation to NADH requirements and glycerol production.
We have also previously reported that elevated acetic acid levels appear due to lack of conversion to acetyl-CoA from the down-regulation in gene expression of cytosolic and mitochondrial acetyl-CoA synthetase [13]. This was further substantiated by 2-fold lower ethyl acetate levels in the Icewines (60 mg/L) compared to that found in the dilute juice fermentations (120 mg/L), whereby acetyl-CoA is required for the esterification to ethanol by alcohol acetyltransferases [13].
We have provided further evidence to support the concept that cytosolic NAD+-dependent aldehyde dehydrogenase(s) are responsible, in part, for increased levels of acetic acid during Icewine fermentation stimulated by substrate availability through an increase in NAD+ and acetaldehyde, whereas the NADP+-dependent isoform plays the dominate role in acetic acid production in table wine fermentation stimulated by an increase in NADP+. Although substrate availability [11,12,13], redox status, and gene expression [11,12,13] have been evaluated, enzyme activities for the aldehyde dehydrogenases and downstream acetyl CoA synthetases represent missing information that could further confirm the enzymes and cofactor system involved in the high acetic acid accumulation during high sugar fermentations such as that of Icewine.
Acknowledgments
This research was funded by grant #238872-2012 from the Natural Sciences and Engineering Research Council of Canada to Debra L. Inglis.
Author Contributions
Debra L. Inglis, Caitlin Heit, and Fei Yang conceived and designed the experiments; Fei Yang and Caitlin Heit performed the experiments, and Fei Yang along with Debra L. Inglis analyzed the data and wrote the paper.
Conflicts of Interest
The authors declare no conflict of interest.
References
- Bowen, A. Managing the quality of icewines. In Managing Wine Quality: Oenology and Wine Quality, 1st ed.; Reynolds, A.G., Ed.; Woodhead Publishing Ltd.: Cambridge, UK, 2010; pp. 523–552. [Google Scholar]
- O. Reg. 406/00: Rules of Vintners Quality Alliance Ontario Relating to Terms for VQA Wine. Available online: https://www.ontario.ca/laws/regulation/000406 (accessed on 14 November 2017).
- Ziraldo, D.; Kaiser, K. Science. In Icewine: Extreme Winemaking, 1st ed.; Key Porter Books: Toronto, ON, Canada, 2007; pp. 73–107. [Google Scholar]
- Kontkanen, D.; Inglis, D.; Pickering, G.; Reynolds, A. Effect of yeast inoculation rate, acclimatization, and nutrient addition on Icewine fermentation. Am. J. Enol. Vitic. 2004, 55, 363–370. [Google Scholar]
- Nurgel, C.; Pickering, G.J.; Inglis, D.L. Sensory and chemical characteristics of Canadian ice wines. J. Sci. Food Agric. 2004, 84, 1675–1684. [Google Scholar] [CrossRef]
- Cliff, M.A.; Pickering, G.J. Determination of odour detection thresholds for acetic acid and ethyl acetate in ice wine. J. Wine Res. 2006, 17, 45–52. [Google Scholar] [CrossRef]
- Lilly, M.; Lambrechts, M.G.; Pretorius, I.S. Effect of increased acetyltransferase activity on flavour profiles of wine and distillates. Appl. Environ. Microbiol. 2000, 66, 744–753. [Google Scholar] [CrossRef] [PubMed]
- Blomberg, A.; Adler, L. Roles of glycerol and glycerol-3-phosphate dehydrogenase (NAD+) in acquired osmotolerance of Saccharomyces cerevisiae. J. Bacteriol. 1989, 171, 1087–1092. [Google Scholar] [CrossRef] [PubMed]
- Lagunas, R.; Ganedo, J.M. Reduced pyridine nucleotide balance growing on Saccharomyces cerevisiae. Eur. J. Biochem. 1973, 37, 90–94. [Google Scholar] [CrossRef] [PubMed]
- Van Dijken, J.; Scheffers, W. Redox balances in the metabolism of sugars by yeasts. FEMS Microbiol. Rev. 1986, 32, 199–224. [Google Scholar] [CrossRef]
- Pigeau, G.M.; Inglis, D.L. Upregulation of ALD3 and GPD1 in Saccharomyces cerevisiae during Icewine fermentation. J. Appl. Microbiol. 2005, 99, 112–125. [Google Scholar] [CrossRef] [PubMed]
- Pigeau, G.M.; Inglis, D.L. Response of wine yeast (Saccharomyces cerevisiae) aldehyde dehydrogenases to acetaldehyde stress during Icewine fermentation. J. Appl. Microbiol. 2007, 103, 1576–1586. [Google Scholar] [CrossRef] [PubMed]
- Heit, C.; Martin, S.J.; Yang, F.; Inglis, D.L. Osmoadaptation of wine yeast (Saccharomyces cerevisiae) to hyperosmotic stress during Icewine fermentation. J. Appl. Microbiol. 2017. under review. [Google Scholar]
- Pronk, J.T.; Steensma, H.Y.; van Dijken, J.P. Pyruvate metabolism in Saccharomyces cerevisiae. Yeast 1996, 12, 1607–1633. [Google Scholar] [CrossRef]
- Erasmus, D.J.; van Vuuren, H.J.J. Genetic basis for osmosensitivity and genetic instability of the wine yeast Saccharomyces cerevisiae V1N7. Am. J. Enol. Vitic. 2009, 60, 145–154. [Google Scholar]
- Navarro-Avino, J.P.; Prasad, R.; Miralles, V.J.; Benito, R.M.; Serreno, R. A proposal of nomenclature of aldehyde dehydrogenases in Saccharomyces cerevisiae and characterization of the stress-inducible ALD2 and ALD3 genes. Yeast 1999, 15, 829–842. [Google Scholar] [CrossRef]
- Meaden, P.G.; Dickinson, F.M.; Mifsud, A.; Tessier, W.; Westwater, J.; Bussey, H.; Midgley, M. The ALD6 gene of Saccharomyces cerevisiae encodes a cytosolic, Mg2+-activated acetaldehyde dehydrogenase. Yeast 1997, 13, 1319–1327. [Google Scholar] [CrossRef]
- White, H.W.; Skatrud, P.L.; Xue, Z.; Toyn, J.H. Specialization of function among aldehyde dehydrogenases: The ALD2 and ALD3 genes are required for B-alanine biosynthesis in S. cerevisiae. Genetics 2003, 163, 69–77. [Google Scholar] [PubMed]
- Eglinton, J.M.; Heinrich, A.J.; Pollnitz, A.P.; Langridge, P.; Henschke, P.A.; de Barros Lopes, M. Decreasing acetic acid accumulation by a glycerol overproducing strain of Saccharomyces cerevisiae by deleting the ALD6 aldehyde dehydrogenase gene. Yeast 2002, 19, 295–301. [Google Scholar] [CrossRef] [PubMed]
- Luo, Z.; Walkey, C.; Madilao, L.; Measday, V.; Van Vuuren, H. Functional improvement of Saccharomyces cerevisiae to reduce volatile acidity in wine. FEMS Yeast Res. 2013, 13, 485–494. [Google Scholar] [CrossRef] [PubMed]
- Noti, O.; Vaudano, E.; Pessione, E.; Garcia-Moruno, E. Short-term response of different Saccharomyces cerevisiae strains to hyperosmotic stress caused by inoculation in grape must: RT-qPCR study and metabolite analysis. Food Microbiol. 2015, 52, 49–58. [Google Scholar] [CrossRef] [PubMed]
- Saint-Prix, F.; Bönquist, L.; Dequin, S. Functional analysis of the ALD gene family of Saccharomyces cerevisiae during anaerobic growth on glucose: The NADP+-dependent Ald6p and Ald5p isoforms play a major role in acetate formation. Microbiology 2004, 150, 2209–2220. [Google Scholar] [CrossRef] [PubMed]
- Remize, F.; Andrieu, E.; Dequin, S. Engineering of the pyruvate dehydrogenase bypass in Saccharomyces cerevisiae: Role of the cytosolic Mg2+ and mitochondrial K+ acetaldehyde dehydrogenases Ald6p and Ald4p in acetate formation during alcoholic fermentation. Appl. Environ. Microbiol. 2000, 66, 3151–3159. [Google Scholar] [CrossRef] [PubMed]
- Akamatsu, S.; Kamiya, H.; Yamashita, N.; Motoyoshi, T.; Goto-Yamamoto, N.; Ishikawa, T.; Okazaki, N.; Nishimura, A. Effects of aldehyde dehydrogenase and acetyl-CoA synthetase on acetate formation in sake mash. J. Biosci. Bioeng. 2000, 90, 555–560. [Google Scholar] [CrossRef]
- Forster, J.; Famili, I.; Fu, P.; Palsson, B.O.; Nielsen, J. Genome-scale reconstruction of Saccharomyces cerevisiae metabolic network. Genome Res. 2003, 13, 244–253. [Google Scholar] [CrossRef] [PubMed]
- Bruinenberg, P.M. The NADP(H) redox couple in yeast metabolism. Antonie Van Leeuwenhoek 1986, 52, 411–429. [Google Scholar] [CrossRef] [PubMed]
- Quirós, M.; Martínez-Moreno, R.; Albiol, J.; Morales, P.; Vázquez-Lima, F.; Barreiro-Vázquez, A.; Ferrer, P.; Gonzalez, R. Metabolic flux analysis during the exponential growth phase of Saccharomyces cerevisiae in wine fermentations. PLoS ONE 2013, 8, e71909. [Google Scholar] [CrossRef]
- Villadsen, J.; Nielsen, J.; Lidén, G. Chemicals from metabolic pathways. In Bioreaction Engineering Principles, 3rd ed.; Springer: New York, NY, USA, 2011; pp. 7–62. [Google Scholar]
- Nissen, T.L.; Schulze, U.; Nielsen, J.; Villadsen, J. Flux distributions in anaerobic, glucose-limited continuous cultures of Saccharomyces cerevisiae. Microbiology 1997, 143, 203–218. [Google Scholar] [CrossRef] [PubMed]
- Varela, C.; Pizarro, F.; Agosin, E. Biomass content governs fermentation rate in nitrogen-deficient wine musts. Appl. Environ. Microbiol. 2004, 70, 3392–3400. [Google Scholar] [CrossRef] [PubMed]
- Zoecklein, B.W.; Fugelsang, K.C.; Gump, B.H. Laboratory Procedures. In Wine Analysis and Production, 1st ed.; Chapman and Hall, International Thomson Publishing: New York, NY, USA, 1995; pp. 374–378. [Google Scholar]
Figure 1.
Sugar concentration during fermentation. Fermentations of Icewine juice (●) and diluted juice (○) were inoculated with K1-V1116 and monitored for sugar concentration throughout fermentation. Fermentations were performed in triplicate and samples from each trial were tested in duplicate. Sugar values represent the average ± standard deviation.

Figure 2.
Metabolite production during fermentation. Fermentations of Icewine juice (●) and diluted juice (○) were analyzed for the production of (a) glycerol, (c) acetaldehyde, and (e) acetic acid, and the generation of metabolites were also plotted out as a function of sugar consumed for (b) glycerol, (d) acetaldehyde, and (f) acetic acid. Fermentations were performed in triplicate and samples from each trial were tested in duplicate. Metabolite values represent the average ± standard deviation.

Figure 3.
Percentage of NAD+ and NADP+ in the first week of fermentation. (a) The percentage of NAD+ to total NAD(H) (○) was compared to the percentage of NADP+ to total NADP(H) (□) in diluted fermentation; (b) the percentage of NAD+ to total NAD(H) (●) was compared to the percentage of NADP+ to total NADP(H) (■) in Icewine fermentation. Fermentations were performed in triplicate and samples from each trial were tested in duplicate. Data points represent the average ± standard deviation.

Figure 4.
Metabolite production rate during fermentation. The daily metabolite production rate of (a) glycerol and (b) acetic acid was calculated during the first week of Icewine juice fermentation (●) and diluted juice fermentation (○). Fermentations were performed in triplicate and samples from each trial were tested in duplicate. Metabolite values represent the average ± standard deviation.


Table 1.
Vidal Icewine juice and diluted juice initial parameters (mean ± SD).
| Parameter | Icewine Juice | Diluted Juice |
|---|---|---|
| Glucose + fructose (g L−1) | 433 ± 5 | 201 ± 1 |
| Titratable acidity (g L−1) | 6.4 ± 0.0 | 3.1 ± 0.0 |
| pH | 3.76 ± 0.01 | 3.88 ± 0.01 |
| Free amino nitrogen (mg N L−1) | 238.4 ± 2.4 | 114.8 ± 3.0 |
| Ammonia nitrogen (mg N L−1) | 14.8 ± 0.1 | 6.6 ± 0.8 |
| Glycerol (g L−1) | 8.76 ± 0.06 | 4.04 ± 0 |
| Acetaldehyde (mg L−1) | 5.3 ± 0.8 | 2.7 ± 0.2 |
| Acetic acid (g L−1) | 0.04 ± 0 | 0.02 ± 0 |
| Ethanol (% v/v) | 1.3 ± 0 | 0.6 ± 0 |
Table 2.
Final wine parameters in Icewine and diluted juice fermentation (mean ± SD).
| Parameter | Icewine Juice Fermentation | Diluted Juice Fermentation |
|---|---|---|
| Glucose + fructose (g L−1) | 252 ± 3 | 1 ± 1 |
| Titratable acidity (g L−1) | 8.3 ± 0.2 | 5.5 ± 0.1 |
| pH | 3.92 ± 0.01 | 3.63 ± 0.02 |
| Free amino nitrogen (mg N L−1) | 188.5 ± 1.4 | 7.4 ± 0.4 |
| Ammonia nitrogen (mg N L−1) | 3.5 ± 0.1 | † ND |
| Glycerol (g L−1) | 17.44 ± 0.19 | 9.43 ± 0.06 |
| Acetaldehyde (mg L−1) | 48.5 ± 0.8 | 23.0 ± 0.8 |
| Acetic acid (g L−1) | 1.48 ± 0.10 | 0.12 ± 0.01 |
| Ethanol (% v/v) | 12.0 ± 0.2 | 13.9 ± 0.1 |
† ND indicates that no concentration was detected.
Table 3.
Normalized metabolite production by yeast measured at the end of fermentation (mean ± SD).
| Fermentation | Glycerol (mg g−1 of Sugar Consumed) * | Acetaldehyde (mg g−1 of Sugar Consumed) * | Ethanol (g g−1 of Sugar Consumed) * | Acetic Acid (mg g−1 of Sugar Consumed) * |
|---|---|---|---|---|
| Diluted juice | 27.44 ± 0.30 | 0.23 ± 0.01 | 0.53 ± 0 | 0.49 ± 0.06 |
| Icewine Juice | 50.92 ± 0.74 | 0.10 ± 0 | 0.47 ± 0 | 8.10 ± 0.50 |
* Significantly different as determined by Fisher’s Least Significant Difference test (p < 0.05).
© 2017 by the authors. Licensee MDPI, Basel, Switzerland. This article is an open access article distributed under the terms and conditions of the Creative Commons Attribution (CC BY) license (http://creativecommons.org/licenses/by/4.0/).
Share and Cite
MDPI and ACS Style
Yang, F.; Heit, C.; Inglis, D.L. Cytosolic Redox Status of Wine Yeast (Saccharomyces Cerevisiae) under Hyperosmotic Stress during Icewine Fermentation. Fermentation 2017, 3, 61. https://doi.org/10.3390/fermentation3040061
AMA Style
Yang F, Heit C, Inglis DL. Cytosolic Redox Status of Wine Yeast (Saccharomyces Cerevisiae) under Hyperosmotic Stress during Icewine Fermentation. Fermentation. 2017; 3(4):61. https://doi.org/10.3390/fermentation3040061
Chicago/Turabian StyleYang, Fei, Caitlin Heit, and Debra L. Inglis. 2017. "Cytosolic Redox Status of Wine Yeast (Saccharomyces Cerevisiae) under Hyperosmotic Stress during Icewine Fermentation" Fermentation 3, no. 4: 61. https://doi.org/10.3390/fermentation3040061
Note that from the first issue of 2016, this journal uses article numbers instead of page numbers. See further details here.