Novel Wine Yeast for Improved Utilisation of Proline during Fermentation


1
School of Public Health, Lanzhou University, 199 Donggang West Rd, Lanzhou 730000, China
2
School of Agriculture, Food and Wine, The University of Adelaide, PMB 1, Glen Osmond, SA 5064, Australia
*
Author to whom correspondence should be addressed.
Fermentation 2018, 4(1), 10; https://doi.org/10.3390/fermentation4010010
Submission received: 24 December 2017
/
Revised: 30 January 2018
/
Accepted: 2 February 2018
/
Published: 6 February 2018
(This article belongs to the Special Issue Yeast Biotechnology 2.0)
Abstract
:Proline is the predominant amino acid in grape juice, but it is poorly assimilated by wine yeast under the anaerobic conditions typical of most fermentations. Exploiting the abundance of this naturally occurring nitrogen source to overcome the need for nitrogen supplementation and/or the risk of stuck or sluggish fermentations would be most beneficial. This study describes the isolation and evaluation of a novel wine yeast isolate, Q7, obtained through ethyl methanesulfonate (EMS) mutagenesis. The utilisation of proline by the EMS isolate was markedly higher than by the QA23 wild type strain, with approximately 700 and 300 mg/L more consumed under aerobic and self-anaerobic fermentation conditions, respectively, in the presence of preferred nitrogen sources. Higher intracellular proline contents in the wild type strain implied a lesser rate of proline catabolism or incorporation by this strain, but with higher cell viability after freezing treatment. The expression of key genes (PUT1, PUT2, PUT3, PUT4, GAP1 and URE2) involved in proline degradation, transport and repression were compared between the parent strain and the isolate, revealing key differences. The application of these strains for efficient conduct for nitrogen-limited fermentations is a possibility.
1. Introduction
Amino acids, ammonium, peptides and proteins represent the main forms of nitrogen present in grape must. The relative abundance of each class of nitrogen-containing compound has been found to vary considerably according to grape variety, vintage, region, the extent of berry development/maturation or even the clarification time [1,2,3,4]. The nitrogen-containing compounds utilised by yeast during wine fermentation are referred to as yeast assimilable nitrogen (YAN), with amino acids and ammonium contributing between 60% and 90% of YAN [2]. When available, yeast will typically utilise up to 400 mg N/L, i.e., their “maximum requirement” [5]. At lower YAN levels, which become exhausted some time during fermentation, the risk of excessive hydrogen sulfide production increases [6] and the fermentation may slow, whereas below the minimum requirement of 120 to 140 mg N/L, fermentation does not finish [2,5,7,8,9,10].
The incidence of stuck or sluggish fermentations due to nitrogen deficiencies is of great concern to winemakers around the world. To avoid such problems, winemakers often employ supplementation strategies, e.g., the addition of diammonium phosphate prior to or during fermentation or the use of YAN-rich rehydration additives. However, this practice can also influence yeast metabolism and therefore impact wine quality; for example due to the accumulation of ethyl carbamate, a known carcinogen [11,12] or changes to wine aroma profile [13].
In some grapes, proline is typically the most abundant amino acid and represents a potentially significant source of nitrogen. Proline accumulation in the berry begins just after veraison [14], with concentrations up to 3800 mg/L reported for grape juice from different varieties [15]. The winemaking yeast Saccharomyces cerevisiae has been shown to be capable of metabolizing proline when present as the sole nitrogen source [16]. However, proline is not considered to be an assimilable nitrogen source under typical winemaking conditions. In the presence of preferred nitrogen sources, the Put4p proline-specific transporter is repressed and inactivated and so proline uptake is largely prevented [17]; however, once these nitrogen sources have been exhausted, its uptake is possible, but oxygen is no longer present (i.e., fermentations have become anaerobic), so catalysis by proline oxidase cannot occur [16,18,19]. As well as being a nutrient, accumulated proline can also act as an osmo- and cryo-protectant, with an improved ethanol stress-protective effect [19,20]. Greater utilisation of proline by winemaking yeast could alleviate the need for nitrogen supplementation, enhance microbial stability by removing this potential nutrient for spoilage organisms and thus, help reduce production costs and secure wine quality. Previous attempts to enhance proline utilisation include mutagenesis of yeast or the addition of oxygen to fermentations [21,22,23,24,25].
This study describes the use of ethyl methanesulfonate (EMS) random mutagenesis to develop novel wine yeast with an improved capacity to utilize proline. Such a strain was sought as a means of overcoming nutrient-related fermentation problems, thereby improving fermentation reliability and overall wine quality.
2. Materials and Methods
2.1. Yeast Strains and EMS Mutagenesis
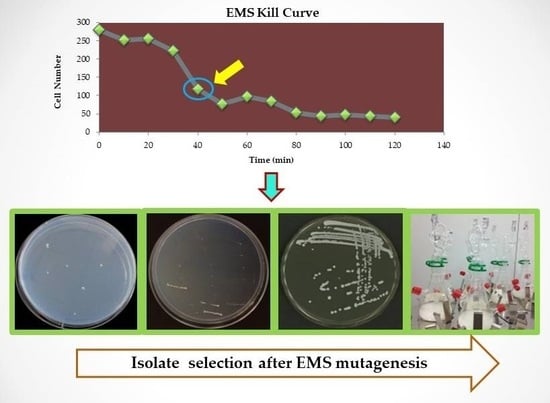
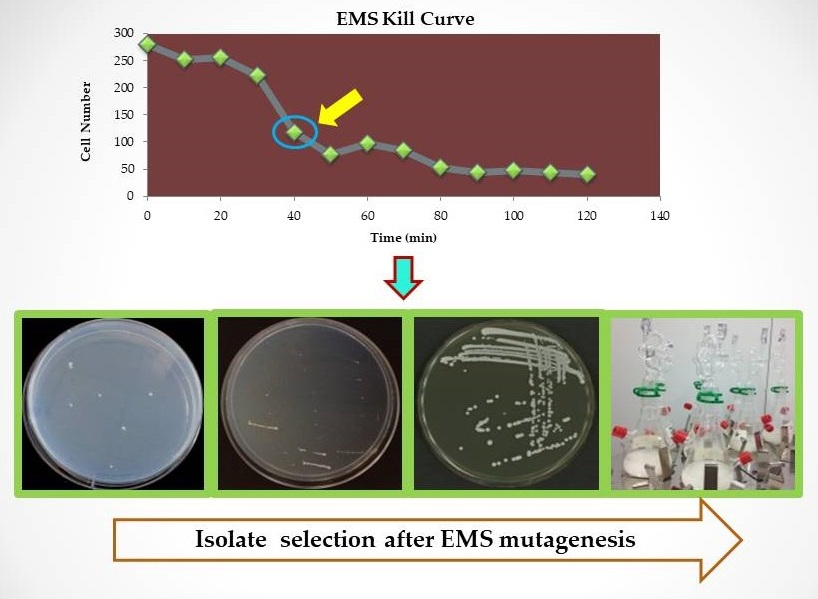
A common commercial Saccharomyces cerevisiae strain (QA23) was obtained from Lallemand (Blagnac, France) as an agar slope stock culture and subjected to EMS mutagenesis [26]. Briefly, QA23 was cultured overnight in 100 mL of yeast extract peptone dextrose (YEPD) nutrient medium (containing 20 g/L d-glucose, 10 g/L yeast extract and 20 g/L Bacto peptone) at 28 °C with shaking at 120 rpm. Aliquots of 50 mL were washed (twice) with 0.1 M sodium phosphate buffer (pH 7) and cells re-suspended in 15 mL of the same for microscopic determination of cell number. A sub-sample (1 mL) was retained as a blank and the remaining sample (14 mL) exposed to 45 μL/mL of EMS (Sigma Aldrich, St. Louis, MO, USA). Aliquots (1 mL) were collected every 10 min (for 2 h) and plated on YEPD plates (after appropriate serial dilution). The reminder of the sample from each time point (~2 mL) was kept in glycerol and stored at −80 °C. Colony counts were performed to determine viability at each time point; with approximately 42% survival observed after 40 min of exposure to EMS treatment. Sporulation of strains, when required, was performed using standard protocols [27].
2.2. Selection of Isolates
EMS-treated samples (collected at t = 40 min) were spread onto YEPD medium and cultured overnight at 28 °C yielding approximately 10,000 colonies. The colonies were transferred to a yeast nitrogen base (YNB) agar selection medium containing 4.8 g/L methylamine (Sigma Aldrich, St. Louis, MO, USA) and 2.5 g/L proline [28] with a sterilised velvet pad, and cultured for 24 h according to methodology described previously [29]. The ammonium analogue, methylamine, elicits Nitrogen Catabolite Repression [30] but cannot serve as a nitrogen source, thus only colonies derepressed for proline utilisation will grow on the selective medium. Ninety three such colonies were observed after 2 days, checked by re-streaking individually onto YNB selection media and incubated as before. This resulted in the isolation of 8 putative mutant strains that exhibited growth. Proline utilisation by the isolates during fermentation was tested in CDGJM [2], containing 50 g/L of sugar and 500 mg/L proline. Proline consumption was determined according to the isatin method [31] and isolates found to consume significantly more proline than the wild type strain were chosen for further study.
2.3. Influence of N Source on Growth of QA23 and EMS Isolate Q7
The growth of wild type strain QA23 and EMS isolate Q7, in the presence of ammonium ions or proline was investigated. YNB medium plates (as above) with either 2.5 g/L ammonium or proline added, each with or without 4.8 g/L methylamine as a non-metabolisable repressor were used to investigate strain growth. Starter cultures of QA23 and Q7 were prepared from single colonies of each cultured in 25 mL of YEPD broth at 28 °C until the desired cell number (2 × 10⁷ cells/mL) was achieved. A dilution series (5× ten-fold dilutions) of the cultures was spotted onto each plate (10 μL), and incubated at 28 °C. Plates were photographed after 3 days.
2.4. Yeast Performance during Fermentation
Small-scale fermentations (100 mL) were conducted in both CDGJM and Chenin Blanc grape juice to investigate yeast performance. The CDGJM contained 450 mg N/L, comprising 50 mg N/L of YAN (nitrogen components of CDGJM) and 3.3 g/L of proline (400 mg N/L). Chenin Blanc juice was prepared from grapes harvested in 2012 (Adelaide Hills, Adelaide, Australia). The juice initially contained 105 g/L of sugar, 40 mg/L of proline and 102 mg/L YAN, before the juice was adjusted to 200 g/L of sugar and an added 1.5 g/L proline. The media were sterilised (0.22 μm filtration) before use. Starter cultures were prepared in the appropriate medium diluted 50% with sterile water and incubated overnight at 28 °C with shaking (120 rpm).
Triplicate fermentations were carried out under both aerobic and self-anaerobic conditions, at 28 °C with shaking (120 rpm). Samples were collected at regular intervals to determine fermentation progress and proline utilisation. Culture density was monitored at 600 nm with a TECAN Infinite 200® PRO microplate reader (Männedorf, Switzerland). Sugar consumption was monitored with an ATAGO hand-held refractometer (Tokyo, Japan) until approx. 6° Brix before enzymatic determination [32]. Proline content was determined as above.
2.5. Extraction of Intracellular Proline from Yeast Cells
In order to investigate whether proline was metabolised or just accumulated by yeast cells, proline was extracted from the cytosolic and vacuolar compartments of cells after (i) 24 h in starter culture (i.e., prior to fermentation), (ii) 24 h of fermentation in CDGJM, (iii) mid-fermentation (i.e., sugar ≈ 100 g/L) and (iv) post-fermentation (i.e., sugar content < 2.5 g/L). Cells (approx. 3 × 10⁸) were harvested at each time point, twice washed with sterile de-ionised water, then re-suspended in 1.5 mL of 2.5 mM potassium phosphate buffer (pH 6.0) containing 0.6 M sorbitol, 10 mM glucose and 0.2 mM CuCl2, and incubated for 15 min at 30 °C. Aliquots (1 mL) of each cell suspension were washed twice (12,000 rpm, 3 min) with 0.5 mL of the buffer solution (as above but without glucose). The combined 2 mL supernatants gave the cytosolic extract while the remaining cells were suspended in 3 mL of de-ionised water, boiled for 15 min, the resulting supernatant afforded the vacuolar extract after 5 min centrifugation (5000 rpm) [33,34].
Culture samples were collected following 24 h growth in each of YEPD, starter and CDGJM (as described above), and cell numbers quantified before determination of dry cell weight. In each case, 3 × 10⁸ cells were collected on a pre-weighed Whatman GF/C glass fibre filter, washed with an equal volume of sterile de-ionised water, dried and reweighed.
2.6. Freeze Tolerance Tests
To further confirm whether proline was accumulated by yeast cells or not, freeze tolerance tests were performed. After 24 h of fermentation, the viability of the different strains was similar (close to 100%), thus the potential benefit of strains with altered intracellular proline content was estimated via a freeze-thaw test. Approximately 1 × 10⁸ cells were diluted in 1 mL of CDGJM. Approximately 1 × 10⁷ cells (0.1 mL) were transferred to a 1.7 mL microfuge tube and stored at −20 °C or −80 °C. After 3 days, samples were thawed at room temperature, diluted with 0.9 mL 0.9% (w/v) NaCl solution, and dilutions spread onto YEPD agar plates (28 °C, 24 h) to determine residual viability [19].
2.7. Real-Time Quantitative PCR
The primers used for real-time quantitative PCR are listed in Table 1. Primers for PUT3 and URE2 were designed by Primer3 software (SourceForge, La Jolla, CA, USA. http://bioinfo.ut.ee/primer3-0.4.0/) and Primer-BLAST (NCBI, Bethesda, MD, USA. http://ncbi.nlm.nih.gov/tools/primerblast). Netprimer was used for analysis of secondary structures (hairpins and self-dimers) and cross-dimers (PREMIER Biosoft, Palo Alto, CA, USA. http://www.premierbiosoft.com/netprimer/). Primers were designed for annealing at around 60 °C.
2.7.1. RNA Extraction
Cell samples (2 mL) were collected after 24 h growth in starter media containing either: (i) 450 mg/L of YAN, without proline or (ii) 450 mg/L of nitrogen comprised of 50 mg/L of YAN (nitrogen components of CDGJM) and 400 mg/L of nitrogen (as proline, 3.3 g/L). RNA was extracted according to Chomczynski and Sacchi (2006) [38]. Yeast cultures (50 mL) were grown in YEPD at 30 °C until they reached 1 × 10⁷ cells/mL. Samples were harvested (14,000 rpm, 5 min), washed in sterile de-ionised water and then transferred into a 2 mL screw cap microfuge tube. Cells were again pelleted and resuspended in 500 μL Trizol (Invitrogen, Carlsbad, NM, USA) and kept in −80 °C before use. Glass beads were used for cell breakage, after incubation at 65 °C for 3 min, 100 μL of chloroform was added per 500 μL Trizol, followed by vigorous shaking for 15 s, then incubation at room temperature for 5 min. After centrifugation (14,000 rpm, 10 min, 4 °C), the top clear phase was removed to a new tube and supplemented with 250 μL of isopropanol per 500 μL Trizol. After 10 min incubation at room temperature, tubes were centrifuged as before, the supernatant discarded and the pellet washed in 500 μL of 75% cold ethanol, vortexed and re-centrifuged. Purified RNA extracts were dissolved in 100 μL PCR water (Bioline, Melbourne, Australia) and RNA concentrations determined via 260/280 nm absorbance (TECAN Infinite 200® PRO spectrophotometer; Männedorf, Switzerland).
2.7.2. Reverse Transcription and Real-Time PCR
Real-time PCR was used to analyse gene expression involved in proline metabolism. Turbo DNase (Invitrogen) was used for DNA-free treatment of all the RNA extracts. Thereafter, cDNA was synthesized with iScript cDNA Synthesis Kit (Bio-Rad, Gladesville, New South Wales, Australia). Real-time PCR was performed with the SsoFast EvaGreen Supermix (Bio-Rad) in a 96-well plate on a Bio-Rad CFX96 instrument. cDNA (1 μL, 200 ng) was added to a 10 μL PCR reaction volume including 0.5 μL of each primer (5 pmol/μL), 5 μL of EvaGreen Supermix and 3 μL of RNase-free water. The PCR conditions were: initial enzyme activation at 95 °C for 30 s, followed by 39 cycles of denaturation at 95 °C for 5 s and annealing/extension at 60 °C for 5 s. A melting curve was prepared at the end of each run from 65 to 95 °C. All samples were amplified in duplicate. Efficiency of amplifications was determined by running a standard curve of each run with serial dilutions of cDNA. The means of Ct values (the number of PCR cycles required for the fluorescent signal to cross the threshold detection) obtained were used for gene expression analysis conducted using qbase+ software (Biogazelle, Zwijnaarde, Belgium) and GraphPad Prism, version 6.6 (GraphPad Software, La Jolla, CA, USA).
2.8. Gene Sequencing
Sequencing of genes of interest, i.e., those related to proline metabolism, was achieved through a contract service (Australian Genome Research Facility, Waite Campus, Adelaide, Australia).
2.9. HPLC Analysis of Fermentation Metabolites
Fermentation metabolites including organic acids (malic, citric, lactic, acetic and succinic), glycerol and ethanol were determined with an Agilent Series 1100 HPLC, equipped with a vacuum degasser, a quaternary pump, a thermostatted column oven, and a refractive index detector (RID) and diode array/multiple wavelength detector (DAD). Separation was achieved using an HPX-87H # 125-0140 column (300 mm × 7.8 mm; Aminex, Bio-Rad, Gladesville, New South Wales, Australia) at an operating temperature of 60 °C. The injection volume was 20 μL and the mobile phase was 2.5 mM aqueous H2SO4 at a flow rate of 0.5 mL/min run in isocratic mode. Quantitation was performed using a standard curve prepared with standards of known concentration. Data were analyzed with Agilent ChemStation software (Version # 3.0.1 B, Agilent Technologies, Palo Alto, CA, USA).
3. Results and Discussion
3.1. Comparison of Growth of QA23 and its EMS Isolate Q7
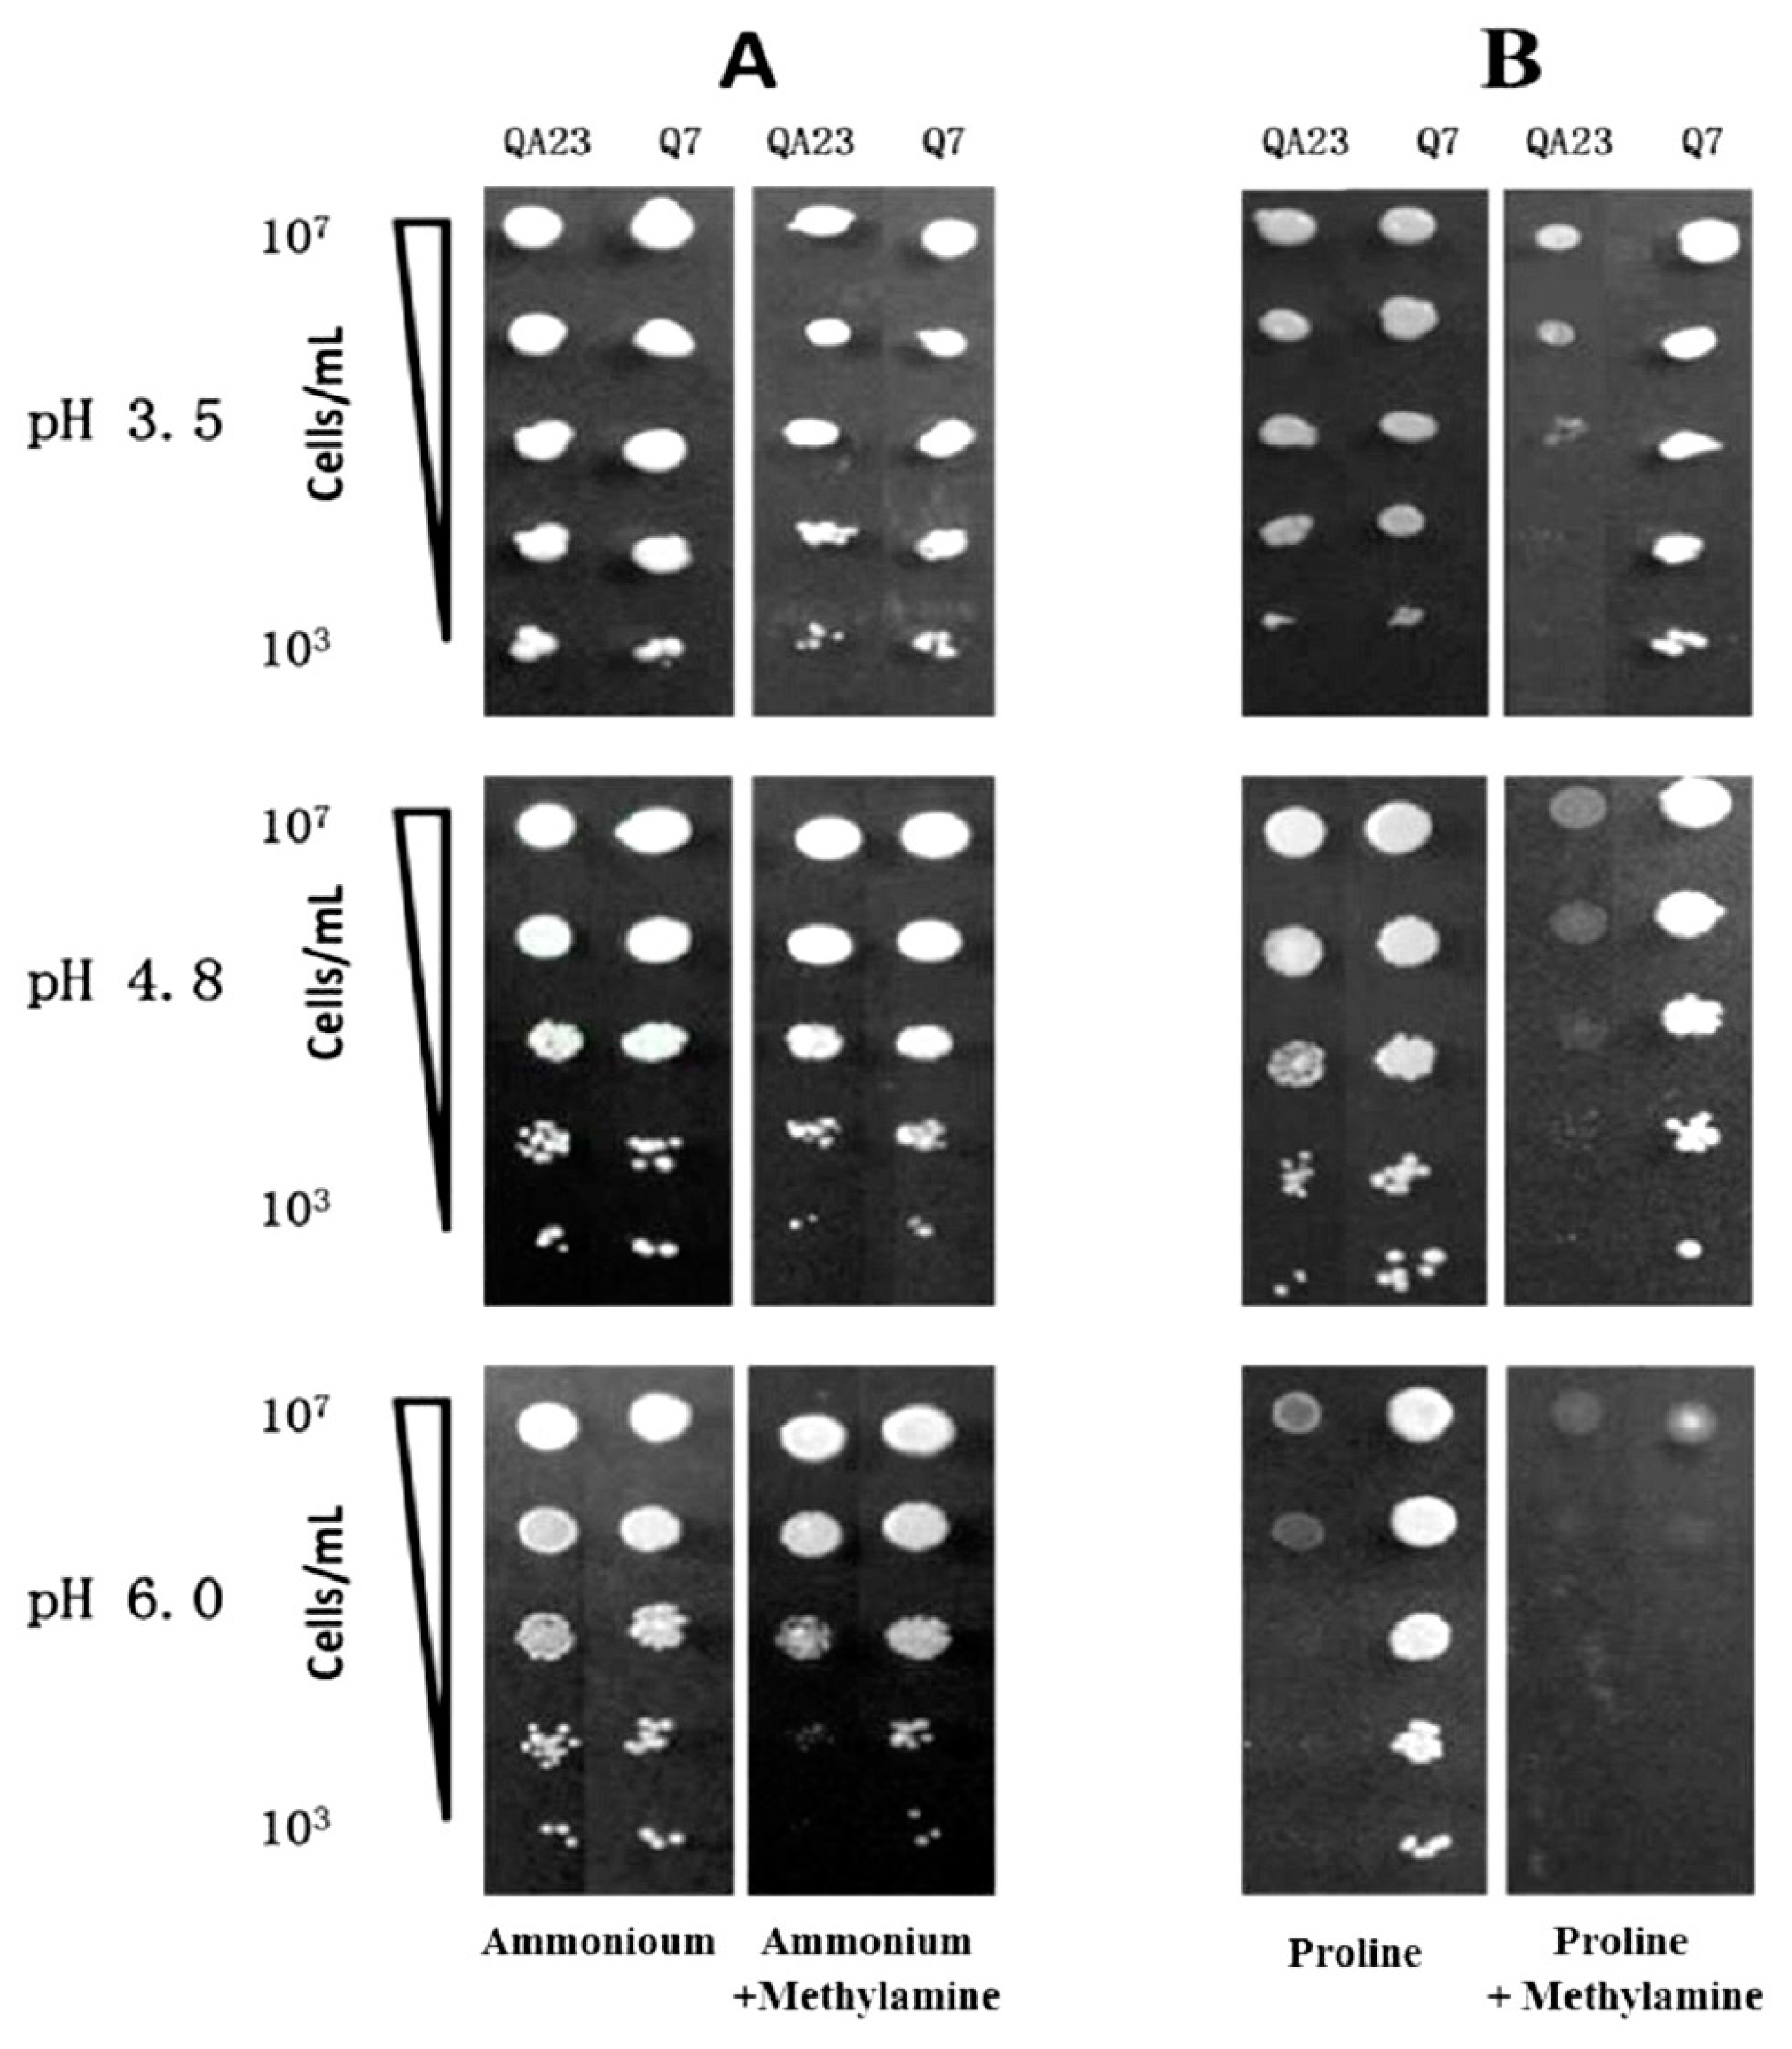
From the EMS-treated aliquots of a population of QA23, several isolates were identified that were able to grow on proline (as sole nitrogen source) in the presence of methylamine. The growth of QA23 and EMS isolate Q7 in the presence of ammonium and proline (with or without methylamine) was further compared via a dilution series on YNB containing ammonium or proline as sole nitrogen sources with or without methylamine (Figure 1). The influence of pH was also examined. When ammonium was the only nitrogen source and in the presence of methylamine, there was no difference between the growth of the wild type strain and Q7 (Figure 1A). In the case of media containing proline as the sole nitrogen source at pH 3.5, all strains grew equally well (Figure 1B). With inclusion of methylamine in the medium, growth by QA23 was reduced by two orders of magnitude. Methylamine appeared to be inducing NCR and thereby preventing utilisation of the only nitrogen source, proline, hence reducing the growth of the wild type strain, QA23 [39,40]. Instead Q7 remained unaffected with a high level of growth, implying it was depressed for proline transport and utilisation, confirming it warranted further investigation. Similar results were seen in proline-only or proline with methylamine media at pH 4.8. However, at pH 6.0, growth of QA23 was markedly reduced even in the absence of methylamine. Strain Q7 maintained high levels of growth on proline-only media at pH 6.0, suggesting that QA23 exhibited an interesting property i.e., an inability to grow on proline as sole nitrogen source at high pH values (not relevant to wine making), or possibly due to the closeness to the PI of proline (6.48). At the same pH value, the added presence of methylamine greatly restricted growth of Q7. To the best of our knowledge, methylamine shares a common transport system with ammonia in S. cerevisiae, and methylamine uptake is pH dependent, with approximately 25%, 60% and 100% of maximum activity being retained at pH 3.5, 4.8 and 6.0, respectively [30]. This report suggests that methylamine is more potent at high pH values, because its uptake by the cell becomes more effective. On the other hand, proline accumulation also can reduce cellular growth rates [41], which might explain the reduced cell growth observed for QA23 (Figure 1).
3.2. Fermentation Performance of QA23 and EMS Isolate Q7 in CDGJM.
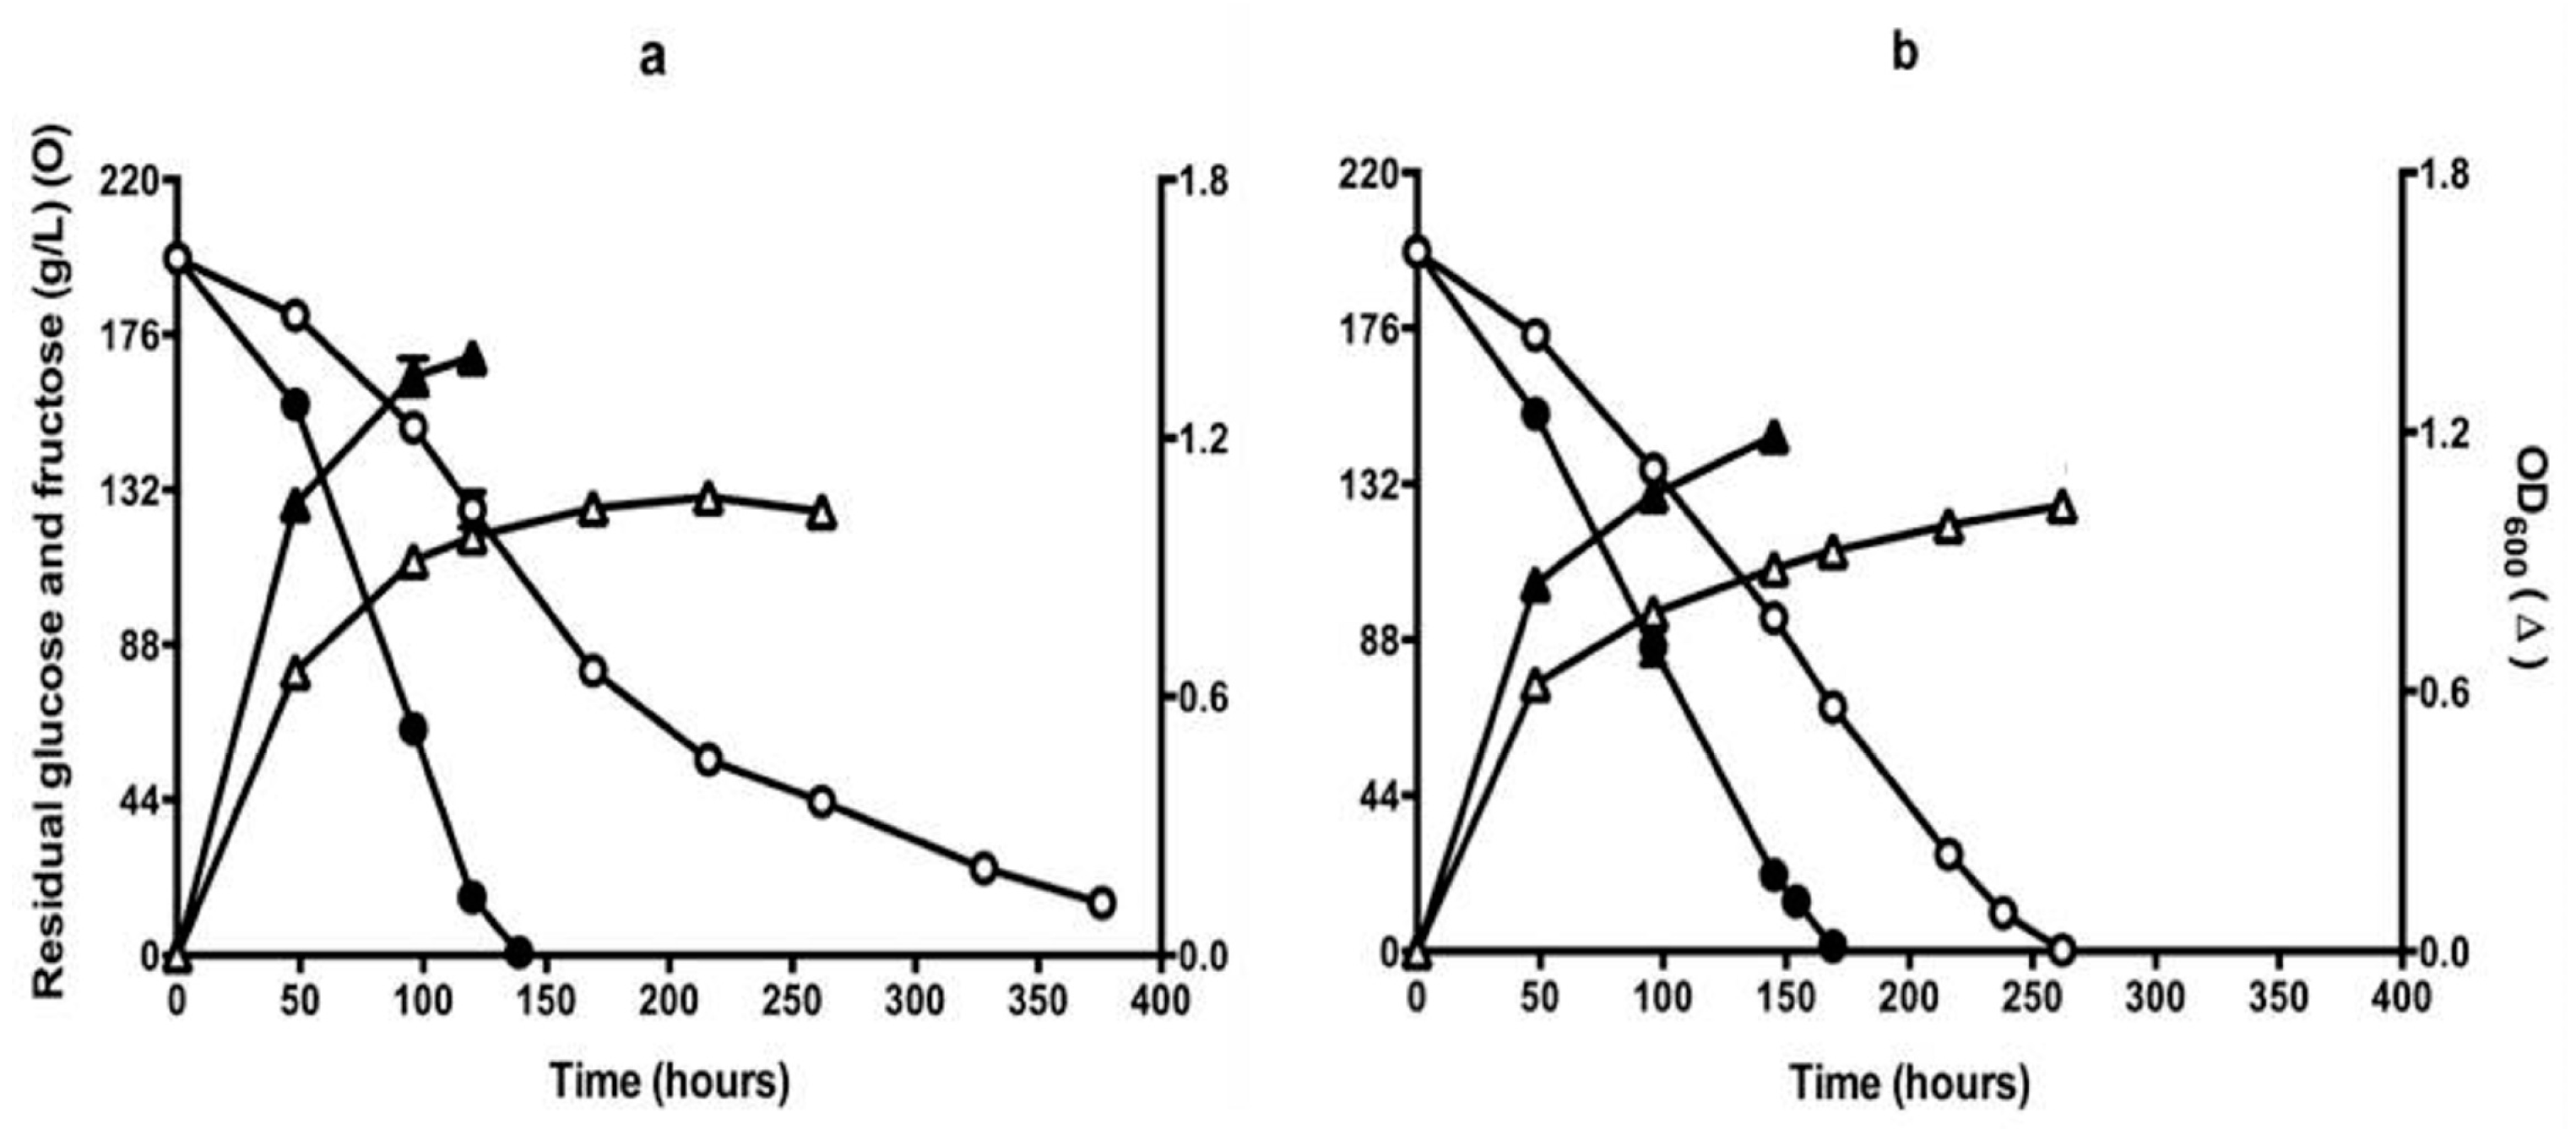
Isolate Q7, apparently derepressed for proline utilisation, was examined in fermentations carried out in CDGJM. The trials were carried out with air-locks or loosely fitted foil to close the flasks to achieve self-anaerobic or aerobic fermentations, respectively. In the presence of 50 mg/L YAN, isolate Q7 consumed sugar at a higher rate than QA23, and completed fermentation sooner under either aerobic or self-anaerobic conditions (Figure 2). Aerobic fermentations completed about 30 h earlier than the self-anaerobic fermentations (170 h). The wild type strain QA23, however, exhibited sluggish sugar consumption under aerobic conditions, incomplete even after 370 h (Figure 2a). The reason for this is not known. It may be related to increased concentrations of some compounds, which negatively affect the fermentation [42].
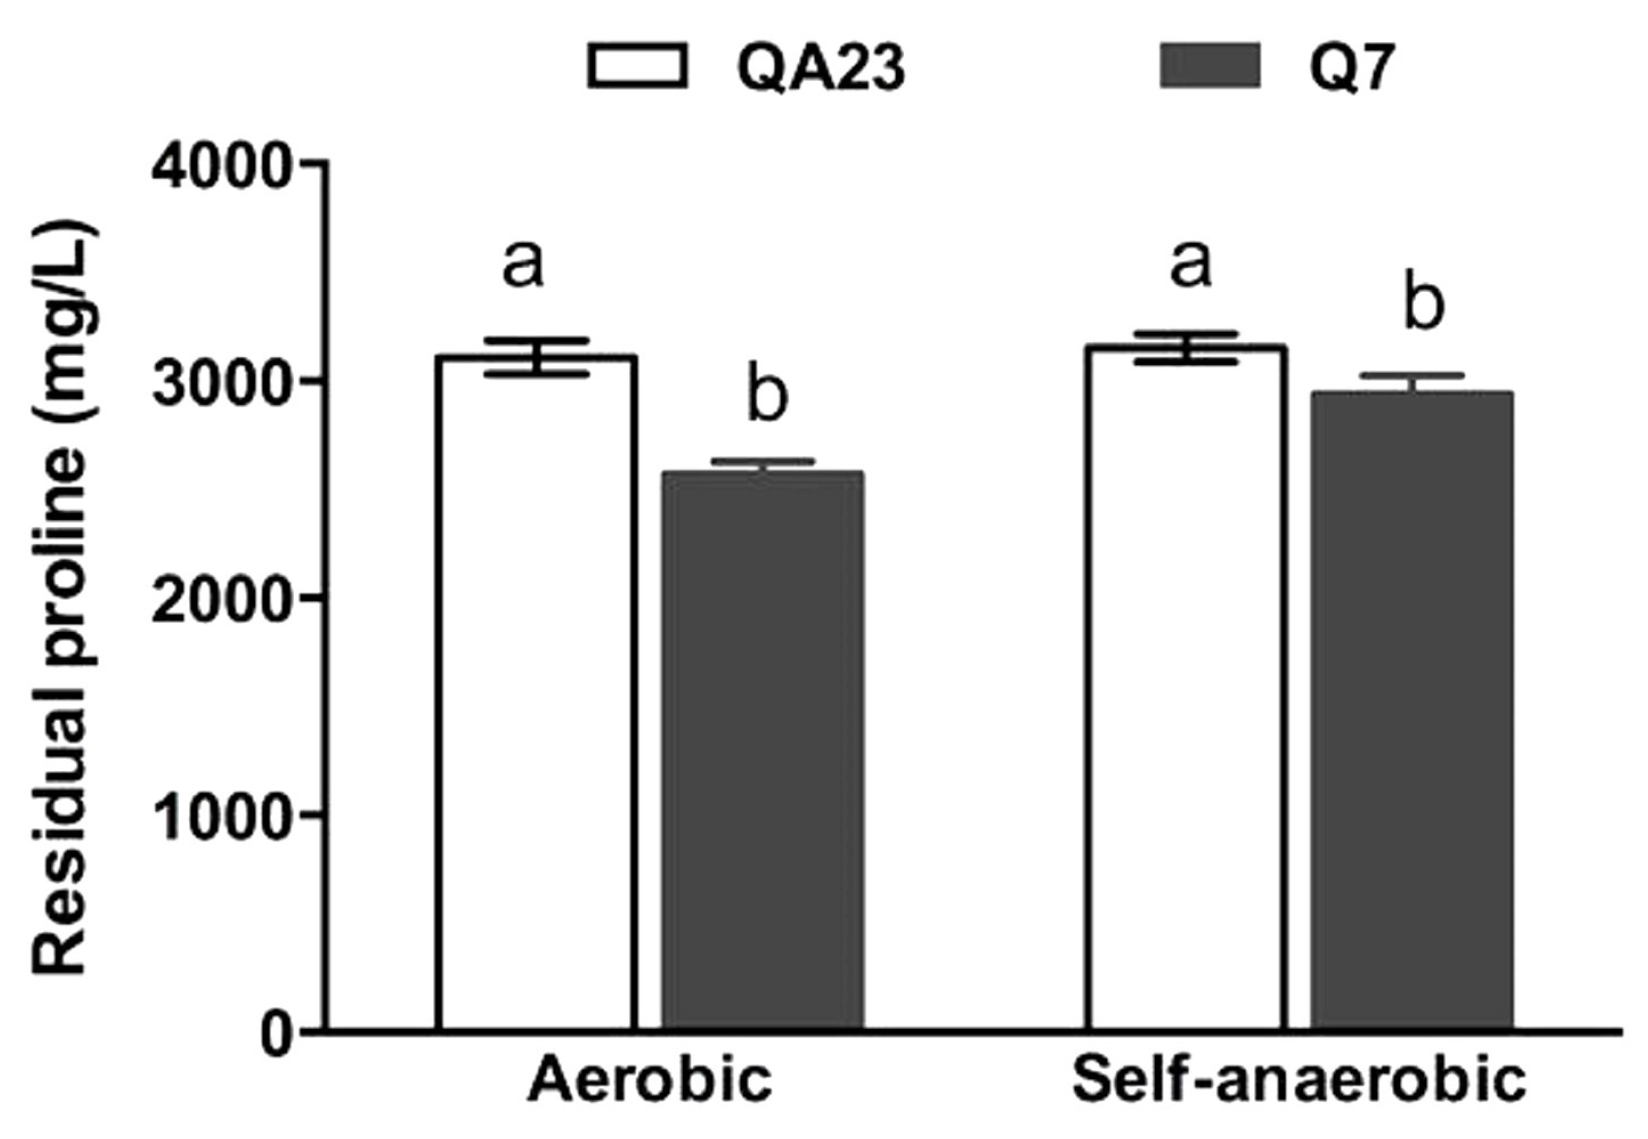
Strain Q7 achieved about twice the culture density (estimated by OD600) of QA23 (Figure 2). These findings are supported by the observed trends in proline utilisation, namely that QA23 utilised 300 mg/L of proline, regardless of oxygen availability, whereas, Q7, which achieved higher culture densities, assimilated significantly more proline: approximately 370 mg/L (self-anaerobic) or 730 mg/L (aerobic) (Figure 3). The latter results suggest that dissolved oxygen improved fermentation rates, as well as proline utilisation, which is consistent with previous studies [21,22,43]. At this stage, it is not possible to state whether the increase in growth in the presence of oxygen, is due to enhanced sterol and unsaturated fatty acid biosynthesis, and thereby improved cell condition [22], and/or enhanced proline catabolism by proline oxidase [21]. Further work will be required to differentiate between these two mechanisms.
3.3. Cell Morphology, Dry Weight and Intracellular Proline Content
Given the differences seen between QA23 and the Q7 in terms of fermentation kinetics, proline uptake and growth, we sought to determine what other features might be changed in the isolate, such as cell morphology. Prior to fermentation, yeast cells were inoculated into YEPD, followed by growth in starter CDGJM and then CDGJM (aerobic and self-anaerobic). After 24 h in YEPD, the vacuoles appeared large and well-defined in each strain. In subsequent growth conditions, vacuoles appeared more granulated. Cells of Q7 appeared to be smaller, particularly in starter CDGJM and CDGJM. This notion is supported by the fact that despite all strains producing similar dry cell weight in YEPD (approximately 5 mg/3 × 108 cells; Figure 4), and QA23 increasing by ~2-fold in either CDGJM, Q7 was about 40% lighter (smaller) per same number of cells.
To investigate whether or not proline was accumulated in the cells, culture samples were harvested at different stages of fermentation for extraction of intracellular proline. The growth medium used was starter CDGJM (100 g/L sugars) followed by experimental cultures in CDGJM (200 g/L sugars) each containing 3.3 g/L proline. Samples were taken after 24 h and at the mid and end stages of fermentation. As a reference, cultures grown in starter CDGJM without proline produced cells with no detectable intracellular proline. By comparison, QA23 cells contained readily detectable amounts of proline in the cytosolic and vacuolar fractions for all cultures and time points (Table 2). In the starter culture, most proline was localised in the vacuole rather than the cytosol (17 vs. 132 ng/108 cells). In subsequent QA23 cultures, highest proline contents were found at 24 h or the mid phase of fermentation, before only trace levels remained at the end of fermentation. Elevated levels of proline persisted to a greater extent in the vacuolar compared to the cytosolic fractions for QA23.
The tendency for QA23 to possess higher levels of intracellular proline compared to Q7 (Table 2), is in direct contrast to the relative amount of proline removed from the medium (Figure 3). There may be several reasons for this paradox. QA23 may take up but not metabolise proline thereby retaining higher intracellular amounts, whereas Q7 takes up higher amounts of proline, which is also catabolised or incorporated to a greater extent thereby depleting intracellular pools. The higher culture densities for Q7 (Figure 2) combined with the suggested smaller cell size (Figure 4) indicate markedly higher cell numbers for the isolates. As a consequence, the lower intracellular proline content of the isolates (expressed on a per cell basis) may be indicative of a greater dilution of accumulated proline amongst a greatly increased number of cells. Under aerobic condition, yeast cells of QA23 might respond to oxidative stress and accumulate more proline in the vacuole. Proline accumulation in the vacuole has been reported to provide a stress protective effect [20,34]. But the excess accumulation of proline in the cytosol might also be toxic to yeast cell [44], and might contribute to the slow growth of the wild type strain and slowing of the fermentation under aerobic conditions. Previous research has linked morphology and proline uptake indicating that proline accumulation can produce cytological differences and increased cell size [41], however the opposite was found for cell size in the present experiments.
3.4. Freeze Test
In this study, the highest intracellular proline levels were observed after 24 h of fermentation. At this time point, cell viability was also high, close to 100%, thus freeze tests were applied to gain an insight into the properties of the isolates. Cell tolerance to freezing for 3 days followed by thawing at room temperature and plating onto YEPD was used to determine residual viability (Table 3). The highest cell viability was observed for QA23 for all fermentations and under both freezing conditions. When the storage temperature was −80 °C, cell viability tended to be higher. This might be because at −80 °C, freezing occurs quicker than at −20 °C, likely related to the rates of ice formation and changes in solute concentration [45]. Previous studies have found that proline has cryoprotective effects in S. cerevisiae and is equivalent to glycerol or trehalose [46]. The significantly higher cell viability of QA23 (Table 3) may be attributable to the higher intracellular proline levels of this strain (Table 2).
3.5. Analysis of Gene Expression
An investigation into the expression of the key genes involved in proline transportation and metabolism was performed to help explain the properties of the isolates. Cells were cultured in high nitrogen media without proline and in low nitrogen media containing high levels of proline. Proline is imported into yeast cells mainly by the proline specific permease Put4p and the general amino acid permease Gap1p [40]. Proline degradation occurs in the mitochondria and is assisted by two enzymes, proline oxidase and ∆1-pyrroline-5-carboxylate dehydrogenase, encoded by PUT1 and PUT2, respectively [16]. The PUT3 protein binds to the upstream activation sequences in the promoter of PUT1 and PUT2, and induces their expression, but transcription is only activated in the presence of proline [47,48]. When preferred nitrogen sources are present, the expression of PUT genes is inhibited by the URE2 gene product [49]. These genes were targeted in a gene expression analysis.
When proline was present in the medium, PUT1 and PUT2 were not induced in QA23; but expression decreased to approximately one quarter and one third, respectively. Instead up-regulation was observed for PUT1 and PUT2 in Q7 (Figure 5). PUT1 expression paralleled that of PUT2, for the two strains. PUT3 was up-regulated in the presence of proline, consistent with previous studies, which have shown transcription is only induced in the presence of proline [47,48]. It is noteworthy that the gene that encodes the high-affinity proline transporter PUT4, was up-regulated 2-fold in Q7, but significantly down-regulated in QA23 when proline was present in the medium. The opposite trend was observed in the expression of GAP1. Thus when the media contained low YAN (+proline), PUT4 was repressed in the wild type strain, but not in Q7. In contrast, GAP1 was repressed in Q7, but not in QA23. This may indicated that proline was mainly transported into the cell via the low affinity Gap1p in QA23, but via Put4p in Q7. The reduced expression of PUT1, PUT2 and PUT4 in QA23 may be a reflection of the higher expression of URE2 regulatory gene in the presence of proline in this strain.
3.6. Gene Sequencing
To identify the difference between the parent strain and the isolate, the key genes involved in proline transportation and metabolism PUT1, PUT2 (proline metabolism), PUT3 (inducer gene) and PUT4 (proline transporter gene) were sequenced in these two strains (Figures S1–S4). Nucleotide sequences were aligned using Geneious 7.1.7 software (Biomatters Limited, Auckland, New Zealand). Following alignment the sequences were analysed for single nucleotide polymorphisms (SNPs) (Table 4). The sequence of PUT1 (proline oxidase) including 81 base pairs of promoter region was examined. In Q7, PUT1 had a SNP in the promoter at position −55. This may have led to differences in interactions with regulatory gene products, partly addressing the loss of NCR for proline metabolism. Additionally, Q7 showed substitutions at S60N (serine to asparagine) and L167V (leucine to valine). The PUT3 gene showed no differences between QA23 and Q7, whilst the PUT4 sequence revealed a likely conservative change from a heterozygosity, Thr/Ser, to Thr at amino acid position 70.
Protein variation effect analyser (PROVEAN: http://provean.jcvi.org/index.php, accessed on: 22 October, 2014) was applied to analyse the impact of the SNPs on the encoded proteins for PUT1. No deleterious effect was suggested for mutations in the ORF. Thus, the mutation in the promoter region (55) might be a factor influencing the strain’s performance during fermentation and gene expression. However, this position is different from the reported UASNTR sequences in the PUT1 promoter region (−293 to −186) [47], thus the lack of repression could be due to modification of PUT gene regulatory regions to inhibit binding by repressor gene products, or alternatively that the repressor genes themselves are modified such that their gene products no longer bind to the regulatory regions of the PUT genes. Thus, whether the alteration could influence regulator effectiveness, e.g., URE2 or DAL80 [50], still needs to be confirmed. Further work is required to determine the genetic basis for the differences between QA23 and Q7.
3.7. Fermentation in Chenin Blanc Grape Juice
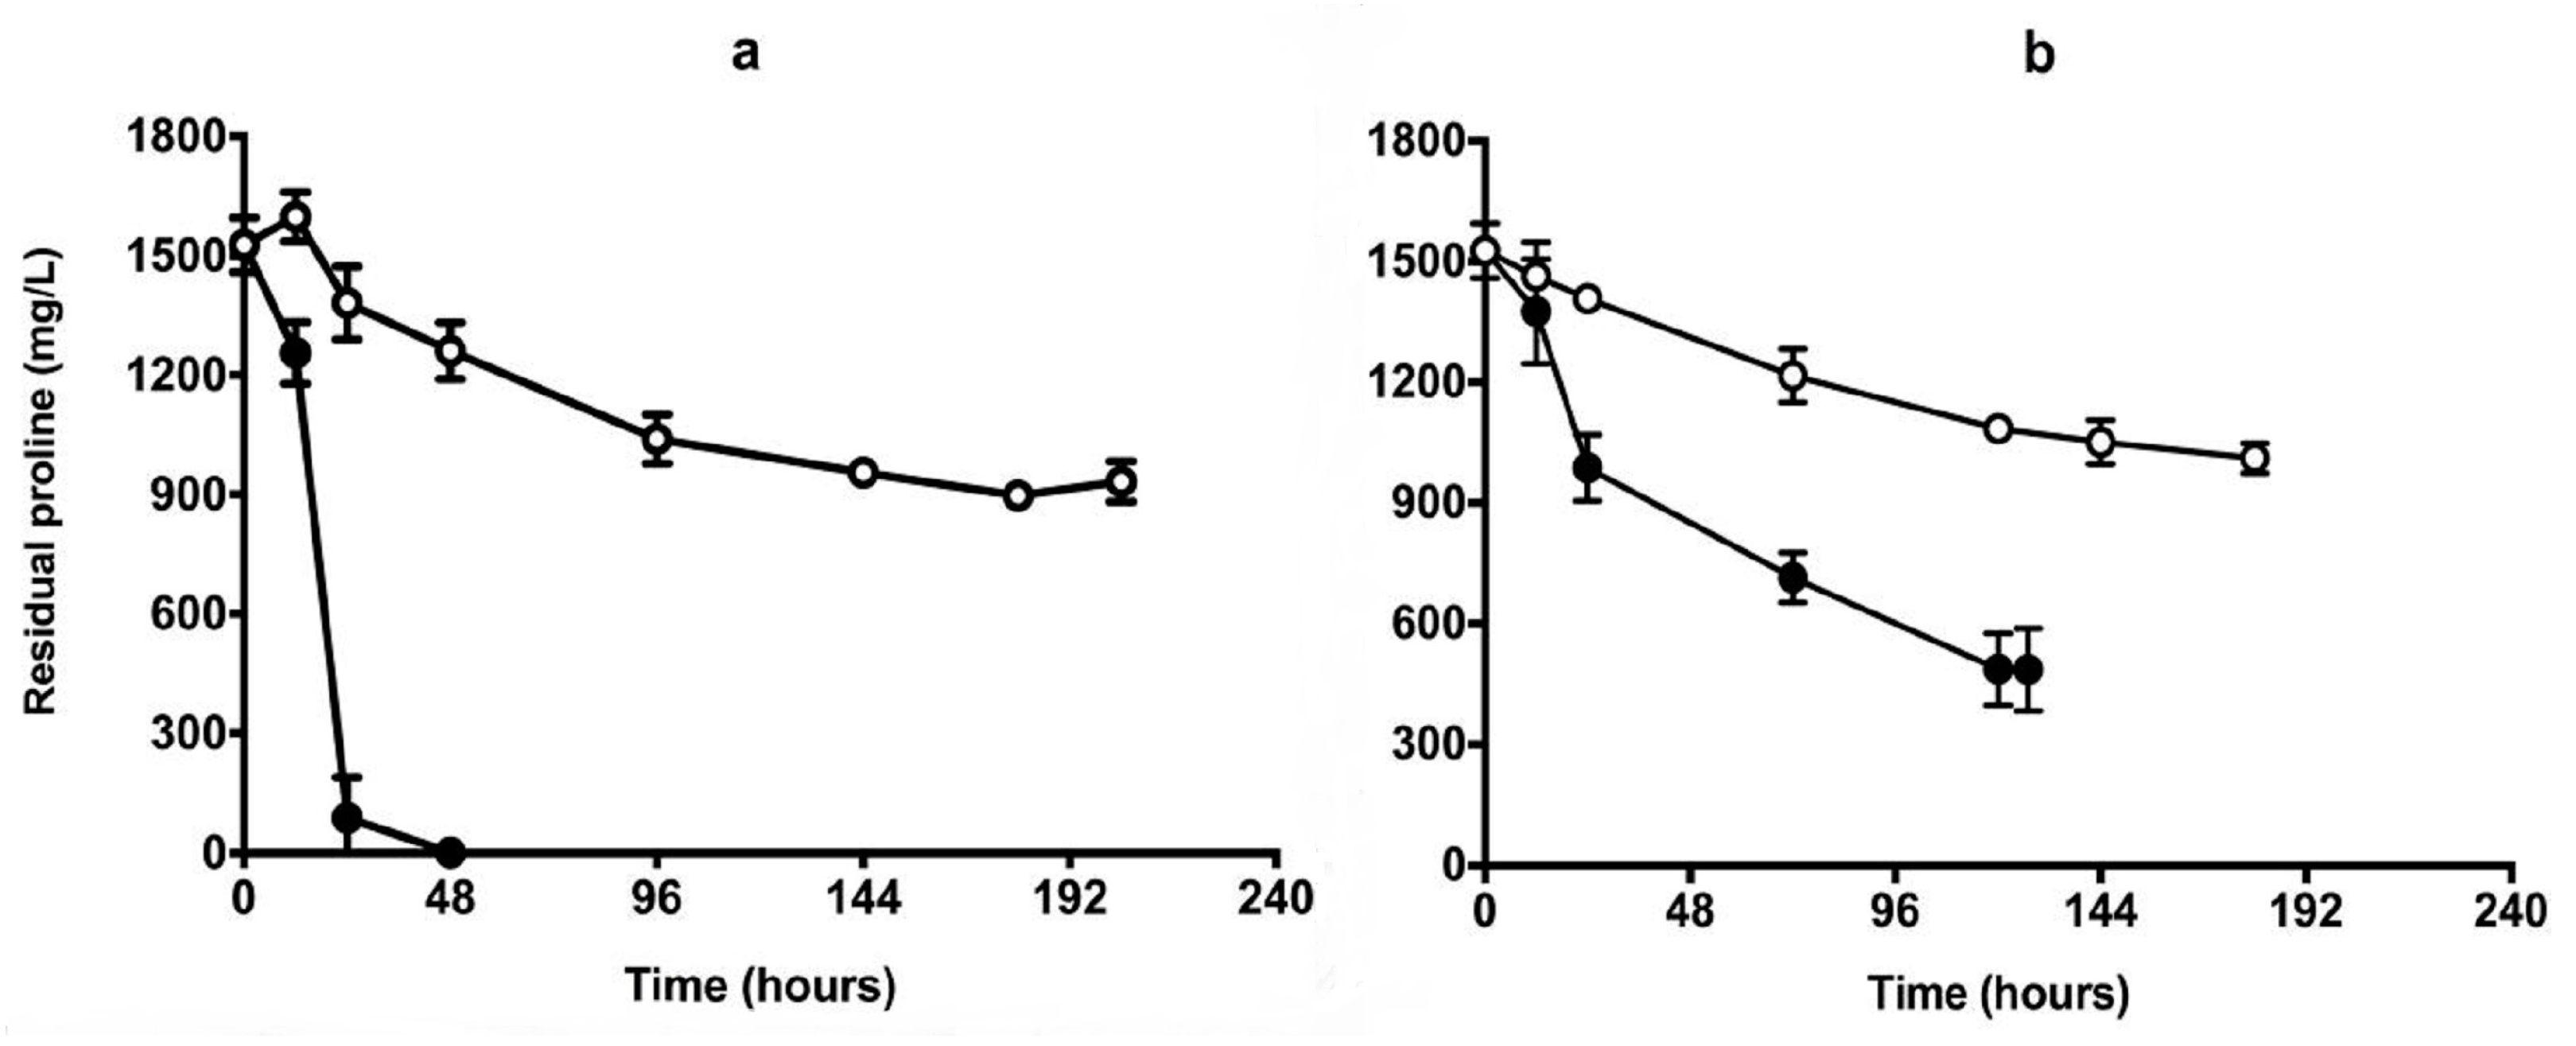
To test the performance of the isolate in real juice fermentation, Chenin Blanc (2012) containing 1540 mg/L proline and 102 mg/L YAN from the Adelaide Hills was used for the same trials as described in CDGJM. In the aerobic fermentations, QA23 became stuck after 192 h with residual sugar at about 20 g/L (Figure 6a). Isolate Q7, however, completed the fermentation in about 60 h (Figure 6a). Under self-anaerobic conditions, Q7 completed fermentations about 60 h earlier than the wild-type strain QA23 (Figure 6b). The isolate also showed significantly different growth kinetics compared to QA23, by achieving high OD600 values, thereby greater biomass yields. Proline was depleted by Q7 within 48 h in the aerobic fermentation and up to 1000 mg/L was consumed under the self-anaerobic condition at between 120–144 h (Figure 7).
Overall Q7 fermented faster, achieved greater growth and used proline more quickly. This is not exactly the case seen in CDGJM (Figure 2 and Figure 3). Such differences are presumably reflective of the different response of Q7 to the compositional differences between CDGJM and juice. Further trials with the isolate in a range of media would provide a greater sense of the most representative performance of the isolate.
The final self-anaerobic fermentation samples were also analyzed by HPLC to determine if there were any major differences in composition. For all strains, no significant difference in the acid, glycerol and ethanol content in the wine were observed (Table 5).
In summary, the aim of this research was to develop novel wine yeasts capable of exploiting the abundance of proline present in grape juice, so as to overcome the issues of stuck/sluggish fermentation, thereby reducing production difficulties and quality losses to benefit both the wine industry and consumers. This study reports on a novel yeast strain that utilises proline constitutively (i.e., in the presence of preferred nitrogen sources). The wild type strain also utilised proline as a nitrogen source, but at much lower rates than the EMS isolate. Further evaluations of the isolate in various juices will more fully define its potential applicability to industry.
Supplementary Materials
The following are available online at https://www.mdpi.com/2311-5637/4/1/10/s1.
Acknowledgments
The authors gratefully acknowledge Lallemand Inc. for project funds support and the donation of yeast strains. We also would like to thank Tommaso Liccioli, Joanna Sundstrom, Michelle Walker, Krista Sumby and Jennie Gardner for technical support and/or great suggestions. Danfeng Long is supported through the China Scholarship Council and is a recipient of an Adelaide University China Fee Scholarship, and also supported by the Fundamental Research Funds for the Central Universities (lzujbky-2016-23). We also thank the School of Agriculture, Food & Wine for financial assistance.
Author Contributions
Danfeng Long, Vladimir Jiranek, Kerry L. Wilkinson and Dennis K. Taylor conceived and designed the experiment. Danfeng Long conducted the experiment, data analysis and the writing of this manuscript. Vladimir Jiranek, Kerry L. Wilkinson and Dennis K. Taylor revised the manuscript.
Conflicts of Interest
The authors declare no conflict of interest.
References
- Ough, C.S.; Amerine, M.A. Methods for Analysis of Musts and Wines; Wiley: New York, NY, USA, 1988; ISBN 0471627577. [Google Scholar]
- Henschke, P.A.; Jiranek, V. Yeasts-metabolism of nitrogen compounds. In Wine Microbiology and Biotechnology; Harwood Academic Publishers GmbH: Amsterdam, The Netherlands, 1993; pp. 77–164. ISBN 978-0-41-527850-8. [Google Scholar]
- Alexandre, H.; Charpentier, C. Biochemical aspects of stuck and sluggish fermentation in grape must. J. Ind. Microbiol. Biotechnol. 1998, 20, 20–27. [Google Scholar] [CrossRef]
- Burin, V.M.; Gomes, T.M.; Caliari, V.; Rosier, J.P.; Bordignon Luiz, M.T. Establishment of influence the nitrogen content in musts and volatile profile of white wines associated to chemometric tools. Microchem. J. 2015, 122, 20–28. [Google Scholar] [CrossRef]
- Jiranek, V.; Langridge, P.; Henschke, P.A. Amino acid and ammonium utilization by Saccharomyces cerevisiae Wine yeasts from a chemically defined medium. Am. J. Enol. Vitic. 1995, 46, 75–83. [Google Scholar]
- Jiranek, V.; Langridge, P.; A Henschke, P. Regulation of hydrogen sulfide liberation in wine-producing Saccharomyces cerevisiae strains by assimilable nitrogen. Appl. Environ. Microbiol. 1995, 61, 461–467. [Google Scholar] [PubMed]
- Ingledew, W.M.; Kunkee, R.E. Factors influencing sluggish fermentations of grape juice. Am. J. Enol. Vitic. 1985, 36, 65–76. [Google Scholar]
- Monteiro, F.F.; Bisson, L.F. Biological assay of nitrogen content of grape juice and prediction of sluggish fermentations. Am. J. Enol. Vitic. 1991, 42, 47–57. [Google Scholar]
- Bisson, L.F. Stuck and sluggish fermentations. Am. J. Enol. Vitic. 1999, 50, 107–119. [Google Scholar]
- Gutiérrez, A.; Chiva, R.; Sancho, M.; Beltran, G.; Arroyo-López, F.N.; Guillamon, J.M. Nitrogen requirements of commercial wine yeast strains during fermentation of a synthetic grape must. Food Microbiol. 2012, 31, 25–32. [Google Scholar] [CrossRef] [PubMed]
- Monteiro, F.F.; Trousdale, E.K.; Bisson, L. Ethyl carbamate formation in wine: Use of radioactively labeled precursors to demonstrate the involvement of urea. Am. J. Enol. Vitic. 1989, 40, 1–8. [Google Scholar]
- Adams, C.; Vuuren, H. Effect of timing of diammonium phosphate addition to fermenting grape must on the production of ethyl carbamate in wine. Am. J. Enol. Vitic. 2010, 61, 125–129. [Google Scholar]
- Ugliano, M.; Henschke, P.A.; Herderich, M.; Pretorius, I.S. Nitrogen management is critical for wine flavour and style. Aust. N. Z. Wine Ind. J. 2007, 22, 24–30. [Google Scholar]
- Stines, A.P.; Grubb, J.; Gockowiak, H.; Henschke, P.A.; Høj, P.B.; van Heeswijck, R. Proline and arginine accumulation in developing berries of Vitis vinifera L. in Australian vineyards: Influence of vine cultivar, berry maturity and tissue type. Aust. J. Grape Wine Res. 2000, 6, 150–158. [Google Scholar] [CrossRef]
- Huang, Z.; Ough, C.S. Effect of vineyard locations, varieties, and rootstocks on the juice amino acid composition of severalcultivars. Am. J. Enol. Vitic. 1989, 40, 135–139. [Google Scholar]
- Brandriss, M.C.; Magasanik, B. Genetics and physiology of proline utilization in Saccharomyces cerevisiae: Enzyme induction by proline. J. Bacteriol. 1979, 140, 498–503. [Google Scholar] [PubMed]
- Wang, S.S.; Brandriss, M.C. Proline utilization in Saccharomyces cerevisiae: Sequence, regulation, and mitochondrial localization of the PUT1 gene product. Mol. Cell Biol. 1987, 7, 4431–4440. [Google Scholar] [CrossRef] [PubMed]
- Duteurtre, B.; Bourgeois, C.; Chollot, B. Study of the assimilation of proline by brewing yeast. J. Inst. Brew. 1971, 77, 28–35. [Google Scholar] [CrossRef]
- Takagi, H.; Sakai, K.; Morida, K.; Nakamori, S. Proline accumulation by mutation or disruption of the proline oxidase gene improves resistance to freezing and desiccation stresses in Saccharomyces cerevisiae. FEMS Microbiol. Lett. 2000, 184, 103–108. [Google Scholar] [CrossRef] [PubMed]
- Takagi, H.; Taguchi, J.; Kaino, T. Proline accumulation protects Saccharomyces cerevisiae cells in stationary phase from ethanol stress by reducing reactive oxygen species levels. Yeast 2016, 33, 355–363. [Google Scholar] [CrossRef] [PubMed]
- Ingledew, W.M.; Magnus, C.A.; Sosulski, F.W. Influence of oxygen on proline utilization during the wine fermentation. Am. J. Enol. Vitic. 1987, 38, 246–248. [Google Scholar]
- Sablayrolles, J.M.; Dubois, C.; Manginot, C.; Roustan, J.-L.; Barre, P. Effectiveness of combined ammoniacal nitrogen and oxygen additions for completion of sluggish and stuck wine fermentations. J. Ferment. Bioeng. 1996, 82, 377–381. [Google Scholar] [CrossRef]
- Gardner, J.M.; Poole, K.; Jiranek, V. Practical significance of relative assimilable nitrogen requirements of yeast: A preliminary study of fermentation performance and liberation of H2S. Aust. J. Grape Wine Res. 2002, 8, 175–179. [Google Scholar] [CrossRef]
- Omura, F.; Fujita, A.; Miyajima, K.; Fukui, N. Engineering of yeast PUT4 permease and its application to lager yeast for efficient proline assimilation. Biosci. Biotechnol. Biochem. 2005, 69, 1162–1171. [Google Scholar] [CrossRef] [PubMed]
- Poole, K.; Walker, M.E.; Warren, T.; Gardner, J.; McBryde, C.; de Barros Lopes, M.; Jiranek, V. Proline transport and stress tolerance of ammonia-insensitive mutants of the PUT4-encoded proline-specific permease in yeast. J. Gen. Appl. Microbiol. 2009, 55, 427–439. [Google Scholar] [CrossRef] [PubMed]
- Liccioli, T. Improving Fructose Utilization in Wine Yeast Using Adaptive Evolution. Ph.D. Thesis, The University of Adelaide, Adelaide, Australia, 2010. Available online: http://hdl.handle.net/2440/67017 (accessed on 23 May 2013).
- Guthrie, C.; Fink, G.R. Guide to Yeast Genetics and Molecular Biology. Methods Enzymol. 1991, 194, 1–863. [Google Scholar]
- Poole, K. Enhancing Yeast Performance under Oenological Conditions by Enabling Proline Utilisation. Ph.D. Thesis, The University of Adelaide, Adelaide, Australia, 2002. Available online: http://hdl.handle.net/2440/58485 (accessed on 25 February 2011).
- Salmon, J.M.; Barre, P. Improvement of nitrogen assimilation and fermentation kinetics under enological conditions by derepression of alternative nitrogen-assimilatory pathways in an industrial Saccharomyces cerevisiae strain. Appl. Environ. Microbiol. 1998, 64, 3831–3837. [Google Scholar] [PubMed]
- Roon, R.J.; Even, H.L.; Dunlop, P.; Larimore, F.L. Methylamine and ammonia transport in Saccharomyces cerevisiae. J. Bacteriol. 1975, 122, 502–509. [Google Scholar] [PubMed]
- Long, D.; Wilkinson, K.L.; Poole, K.; Taylor, D.K.; Warren, T.; Astorga, A.M.; Jiranek, V. Rapid method for proline determination in grape juice and wine. J. Agric. Food Chem. 2012, 60, 4259–4264. [Google Scholar] [CrossRef] [PubMed]
- Boehringer Mannheim. D-glucose/D-fructose. In Methods of Biochemical Analysis and Food Analysis; Boehringer Mannheim: Mannheim, Germany, 1989; pp. 50–55. [Google Scholar]
- Ohsumi, Y.; Kitamoto, K.; Anraku, Y. Changes induced in the permeability barrier of the yeast plasma membrane by cupric ion. J. Bacteriol. 1988, 170, 2676–2682. [Google Scholar] [CrossRef] [PubMed]
- Matsuura, K.; Takagi, H. Vacuolar functions are involved in stress-protective effect of intracellular proline in Saccharomyces cerevisiae. J. Biosci. Bioeng. 2005, 100, 538–544. [Google Scholar] [CrossRef] [PubMed]
- Kaino, T.; Takagi, H. Gene expression profiles and intracellular contents of stress protectants in Saccharomyces cerevisiae under ethanol and sorbitol stresses. Appl. Microbiol. Biotechnol. 2008, 79, 273–283. [Google Scholar] [CrossRef] [PubMed]
- Beltran, G.; Novo, M.; Rozès, N.; Mas, A.; Guillamón, J.M. Nitrogen catabolite repression in Saccharomyces cerevisiae during wine fermentations. FEMS Yeast Res. 2004, 4, 625–632. [Google Scholar] [CrossRef] [PubMed]
- Teste, M.-A.; Duquenne, M.; François, J.M.; Parrou, J.-L. Validation of reference genes for quantitative expression analysis by real-time RT-PCR in Saccharomyces cerevisiae. BMC Mol. Biol. 2009, 10, 99. [Google Scholar] [CrossRef] [PubMed]
- Chomczynski, P.; Sacchi, N. The single-step method of RNA isolation by acid guanidinium thiocyanate-phenol-chloroform extraction: Twenty-something years on. Nat. Protoc. 2006, 1, 581–585. [Google Scholar] [CrossRef] [PubMed]
- Ough, C.S.; Stashak, R.M. Further studies on proline concentration in grapes and wines. Am. J. Enol. Vitic. 1974, 25, 7–12. [Google Scholar]
- Lasko, P.F.; Brandriss, M.C. Proline transport in Saccharomyces cerevisiae. J. Bacteriol. 1981, 148, 241–247. [Google Scholar] [PubMed]
- Maggio, A.; Miyazaki, S.; Veronese, P.; Fujita, T.; Ibeas, J.I.; Damsz, B.; Narasimhan, M.L.; Hasegawa, P.M.; Joly, R.J.; Bressan, R.A. Does proline accumulation play an active role in stress-induced growth reduction? Plant J. 2002, 31, 699–712. [Google Scholar] [CrossRef] [PubMed]
- Ciani, M.; Maccarelli, F.; Fatichenti, F. Growth and fermentation behaviour of Brettanomyces/Dekkera yeasts under different conditions of aerobiosis. World J. Microbiol. Biotechnol. 2003, 19, 419–422. [Google Scholar] [CrossRef]
- Aceituno, F.F.; Orellana, M.; Torres, J.; Mendoza, S.; Slater, A.W.; Melo, F.; Agosin, E. Oxygen response of the wine yeast Saccharomyces cerevisiae EC1118 grown under carbon-sufficient, nitrogen-limited enological conditions. Appl. Environ. Microbiol. 2012, 78, 8340–8352. [Google Scholar] [CrossRef] [PubMed]
- Morita, Y.; Nakamori, S.; Takagi, H. Effect of proline and arginine metabolism on freezing stress of Saccharomyces cerevisiae. J. Biosci. Bioeng. 2002, 94, 390–394. [Google Scholar] [CrossRef]
- Körber, C. Phenomena at the advancing ice-liquid interface: Solutes, particles and biological cells. Q. Rev. Biophys. 1988, 21, 229–298. [Google Scholar] [CrossRef] [PubMed]
- Takagi, H.; Iwamoto, F.; Nakamori, S. Isolation of freeze-tolerant laboratory strains of Saccharomyces cerevisiae from proline-analogue-resistant mutants. Appl. Microbiol. Biotechnol. 1997, 47, 405–411. [Google Scholar] [CrossRef] [PubMed]
- Siddiqui, A.H.; Brandriss, M.C. The Saccharomyces cerevisiae PUT3 activator protein associates with proline-specific upstream activation sequences. Mol. Cell Biol. 1989, 9, 4706–4712. [Google Scholar] [CrossRef] [PubMed]
- Axelrod, J.D.; Majors, J.; Brandriss, M.C. Proline-dependent binding of PUT3 transcriptional activator protein detected by footprinting in vivo. Mol. Cell Biol. 1991, 11, 564–567. [Google Scholar] [CrossRef] [PubMed]
- Xu, S.; Falvey, D.A.; Brandriss, M.C. Roles of URE2 and GLN3 in the proline utilization pathway in Saccharomyces cerevisiae. Mol. Cell Biol. 1995, 15, 2321–2330. [Google Scholar] [CrossRef] [PubMed]
- Daugherty, J.R.; Rai, R.; El Berry, H.M.; Cooper, T.G. Regulatory circuit for responses of nitrogen catabolic gene expression to the GLN3 and DAL80 proteins and nitrogen catabolite repression in Saccharomyces cerevisiae. J. Bacteriol. 1993, 175, 64–73. [Google Scholar] [CrossRef] [PubMed]
Figure 1.
Growth of QA23 and EMS isolate Q7 on: (A) YNB with ammonium (±methylamine); (B) YNB with proline (±methylamine) at pH 3.5, 4.8 and pH 6.0. Five × ten-fold serial dilutions of yeast cell suspensions (initially at OD 0.08) were applied to each plate. Plates were photographed after 3 days incubation at 28 °C.

Figure 2.
Sugar consumption (circles) and growth (triangles) of QA23 (open symbols) and Q7 (closed symbols) during fermentation conducted in CDGJM initially containing glucose + fructose at 200 g/L, 450 mg N/L (50 mg/L mixed amino acids and ammonia + 3.3 g/L proline). Fermentations were carried out in (a) aerobic (i.e., vessels were covered with loosely-fitted foil) or (b) self-anaerobic (i.e., vessels were fitted with air locks) conditions. Culture optical density (OD600) was measured at 600 nm. Results are the mean of triplicate cultures (±standard error).

Figure 3.
Proline consumption by QA23 and Q7 following fermentation in CDGJM as described in Figure 2, under aerobic and self-anaerobic conditions. The medium initially contained 3.3 g/L proline. Results are mean of three culture replicates (±standard error). Histograms identified with different letters were significantly different within a given condition.

Figure 4.
Comparison of dry cell weights 24 h after inoculation of QA23 and EMS isolate Q7 in yeast extract peptone dextrose (YEPD), starter, and fermentation media (as described in Figure 2). Results are the mean of three replicates. Values identified with different letters were significantly different.
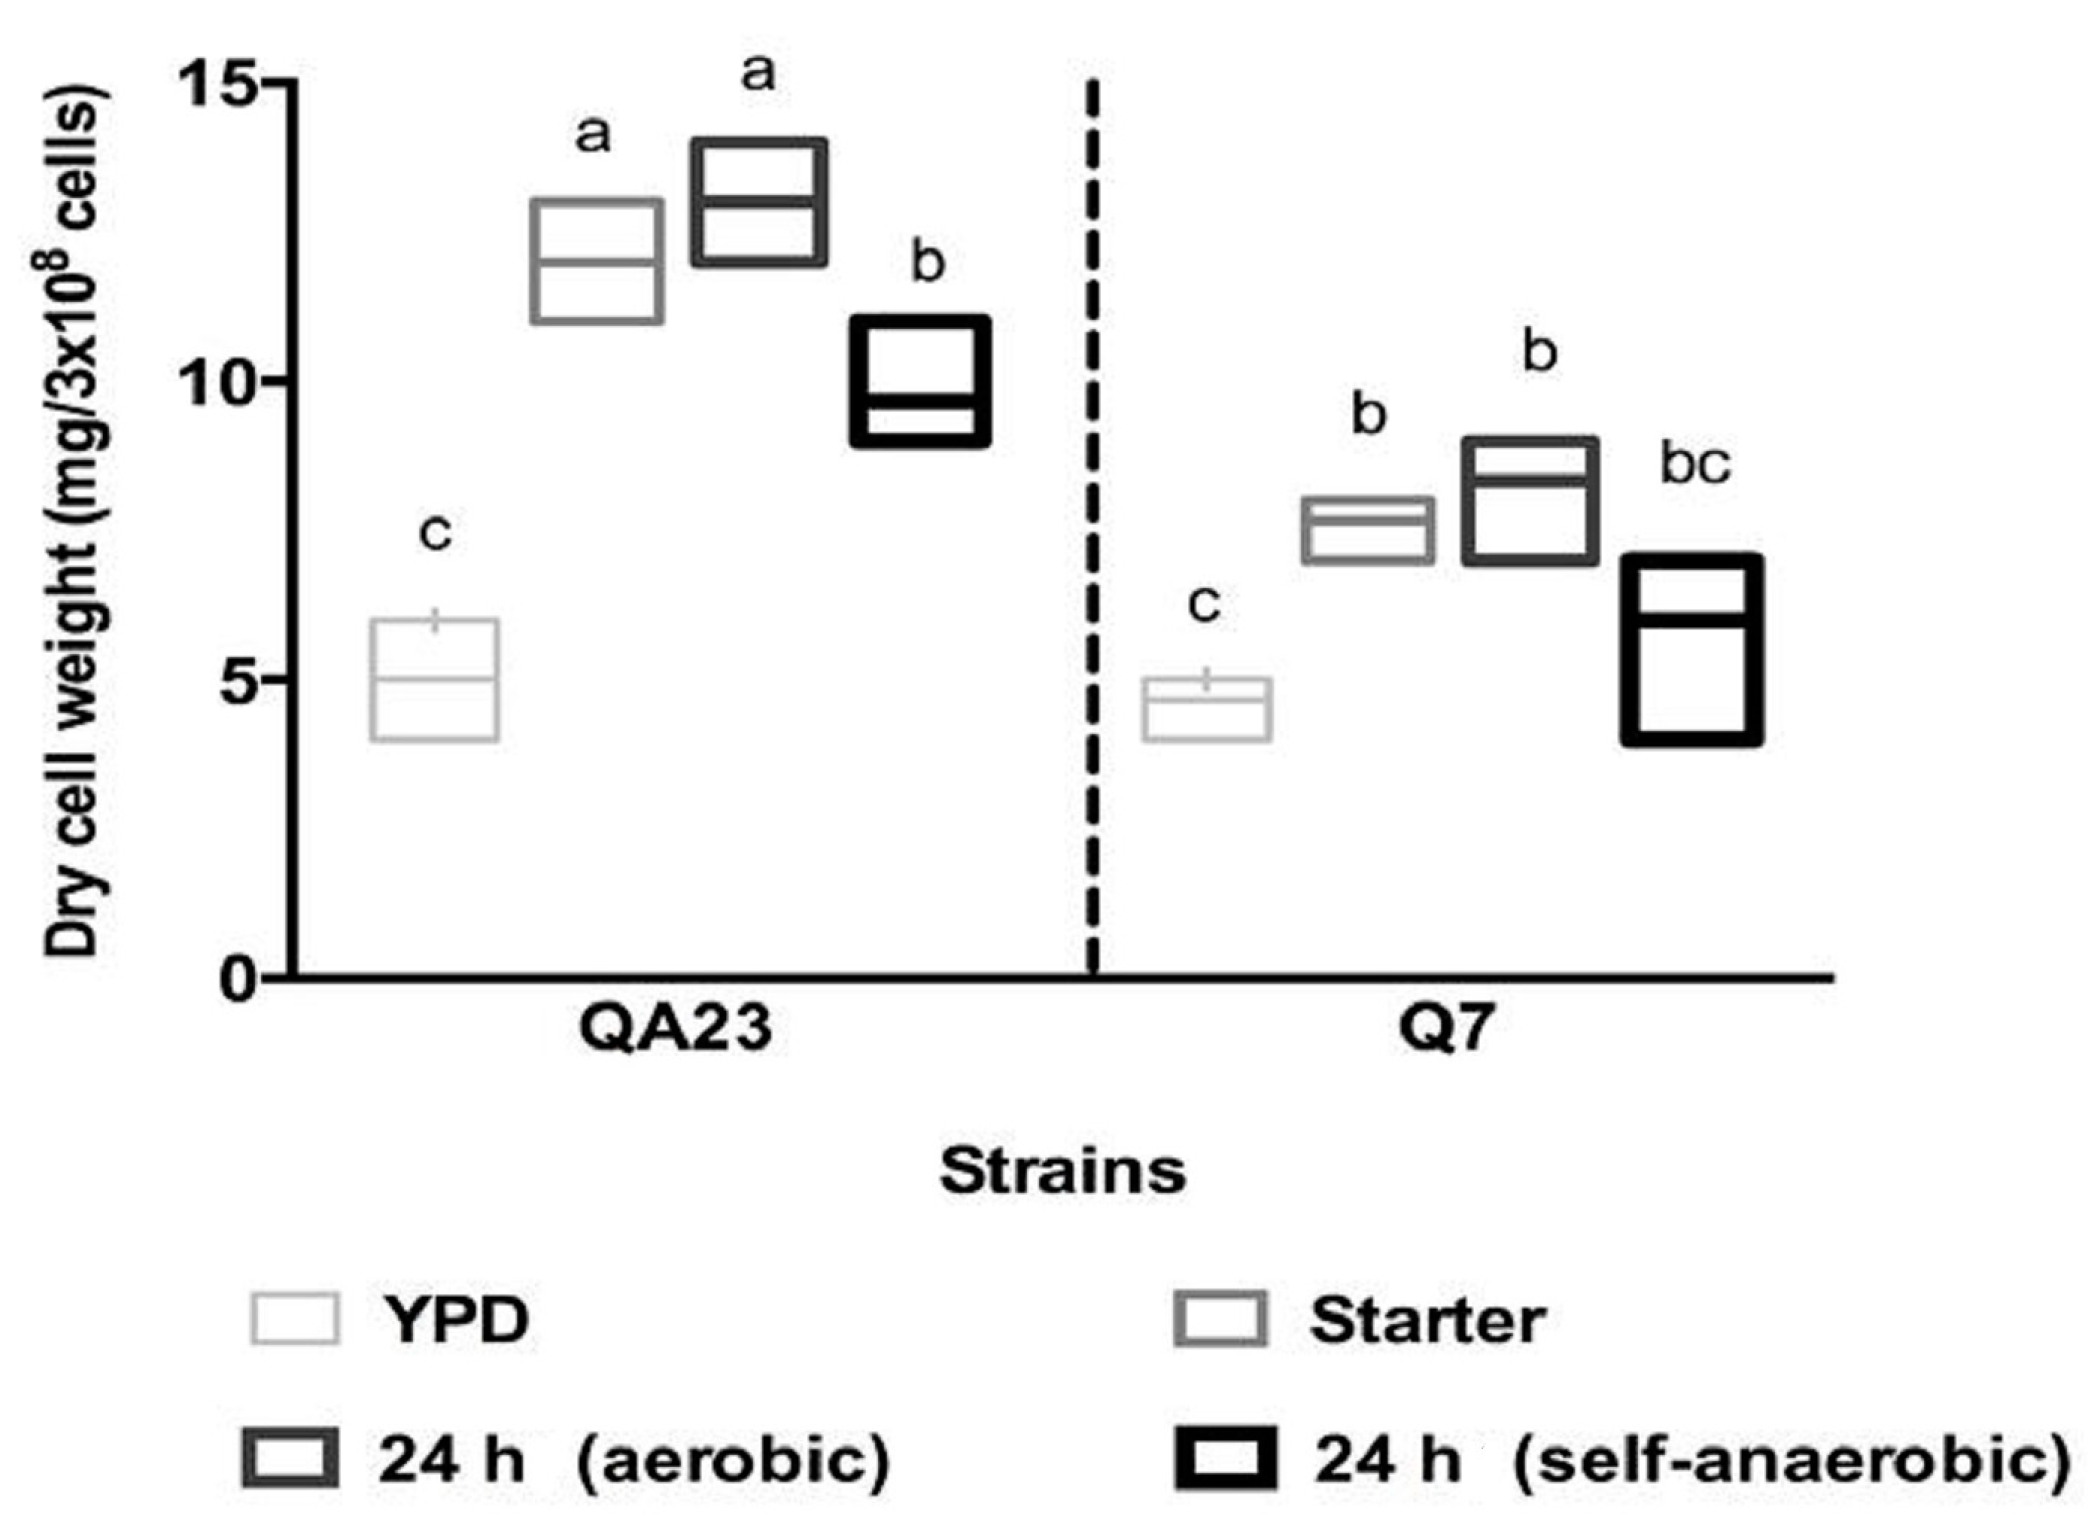
Figure 5.
Normalized relative expression of key genes involved in proline transportation and metabolism in QA23 and Q7, cultivated overnight in media containing: 450 mg/L of nitrogen with mixed amino acids and ammonium, but without proline (−proline); or 50 mg/L mixed amino acids and ammonium, supplemented with 3.3 g/L proline (+proline). Initial sugar content of each medium was 100 g/L of glucose: fructose 1:1. The mRNA level of each gene was normalized against TAF10 and ALG9 levels in the same sample. Values are mean (± standard error) of duplicate determinations from duplicate cultures. Data analysis was performed using qbase+ software. Significant differences in relative expression are indicated by: *, p < 0.05; **, p < 0.01; ***, p < 0.001; ****, p < 0.0001.
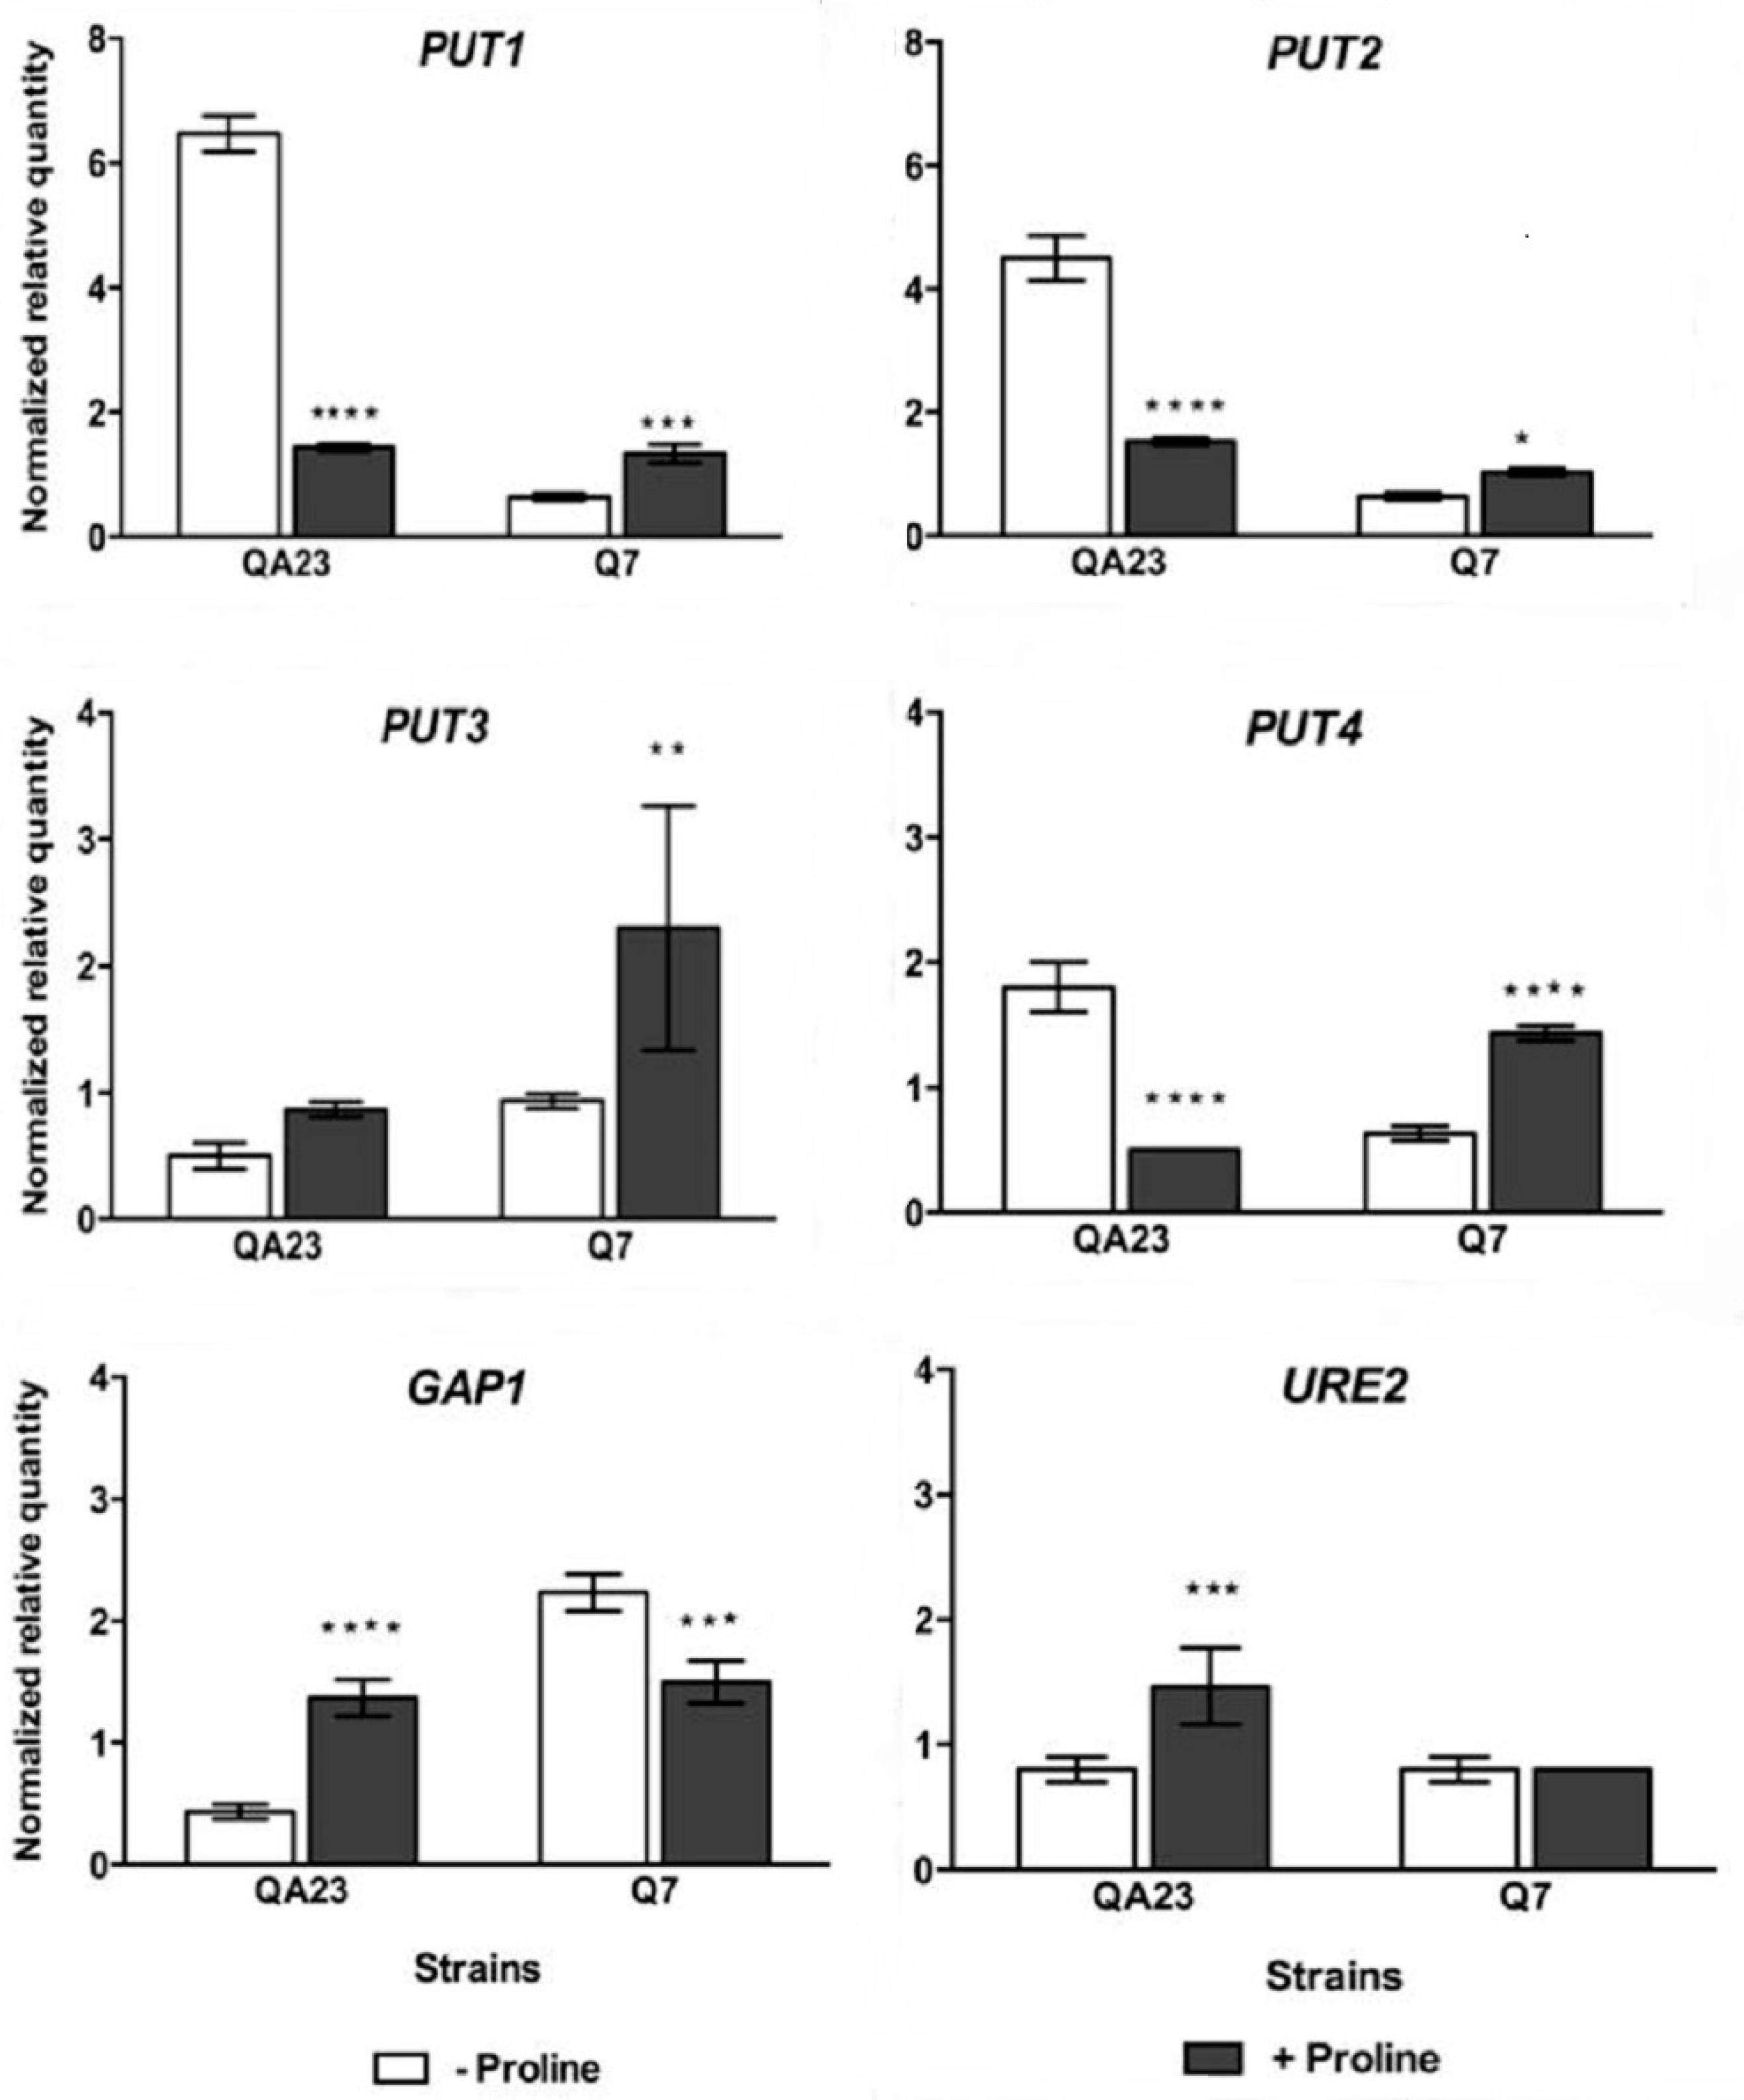
Figure 6.
Sugar (circles) and cell growth (triangles) during fermentation of Chenin Blanc grape juice (2012) by QA23 (open symbols) and Q7 (closed symbols). Juice initially contained 105 g/L glucose + fructose, 102 mg N/L and 40 mg/L proline, but was modified (glucose + fructose) to give 200 g/L sugar and 1.5 g/L of proline were added. Fermentations were carried out in aerobic (a) (vessels were covered with loosely-fitted foil) or self-anaerobic (b) (vessels were fitted with air locks) conditions. Culture optical density was estimated at 600nm. All results are the mean of triplicate fermentations.
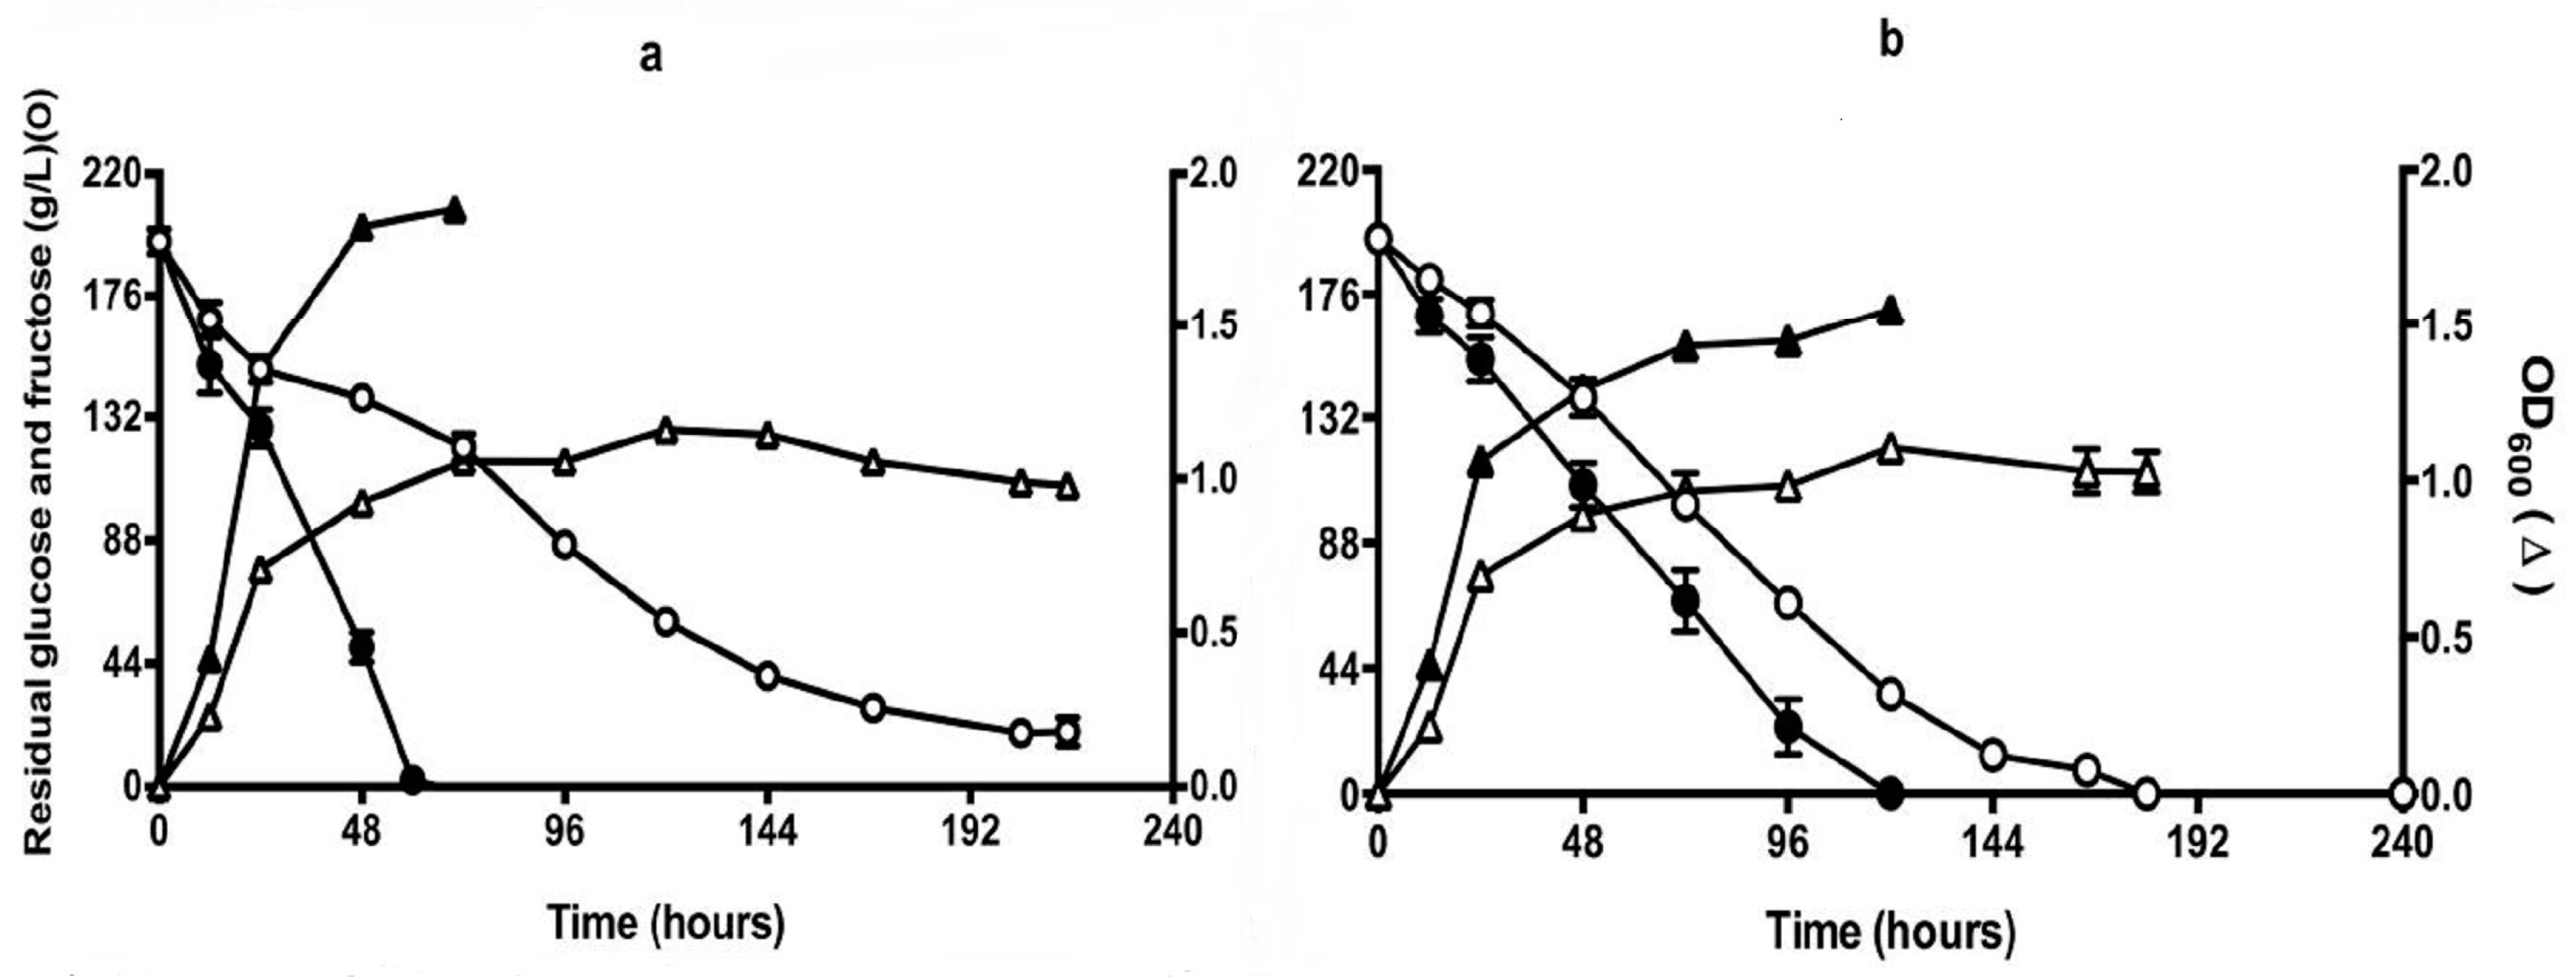
Figure 7.
Proline consumption during fermentation in aerobic (a) and self-anaerobic conditions (b). Fermentation conditions as described in Figure 6. The open and closed symbols represent QA23 and Q7, respectively. Results are the mean of triplicates.
Figure 7.
Proline consumption during fermentation in aerobic (a) and self-anaerobic conditions (b). Fermentation conditions as described in Figure 6. The open and closed symbols represent QA23 and Q7, respectively. Results are the mean of triplicates.


Table 1.
Primers used in this study.
| Name | Primers (5′–3′) | Reference |
|---|---|---|
| PUT1-F | GATAAAACGGGCACTGACGA | [35] |
| PUT1-R | TAACGAGCATTTGGGATTGG | |
| PUT2-F | CCGATATGTTTGGCATATTGCA | [35] |
| PUT2-R | TGGACTTGCGGATGTGTTCA | |
| PUT3-F | GCGGTATTGAAGTCCTGTTGT | this study |
| PUT3-R | TGGATAGAGTGTCGCTTTGAGA | |
| PUT4-F | GAGCCGCACAAACTAAAACA | [35] |
| PUT4-R | CGTATGAAGCGTGGATGAAG | |
| GAP1-F | CTGTGGATGCTGCTGCTTCA | [36] |
| GAP1-R | CAACACTTGGCAAACCCTTGA | |
| URE2-F | TCCCGTATGGCTTGTAGGAGA | this study |
| URE2-R | CACGCAATGCCTTGATGACC | |
| ALG9-F | CACGGATAGTGGCTTTGGTGAACAATTAC | [37] |
| ALG9-R | TATGATTATCTGGCAGCAGGAAAGAACTTGGG | |
| TAF10-F | ATATTCCAGGATCAGGTCTTCCGTAGC | [37] |
| TAF10-R | GTAGTCTTCTCATTCTGTTGATGTTGTTGTTG |
Table 2.
Intracellular proline content (ng/108 cells) of cells from QA23 and Q7 sampled at different stages of fermentation in CDGJM.
Table 2.
Intracellular proline content (ng/108 cells) of cells from QA23 and Q7 sampled at different stages of fermentation in CDGJM.
| Strains | Starter | Aerobic | Self-Anaerobic | |||||||||||
|---|---|---|---|---|---|---|---|---|---|---|---|---|---|---|
| Cytosolic | Vacuolar | Cytosolic | Vacuolar | |||||||||||
| Cytosolic | Vacuolar | 24 h | mid | End | 24 h | mid | End | 24 h | mid | End | 24 h | mid | End | |
| QA23 | 17 ± 1 a | 132 ± 1 a | 116 ± 1 a | 10 ± 1 a | 1 ± 0 a | 136 ± 5 a | 94 ± 5 a | 16 ± 1 a | 122 ± 4 a | 13 ± 0 a | 5 ± 1 a | 47 ± 2 a | 64 ± 2 a | 4 ± 0 |
| Q7 | nd b | nd b | 81 ± 3 b | nd b | nd b | nd b | 1 ± 0 b | nd b | 90 ± 3 b | nd b | nd b | nd b | nd b | 4 ± 0 |
Cultures were grown in YEPD overnight before inoculation into starter CDGJM (100 g/L glucose and fructose, 3.3 g/L proline). Starter cultures were then inoculated into CDGJM (200 g/L glucose and fructose, 3.3 g/L proline) in aerobic or self-anaerobic conditions. Values followed by a different letter within columns are significantly different; 24 h: Proline was extract from cells after 24 h of fermentation; Mid: Proline was extracted from cells in the middle of fermentation. Sugar content was 100 ± 10 g/L; End: Proline was extracted from cells at the end of fermentation. Sugar content was less than 2 g/L; Values are the mean of three fermentation replicates (n = 3) ± standard error; nd = not detected.
Table 3.
Cell viability (%) after freezing for 3 days at −20 °C or −80 °C.
| Strain | −20 °C | −80 °C | ||
|---|---|---|---|---|
| Aerobic | Self-Anaerobic | Aerobic | Self-Anaerobic | |
| QA23 | 63 ± 6 a | 57 ± 5 a | 66 ± 6 a | 63 ± 5 a |
| Q7 | 20 ± 2 b | 29 ± 5 b | 29 ± 2 b | 37 ± 5 b |
Values are the means of three fermentation replicates (n = 3) ± standard error. Values followed by a different letter within columns are significantly different.
Table 4.
Summary of mutation positions in the sequence of PUT1 and PUT4 in QA23 and Q7.
| Gene | Strain | 55 (Promoter) | 260 (ORF) | Amino Acid | 580 (ORF) | Amino Acid |
|---|---|---|---|---|---|---|
| PUT1 | QA23 | G | G | Ser | C | Leu |
| Q7 | T | A | Asn | G | Val | |
| 45 (Promoter) | 465 (ORF) | Amino Acid | ||||
| PUT4 | QA23 | - | W | Thr/Ser | ||
| Q7 | - | T | Thr |
Nucleotide code: W (A or T); Sequence numbers refer to nucleotide bases in the relevant gene sequences in Supplementary Materials. The position of the feature as being either in the promoter or ORF is indicated.
Table 5.
Major fermentation metabolites derived in the final samples for Chenin Blanc fermentations by QA23 and Q7.
Table 5.
Major fermentation metabolites derived in the final samples for Chenin Blanc fermentations by QA23 and Q7.
| Metabolites (g/L) | QA23 | Q7 |
|---|---|---|
| Malic acid | 3.1 ± 0.08 | 3.5 ± 0.22 |
| Citric acid | 3.5 ± 0.03 | 2.9 ± 0.36 |
| Lactic acid | 0.9 ± 0.05 | 0.9 ± 0.21 |
| Acetic acid | 0.2 ± 0.04 | 0.2 ± 0.07 |
| Succinic acid | 2.7 ± 0.04 | 3.2 ± 0.22 |
| Glycerol | 8.0 ± 0.08 | 7.7 ± 0.81 |
| Ethanol | 92.2 ± 0.41 | 85.7 ± 6.24 |
© 2018 by the authors. Licensee MDPI, Basel, Switzerland. This article is an open access article distributed under the terms and conditions of the Creative Commons Attribution (CC BY) license (http://creativecommons.org/licenses/by/4.0/).
Share and Cite
MDPI and ACS Style
Long, D.; Wilkinson, K.L.; Taylor, D.K.; Jiranek, V. Novel Wine Yeast for Improved Utilisation of Proline during Fermentation. Fermentation 2018, 4, 10. https://doi.org/10.3390/fermentation4010010
AMA Style
Long D, Wilkinson KL, Taylor DK, Jiranek V. Novel Wine Yeast for Improved Utilisation of Proline during Fermentation. Fermentation. 2018; 4(1):10. https://doi.org/10.3390/fermentation4010010
Chicago/Turabian StyleLong, Danfeng, Kerry L. Wilkinson, Dennis K. Taylor, and Vladimir Jiranek. 2018. "Novel Wine Yeast for Improved Utilisation of Proline during Fermentation" Fermentation 4, no. 1: 10. https://doi.org/10.3390/fermentation4010010
Note that from the first issue of 2016, this journal uses article numbers instead of page numbers. See further details here.