The Use of UV-Vis Spectroscopy in Bioprocess and Fermentation Monitoring


The Agri-Chemistry Group, School of Medical and Applied Sciences, Central Queensland University (CQU) Australia, Bruce Highway, North Rockhampton, QLD 4702, Australia
*
Author to whom correspondence should be addressed.
Fermentation 2018, 4(1), 18; https://doi.org/10.3390/fermentation4010018
Submission received: 11 February 2018
/
Revised: 1 March 2018
/
Accepted: 7 March 2018
/
Published: 13 March 2018
(This article belongs to the Special Issue Bioprocess and Fermentation Monitoring)
Abstract
:Real-time analytical tools to monitor bioprocess and fermentation in biological and food applications are becoming increasingly important. Traditional laboratory-based analyses need to be adapted to comply with new safety and environmental guidelines and reduce costs. Many methods for bioprocess fermentation monitoring are spectroscopy-based and include visible (Vis), infrared (IR) and Raman. This paper describes the main principles and recent developments in UV-Vis spectroscopy to monitor bioprocess and fermentation in different food production applications.
1. Introduction
There is an increasing need for real-time analytical tools to monitor bioprocess and fermentation in biological and food applications [1,2,3]. The driving force behind this transition from traditional laboratory analysis to process monitoring is the need for more rapid process control information, to comply with safety and environmental guidelines and reduce the costs of production [4,5,6,7,8,9,10,11,12]. Several studies have highlighted the usefulness of complex or multiplex systems (a combination of several sensors) and techniques to monitor biological processes [4,5,6,7,8,9,10,11,12].
In recent years, process analytical technology (PAT) has proven to be one of the most efficient and advanced tools for continuous process monitoring and control, as well as providing objective measurements of raw ingredient quality in several fields including the food processing, petrochemical, and pharmaceutical industries [4,5,6].
The PAT method framework and the tools used in process monitoring are categorised into four succinct areas, as follows: (1) multivariate data acquisition and analysis methods, (2) modern process analyser or process analytical hardware, (3) process endpoint monitoring and control guidelines, and, finally, (4) protocols, continuous improvement and knowledge management tools [4,5,6].
The use of sensors (e.g., biosensors, spectroscopy) for bioprocess monitoring is widely seen as a powerful tool by the U.S. Food and Drug Administration [4,5,6]. Spectroscopic sensors, when combined with PAT, enable simultaneous, real-time bioprocess monitoring of various critical parameters including biological, chemical, and physical variables during the whole production process [9,10,11,12]. In combining multiple techniques using PAT with spectroscopy (UV/Vis spectroscopy, IR spectroscopy, fluorescence spectroscopy [13,14,15], and Raman spectroscopy), we add the depth of multivariate data analysis. Users can obtain relevant process information from large and comprehensive datasets [16,17,18,19,20,21,22]. The main advantages of using spectroscopic methods for bioprocess monitoring include the inherent speed of analysis, sensitivity, and robustness of the obtained data [22,23,24,25,26,27]. However, some spectroscopic techniques are non-selective in the sense that most compounds detected will be in complex solutions or suspensions (matrices) and will typically result (directly or indirectly) in multiple bands or peaks being obtained in the resulting spectra [22,23,24,25,26,27]. In addition, changes due to physical effects may mask any linear correlation between the sensor signal and the concentration of the analytes [22,23,24,25,26,27,28]. The development of fibre-optic probes and flow cells has allowed for the ease of implementation of spectroscopic methods for real-time, online monitoring of several bioprocesses [25]. Overall, bioprocess monitoring using spectroscopic methods in combination with additional sensors enables the simultaneous detection of analytes and molecular variations as well as the measurement of several compounds. Additionally, other background properties in the growth medium may be observed—for example, the metabolic state of the cells in media, which is of great importance for real-time knowledge of bioprocess performance in fermentation [16,17,18,19,20,21,22,23,24,25,26,27].
Online applications based on spectroscopy (e.g., NIR, MIR) started around the end of the 1980s primarily due to the availability of fibre optics and portable instrumentation [16,17,18,19,20,21,22,23,24,25,26,27]. Most of these applications are related to the control and monitor of liquids, mainly because the application of fibre optics was easier to use with this type of sample [16,17,18,19,20,21,22,23,24,25,26,27].
This paper describes the main principles and recent developments in UV-Vis spectroscopy to monitor bioprocess and fermentation in different food production applications.
2. The Origin of the UV-Vis Spectra
Spectroscopy is the interaction between waves originated in the electromagnetic spectrum and molecules present in the sample matrix under analysis [29,30]. The two main spectroscopic techniques used in food analysis are atomic and molecular spectroscopy [29,30]. The development and implementation of these spectroscopy methods in the field of food analysis [31] are based on the interactions between matter and light that resulted in absorption, emission, and scattering events characteristic of the sample [29,30]. In food analysis, these applications are based on a variety of spectroscopic methods and techniques that use the benefits of different wavelength ranges including ultraviolet and visible (UV-Vis), near-infrared (NIR), mid-infrared (MIR), far infrared (FIR), Raman, microwaves, radio waves, and nuclear magnetic resonance (NMR) [29,30,31,32].
UV-Vis spectroscopy is a sensitive method in molecular spectroscopy that uses ultraviolet and visible light in the wavelength range between 200 and 780 nm [29,30,31,32]. As stated above, this spectroscopic method is based on the absorption, scattering, diffraction, refraction, and reflection properties of the sample analysed [29,30,31,32]. The absorption of UV and Vis light is restricted to certain molecular functional groups called chromophores, in which electrons are excited at different frequencies [29,30,31,32].
As in many spectroscopic applications, the Beer–Lambert law describes the correlation between light absorption by the molecule, the light path length of the sample, and the concentration of the absorbing molecules in the liquid medium [29,30,31,32]. Therefore, on the basis of the absorption measurement, the presence and concentration of analytes in the food matrix as a consequence of its chemical and physical properties can be determined and quantified [29,30,31,32].
3. Sample Presentation
The use of UV-Vis spectroscopy in analytical food chemistry to measure different chemical compounds has been reported by several authors [29,30,31,32,33,34,35]. The measurement of proteins and other large molecules is the predominant application of this technique in the literature, where light is absorbed by functional groups, resulting in non-specific UV-Vis spectra [29,30,31,32,33,34,35]. However, differentiation of specific proteins using UV spectra is rarely possible [29,30,31,32,33,34,35].
UV absorption analysis of solutes can only be performed in a homogenous liquid solution [29,30,31,32,33,34,35]. When suspended solid particles are present, the absorption and light scattering effects of the particles dominate the light absorption from the sample [29,30,31,32,33,34,35]. In bioprocess and fermentation monitoring, optical density (OD) provides the most relevant information to make the measurements. This effect can be used to determine the concentration of biomass in turbid samples [29,30,31,32,33,34,35]. The main advantage of OD is that it associates very well (linearly) with microbial cell mass at low concentrations; however, at higher concentrations it is not sensitive [29,30,31,32,33,34,35]. Furthermore, distinguishing between viable and dead microbial cells and noting the differences between intact, microbial cell debris and other solid particles is difficult [29,30,31,32,33,34,35].
Modern UV-Vis instruments based on the use of fibre-optics coupled with linear photodiode arrays expand the use of this technique to measuring several analytes in aqueous solutions [27,28,29,30]. General principles used in modern UV-Vis instrumentation are described by Lourenço and collaborators [2,30]. Most of the applications related to bioprocess and fermentation monitoring describe the use of OD to measure cell concentration, where others are based on light scattering [2,30]. For example, in the wavelength range between 350 and 400 nm, several researchers have reported the usefulness of this range to differentiate between viable and dead microbial cells due to an increase in absorption associated with microbial cell contents and nucleic acids originating from the damaged microbial cells [2,33]. In recent years, new developments in high-resolution UV-Vis spectroscopy lead to better applicability in bioprocess monitoring [2,28,33]. New commercially available spectrophotometers use charge-coupled devices (CCDs) or photodiode arrays instead of expensive photomultipliers [2,28,33]. Besides their excellent performance in the UV region, these instruments are also useful for measurements in the wavelength range between UV and near-infrared (NIR) [2,28,33]. Modern UV-Vis spectrophotometers show outstanding sensitivity, high scanning speed, compactness, and high robustness and are inexpensive, making them the analytical tool of choice for multiple industrial applications [2,28,33]. In recent years, high-resolution UV-Vis spectrophotometers have been reported to monitor several chemical properties in bioprocesses [2,28,33]. In this type of instrument, a deuterium light source is used to produce a light beam in the range of 185–400 nm, where a concave holographic flat-field diffraction grating is utilized [2,28,33,34]. Then, the continuous spectrum is measured with a CCD camera that allows for simultaneous detection of different analytes [2,28,33,34]. Overall, UV-Vis spectroscopy has been used in the determination of several substrates, metabolites, and products, as well as in the detection of undesired byproducts or toxic substances [2,28,33,34].
4. Data Analysis
Recent applications and the expansion of UV-Vis spectroscopy in the food industry are possible due to the use of several data mining and multivariate data analysis tools. Multivariate data analysis or chemometrics was introduced by a number of disciplines and research groups in a diverse field of applications such as food chemistry, analytical chemistry, and organic chemistry in the late 1960s [32,33,34,35,36,37,38,39]. With modern chemical measurements and the development of PAT, the analyst is often challenged with large datasets where the essential information may not be readily evident [22]. Therefore, the sample in its entirety and not just a single component is analysed, together with the interactions between the constituents and other properties of the sample [35,36,37,38,39,40,41,42].
Multivariate data methods allow for the analysis of several variables and their interactions, moving beyond the univariate domain [42]. In most applications, the use of multivariate data methodologies enhances the analysis and interpretation of instrumental data, allowing the extraction of relevant information from the sample [35,36,37,38,39,40,41,42]. Currently, several food quality measurement techniques are multivariate in nature and are based on the indirect measurements of the chemical and physical properties within the sample matrix [32,33,34,35,36,37,38,39,40]. However, these methods and techniques are considered correlative in nature [31,35,36,37,38,39,40,41,42,43].
The use of chemometrics coupled with spectroscopic techniques provides the analyst with the ability to obtain more information from a single measurement because the combined methods can record responses at many wavelengths simultaneously [31,35,36,37,38,39,40,41,42,43]. From the collected data, the information can be visualized as a pattern that contains information about a complex bioprocess—for example, fermentation [31,35,36,37,38,39,40,41,42,43]. The information generated during the analyses will allow the monitoring of fermentation using a range of inexpensive sensors or probes and enables analysts to create a decision-making system for monitoring and potentially automated management of the fermentation process [31,35,36,37,38,39,40,41,42,43]. Ultimately, data mining combined with statistical tools, machine learning, and database management systems allows for the intelligent extraction of key information from the UV-Vis spectra [31,35,36,37,38,39,40,41,42,43]. Moreover, the incorporation of different techniques in the data mining system will produce different outcomes based on the user’s specifications and requirements [35,36,37,38,39,40,41,42,43,44,45,46,47,48,49]. These outcomes can be expressed either as classification, association, clustering, prediction, or deviation analysis [35,36,37,38,39,40,41,42,43,44,45,46,47,48,49]. More detailed information about the numerous algorithms, formulas and procedures used in multivariate analysis can be found in more specialized literature [35,36,37,38,39,40,41,42,43,44,45,46,47,48,49].
5. Applications and Examples of UV-Vis Spectroscopy in Bioprocess and Fermentation Monitoring
Phenolic compounds play an important role in the colour, flavour and “mouth feel” attributes of wines [50]. Consequently, the measurement of phenolic compounds during fermentation is important to better understand and control the winemaking process [50,51]. UV-Vis spectroscopy was used to monitor the phenolic composition during winemaking, where models used to predict phenolic compounds were developed using partial least squares (PLS) regression [50,51]. The accuracy and robustness of the calibration models were evaluated by the authors using the slope and intercept, interclass correlation coefficients and standard error of measurement [50].
Difficulties in bioprocess monitoring are a drawback of solid-state fermentation (SSF), specifically when monitoring enzyme activity in SSF [52]. The combination of PLS regression and artificial neural network (ANN) with UV-Vis spectroscopy was evaluated to measure the activity of enzymes (protease and amylase) and protein concentrations in aqueous extracts [52]. The relative errors from the models reported by these authors were for amylolytic and proteolytic enzymes 4% (3–442 µg−1) and 6% (0–256 µg−1), respectively [52]. The results indicate that this approach is suitable for developing a chemosensor for monitoring SSFs, reducing the analytical work for quantification of enzyme activities [52].
Supernatants from a fermentation process of Pichia pastoris were analysed by a combination of spectroscopic techniques [27]. Models were developed to predict the concentration of glycerol and methanol in the supernatants using PLS regression [27]. Overall, the results reported by these authors indicated that UV-Vis spectroscopy was able to quantify protein contents in the supernatants analysed [27].
The application of UV-Vis spectroscopy was evaluated as an inline sensor to monitor changes in colour and total phenol concentration during red wine fermentation [51]. The sensor presented by the authors was based on multiple light-emitting diodes (LEDs) (280–525 nm) [51]. According to the authors, these studies confirmed that LED sensors can be used to measure the concentration of phenolic compounds in-line [51]. The incorporation of a 100 µm path length flow cell avoids the need for dilution of the sample, making in-line measurements possible [51]. The sensor provides in-line measurement of the evolution of the total phenolic content and colour extraction patterns during red wine fermentation [51].
The crystallization of biopharmaceuticals can be problematic due to the impurities present during the biosynthesis of these compounds [53]. During the bioprocess, impurities can lead to changes in the properties of the drug that can significantly reduce its effectiveness or even put the final user in danger [53]. In this study, the authors evaluated the effects of solvent, cooling rate, seeding and purity of the initial material on the final size distribution and purity of the crystals, where the whole process was monitored using UV-Vis spectroscopy [53].
Monitoring the utilisation of sugars during fermentation is a key aspect to optimise product development and maintain a healthy environment for microorganisms to grow and thrive [54]. However, an industry standard technique for the rapid, inexpensive and sensitive detection of sugars in complex media (containing a number of components: nutrients, cell debris, waste as well as the target products) has yet to be established [54]. A number of authors have evaluated the use of UV-Vis spectrophotometry for the quantitative determination of xylose during fermentation. Absorbance at the wavelength 671 nm shows a linear relationship with xylose concentration within a range of 0.1–0.5 g/L [54]. The authors concluded that UV-Vis spectroscopy was able to measure xylose concentration during fermentation [54].
Monascus pigments, a mixture of azaphilones mainly composed of red, orange and yellow pigments, are usually prepared in aqueous ethanol and were monitored using UV-Vis spectroscopy [55]. Monitoring of different types of anaerobic and aerobic bacteria capable of decomposition and fermentation of wastepaper cellulose using UV-Vis spectroscopy was also reported [56]. Samples (n = 40) were collected from varied environments (agricultural soil, wastewater, and normal soil) and three types of bacteria were diagnosis and isolated (Clostridium phytofermentous, Escherichia coli, and Pseudomonas aeruginosa) [56]. Physicochemical properties and the stability of melanin from Auricularia auricula fermentation broths were evaluated using UV-Vis spectroscopy [57]. The results, reported by Zhou et al., indicated that it was possible to monitor the fermentation broths for melanin powder [57].
Li and co-workers investigated the potential of UV-Vis as a means of monitoring the production of a biopharmaceutical, Lovastatin, which is a product of the submerged fermentation of Aspergillus terreus [58]. The industry standard analysis for monitoring the drug concentration in a fermentation broth is high-performance liquid chromatography (HPLC) [58]. However, this technique is expensive and prohibitively time-consuming, especially in the context of high-throughput sample analysis [58]. The authors reported a direct and simple dual-wavelength UV-Vis spectrophotometric method of quantifying lovastatin content in the fermentation broth [58]. Detection limits of 0.320 μg/mL in the standard solution and 0.490 μg/mL in the fermentation broth were observed (the quantification limit was 3.955 μg/mL for the broth sample) [58]. The authors concluded that dual-wavelength UV-Vis spectroscopy is a rapid, sensitive, accurate, and convenient method for quantifying lovastatin in fermentation broth [58]. Advantages and limitations of the use of UV-Vis spectroscopy to monitor bioprocess and fermentation are shown in Table 1.
6. Conclusions
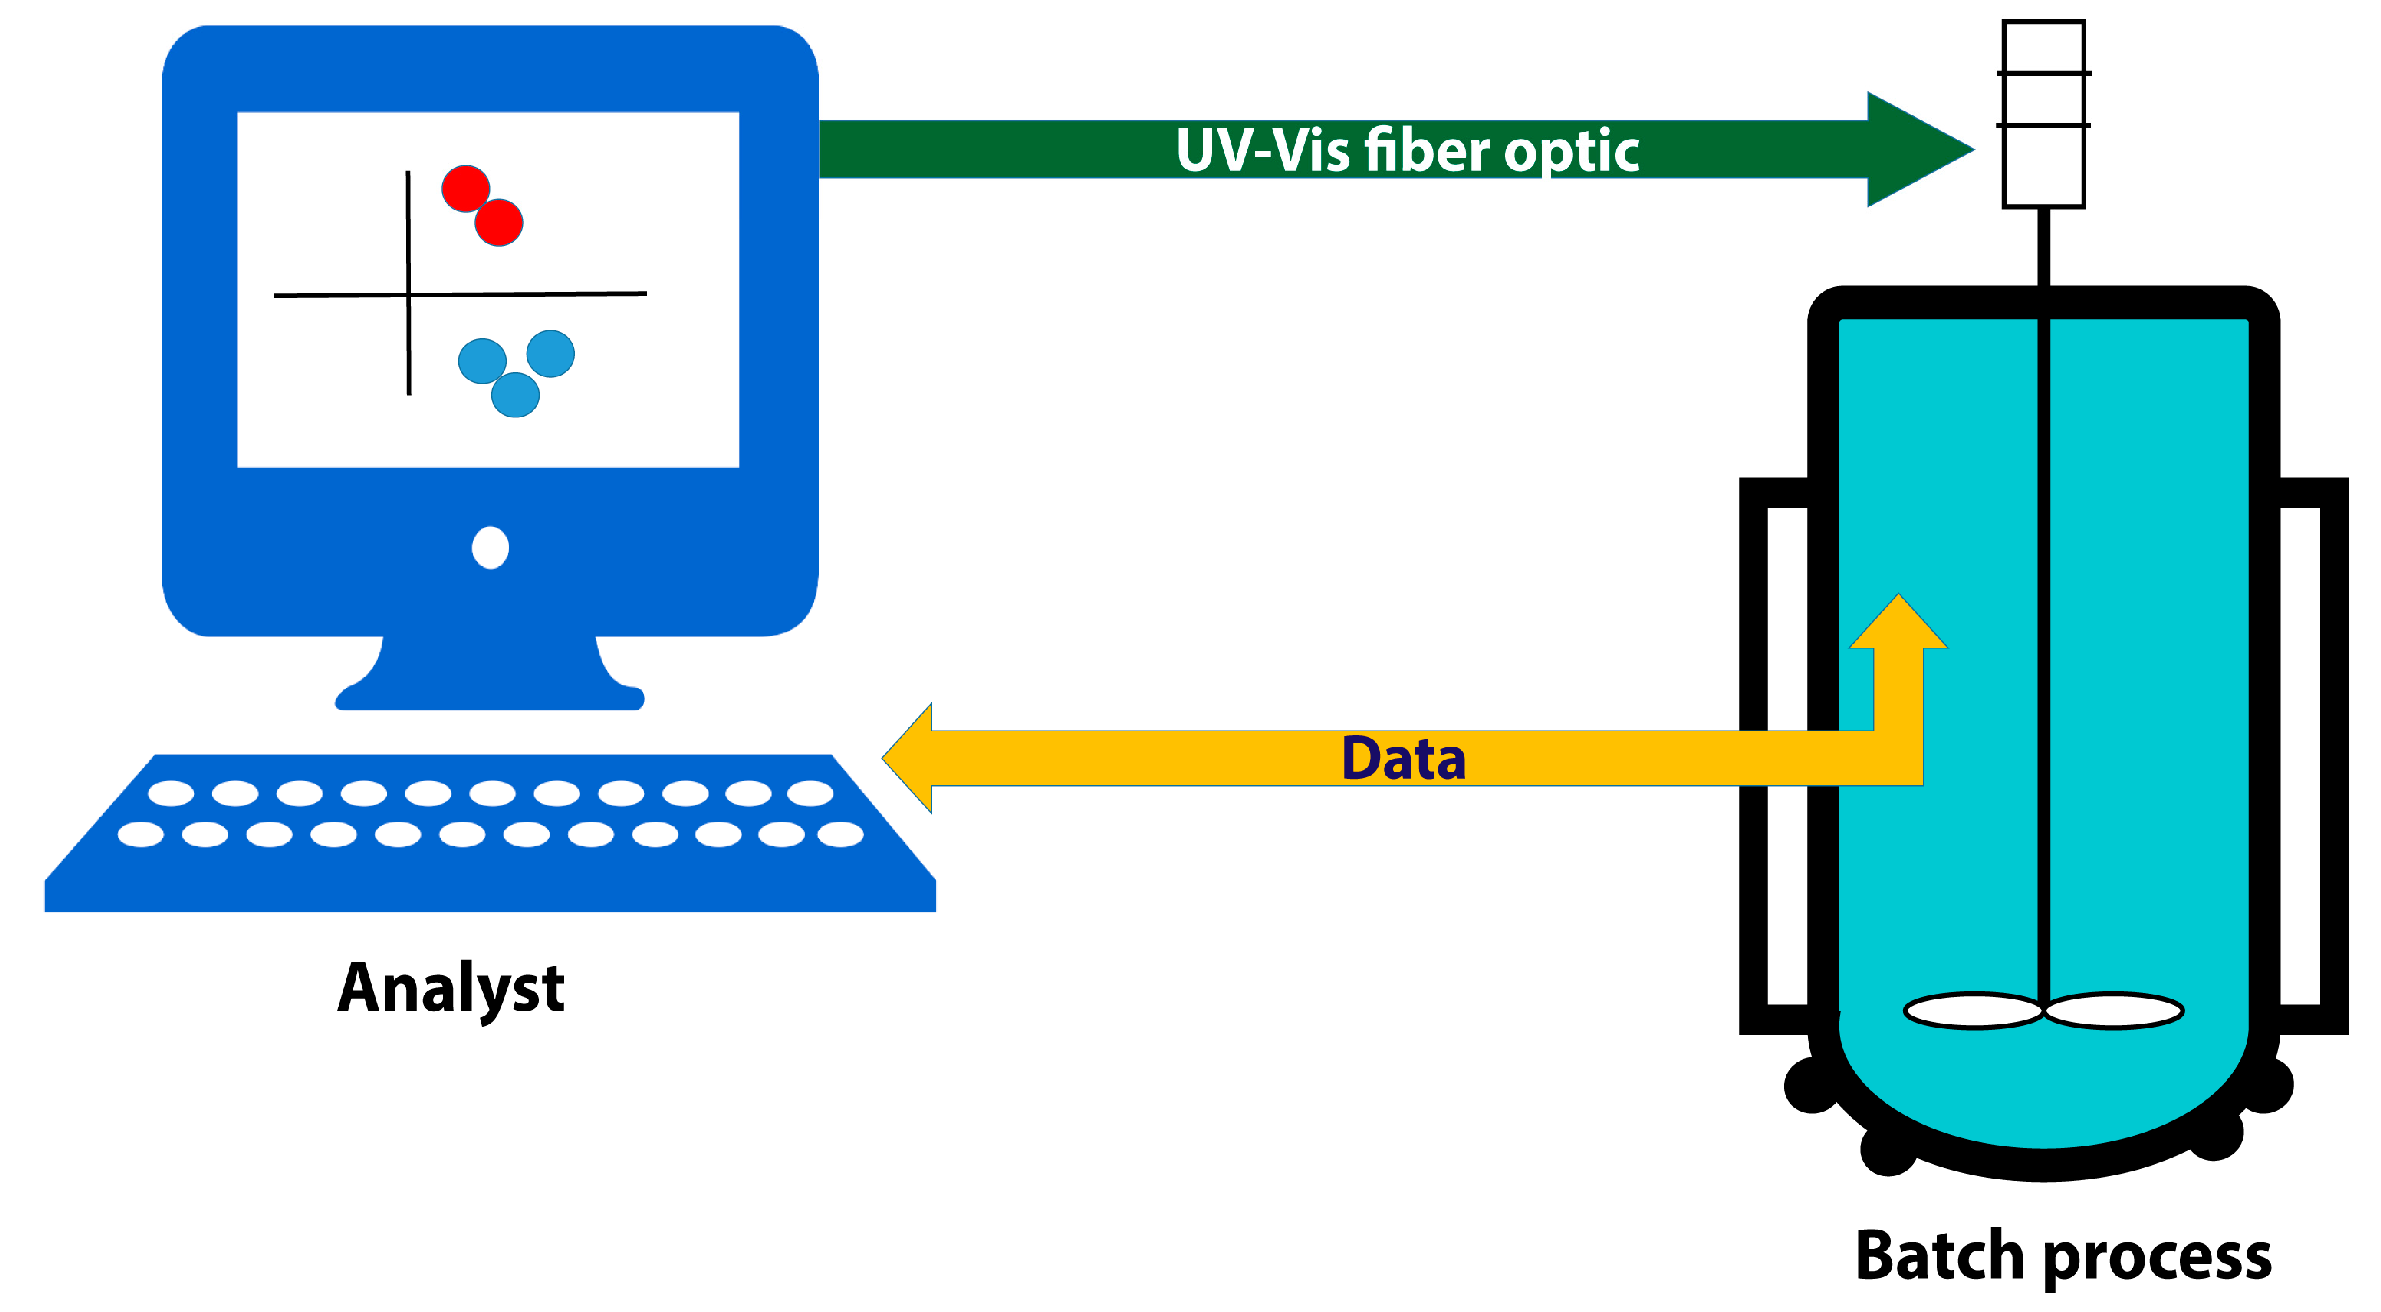
The advent of new types of UV-Vis instrumentation and sample presentation options has aided in the development of new possibilities to monitor fermentation processes in biological and food samples (see Figure 1). The literature reports several considerable successes to this end, particularly for the routine screening of typical constituents, such as anthocyanins, phenolics, sugars, and antioxidants, in complex food matrices. The challenges of isolating matrix interferences remain but the incorporation of data mining and multivariate data analysis techniques extends the possibilities of using UV-Vis spectroscopy in bioprocess and fermentation monitoring in the food industry.
Acknowledgments
Central Queensland University.
Author Contributions
Jessica Roberts, Aoife Power, Shaneel Chandra, James Chapman and Daniel Cozzolino did extensive literature review and wrote the manuscript, and corrected the revised draft.
Conflicts of Interest
The authors declare no conflict of interest.
References
- Kara, S.; Mueller, J.J.; Liese, A. Online analysis methods for monitoring of bioprocesses. Chim. Oggi 2011, 29, 38–41. [Google Scholar]
- Lourenço, N.D.; Lopes, J.A.; Almeida, C.F.; Sarraguça, M.C.; Pinheiro, H.M. Bioreactor monitoring with spectroscopy and chemometrics: A review. Anal. Bioanal. Chem. 2012, 404, 1211–1237. [Google Scholar] [CrossRef] [PubMed]
- Bellon-Maurel, V.; Orliac, O.; Christen, P. Sensors and measurements in solid state fermentation: A review. Process Biochem. 2003, 38, 881–896. [Google Scholar] [CrossRef]
- Simon, L.L.; Pataki, H.; Marosi, G.; Meemken, F.; Hungerbühler, K.; Baiker, A. Assessment of recent process analytical technology (PAT) trends: A multiauthor review. Org. Process Res. Dev. 2015, 19, 3–62. [Google Scholar] [CrossRef]
- Rathore, A.S.; Bhambure, R.; Ghare, V. Process analytical technology (PAT) for biopharmaceutical products. Anal. Bioanal. Chem. 2010, 398, 137–154. [Google Scholar] [CrossRef] [PubMed]
- Glassey, J.; Gernaey, K.V.; Clemens, C.; Schulz, T.W.; Oliveira, R.; Striedner, G. Process analytical technology (PAT) for biopharmaceuticals. Biotechnol. J. 2011, 6, 369–377. [Google Scholar] [CrossRef] [PubMed] [Green Version]
- Bhambure, R.; Kumar, K.; Rathore, A.S. High-throughput process development for biopharmaceutical drug substances. Trends Biotechnol. 2011, 29, 127–135. [Google Scholar] [CrossRef] [PubMed]
- Ündey, C.; Ertunç, S.; Mistretta, T.; Looze, B. Applied advanced process analytics in biopharmaceutical manufacturing: Challenges and prospects in real-time monitoring and control. J. Process Control 2010, 20, 1009–1018. [Google Scholar] [CrossRef]
- Biechele, P.; Busse, C.; Solle, D.; Scheper, T.; Reardon, K. Sensor systems for bioprocess monitoring. Eng. Life Sci. 2015, 15, 469–488. [Google Scholar] [CrossRef]
- Becker, T.; Hitzmann, B.; Muffler, K.; Pörtner, R.; Reardon, K.F.; Stahl, F. Future aspects of bioprocess monitoring. Adv. Biochem. Eng. Biotechnol. 2006, 105, 249–293. [Google Scholar]
- Glindkamp, A.; Riechers, D.; Rehbock, C.; Hitzmann, B.; Scheper, T.; Reardon, K.F. Sensors in disposable bioreactors status and trends. Adv. Biochem. Eng. Biotechnol. 2010, 115, 145–169. [Google Scholar]
- Vojinovic, V.; Cabral, J.M.S.; Fonseca, L.P. Real-time bioprocess monitoring: Part I: In situ sensors. Sens. Actuators B Chem. 2006, 114, 1083–1091. [Google Scholar] [CrossRef]
- Gordon, R.; Cozzolino, D.; Chandra, S.; Power, A.; Roberts, J.J.; Chapman, J. Analysis of Australian Beers using fluorescence spectroscopy. Beverages 2017, 3, 57. [Google Scholar] [CrossRef]
- Chandra, S.; Chapman, J.; Power, A.; Roberts, J.J.; Cozzolino, D. Origin and regionality of wines-The role of molecular spectroscopy. Food Anal. Methods 2017, 10, 3947–3955. [Google Scholar] [CrossRef]
- Alford, J.S. Bioprocess control: Advances and challenges. Comput. Chem. Eng. 2006, 30, 1464–1475. [Google Scholar] [CrossRef]
- Vandenberg, F.W.J.; Vanosenbruggen, W.A.; Smilde, A.K. Process analytical chemistry in the distillation industry using near-infrared spectroscopy. Process Control Qual. 1997, 9, 51–57. [Google Scholar]
- Workman, J.; Koch, M.; Veltkamp, D. Process analytical chemistry. Anal. Chem. 2005, 77, 3789–3806. [Google Scholar] [CrossRef] [PubMed]
- Teixeira, A.P.; Oliveira, R.; Alves, P.M.; Carrondo, M.J. Advances in on-line monitoring and control of mammalian cell cultures: Supporting the PAT initiative. Biotechnol. Adv. 2009, 27, 726–732. [Google Scholar] [CrossRef] [PubMed]
- Codgill, R.P.; Anderson, C.A.; Drennen, J.K., III. Using NIR spectroscopy as an integrated PAT tool. Spectroscopy 2004, 19, 104–109. [Google Scholar]
- Swarbrick, B. Process analytical technology: A strategy for keeping manufacturing viable in Australia. Vib. Spectrosc. 2007, 44, 171–178. [Google Scholar] [CrossRef]
- Lopes, J.A.; Costa, P.F.; Alves, T.P.; Menezes, J.C. Chemometrics in bioprocess engineering: Process analytical technology (PAT) applications. Chemom. Intell. Lab. Syst. 2004, 74, 269–275. [Google Scholar] [CrossRef]
- Folestad, S. Bridging Science and Regulation—The PAT (R) Evolution in Pharma Industry. In Proceedings of the 2009 Advances in Process Analytics and Control Technology (APACT09), Glasgow, Scotland, 5–7 May 2009. [Google Scholar]
- Chena, Z.; Lovettb, D.; Morrisc, J. Process analytical technologies and real time process control a review of some spectroscopic issues and challenges. J. Process Control 2011, 21, 1467–1482. [Google Scholar] [CrossRef]
- Rosas, J.G.; Blanco, M.; González, J.M.; Alcalà, M. Real-time determination of critical quality attributes using near-infrared spectroscopy: A contribution for Process Analytical Technology (PAT). Talanta 2012, 97, 163–170. [Google Scholar] [CrossRef] [PubMed]
- Noiseux, I.; Long, W.; Cournoyer, A.; Vernon, M. Simple fiber-optic-based sensors for process monitoring: An application in wine quality control monitoring. Appl. Spectrosc. 2009, 58, 1010–1019. [Google Scholar] [CrossRef] [PubMed]
- Marison, I.; Hennessy, S.; Foley, R.; Schuler, M.; Sivaprakasam, S.; Freeland, B. The Choice of Suitable Online Analytical Techniques and Data Processing for Monitoring of Bioprocesses measurement, monitoring, modelling and control of bioprocesses. Adv. Biochem. Eng. Biotechnol. 2013, 132, 249–280. [Google Scholar] [PubMed]
- Paul, A.; Carl, P.; Westad, F.; Voss, J.-P.; Maiwald, M. Towards Process Spectroscopy in Complex Fermentation Samples and Mixtures. Chem. Ing. Tech. 2016, 88, 756–763. [Google Scholar] [CrossRef]
- Beutel, S.; Henkel, S. In situ sensor techniques in modern bioprocess monitoring. Appl. Microbiol. Biotechnol. 2011, 91, 1493–1505. [Google Scholar] [CrossRef] [PubMed]
- Schmid, F.X. Biological macromolecules: UV-visible spectrophotometry. In Encyclopedia of Life Sciences; Robinson, S., Ayres, E., Eds.; Macmillan Publishers: London, UK, 2001; pp. 1–4. [Google Scholar]
- Esfandiary, R.; Middaugh, C.R. Ultraviolet absorption spectroscopy. In Analysis of Aggregates and Particles in Protein Pharmaceuticals; Mahler, H.C., Jiskoot, W., Eds.; John Wiley & Sons: Hoboken, NJ, USA, 2012; pp. 171–200. [Google Scholar]
- Bunney, J.; Williamson, S.; Atkin, D.; Jeanneret, M.; Cozzolino, D.; Chapman, J. The use of biosensors in food analysis. Curr. Res. Nutr. Food Sci. J. 2017, 5, 183–195. [Google Scholar] [CrossRef]
- Swinehart, D.F. The Beer-Lambert law. J. Chem. Educ. 1962, 39, 333. [Google Scholar] [CrossRef]
- Claßen, J.; Aupert, F.; Reardon, K.F.; Solle, D.; Scheper, T. Spectroscopic sensors for in-line bioprocess monitoring in research and pharmaceutical industrial application. Anal. Bioanal. Chem. 2017, 409, 651–666. [Google Scholar] [CrossRef] [PubMed]
- Noui, L.; Hill, J.; Keay, P.J.; Wang, R.Y.; Smith, T.; Yeung, K.; Habib, G.; Hoare, M. Development of a high resolution UV spectrophotometer for at-line monitoring of bioprocesses. Chem. Eng. Process 2002, 41, 107–114. [Google Scholar] [CrossRef]
- Cozzolino, D.; Cynkar, W.U.; Shah, N.; Smith, P. Multivariate data analysis applied to spectroscopy: Potential application to juice and fruit quality. Food Res. Int. 2011, 44, 1888–1896. [Google Scholar] [CrossRef]
- Esbensen, K.H. Multivariate Data Analysis in Practice; CAMO Process: Oslo, Norway, 2002. [Google Scholar]
- Martens, H.; Naes, T. Multivariate Calibration; John Wiley & Sons Ltd.: New York, NY, USA, 1996. [Google Scholar]
- Brereton, R.G. Introduction to multivariate calibration in analytical chemistry. Analyst 2000, 125, 2125–2154. [Google Scholar] [CrossRef]
- Brereton, R.G. Experimental Design. In Applied Chemometrics for Scientists; John Wiley & Sons, Ltd.: New York, NY, USA, 2007; pp. 9–62. [Google Scholar]
- Wold, S. Chemometrics; what do we mean with it, and what do we want from it? Chemom. Intell. Lab. Syst. 1995, 30, 109–115. [Google Scholar] [CrossRef]
- Kourti, T. Application of latent variable methods to process control and multivariate statistical process control in industry. Int. J. Adapt. Control Signal Process. 2005, 19, 213–246. [Google Scholar] [CrossRef]
- Pons, M.N.; Le Bonte, S.; Potier, O. Spectral analysis and fingerprinting for biomedia characterisation. J. Biotechnol. 2004, 113, 211–230. [Google Scholar] [CrossRef] [PubMed]
- Cozzolino, D.; Chandra, S.; Roberts, J.J.; Power, A.; Rajapaksha, P.; Ball, N.; Gordon, R.; Chapman, J. There is gold in them hills: Predicting potential acid mine drainage events through the use of chemometrics. Sci. Total Environ. 2018, 619, 1464–1472. [Google Scholar] [CrossRef]
- Chandra, S.; Chapman, J.; Power, A.; Roberts, J.J.; Cozzolino, D. The application of state-of-the-art analytic tools (biosensors and spectroscopy) in beverage and food fermentation process monitoring. Fermentation 2017, 3, 50. [Google Scholar] [CrossRef]
- Munck, L.; Norgaard, L.; Engelsen, S.B.; Bro, R.; Andersson, C.A. Chemometrics in food science—A demonstration of the feasibility of a highly exploratory, inductive evaluation strategy of fundamental scientific significance. Chemom. Intell. Lab. Syst. 1998, 44, 31–60. [Google Scholar] [CrossRef]
- Rathore, A.S.; Singh, S.K. Use of multivariate data analysis in bioprocessing. BioPharm Int. 2015, 28, 26. [Google Scholar]
- Jaumot, J.; Vives, M.; Gargallo, R. Application of multivariate resolution methods to the study of biochemical and biophysical processes. Anal. Biochem. 2004, 327, 1–13. [Google Scholar] [CrossRef] [PubMed]
- Cozzolino, D.; Parker, M.; Dambergs, R.G.; Herderich, M.; Gishen, M. Chemometrics and visible-near infrared spectroscopic monitoring of red wine fermentation in a pilot scale. Biotechnol. Bioeng. 2006, 95, 1101–1107. [Google Scholar] [CrossRef] [PubMed]
- Fakharudin, A.S.; Embong, A.; Hamid, R.A.; Hamza, M.A.M.; Ajid, K.A.; Ali, N.M.; Satari, S.Z.; Sulaiman, J.; Zain, W.S.W.M. Optimisation of fermentation process using data mining techniques for small-medium industry. In Proceedings of the International Conference on Intelligent and Advanced Systems, Kuala Lumpur, Malaysia, 25–28 November 2007; pp. 273–275. [Google Scholar]
- Tudo, J.L.A.; Buica, A.; Nieuwoudt, H.; Aleixandre, J.L.; du Toit, W. Spectrophotometric analysis of phenolic compounds in grapes and wines. J. Agric. Food Chem. 2017, 65, 4009–4026. [Google Scholar] [CrossRef] [PubMed]
- Shrake, N.L.; Amirtharajah, R.; Brenneman, C.; Boulton, R.; Knoesen, A. In-line measurement of color and total phenolics during red wine fermentations using a light-emitting diode sensor. Am. J. Enol. Vitic. 2014, 65, 463–470. [Google Scholar] [CrossRef]
- Ito, S.; Barchi, A.C.; Escaramboni, B.; Neto, P.D.; Herculano, R.D.; Borges, F.A.; Miranda, M.C.R.; Núñez, E.G.F. UV/Vis spectroscopy combined with chemometrics for monitoring solid-state fermentation with Rhizopus microsporus var. oligosporus. J. Chem. Technol. Biotechnol. 2017, 92, 2563–2572. [Google Scholar] [CrossRef]
- Saleemi, A.N.; Rielly, C.D.; Nagy, Z.K. Comparative investigation of supersaturation and automated direct nucleation control of crystal size distribution using ATR-Uv/Vis spectroscopy and FBRM. Cryst. Growth Des. 2012, 12, 1792–1807. [Google Scholar] [CrossRef]
- Takahashi, M.B.; Leme, J.; Caricati, C.P.; Tonso, A.; Fernández-Núñez, E.G.; Rocha, J.C. Artificial neural network associated to UV/Vis spectroscopy for monitoring bioreactions in biopharmaceutical processes. Bioprocess Biosyst. Eng. 2015, 38, 1045–1054. [Google Scholar] [CrossRef] [PubMed]
- Shi, K.; Chen, G.; Pistolozzi, M.; Xia, F.; Wu, Z. Improved analysis of Monascus pigments based on their pH-sensitive UV-Vis absorption and reactivity properties. Food Addit. Contam. A Chem. Anal. Control Expo. Risk Assess. 2016, 33, 1396–1401. [Google Scholar] [CrossRef] [PubMed]
- Neamah Al Azawy, A.; Khadom, A.A.; Sattar Abdul Jabbar, A. Efficiency of some types of bacteria on producing biofuels from wastes of writing paper. J. Environ. Chem. Eng. 2016, 4, 2816–2819. [Google Scholar] [CrossRef]
- Zou, Y.; Li, L.; Liu, C. Physicochemical properties and stability of melanin from Auricularia Auricula fermentation broths. Carpath. J. Food Sci. Technol. 2015, 7, 149–154. [Google Scholar]
- Li, S.-W.; Song, H.-P.; Leng, Y. Rapid determination of lovastatin in the fermentation broth of Aspergillus terreus using dual-wavelength UV spectrophotometry. Pharm. Biol. 2014, 52, 129–135. [Google Scholar] [CrossRef] [PubMed]
Figure 1.
Schematic representation of UV-Vis process monitoring.


Table 1.
Advantages and limitation of the use of UV-Vis spectroscopy for the analysis and monitoring of bioprocess and fermentation.
Table 1.
Advantages and limitation of the use of UV-Vis spectroscopy for the analysis and monitoring of bioprocess and fermentation.
| Item | Advantages | Limitations |
|---|---|---|
| Samples and sampling | Allow the continuous sampling of the process | The sample and other interferences (e.g., damage cells, turbidity) are also analysed |
| Hardware | Commercially available instrumentation easily available | Type of instrument, fibre optic options, highly dependent on the type of sample (e.g., liquid, semisolid, turbid media). |
| Routine use | Easy to implement | Highly dependent on the type of sample, and process. |
| Data analysis | A lot of information and data can be collected to monitor the process | Not only information about the sample is collected, interferences, noise is also collected during the process. |
| Training | Easy to use in routine | Education and high understanding of the system, interpretation of the data and interferences. |
| Chemical compounds and properties | Several compounds can be measured | Limit of detection and quantification, depending on the process and sample. |
© 2018 by the authors. Licensee MDPI, Basel, Switzerland. This article is an open access article distributed under the terms and conditions of the Creative Commons Attribution (CC BY) license (http://creativecommons.org/licenses/by/4.0/).
Share and Cite
MDPI and ACS Style
Roberts, J.; Power, A.; Chapman, J.; Chandra, S.; Cozzolino, D. The Use of UV-Vis Spectroscopy in Bioprocess and Fermentation Monitoring. Fermentation 2018, 4, 18. https://doi.org/10.3390/fermentation4010018
AMA Style
Roberts J, Power A, Chapman J, Chandra S, Cozzolino D. The Use of UV-Vis Spectroscopy in Bioprocess and Fermentation Monitoring. Fermentation. 2018; 4(1):18. https://doi.org/10.3390/fermentation4010018
Chicago/Turabian StyleRoberts, Jessica, Aoife Power, James Chapman, Shaneel Chandra, and Daniel Cozzolino. 2018. "The Use of UV-Vis Spectroscopy in Bioprocess and Fermentation Monitoring" Fermentation 4, no. 1: 18. https://doi.org/10.3390/fermentation4010018
Note that from the first issue of 2016, this journal uses article numbers instead of page numbers. See further details here.