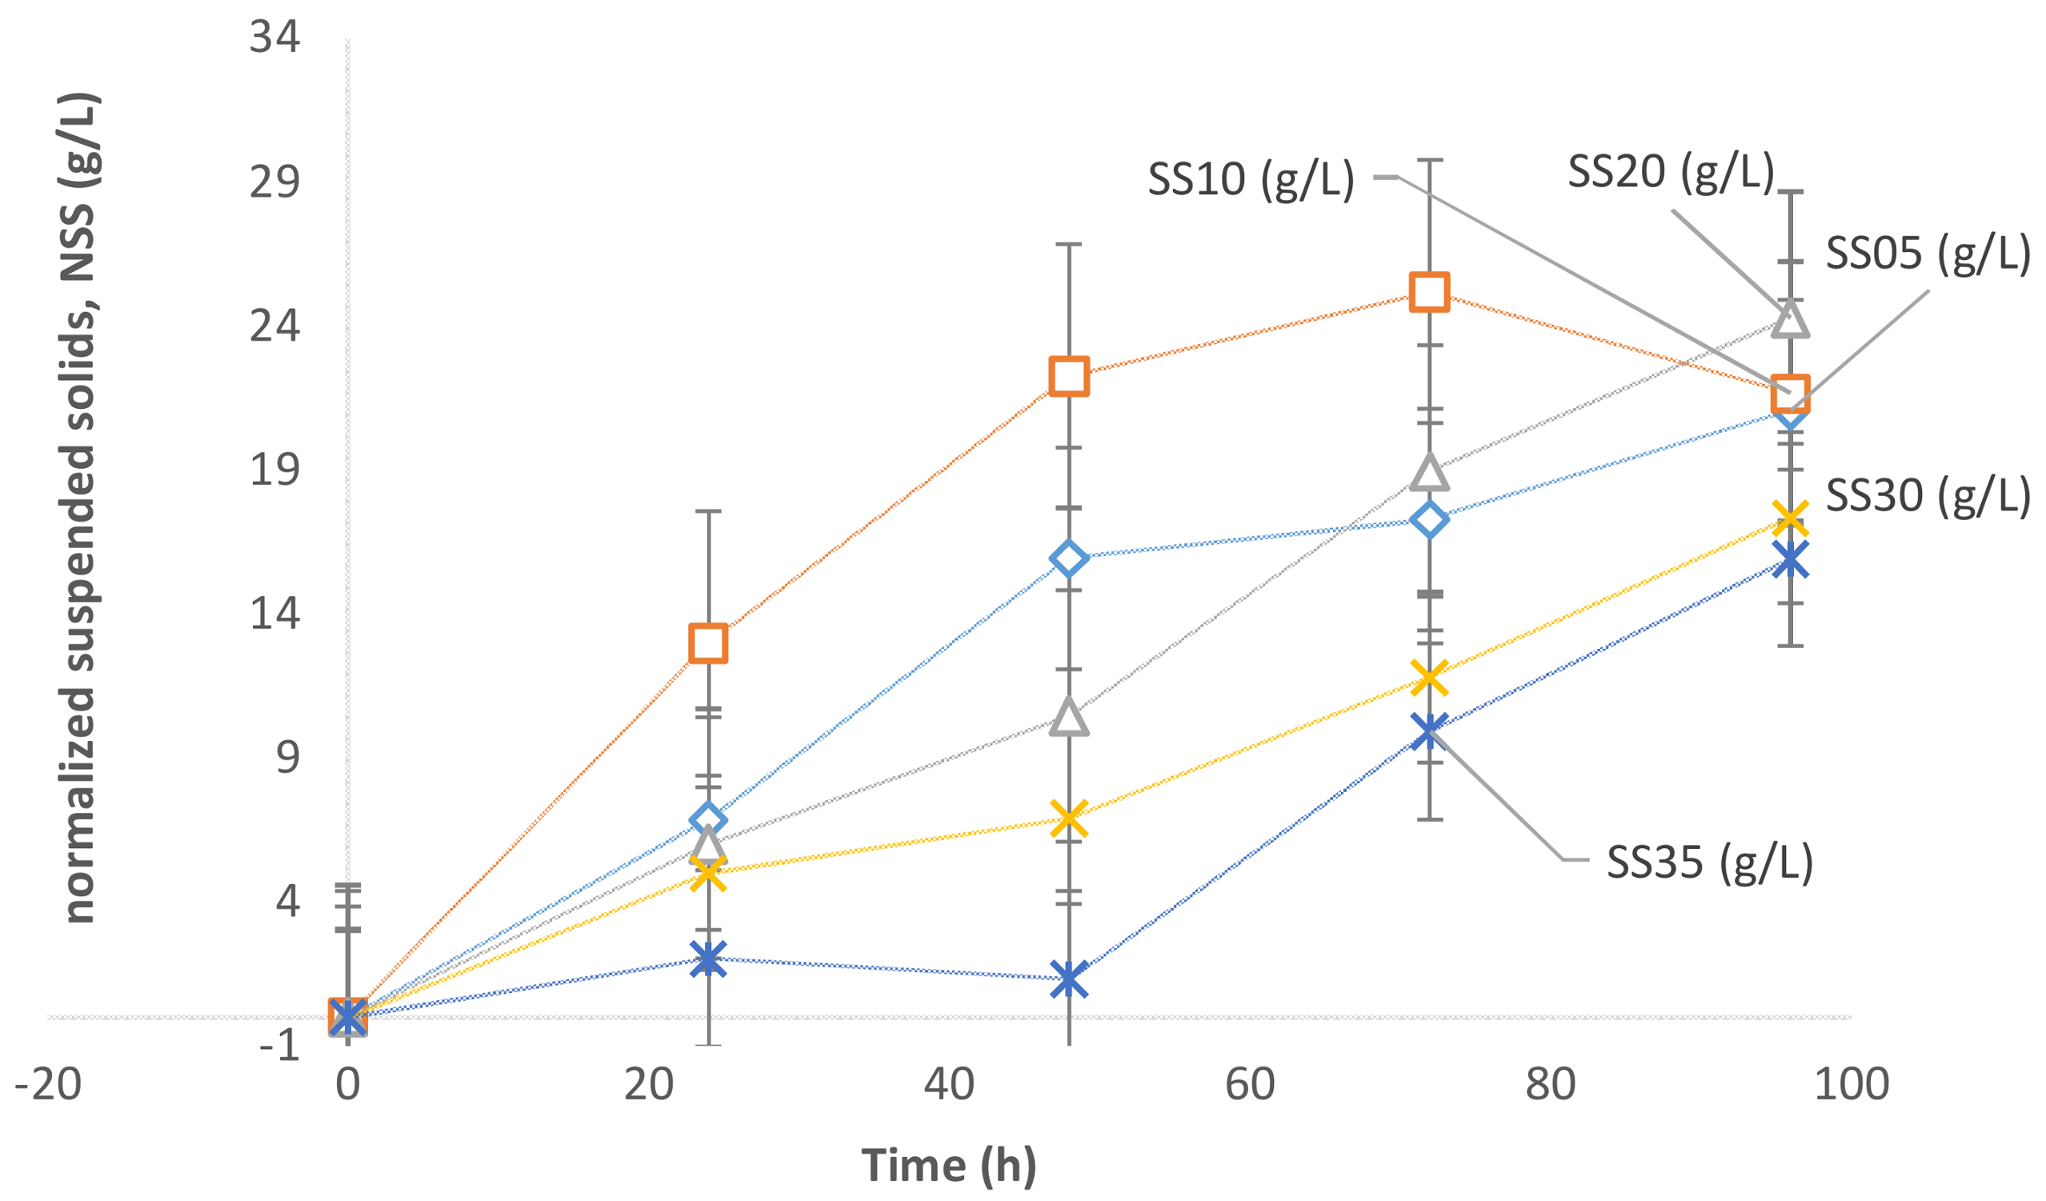
Article

Effect of Sludge Concentration and Crude Glycerol Matrix as a Substrate on the Production of Single-Cell Oil by Oleaginous Yeast Yarrowia lipolytica SKY7

by
Saurabh Kumar Ram
*,
Rajeshwar Dayal Tyagi
and
Patrick Drogui
INRS ETE, 490 rue de la Couronne, Quebec City, QC G1K 9A9, Canada
*
Author to whom correspondence should be addressed.
Fermentation 2018, 4(2), 24; https://doi.org/10.3390/fermentation4020024
Submission received: 28 February 2018 / Revised: 24 March 2018 / Accepted: 29 March 2018 / Published: 2 April 2018
(This article belongs to the Special Issue Microbial Production of Added-value Products from Renewable Resources)

Abstract

:
The disposal of excess crude glycerol produced by the booming biodiesel industry and wastewater sludge solid waste has become a severe problem, and alternate routes of use and valorization of these waste byproducts are needed. The use of cheaply available wastewater sludge solids in fermentation media is very much desirable to reduce the cost of production. The strains of Yarrowia lipolytica can assimilate a wide array of waste substrates, such as crude glycerol, waste cooking oil, starch wastewater, and cellulosic. This study optimized the concentration of wastewater sludge solids (5–35 g/L) to be used with crude glycerol in fermentation media to produce microbial oil as feedstock for biodiesel production. The results indicated that 20 g/L of sludge solids with 40 g/L of crude glycerol resulted in highest lipid content of 29.35% in 96 h. Further, assuming wet extraction of lipids, it was found that at least 11.2% or higher lipid content is required for this process to have an overall positive net solid waste reduction. Insignificant inhibition was observed by the crude glycerol used in this study as compared to pure glycerol, which proves it to be an adequate source of carbon substrate for lipid production.

Graphical Abstract

1. Introduction

Global energy demands are increasing day by day, but the non-renewable fuel resources are depleting rapidly and will be exhausted in the near future. Therefore, it is imperative to find alternate renewable and sustainable fuel resources [1]. Biodiesel produced from microbial feedstock oil has proven itself to be a strong candidate to replace petrochemical fuels. The biodiesel industry is rapidly expanding due to increasing awareness towards the alarming situation of global warming and the “food versus fuel debate” among policymakers, stakeholders, and the scientific community, giving rise to rejuvenated interest to develop a green biotechnological process for biodiesel feedstock microbial oil.
Despite its tremendous potential and ecological advantage, biodiesel production using microbial oil has been limited by the significant cost incurred by expensive carbon sources, such as glucose, to produce single-cell oil (SCO). According to various techno-economic reports, over 50% of the operational cost is realized due to the raw material (carbon and nitrogen sources) used in fermentation [2]. It is essential to find cheaper carbon and nitrogen sources to make the SCO production process economical.
Due to the increasing global population, the wastewater treatment sector is facing a monotonously increasing problem of an unmanageable volume of wastewater sludge for disposal. Different researchers have developed many different processes to valorize the nutritional components present in wastewater sludge to produce bioplastics, biodiesel, a biopesticide, and extra polysaccharides [3,4,5,6,7].
The biodiesel industry has been exponentially expanding due to the increasing amount of awareness about global warming, the preservation of ecology, and sustainable development. While biodiesel provides a green alternative to current existing petrochemical fuel resources, due to the expansion of the biodiesel industry, an increasing amount of crude glycerol, a waste product of the biodiesel industry, is also generated [1,8]. Researchers have also tried to valorize the crude glycerol generated by biodiesel industry to produce other value-added products [3,7,8,9,10].
Recently, Zhang et al. [7] attempted to solve these two problems by developing a process for the production of single-cell oil using Trichosporon oleaginosus. The study simultaneously used crude glycerol and municipal sludge as a source of carbon and other nutrients. Deriving the concept of the utilization of crude glycerol and sludge together from Zhang et al.’s [7] study, when the combination of crude glycerol and sludge solids were applied (without any further supplementation of minerals or other nutrients) to the yeast Yarrowia lipolytica SKY7, the fungal strain was strongly inhibited by the media. A bioreactor run (10 L working volume) was effectuated with 35 g/L of sludge suspended solids as nutrient media, and it was supplemented with the crude glycerol used in this study as a carbon source in fed-batch mode (data not presented). When the media was inoculated with an actively growing culture of Yarrowia lipolytica (used in this study), no lipid accumulation occurred. In fact, a monotonously decreasing concentration of suspended solids was observed. Since glycerol was fed at different intervals (every 12 h) at a maximum concentration ranging between 10 and 20 g/L, no substrate inhibition was suspected. Under the microscope, the cells were actively viable. No increase in suspended solids (SS) was attributed to either a lack of minerals or an inhibitory effect of sludge hydrolysate components on microbial growth of Y. lipolytica. The SS decreased from 24 to 5 g/L monotonously in 96 h. Therefore, this study attempts to optimize the suspended solid concentrations of the sludge solids (5–35 g/L) to be used to produce single-cell oil using yeast Yarrowia lipolytica. Different sludge solid concentrations were used to prepare sludge media and were tested in shake flasks. To avoid any skepticism accounting for the limitation of nutrients, the media was supplemented with minerals and trace elements to see the independent effect of suspended solid concentrations.

2. Materials and Methods

2.1. Sludge Source

Secondary sludge was collected from the municipal wastewater treatment plant, CUQ (Communauté Urbaine de Québec), Quebec City on Monday, 8 December 2017. The sludge concentration was ranging between 5 and 10 g/L at the source. Therefore, the sludge was settled for 30 min at the site during collection. The sludge was concentrated by settling to 24 g/L; thereafter, it was centrifuged (9000× g for 15 min) to obtain a concentrated slurry of 47 g/L. The characteristics of the raw sludge are presented in Table 1.

2.2. Oleaginous Yeast

The oleaginous yeast Yarrowia lipolytica SKY7, isolated from a forest soil sample (Forest Canada) by the previous researcher Kuttiraja et al. [3], was used. The seed culture was revived in yeast extract-peptone-dextrose (YPD) media and adapted in sludge media before being used as the inoculum in the experimental tests. A single colony of Y. lipolytica was inoculated in 30 mL of YPD media and incubated for 24 h at 28 °C in a rotary shaker incubator with continuous agitation of 200 rpm. The inoculum was prepared in sludge media supplemented with crude glycerol (40 g/L).

2.3. Media Preparation

The sludge media was prepared using different sludge solid concentrations (5, 10, 20, 30, and 35 g/L). Sludge was sterilized in an autoclave at 121 °C for 30 min. The sludge’s thermal hydrolysis was assisted with the addition of base (NaOH, 0.11 g/g-sludge). The composition of sludge media used was (in g/L), sludge solids 5–35; Na2PO4 3.2; K2HPO4 8; CaCl2 2; MgSO4·7H2O 2; NH4Cl 0.74; Glycerol 40; and 1000 µL of 1000× trace elements solution. The 1000× trace element solution comprises (in g/L) FeSO4 5.5; MnSO4 0.5; CuSO4 1; ZnSO4 2; MoCl3 0.2; the trace element solution was acidified by using hydrochloric acid resulting a 0.5 M HCl solution. Assuming an insignificant contribution of carbon and nitrogen from the sludge solids, the final C:N ratio of the sludge media is 100 (moles-C/moles-N). The crude glycerol used in this experiment was obtained from Bio-Liq, Quebec, Canada. The crude glycerol contained 675 g/L of glycerol. All the other components, such as methanol, free fatty acids (FFA), catalyst, and soap, were present in trace (<1–2 g/L) quantities (Table 2).

2.4. Experimental Plan

Five different flasks were prepared with different sludge-suspended solid concentrations, namely SS05, SS10, SS20, SS30, and SS35. The flasks contained 5, 10, 20, 30, and 35 g/L of sludge solids, respectively. Additionally, two more flasks SSCG and SSPG (without sludge) were prepared using crude glycerol and pure glycerol, respectively. The flasks SSPG and SSCG were used to understand the effect of the components of the crude glycerol matrix on growth and lipid production by the oleaginous yeast. The pH of the flasks was initially adjusted to 6.8; thereafter, the flasks were inoculated with 10% v/v inoculum of yeast Yarrowia lipolytica. The flasks were incubated at 28 °C for 4 days in a rotary shaking incubator with an agitation of 200 rpm. Samples were collected every 24 h and were analyzed further.

2.5. Analytical Procedure

Periodic samples (V mL) collected from the flasks were analyzed for CFU (colony forming unit), pH, suspended solids, lipid, citric acid, and glycerol concentration. The samples were collected in pre-weighed (Wi) falcon tubes. The samples were centrifuged in differential centrifuge at 5000× g for 20 min to collect clear biomass-free supernatant. The supernatant was collected in a fresh falcon tube for further analysis. The obtained biomass was dried at 80 °C. The final weight of the falcon tubes (Wf) was noted down, and the biomass concentration was calculated according to the Equation (1).
S S = W f W i V × 1000
The collected supernatant was used to estimate the pH using pH-Probe. A small fraction of fermentation broth was serially diluted in 0.85% NaCl solution and used to estimate the CFU/mL by using the spread plating method. Lipid analysis was performed by extracting the lipid from the suspended solids using the chloroform-methanol extraction method [11]. The residual glycerol present in the supernatant fraction of the sample was estimated by using the spectrophotometer method as used in Kuhn, et al. [12]. All analyses were performed in duplicate and average values have been presented in this study.
The kinetic parameters were calculated using the experimental data points. For any two data points, for example, at time t1 (X1, S1, P1) and t2 (X2, S2, P2), the specific rates were calculated as per the following equations (Equations (2)–(7)).
t a v g = ( t 1 + t 2 ) / 2
X a v g = ( X 1 + X 2 ) / 2
μ = 1 X × ( d X d t ) = 1 X a v g × ( X 2 X 1 ) ( t 2 t 1 )
ř = 1 X × ( d P d t ) = 1 X a v g × ( P 2 P 1 ) ( t 2 t 1 )
Š = 1 X × ( d S d t ) = 1 X a v g × ( S 2 S 1 ) ( t 2 t 1 )
Y X S = ( X 2 X 1 ) ( S 2 S 1 )
Here X, S, and P are the biomass, the substrate, and the product, respectively; µ is the specific biomass growth rate; Š is the specific substrate consumption rate; ř is the specific product formation rate; and YX/S is (biomass yield or lipid) w.r.t the substrate.

2.6. Statistical Analysis

To evaluate the statistical significance of the variation pattern and the effect of changing suspended solid concentrations on the microbial growth of the yeast Y. lipolytica, one factor analysis of variance (ANOVA) was performed using the MS-Excel 2013 Data analysis tool. The test was performed with the null hypothesis that no effect of changing the sludge solid concentration will be observed on microbial growth. The test confidence value was set to 95% with α = 0.05. The validation of the hypothesis was performed using the standard Fisher ratio (F-test) for statistical variance.

3. Results

3.1. Biomass Growth

The normalized suspended solids (NSS) profiles in the case of all of the flask fermentations with different sludge solid concentrations are presented in Figure 1. In this context, normalized suspended solids (NSS) is the net increase in solid concentration obtained by subtracting the 0th-hour suspended solid concentration (after basic thermal sterilization) from the suspended solid concentration at any time, t.
The solid sludge concentrations depicted in Figure 1 (NSS) are solid concentrations, including intracellular lipids. In Figure 1, the suspended sludge concentration has a significant impact on the microbial growth of the yeast Yarrowia lipolytica. The maximum biomass was generated with a sludge concentration of 20 g/L (SS10). The net biomass generated was 24.29 g/L. The biomass, in this case, increased from an initial SS of 10.57 g/L (after sterilization) to a final biomass concentration of 34.86 g/L (Table 3). With further increase in sludge concentration beyond 20 g/L the net increase in biomass concentration decreases. Subsequently, the net biomass generated was in the order of (case of) 20 g/L > 10 g/L > 5 g/L > 30 g/L and 35 g/L with a net biomass value of 24.29, 21.66, 21.08, 17.34, and 15.93, respectively. The results indicate a clear inhibition to the microbial growth of the yeast Y. lipolytica at concentrations higher than 20 g/L.
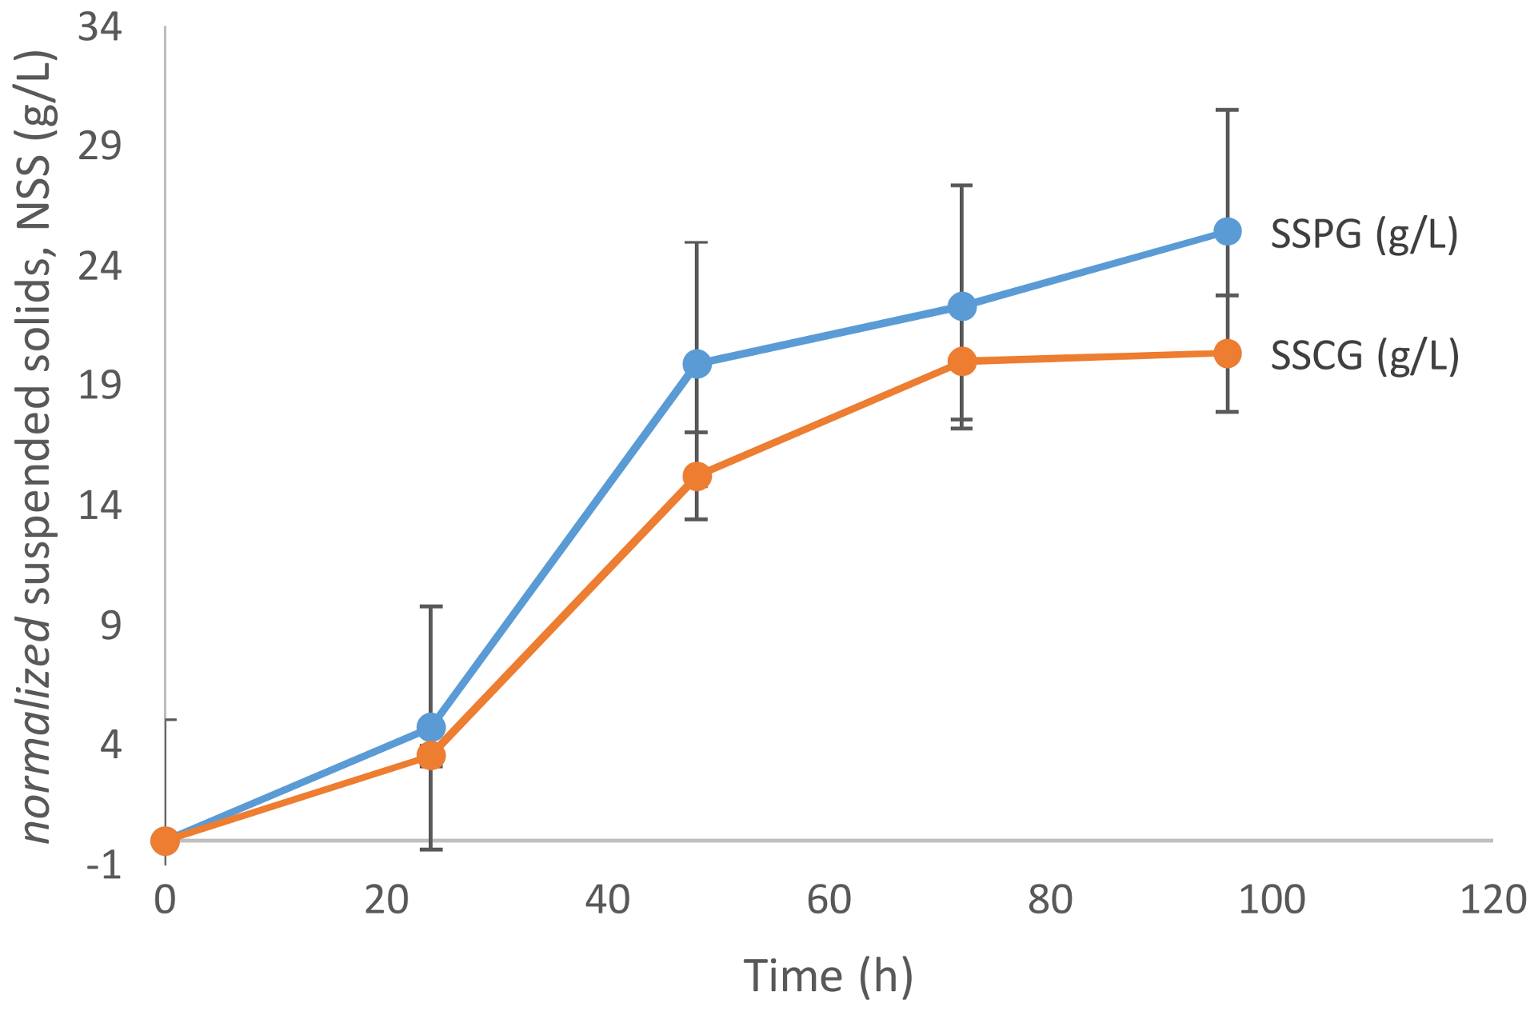
As is evident from Figure 2, the biomass growth in the presence of pure glycerol is relatively higher than that in crude glycerol. The maximum biomass concentration achieved in the case of crude glycerol is 20.36 g/L after 96 h of fermentation, while in the case of pure glycerol the maximum biomass concentration observed was 25.45 g/L. Papanikolaou and Aggelis [13] in their study found that crude glycerol (65% w/w glycerol content) poses some inhibition to the microbial growth of Y. lipolytica due to its matrix composition. Despite the probable matrix inhibition, the growth with crude and pure glycerol was comparable. This can be attributed to the fact that the strains of Y. lipolytica have higher tolerance towards the major impurities found in crude glycerol-like methanol, free fatty acids (FFA), basic salts (NaOH, KOH, and methoxides), and soap.
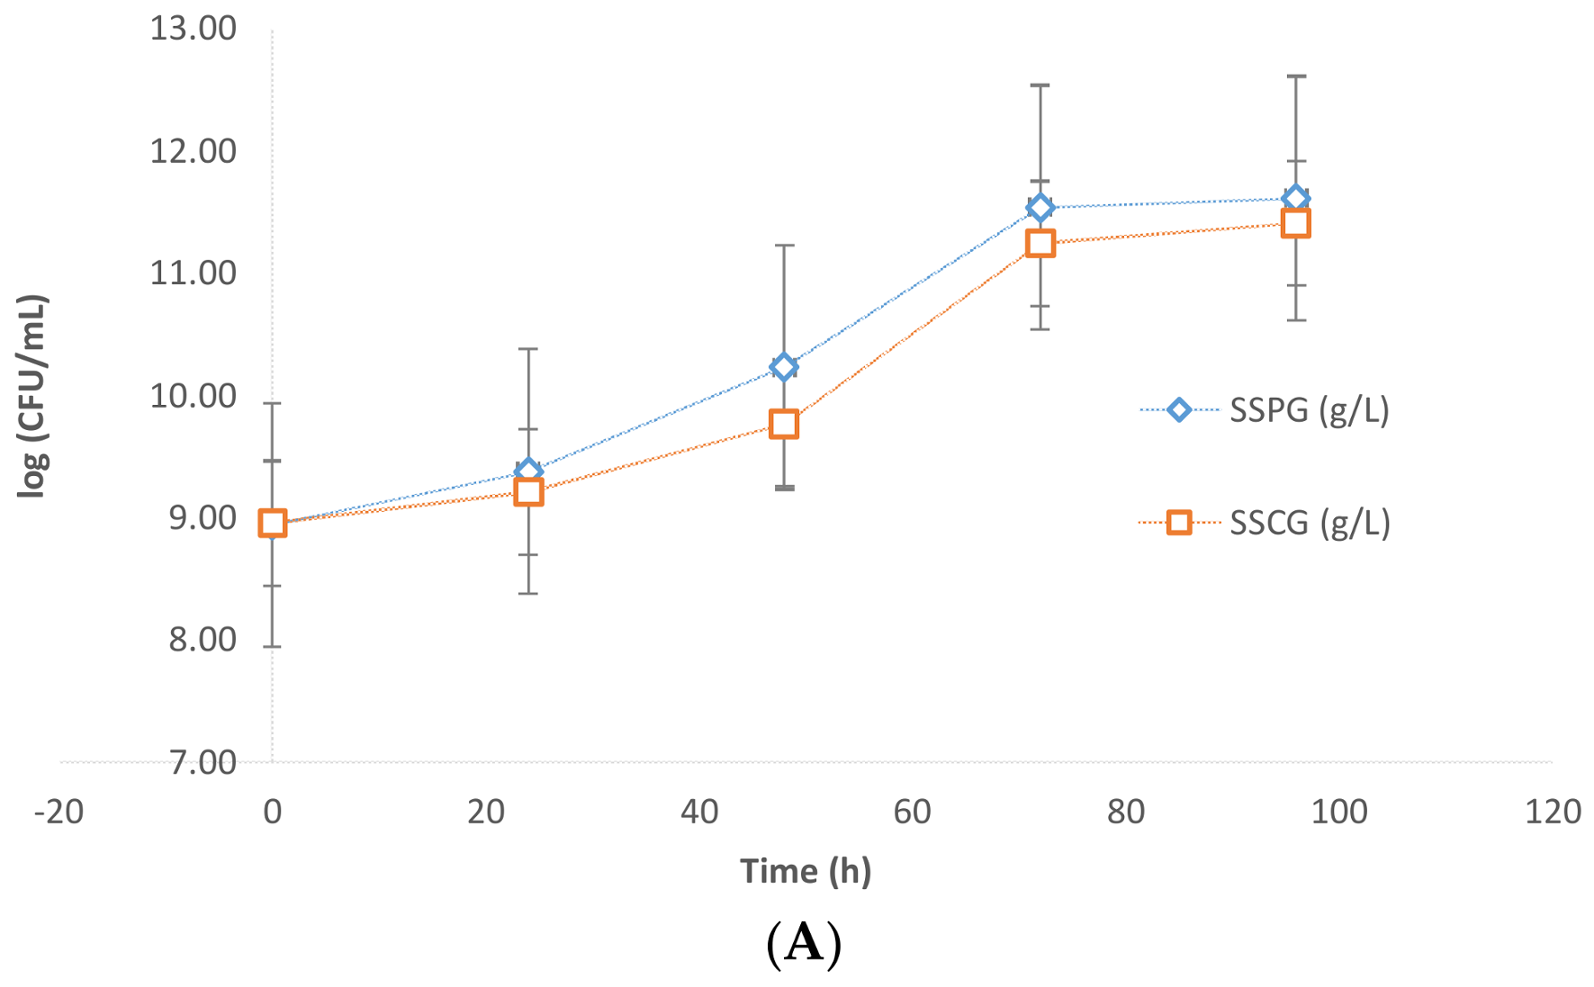
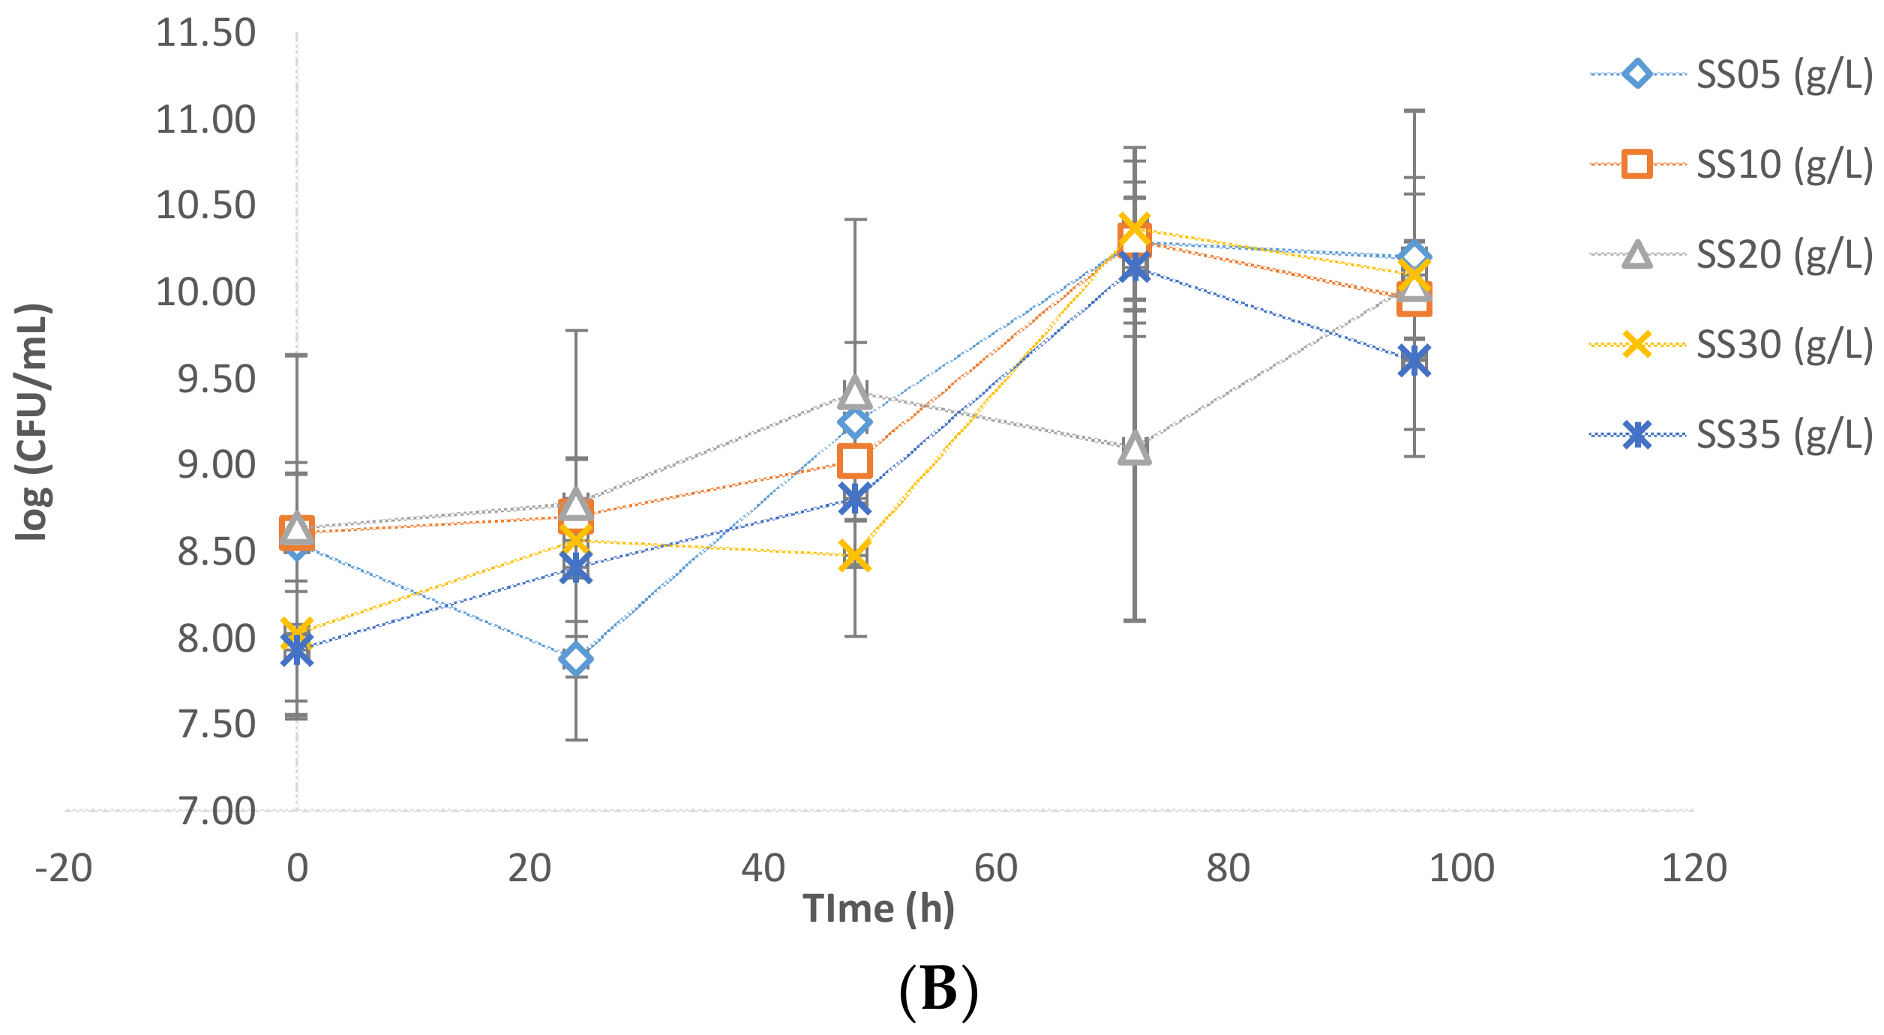
Evidently, the presence of sludge imposes some inhibition on the microbial growth of the yeast. The results were further confirmed by CFU analysis data. In Figure 3A,B, it is apparent that the values of Log (CFU/mL) in the presence of sludge were in the order of 10–10.4 while in the case of flask fermentations without sludge these values were in the order of 11.5. Further slight inhibition was observed due to crude glycerol. The CFU/mL in the case of pure glycerol was found to be higher than that of crude glycerol (Figure 3A).
Statistical Analysis of the net biomass generation using single factor ANOVA was performed using the MS-Excel 2013 data analysis tool. The duplicates data for the net biomass generation was used for the statistical analysis. The results are summarized in Table 4. According to the test results, the F ratio (of variances) value was 13.899, which was higher than the F critical value of 5.19217 as recommended by the Fisher’s F test table for statistical significance for 95% confidence for the F(4,5) degree of freedom data set. Further, the probability value (p value) of the test was 0.006 < 0.05, less than the set p value for this test. Therefore, the results indicate that the null hypothesis can be easily rejected to conclude that the variation in sludge suspended solid concentrations have a significant effect on the biomass growth of the microbe.

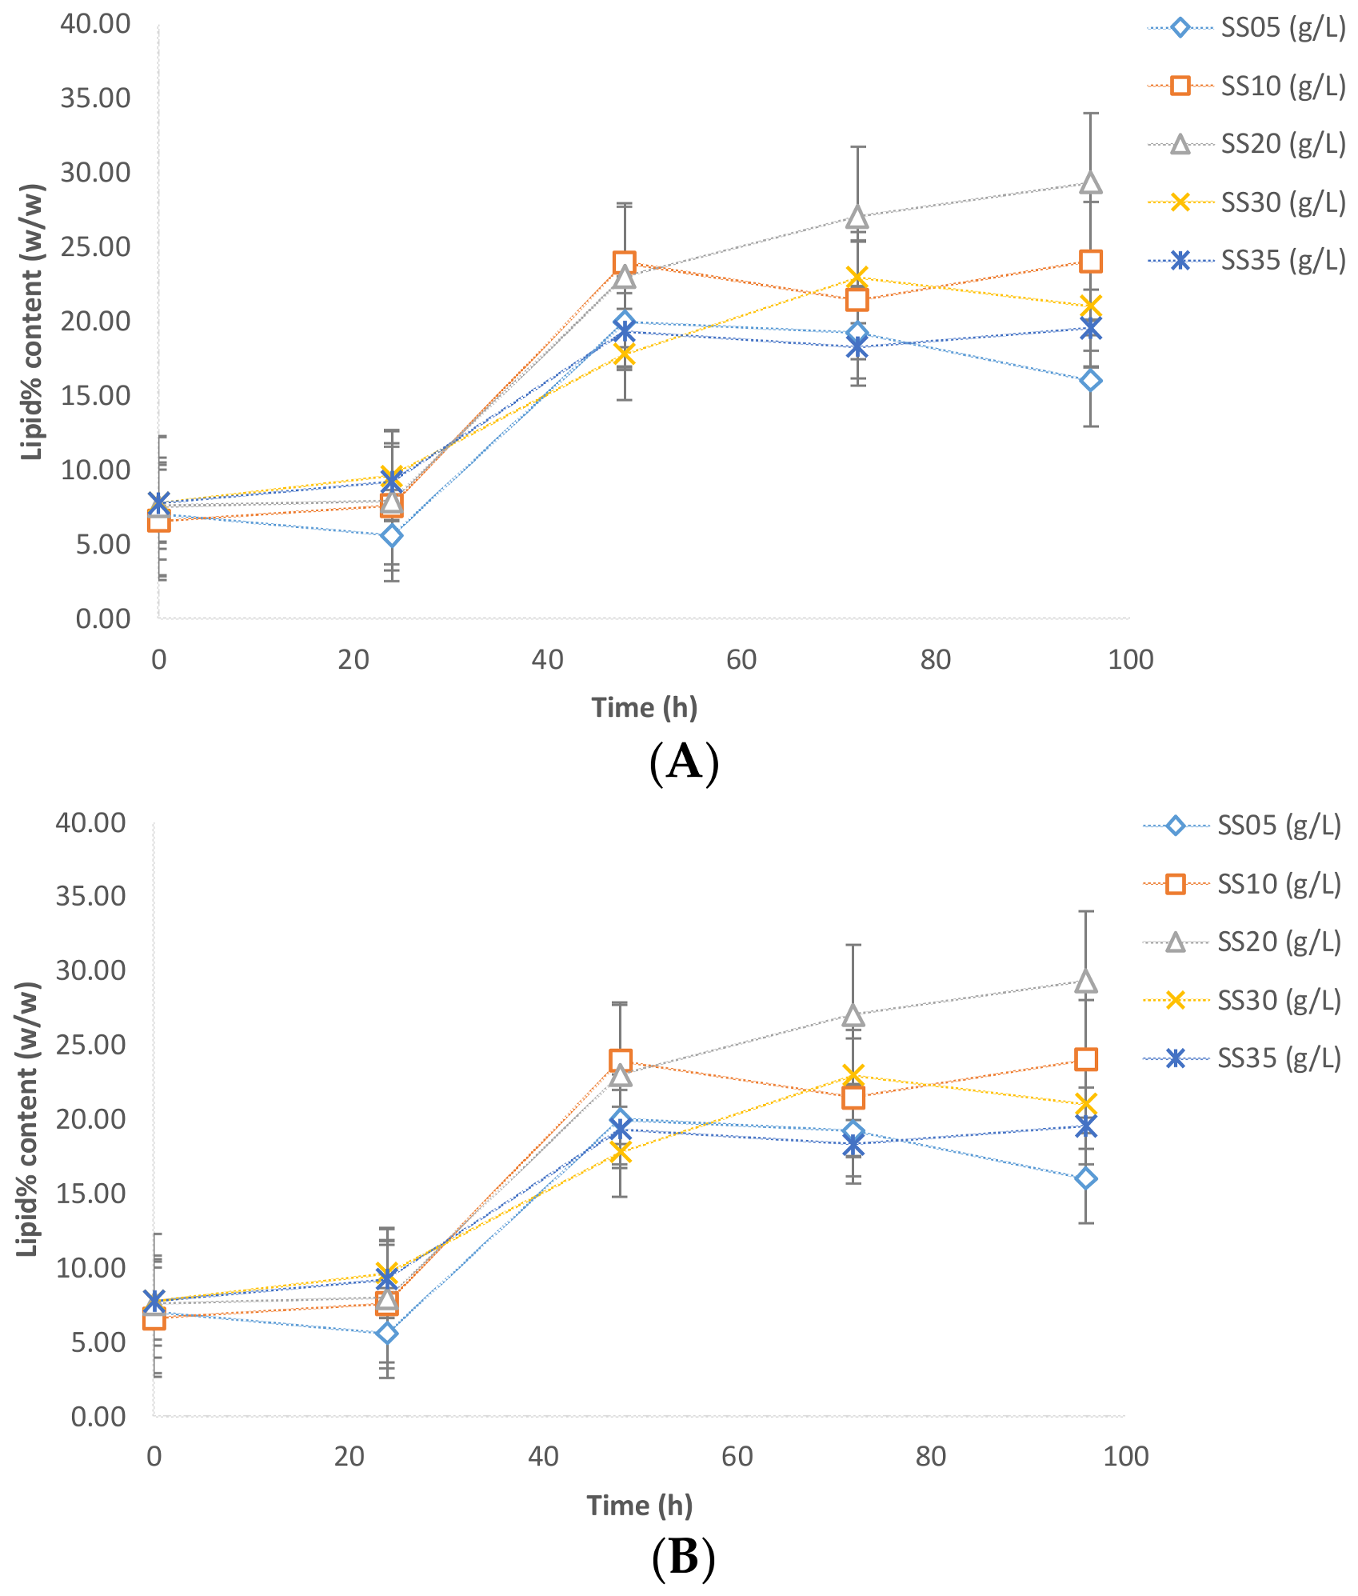
3.2. Lipid Production

The maximum lipid content (29.35% w/w) was observed with the sludge solid concentration of 20 g/L, whereas the lowest lipid content was observed with the 5 g/L sludge solid concentration (Figure 4). The lipid content in the cases of the 10, 30, and 35 g/L sludge concentrations were 20–24% w/w. A possible account for such variation is the (carbon and nitrogen) nutrients furnished by the sludge. If the nitrogen concentration is too low, then the lipid accumulation process is negatively affected by virtue of the fact that a minimal concentration of nitrogen is required for basal cell metabolism and accumulation activity. On the other hand, if an excess of nitrogen is available (low C:N ratio), the cell favors growth metabolism as against the accumulation of carbon as lipid reserves [3]. This suggests that an optimum level of nitrogen is required for the microbes to perform lipid accumulation. The presence of different concentrations of sludge solids furnishes different concentrations of the nutrients (carbon and nitrogen), resulting in different sub-optimal C:N ratios for lipid accumulation.
In experiments performed without sludge to compare pure glycerol and crude glycerol, the lipid contents were 35% and 28% for crude glycerol and pure glycerol, respectively (Figure 4B). This result is in agreement with the results obtained by previous studies [3,8,13,14]. Similar to biomass, inhibition of lipid accumulation was also observed by the presence of sludge (Figure 4A,B). Maximum lipid content with sludge (in case of 20 g/L) was 29.35% (w/w), while without sludge the maximum lipid content was 37% (w/w). Further, crude glycerol is approvingly a favorable source for lipid accumulation using Y. lipolytica. A comparison between lipid content and the yield of previous studies and this study has been presented in Table 5.

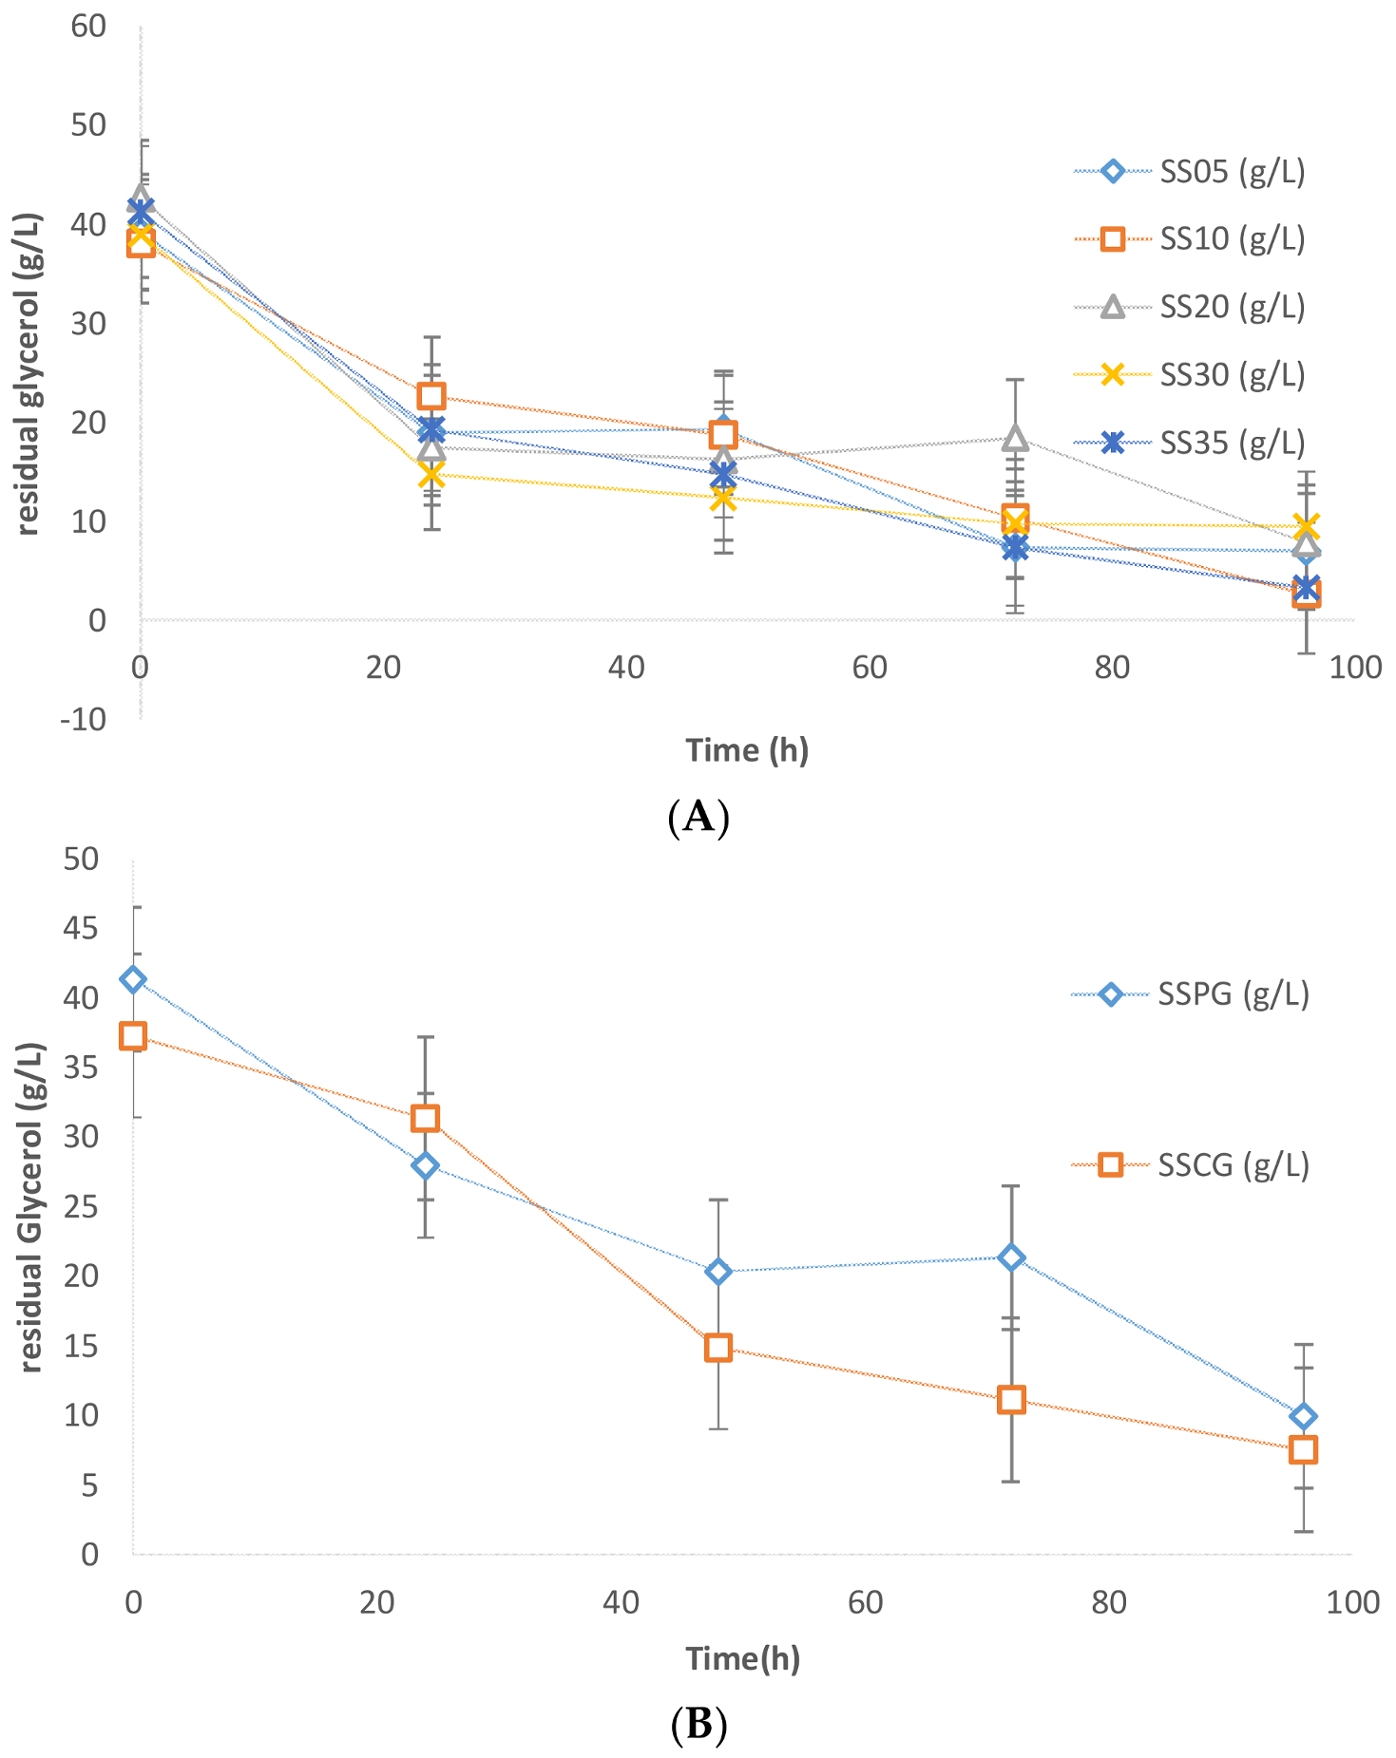
3.3. Glycerol Consumption

Many researchers have studied the effect of crude glycerol composition and found that crude glycerol obtained from the biodiesel industry is a very suitable carbon source for lipid production [16]. In this study, crude glycerol obtained from the biodiesel industry via Bio-Liq, Saint-Marc-des-Carrières, QC, Canada was used. An initial C:N ratio of 100 (mol-C/mol-N) was maintained in all of the experiments as a C:N ratio of 75–100 has been reported to be optimum for lipid production [3,16]. The glycerol consumption profile is presented in Figure 5, and it is observed that glycerol was rapidly consumed in the first 24 h of fermentation in all of the different sludge solid concentrations. After 96 h of fermentation, the residual glycerol concentration was found to be in the range of 3–9 g/L. Similar glycerol consumption profiles were observed in case of experiments performed without sludge solids in the media. The residual glycerol concentration in the case of zero sludge solids was also in the range of 7.5–9.9 g/L. As seen earlier in the SS and lipid data, the crude glycerol used in this study apparently poses insignificant inhibition due to the traces of impurities. Also, no significant difference in substrate consumption rates was observed between pure glycerol and crude glycerol (Figure 5B). An untraceable amount of citric acid was produced in these experiments, which can be attributed to the composition of the crude glycerol matrix and evolving C:N ratio. These results conform with the findings of previous studies [15].

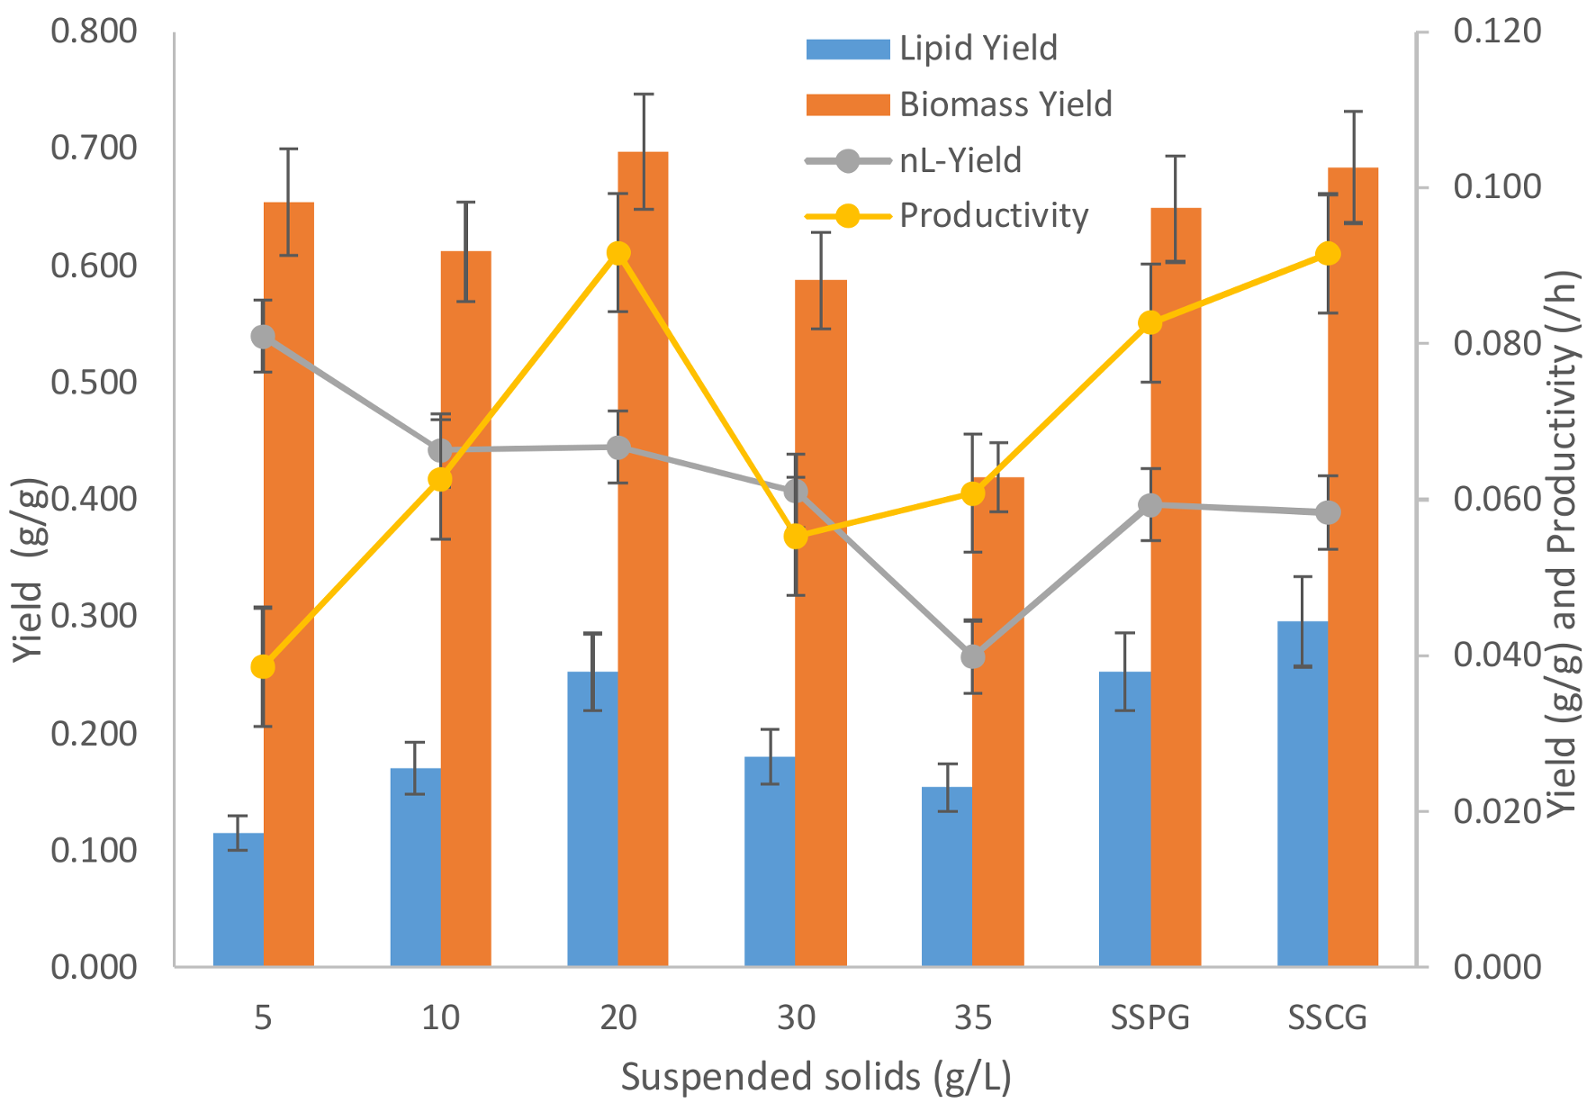
3.4. Yield and Productivity Analysis

The yield and productivity data for different suspended solid concentrations have been presented in Figure 6. As is evident from the graphics, with an increase in sludge suspended solid concentration higher than 20 g/L in the media, the total biomass (including lipid) yield w.r.t glycerol decreases monotonously. This, as discussed earlier, is the clear indication of the growth inhibition caused by sludge solids.
The significant decrease in biomass yield can be accounted for with the hindrance caused by the sludge solids at higher concentrations. At higher concentrations of sludge solids, any inhibitory compound furnished by sludge solids will also be present in higher concentrations, which can affect the microbial growth. Further, a higher solid concentration can cause mass transfer limitations for nutrients and oxygen. A higher solid concentration can cause inhomogeneity resulting in anaerobic pockets in the flask fermentation, which can severely affect the microbial growth by creating hostile and stressful conditions [17]. Under stressful conditions, cells invest a significant portion of their resources in the form of maintenance energy [18]. Retarded microbial growth is beneficial for any kind of storage molecule accumulation as can be seen in this study that lipid yield increases when the sludge solid concentration is increased from 5 to 20 g/L (Figure 6). Increasing the sludge solid concentration beyond 20 g/L decreases the lipid yield as the inhibitory effect of sludge solids scale the complete cellular metabolism causing neither growth (non-lipid biomass) nor accumulation of lipids.
The maximum lipid accumulation yield of 0.253 g-lipid/g-glycerol was found with 20 g/L of sludge solid concentration. The maximum productivity with 20 g/L sludge concentration was 0.092 g-lipid/L.h. The results of this study are comparable with previous studies done with this strain without sludge (Table 5).
Comparing the lipid accumulation in the presence of the optimum sludge solid concentration (of 20 g/L) with experiments performed without sludge (SSCG, using crude glycerol), it is evident that while using municipal secondary sludge in the media the lipid yield and productivity are comparably invariant as compared to fermentation performed in absence of sludge (SSCG). When sludge was used, the biomass and n-Lipid biomass yields were 0.697 and 0.445 g/g, respectively. On the other hand, the biomass and n-Lipid biomass yields were 0.684 and 0.389 g/g, respectively, when sludge was not used (SSCG). In both the cases, the lipid content and glycerol usage were not compromised significantly. The lipid yield with sludge (20 g/L) was 0.253 g-lipid/g-glycerol, while the one without sludge (SSCG) was 0.295 g-lipid/g-glycerol. A comparison between the two cases has been presented in Table 6.
Thus, it can be concluded that sludge at a higher concentration causes significant inhibition to microbial metabolism. If the optimum concentration of sludge solid is used for fermentation, then the lipid productivity and lipid content is not compromised as compared to its negative control (SSCG) where fermentation was performed without sludge. Use of crude glycerol (SSCG) as compared to pure glycerol (SSPG) is also beneficial in all aspects as it gives comparable lipid yield and higher lipid productivities. The productivity of crude glycerol (SSCG) is 0.092 whereas lipid yield for pure glycerol is 0.083 g-lipid/L.h. Therefore, crude glycerol is a preferable substrate which enhances the lipid production with a slight inhibition to microbial growth.

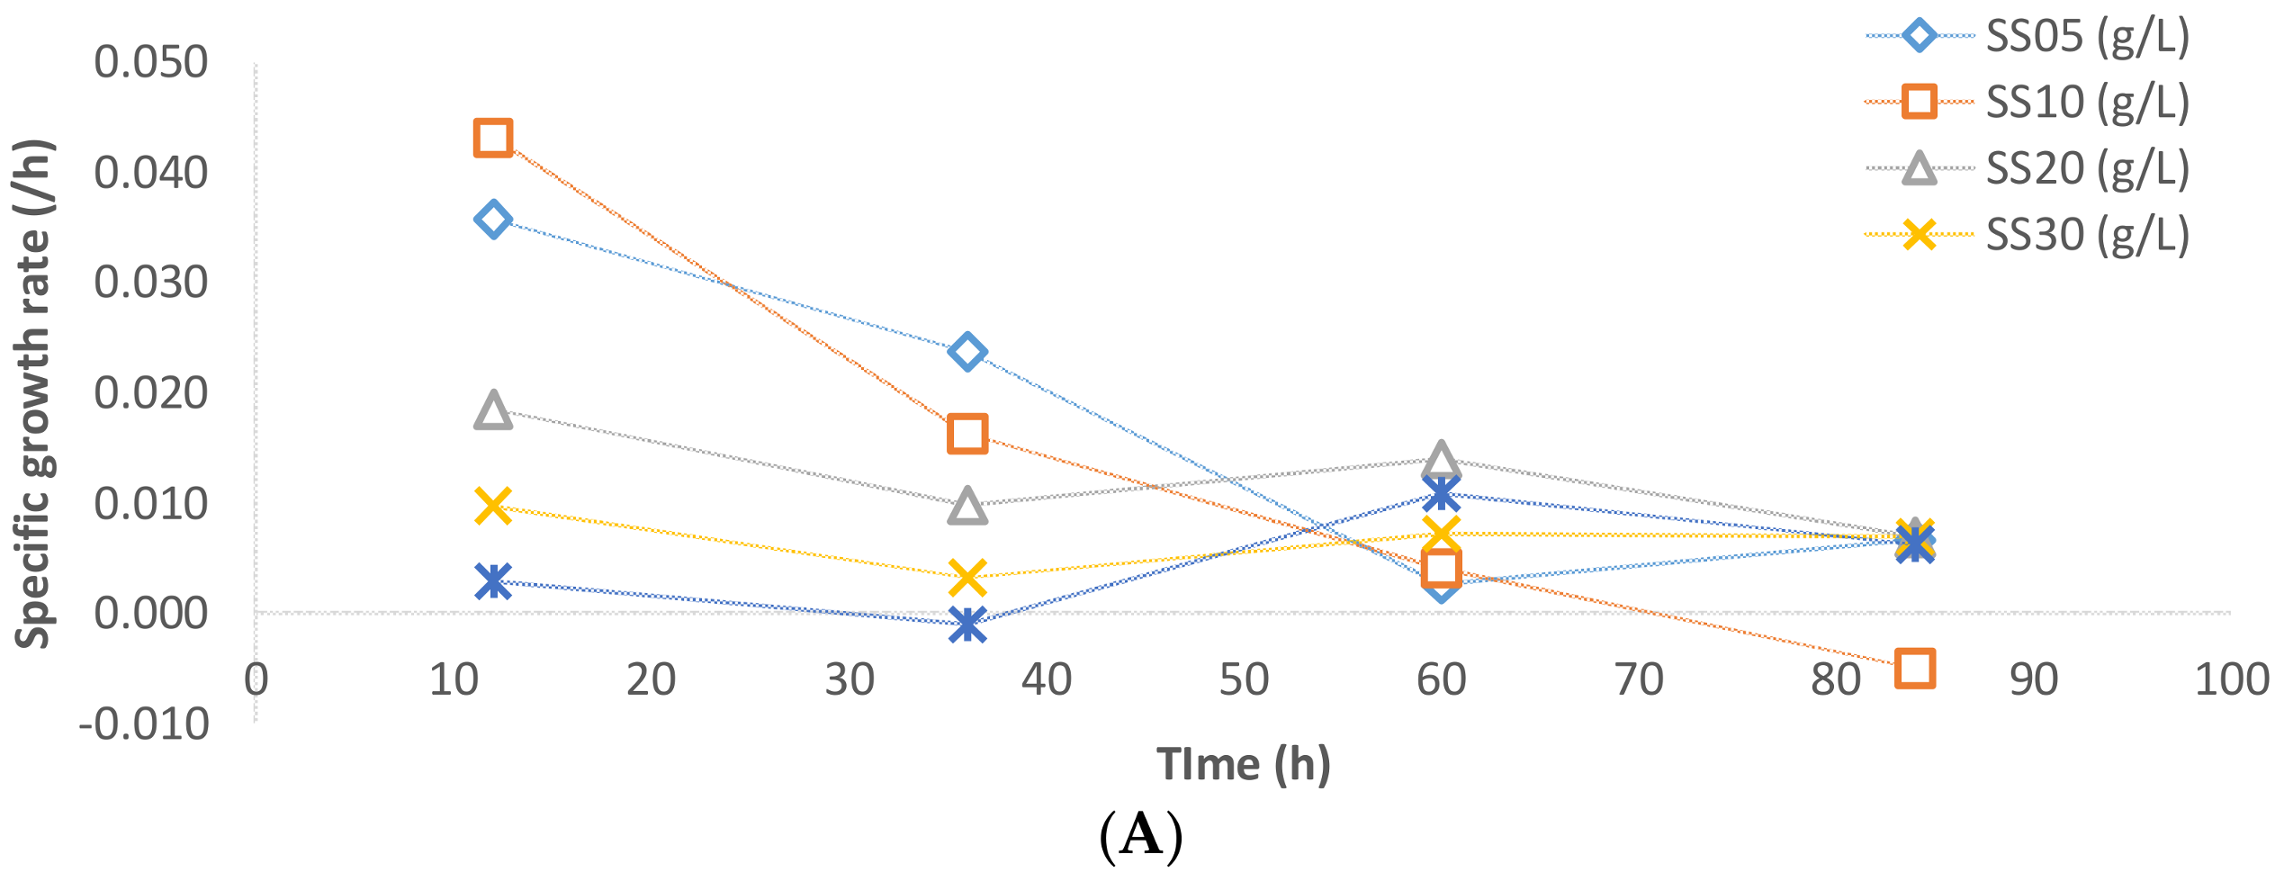
3.5. Specific Rates and Kinetics Analysis

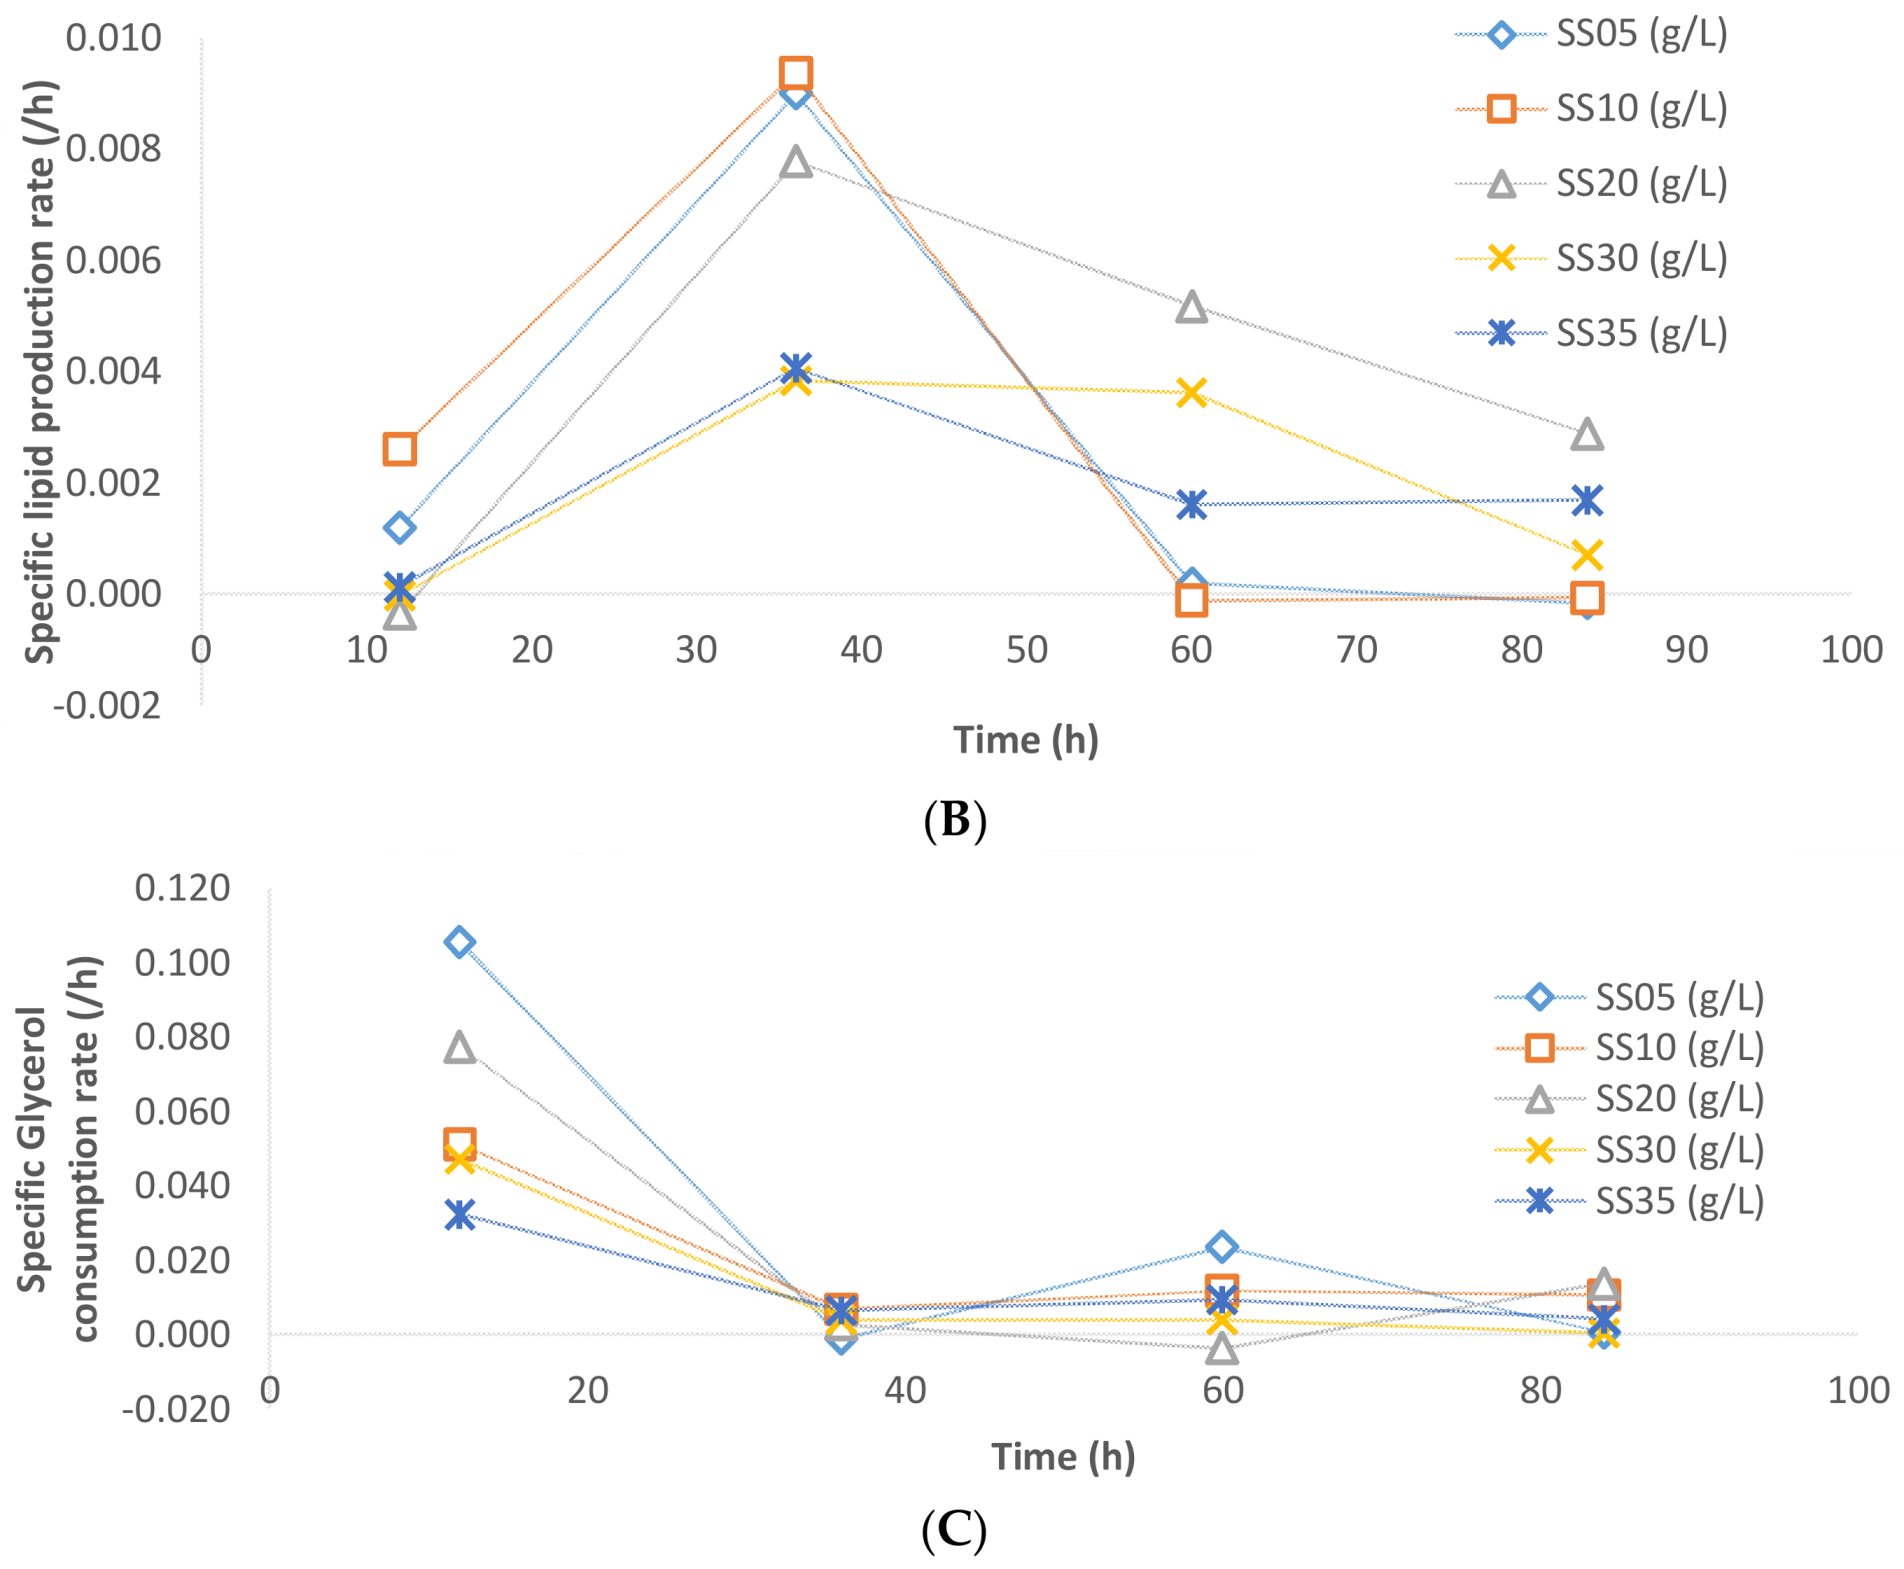
The specific rate of biomass formation, lipid accumulation, and glycerol consumption have been presented in Figure 7 for various sludge solid concentrations. The specific biomass growth rate for 5 and 10 g/L solid concentration was monotonously decreasing throughout the fermentation. On the other hand, the specific biomass growth rate increased for the cases of 20, 30, and 35 g/L, where the SS of 20 g/L sludge fermentation has the highest specific rates of biomass growth (Figure 7A).
In the case of lipid accumulation, during the 48 h of fermentation in the cases of 5, 10, and 20 g/L sludge SS, the specific lipid accumulation reached a maximum and started decreasing thereafter (Figure 7B). At the 60th hour, the sludge fermentation with 20 g/L of sludge solids had the highest specific lipid accumulation rate while in the cases of 5 and 10 g/L sludge solids, the lipid accumulation ceased. A major fraction of lipid accumulation occurred after 30 h of fermentation. This is probably due to the fact that during fermentation, when carbon and nitrogen are consumed dynamically (in disproportionate quantities), the C:N ratio of the media changes inducing a metabolic shift to lipogenesis phase [16,19]. The specific glycerol uptake rates were similar in all cases of sludge solid concentration. At the beginning of the fermentation, the specific uptake rates were high mainly because of the active biomass synthesis that takes place during this period (Figure 7C). Thereafter, the rate of glycerol consumption is significantly lower in all of the cases of sludge solid concentration.
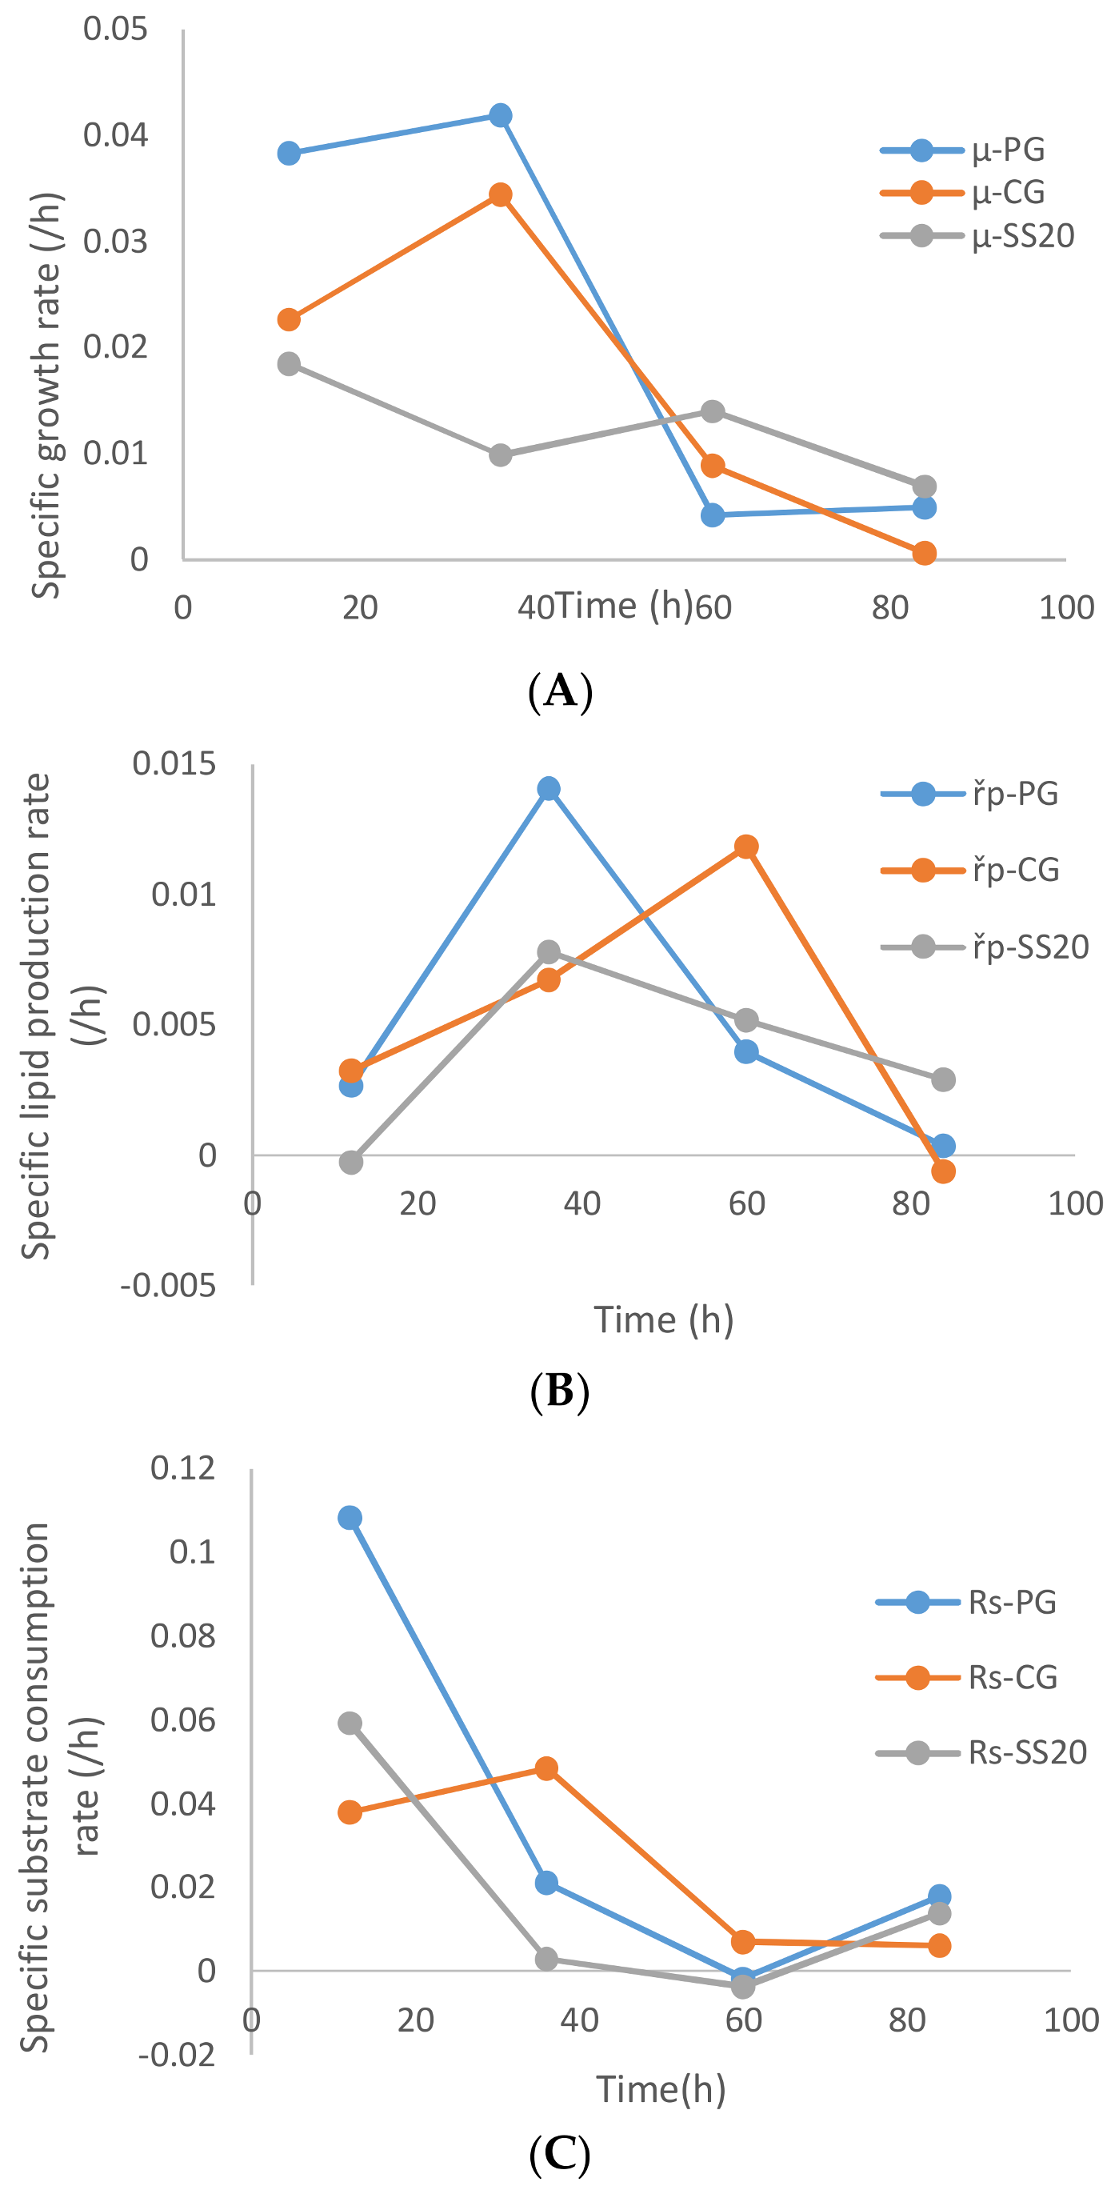
A comparison of the specific growth rate, product formation rate, and glycerol uptake rate between the cases of sludge solids, (20 g/L), crude glycerol, and pure glycerol is presented in Figure 8A. As is apparent from Figure 8A, the pure glycerol (without sludge) resulted in the highest specific biomass growth rate followed by crude glycerol and then sludge (optimized conc. 20 g/L). Exceptionally near zero specific biomass growth rate in the first 24 h of fermentation was observed with higher suspended solid concentrations (30 and 35 g/L, Figure 7A). The stagnant biomass concentrations can be the results of the microbial action on the metabolizable suspended solids that are accompanied by sludge-like humic substances, loosely bound extra polysaccharides, nucleic acids, and other organics. The biomass growth of the microbe is compensated for by the decrease in sludge suspended solids concentration, which does not necessarily become completely assimilated (intracellularly) by the microbe. Similar observations were made by previous researchers [5,20].
The specific lipid accumulation rates were also highest for pure glycerol until the 36th hour of fermentation. Thereafter, the specific lipid accumulation rates decreased monotonously for the case of sludge and pure glycerol, but in the case of crude glycerol the specific lipid accumulation rates lagged at the 36th hour and major accumulation occurred after 50 h of fermentation (Figure 8B). The specific glycerol uptake rates followed the trend of the specific lipid accumulation rate, where crude glycerol showed lower (but steady) consumption rates until the 36th hour of fermentation before it started decreasing from the 36th hour onward. In the case of sludge and pure glycerol, the glycerol uptake rates decreased continuously until 40 h of fermentation and then remained insignificantly low until the end of the fermentation.

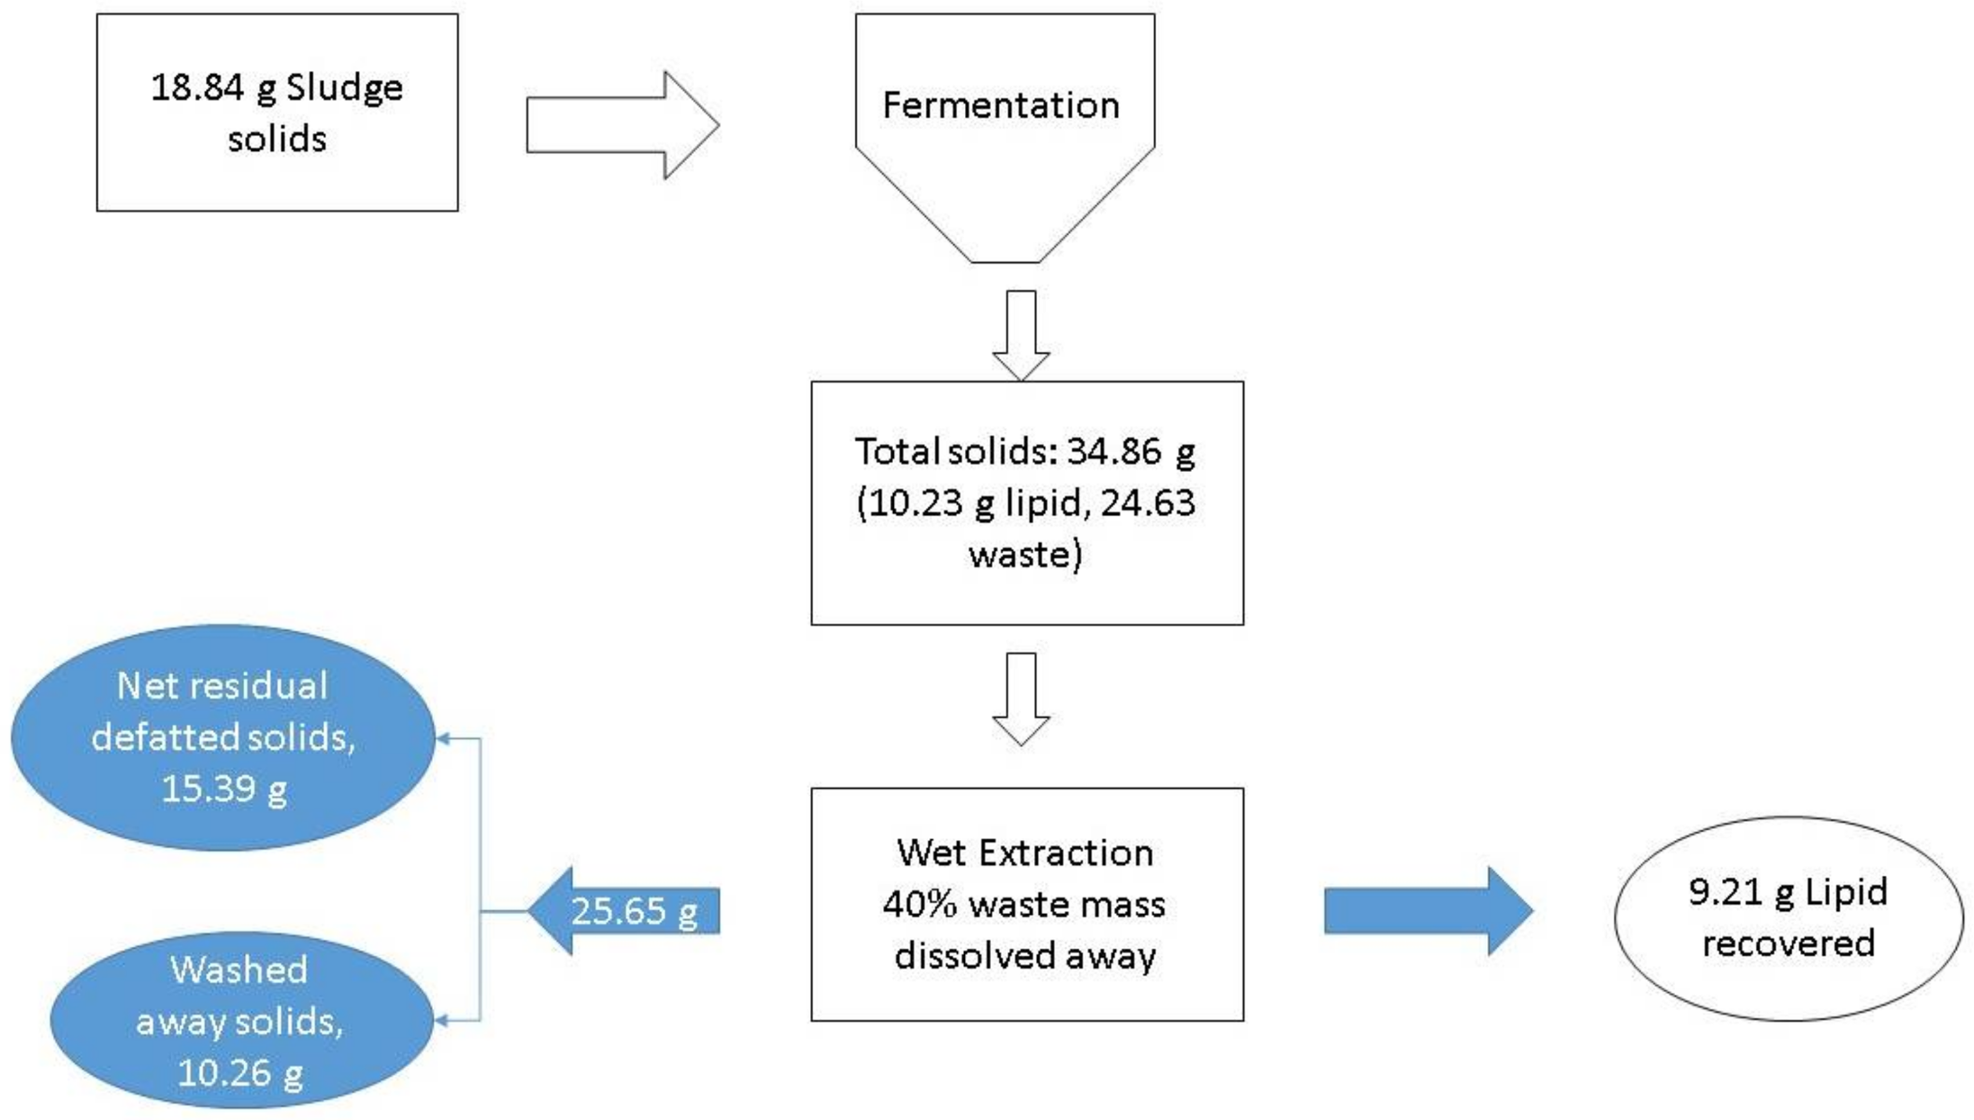
3.6. Degree of Sludge Disposal Problem

During the process when the sludge is integrated into the media with the expectation that it will provide an alternate solution for sludge disposal toward the end, it is essential to analyze to what extent the problem is solved. A simple mass balance over the amount of solids available for disposal is used to evaluate the degree of sludge disposal (DSD) problem.
D S D   ( % ) = S o l i d   w a s t e   t o   d i s p o s e   a f t e r s o l i d   w a s t e   t o   d i s p o s e   b e f o r e × 100
At the zeroth hour, the sludge to be disposed of is the sludge used in the process. For example, in the case of fermentation conducted with 20 g/L of sludge, at the zeroth hour 18.84 g of sludge was fed into the process (Figure 9). Thus, the sludge to dispose of at the zeroth hour (SDZ) is 18.84 g. After the process is over, 34.86 g of solids are left which contain 10.23 g of lipids (lipid content 29.35%). Assuming 90% of these solids are recovered as microbial lipids, then the solids that remain to dispose of are 25.65 g-lipids. There are dry and wet methods of lipid extraction available in the literature. In the case of dry lipid, no further reduction is possible for these disposable solids, but in the case of wet extraction methods using detergents [21], it is possible to dissolve a significant portion of de-fatted biomass by the chemical action of detergents. This soluble fraction in major part includes the proteins, carbohydrate, and nucleic acid (structural) components of the cell. Assuming 40% of the mass is lost during the extraction, the solids disposable after the process (SDP) will be 15.39 g [22,23]. Therefore, the DSD value for this case will be 81.69%. This indicates that there was a net reduction in the amount of solid waste to be disposed of. The lipid content is a very crucial parameter in determining the DSD of the process.
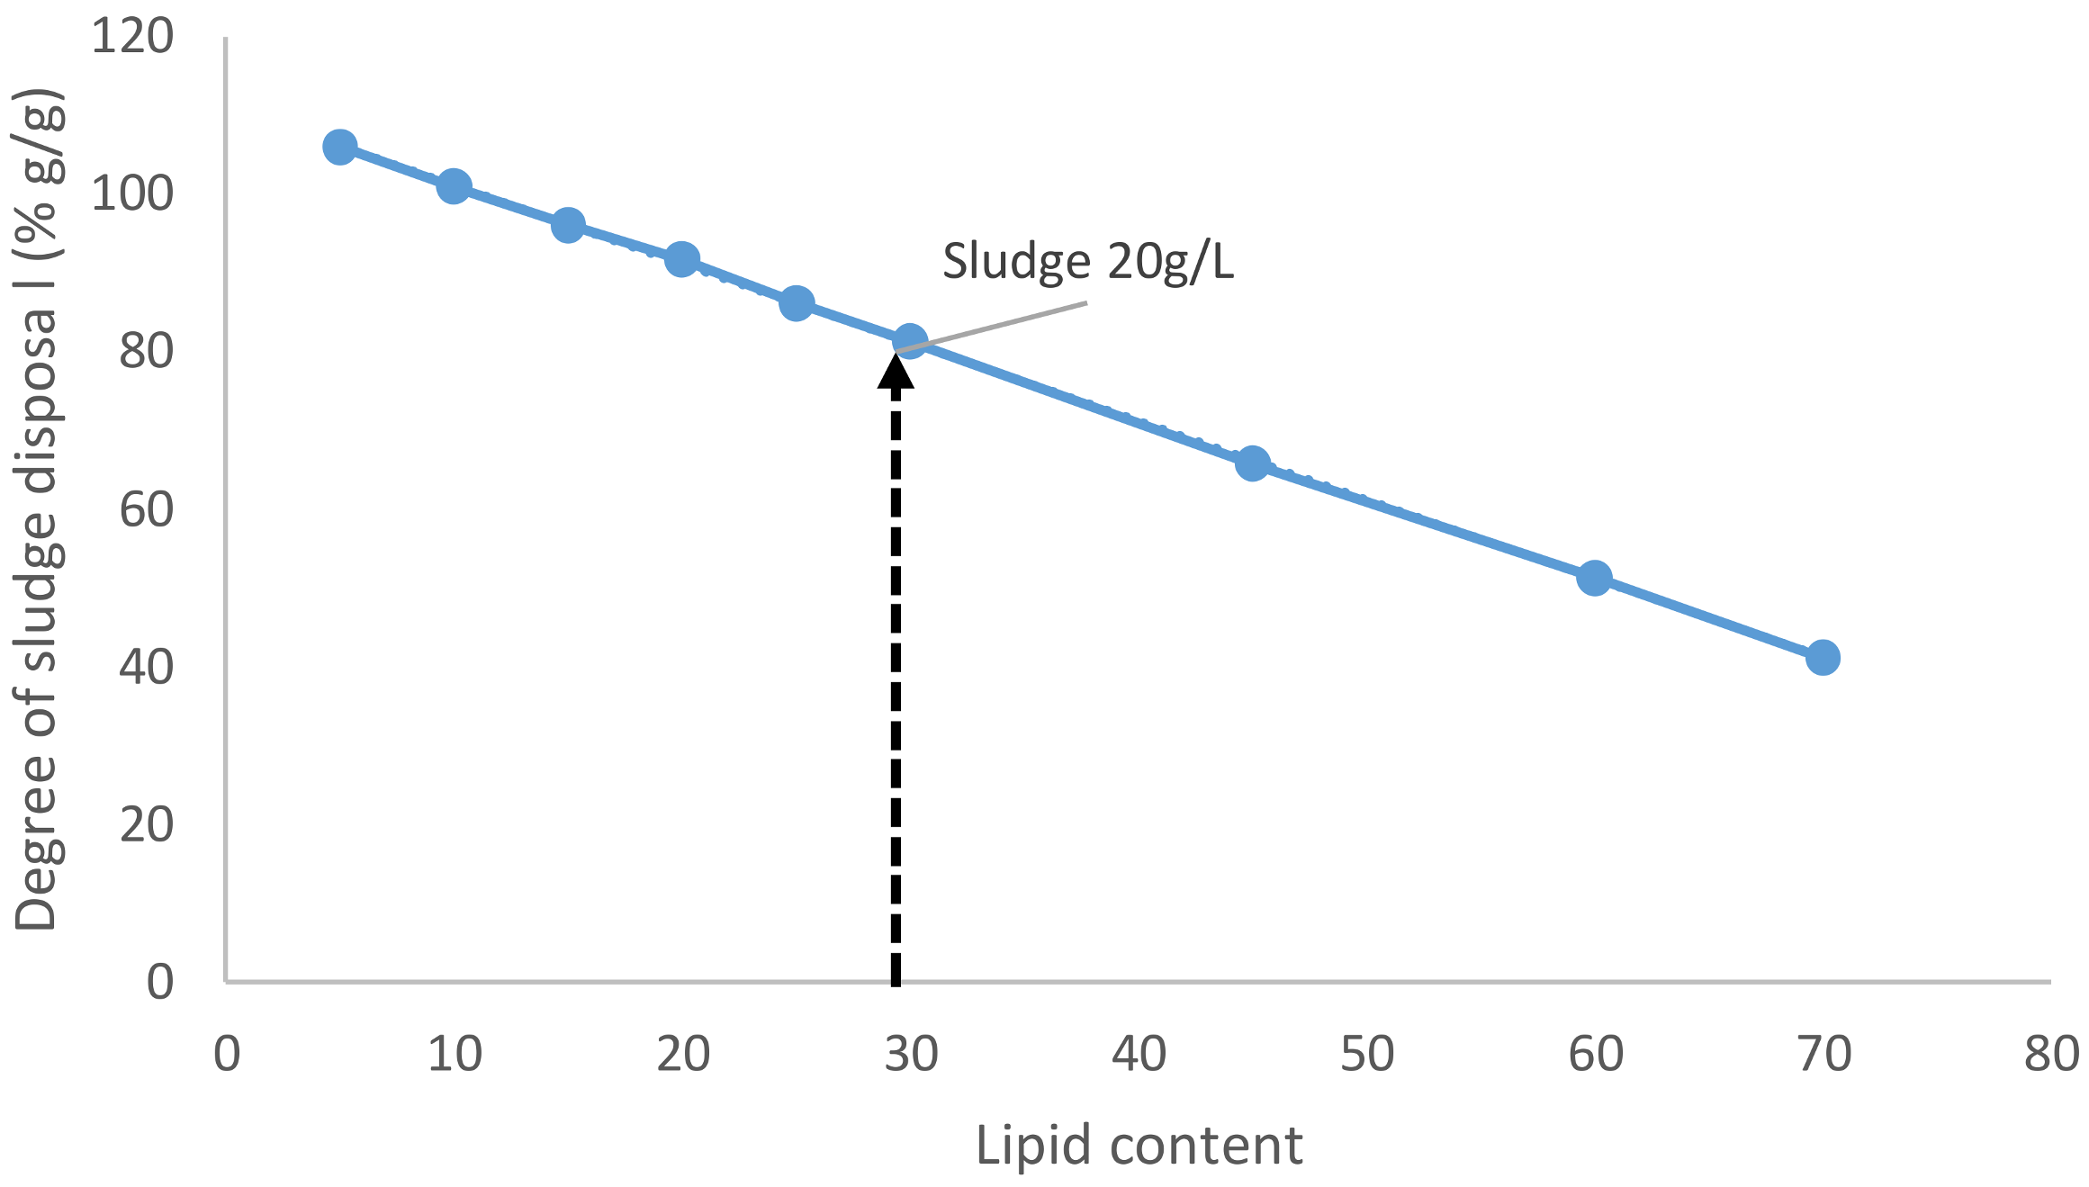
When the lipid content was varied from 5 to 70%, it was observed that at least 11.2% of lipid content is essential so that the situation remains neutral (with no net increase of solid waste) if not better off (Figure 10). When the lipid content is increased, the amount of sludge available to dispose of after the process reduces further.

4. Conclusions

In this study, the SS concentration of municipal wastewater sludge solids (to be used along with crude glycerol as media) to produce microbial lipids using the oleaginous yeast Y. lipolytica was optimized. The results indicate that sludge renders a significant inhibition to microbial growth at higher concentrations and 20 g/L of sludge solid concentration is the optimum concentration for maximum lipid accumulation by the yeast. Further, the industrial crude glycerol used in the study imposed a slight inhibition to the microbial growth due to the matrix composition of crude glycerol as compared to pure glycerol and it is a very suitable source of carbon for lipid production. The use of optimum concentrations of sludge gives comparable lipid production yield and productivity as with crude glycerol only. The maximum biomass concentration, lipid content, lipid yield (w.r.t. glycerol), and productivity with 20 g/L sludge solids were 34.86 g/L, 29.35% (w/w), 0.295 g/g, and 0.092 g/L.h, respectively. Using sludge in growth media solves the problem of sludge disposal, and the degree of sludge disposal depends upon the lipid content and downstream extraction methods. It was found that a minimum of 11.2% (w/w) lipid content is recommended in this process to have no net increase in solid waste to dispose before and after the process. This study demonstrates the possibility of using municipal sludge solids (at an optimum concentration) as a component in growth media along with crude glycerol without compromising the lipid productivities. Further research is required to reduce the minerals and trace elements used in this study to obtain a minimal media composition to reduce the overall cost of production of microbial lipids.

Acknowledgments

The authors are thankful to the INRS research facility for facilitating the research.

Author Contributions

The primary research was conducted by the Saurabh Kumar Ram. Research was guided by Rajeshwar Dayal Tyagi. The internal evaluation, scrutiny and manuscript corrections were done by Patrick Drogui.

Conflicts of Interest

The authors declare no conflict of interest.

References

  1. Ayoub, M.; Abdullah, A.Z. Critical review on the current scenario and significance of crude glycerol resulting from biodiesel industry towards more sustainable renewable energy industry. Renew. Sustain. Energy Rev. 2012, 16, 2671–2686. [Google Scholar] [CrossRef]
  2. Koutinas, A.A.; Chatzifragkou, A.; Kopsahelis, N.; Papanikolaou, S.; Kookos, I.K. Design and techno-economic evaluation of microbial oil production as a renewable resource for biodiesel and oleochemical production. Fuel 2014, 116, 566–577. [Google Scholar] [CrossRef]
  3. Kuttiraja, M.; Douha, A.; Valéro, J.R.; Tyagi, R.D. Elucidating the effect of glycerol concentration and c/n ratio on lipid production using yarrowia lipolytica SKY7. Appl. Biochem. Biotechnol. 2016, 180, 1586–1600. [Google Scholar] [CrossRef] [PubMed]
  4. Ndao, A.; Sellamuthu, B.; Gnepe, J.R.; Tyagi, R.D.; Valero, J.R. Pilot-scale biopesticide production by bacillus thuringiensis subsp. Kurstaki using starch industry wastewater as raw material. J. Environ. Sci. Health Part B 2017, 52, 623–630. [Google Scholar] [CrossRef] [PubMed]
  5. Nouha, K.; Kumar, R.S.; Tyagi, R.D. Concomitant extracellular polymeric substance and lipid production by Cloacibacterium normanense via fermentation of sterilized activated sludge fortified with crude glycerol. J. Curr. Microbiol. 2017, 1, 1–14. [Google Scholar] [CrossRef]
  6. Nouha, K.; Kumar, R.S.; Balasubramanian, S.; Tyagi, R.D. Critical review of eps production, synthesis and composition for sludge flocculation. J. Environ. Sci. 2017. [Google Scholar] [CrossRef]
  7. Zhang, X.; Chen, J.; Yan, S.; Tyagi, R.D.; Surampalli, R.Y.; Li, J. Lipid production for biodiesel from sludge and crude glycerol. Water Environ. Res. 2017, 89, 424–439. [Google Scholar] [CrossRef] [PubMed]
  8. Papanikolaou, S.; Aggelis, G. Biotechnological valorization of biodiesel derived glycerol waste through production of single cell oil and citric acid by Yarrowia lipolytica. Lipid Technol. 2009, 21, 83–87. [Google Scholar] [CrossRef]
  9. Kamzolova, S.V.; Vinokurova, N.G.; Lunina, J.N.; Zelenkova, N.F.; Morgunov, I.G. Production of technical-grade sodium citrate from glycerol-containing biodiesel waste by Yarrowia lipolytica. Bioresour. Technol. 2015, 193, 250–255. [Google Scholar] [CrossRef] [PubMed]
  10. Souza, K.S.; Schwan, R.F.; Dias, D.R. Lipid and citric acid production by wild yeasts grown in glycerol. J. Microbiol. Biotechnol. 2014, 24, 497–506. [Google Scholar] [CrossRef] [PubMed]
  11. Breil, C.; Abert Vian, M.; Zemb, T.; Kunz, W.; Chemat, F. “Bligh and dyer” and folch methods for solid–liquid–liquid extraction of lipids from microorganisms. Comprehension of solvatation mechanisms and towards substitution with alternative solvents. Int. J. Mol. Sci. 2017, 18, 708. [Google Scholar] [CrossRef] [PubMed]
  12. Kuhn, J.; Müller, H.; Salzig, D.; Czermak, P. A rapid method for an offline glycerol determination during microbial fermentation. Electron. J. Biotechnol. 2015, 18, 252–255. [Google Scholar] [CrossRef]
  13. Papanikolaou, S.; Aggelis, G. Lipid production by Yarrowia lipolytica growing on industrial glycerol in a single-stage continuous culture. Bioresour. Technol. 2002, 82, 43–49. [Google Scholar] [CrossRef]
  14. Rakicka, M.; Lazar, Z.; Dulermo, T.; Fickers, P.; Nicaud, J.M. Lipid production by the oleaginous yeast Yarrowia lipolytica using industrial by-products under different culture conditions. Biotechnol. Biofuels 2015, 8, 104. [Google Scholar] [CrossRef] [PubMed]
  15. Papanikolaou, S.; Kampisopoulou, E.; Blanchard, F.; Rondags, E.; Gardeli, C.; Koutinas, A.A.; Chevalot, I.; Aggelis, G. Production of secondary metabolites through glycerol fermentation under carbon-excess conditions by the yeasts Yarrowia lipolytica and rhodosporidium toruloides. Eur. J. Lipid Sci. Technol. 2017, 1600507. [Google Scholar] [CrossRef]
  16. Dobrowolski, A.; Mitula, P.; Rymowicz, W.; Mironczuk, A.M. Efficient conversion of crude glycerol from various industrial wastes into single cell oil by yeast Yarrowia lipolytica. Bioresour. Technol. 2016, 207, 237–243. [Google Scholar] [CrossRef] [PubMed]
  17. Van Dijken, J.P.; Scheffers, W.A. Redox balances in the metabolism of sugars by yeasts. FEMS Microbiol. Rev. 1986, 1, 199–224. [Google Scholar] [CrossRef]
  18. Gustafsson, L.; Olz, R.; Larsson, K.; Larsson, C.; Adler, L. Energy balance calculations as a tool to determine maintenance energy requirements under stress conditions. Pure Appl. Chem. 1993, 65, 1893–1898. [Google Scholar] [CrossRef]
  19. Blazeck, J.; Hill, A.; Liu, L.; Knight, R.; Miller, J.; Pan, A.; Otoupal, P.; Alper, H.S. Harnessing Yarrowia lipolytica lipogenesis to create a platform for lipid and biofuel production. Nat. Commun. 2014, 5, 3131. [Google Scholar] [CrossRef] [PubMed]
  20. More, T.; Mahmoudi, A.; Yan, S.; Tyagi, R.D. Extracellular polymeric substances production kinetics of 13 sludge isolates using wastewater sludge as raw material and its flocculation potential. Environ. Technol. 2015, 36, 3022–3035. [Google Scholar] [CrossRef] [PubMed]
  21. Yellapu, S.K.; Bezawada, J.; Kaur, R.; Kuttiraja, M.; Tyagi, R.D. Detergent assisted lipid extraction from wet yeast biomass for biodiesel: A response surface methodology approach. Bioresour. Technol. 2016, 218, 667–673. [Google Scholar] [CrossRef] [PubMed]
  22. Chi, Z.; Wang, F.; Wang, L.; Li, J.; Wang, X. Selection of Yarrowia lipolytica strains with high protein content from yeasts isolated from different marine environments. J. Ocean Univ. China 2007, 6, 360–364. [Google Scholar] [CrossRef]
  23. Michalik, B.; Biel, W.; Lubowicki, R.; Jacyno, E. Chemical composition and biological value of proteins of the yeast Yarrowia lipolytica growing on industrial glycerol. Can. J. Anim. Sci. 2013, 94, 99–104. [Google Scholar] [CrossRef]
Figure 1. Net suspended solids (NSS) profiles for flask fermentation with different sludge solid concentration 5, 10, 20, 30, and 35 g/L.
Fermentation 04 00024 g001
Figure 2. Net suspended solids (NSS) profile for the flask fermentation without sludge using pure glycerol (SSPG) and crude glycerol (SSCG).
Fermentation 04 00024 g002
Figure 3. (A) CFU profiles comparison between pure glycerol (SSPG) and crude glycerol (SSCG); (B) CFU profiles for flask fermentation containing different concentrations of sludge solids.
Fermentation 04 00024 g003aFermentation 04 00024 g003b
Figure 4. Lipid % (w/w) content data for (A) Flask fermentations at different sludge solid concentrations; (B) Flask fermentation without sludge to compare pure glycerol (SSPG) and crude glycerol (SSCG).
Fermentation 04 00024 g004
Figure 5. Glycerol consumption profile for (A) Flask fermentations at different sludge solid concentrations; (B) Flask fermentation without sludge to compare pure glycerol (SSPG) and crude glycerol (SSCG).
Fermentation 04 00024 g005
Figure 6. Yields and productivity comparison for flask fermentations at different sludge solid concentrations.
Fermentation 04 00024 g006
Figure 7. (A) Specific growth rate, (B) specific lipid production rate, and (C) specific glycerol consumption rate comparison between fermentations performed with different concentrations of sludge solids.
Fermentation 04 00024 g007aFermentation 04 00024 g007b
Figure 8. (A) Specific growth rate, (B) specific lipid production rate, and (C) specific glycerol consumption rate comparison between fermentations performed with sludge (SS20, 20 g/L), crude glycerol (CG), and pure glycerol (PG).
Fermentation 04 00024 g008
Figure 9. Mass balance illustration for the process using 20 g/L sludge solids (optimized concentration).
Fermentation 04 00024 g009
Figure 10. Degree of sludge disposal reduction variation with lipid content.
Fermentation 04 00024 g010
Table 1. Characteristics of raw municipal wastewater sludge.
Characteristic of Sludge SolidsValue
Suspended solids (g/L)24.32
Volatile suspended solids (g/L)17.81
Total Carbon (mg/g)401
Total Nitrogen (mg-N/g)52.01
Total ammonical Nitrogen (mg-NH4/g)0.637
Total Phosphorus (mg/g)1.23
pH6.32
Table 2. Composition of crude glycerol.
CharacteristicValue
Density (g/mL)0.909
Glycerol (g/L)675
Methanol (g/L)58
Soap (g/L)ND
Catalyst (% w/w)0.8
FFA (g/L)ND
Water (g/L)190
pH9.01
SourceBio-Liq, Saint-Marc-des-Carrières, QC, Canada
ND: Not detected; FFA: free fatty acid.
Table 3. Suspended solids (SS) concentration for fermentations performed with different sludge solid concentrations.
Time (h)SS05 (g/L)Stdev.SS10 (g/L)Stdev.SS20 (g/L)Stdev.SS30 (g/L)Stdev.SS35 (g/L)Stdev.
−15.840.7429.981.16018.841.10329.620.48833.680.226
sterile 04.570.9486.070.28310.570.40318.870.55927.340.721
2411.431.30819.060.23316.590.51623.871.01129.340.997
4820.511.27328.341.17421.030.18425.780.52328.640.042
7221.841.20231.260.41029.530.57330.671.11737.230.580
9625.650.02827.730.42434.860.41736.210.79243.241.047
Table 4. Single factor ANOVA analysis for net biomass generation data.
Summary
GroupsSampleSSAvg.Variance
SS05242.1621.080.0032
SS10243.3221.660.72
SS20248.5824.290.6962
SS30234.6817.342.5088
SS35231.815.94.3808
Analysis of Variance
Source of VarianceSum of SquaresdFMSSFPF Critical
Between groups92.39424423.0985613.89972320.006440965.19216777
Within groups8.30951.6618
Total100.703249
Table 5. Lipid production by different strains of Yarrowia lipolytica using crude glycerol from previous studies.
OrganismGlycerol Content % w/wGly. Conc. (g/L)Time (h)Biomass (g/L)Lipid Content (% w/w)Yield (g-Lipid/g-Glycerol)Ref.
Y. lipolytica ACA-YC 50308110021620.815–20-[15]
Y. lipolytica SKY778.3112.59614.0844.600.192[3]
Y. lipolytica A10180501206.8724.90.035[16]
Y. lipolytica SKY767.5409620.3634.990.295This study
Y. lipolytica SKY767.540 (with sludge)9624.2929.350.253This study
Table 6. Summary of lipid yield, biomass yield, productivity, lipid content, and biomass concentration of this study.
SS (g/L)Lipid Yield (g/g)Biomass Yield (g/g)nL-Yield (g/g)Productivity g-Lipid/L.hLipid Content (% w/w)Net Biomass Conc. (g/L)n-Lipid Biomass (g/L)
50.1150.6550.5400.03916.0221.0817.38
100.1700.6120.4420.06324.0521.6615.65
200.2530.6970.4450.09229.3524.2915.49
300.1800.5870.4070.05521.0417.3412.03
350.1540.4190.2660.06119.5715.9310.09
SSPG0.2530.6490.3960.08328.1325.4517.51
SSCG0.2950.6840.3890.09234.9920.3611.57

