Comparison of Different Extraction Methods to Predict Anthocyanin Concentration and Color Characteristics of Red Wines


Fermentation Sciences, Appalachian State University, 730 Rivers St., Boone, NC 28608, USA
*
Author to whom correspondence should be addressed.
Fermentation 2018, 4(2), 39; https://doi.org/10.3390/fermentation4020039
Submission received: 10 May 2018
/
Revised: 30 May 2018
/
Accepted: 4 June 2018
/
Published: 7 June 2018
(This article belongs to the Special Issue Wine Fermentation)
Abstract
:Red wines ferment in contact with skins to extract polyphenols and anthocyanins that help build, establish, and stabilize color. Concentration and composition vary among genera, species, and cultivars. For this study, 11 grapes representing Vitis vinifera (Cabernet Sauvignon, Merlot, Cabernet Franc, Barbera, Syrah, Petite Sirah, Mourvedre), Vitis labrusca (Concord), Muscadinia rotundifolia (Noble), and French-American hybrids (Marquette, Chambourcin) were selected. All cultivars were fermented on skins while color extraction was monitored daily. Each grape was also extracted using six different methods (microwave, and ultrasound assisted, Glorie procedure, ITV Standard (Institut Technique de la Vigne et du Vin), AWRI method (Australian Wine and Research Institute), solvent extraction of skins) and compared to color characteristics of the wines produced by fermentation. Results show that the extraction pattern varies among cultivars. Post-fermentation maceration, pressing, and sulfur dioxide addition lead to color loss up to 68 percent of the original maximum with the highest loss for native American grapes and hybrid varieties. Extraction procedures over-estimate color in the finished wine but are more accurate if compared to peak extraction levels during fermentation. Color loss and suitability of different extraction procedures to predict color characteristics of fermented wine strongly depend on the complexity of the anthocyanin spectrum and therefore the cultivar used.
1. Introduction
Red wines are usually fermented in contact with skins and seeds to extract polyphenols, including anthocyanins, that help to build and stabilize color. Concentration and composition of anthocyanins vary significantly among genera, species, and cultivars [1,2]. The chemical structure of anthocyanins is also very variable and directly influences extractability, solubility, and color characteristics in juice and wine [3,4]. While most cultivars of Vitis vinifera have only simple anthocyanin glucosides and acylated derivatives [5], species like Vitis labrusca or other genera like Muscadinia rotundifolia, or hybrid grapes can display a wider range of anthocyanins including diglycosides of variable composition and structure [2,6]. Extraction kinetics during fermentation are strongly dependent on cultivar, wine style, fermentation conditions, pH and degree of ripeness [4,7], which makes the prediction of color characteristics in the finished wine based on original grape composition very challenging. In addition to that, anthocyanins and other polyphenols in wine start to polymerize, oxidize, and react with other wine components immediately after their extraction [8], which adds an additional challenge to any prediction model. Several polyphenol extraction approaches have been described in the literature that range from solvent based methods [9,10,11] to combinations between physical treatments with heat, microwaves, or ultrasound with mild solvents [12,13,14]. Some comparative studies suggest that selected extraction methods can be used to predict the amount of extractable polyphenols [4,15], however, most of these projects only looked at a limited number of Vitis vinifera cultivars and only compared finished wines with the predicted polyphenol concentrations. Anthocyanin extraction dynamics during fermentation have been described for Vitis vinifera only by Glorie in 1993 [3] and are usually not part of extraction prediction studies. The most frequently used extraction methods in the wine industry are the ITV Standard method [9], the extraction according to Glorie [10], and the method suggested by the AWRI [11]. Previous studies found that, despite the considerable time commitment, Glorie’s method is best suited to predict the color characteristics of red wine [4]. However, all methods lead to a significant over-extraction of phenolic substances compared to wine after fermentation, most likely because all extractions are performed with grape paste from a blender, which also leads to a complete destruction and extraction of seeds [4,15]. Microwave-assisted or ultrasound-assisted extraction techniques have been described as an alternative for grapes and other polyphenol-rich material [13,14,16]. Microwave assisted extraction can be viewed as more advanced than traditional solvent extraction methods because the matrix is heated internally and externally without a thermal gradient. Moisture inside and outside the plant cells evaporates, which produces tremendous pressure on the cell structure. When the cell walls rupture, cell material including anthocyanins leaches into the solvent until equilibrium is reached [13]. A similar principle is found with ultrasound-assisted extraction where the treatment increases mass transfer rates by cavitation forces, where bubbles explosively collapse and generate enough force to cause cell rupture [12]. With these physically assisted methods, solvent use and time commitment can be significantly reduced.
The goal of this study was to show color extraction dynamics of 11 grapes during fermentation and compare color characteristics and anthocyanin profiles of the wines to five of the most common extraction methods.
2. Materials and Methods
2.1. Winemaking
2.1.1. Grapes
For this study, 11 grapes representing Vitis vinifera (Cabernet Sauvignon, Merlot, Cabernet Franc, Barbera, Syrah, Petite Sirah, Mourvedre), Vitis labrusca (Concord), Muscadinia rotundifolia (Noble), and French-American hybrids (Marquette, Chambourcin) were selected. Grapes were sourced from North Carolina and California based on availability and condition. Berries were destemmed by hand and only healthy berries were used for the experiments. Half of the destemmed berries was mashed in one-gallon glass jars for on-skin fermentation. The other half was stored as whole berries at −20 °C for different extraction experiments. All fermentations and extractions were performed in duplicates.
2.1.2. Small Scale Fermentations
Hand-crushed berries of each grape variety were inoculated with 20 g/hL Saccharomyces cerevisiae yeast (NT 50, Anchor, Johannesburg, South Africa) and fermented at constant temperature of 20 °C for 14 days. Color characteristics of all ferments were checked daily by spectrophotometry (DU 720 UV-Vis spectrophotometer, Beckman Coulter, Brea, CA, USA) at 420, 520, and 620 nm to monitor extraction. Finished wines were pressed and clarified by centrifugation 4000 RPM (3085 RCF) (Allegra X-22, Beckman Coulter, Brea, CA, USA). 100 mg/L sulfur dioxide was added to half the wine volume to assess anthocyanin bleaching effects. These samples were stored at 4 °C until further analysis. The remaining volume was stored without sulfur dioxide at −20 °C.
2.2. Extraction Methods
2.2.1. Solvent Based Extraction of Grape Skins
The solvent based total extraction of anthocyanins from separated grape skins was based on Ageorges et al. (2006) [17] with minor modifications. Frozen berries were peeled to fully separate the skins from pulp and seeds. Fresh skin weight was recorded and half of the skin material was dried in a laboratory oven at 60 °C for three days in aluminum containers until no more weight loss could be observed. Skin dry weight was recorded. The remaining fresh skins were pulverized under liquid nitrogen, and extracted. 100 mg of berry powder was mixed with 400 µL of methanol/water/trifluoroacetic acid (70:30:1, v/v/v) as suggested by Barnes, Nguyen, Shen, and Schug (2009) [18] and sonicated for 5 min. The extract was centrifuged at 13,000 RPM (16,060 RCF) at 5 °C for 10 min (Biofuge Fresco, Heraeus Instruments, Hanau, Germany). The extraction was repeated and the two supernatants were combined and stored at −20 °C until further LC analysis.
2.2.2. Microwave Assisted Extraction
The microwave extraction procedure was based on Liazid et al. (2011) [14]. 50 g of berries were put into a kitchen blender (Mini-Prep Processor DLC-1BCH, Cuisinart, East Windsor, NJ, USA) and mashed on a low pulsed level to break pulp and skin but leave the seeds intact. The mash was then quantitatively transferred into a 120 mL plastic tube. 11 mL of 100% ethanol (Koptec, King of Prussia, PA, USA) were added to simulate wine extraction conditions and the tube was closed with a lid. After the microwave (Daewoo Electronics KOR-63D5 9, Seoul, Korea) was set to 700 W output and samples were microwaved for 2.5 min with short interruptions for stirring every full minute and after completed extraction. Juice was then decanted under low manual pressure with a potato ricer and centrifuged at 4200 RPM (3400 RCF) for 10 min. Extracts were transferred into 2 mL centrifuge tubes and centrifuged (Biofuge Fresco, Heraeus Instruments, Hanau, Germany) with 13,000 RPM (16,060 RCF) at 5 °C for 10 min. Spectrophotometric absorbance was analyzed at 280, 420, 520, and 620 nm. An aliquot of each extraction was stored at −20 °C for further LC analysis.
2.2.3. Ultrasound Assisted Extraction
Ultrasound assisted extraction was based on a method by Corrales et al. (2008) [12]. 50 g of berries were put into a kitchen blender (Mini-Prep Processor DLC-1BCH, Cuisinart, East Windsor, NJ, USA) and mashed on a low pulsed level to homogenize pulp and skin but leave the seeds intact. The mash was quantitatively transferred into a 120 mL plastic tube and 11 mL of 100% ethanol (Koptec, King of Prussia, PA, USA) were added to simulate wine extraction conditions. The tubes were placed into the sonicator (Branson 1210, 40 kHz, Danbury, CT, USA) for 60 min while stirring the mash every 10 min. Juice was then decanted under low manual pressure with a potato ricer and centrifuged at 4200 RPM (3400 RCF) for 10 min. Extracts were transferred into 2 mL centrifuge tubes and centrifuged (Biofuge Fresco, Heraeus Instruments, Hanau, Germany) with 13,000 RPM (16,060 RCF) at 5 °C for 10 min. Spectrophotometric absorbance was analyzed at 280, 420, 520, and 620 nm. An aliquot of each extraction was stored at −20 °C for further LC analysis.
2.2.4. ITV Standard Extraction Method
The ITV extraction method was adapted from the description of Cayla et al. (2002) [9]. 50 g of berries were put into a kitchen blender (Mini-Prep Processor DLC-1BCH, Cuisinart, East Windsor, NJ, USA) and mashed on a low pulsed level to homogenize pulp and skin but leave the seeds intact. The mash was then quantitatively transferred into a 120 mL plastic tube and 15 mL of 96% ethanol and 85 mL of 0.1% hydrochloric acid (both VWR International, Radnor, PA, USA) were added. The mixture was incubated for one hour and shacked every 15 min. Juice was then decanted under manual pressure with a potato ricer and centrifuged at 4200 RPM (3400 RCF) for 10 min. The supernatant was decanted and analyzed at 420 and 620 nm. Every extract was then diluted 1:20 with the extraction solution (ethanol and hydrochloric acid). Spectrophotometric absorbance of the diluted extracts was analyzed at 280 and 520 nm. An aliquot of each undiluted extraction was stored at −20 °C for further LC analysis.
2.2.5. AWRI Based Extraction Method
The extraction method for polyphenols used by the AWRI was modified from the description by Iland et al. (2004) [11]. 20 g of berries were put into a kitchen blender (Mini-Prep Processor DLC-1BCH, Cuisinart, East Windsor, NJ, USA) and mashed on a low pulsed level to homogenize pulp and skin but leave the seeds intact. 4 g of the mash were then quantitatively transferred into a 50 mL plastic centrifuge tube. 4.4 mL of a 10 N hydrochloric acid were added to 50% ethanol in water (all VWR International). 20 mL of this solution were then added to the sample and agitated on a shaker table at 30 RPM for one hour at room temperature with more intense manual shacking every 15 min. The samples were centrifuged at 4200 RPM (3400 RCF) for 10 min. Spectrophotometric absorbance of the supernatant was analyzed at 420 and 620 nm with extraction solution as a reagent blank. Each sample was then diluted with 1% hydrochloric acid and absorbance was analyzed at 280 and 520 nm with the 1% HCl as a reagent blank. An aliquot of each undiluted extraction was stored at −20 °C for further LC analysis.
2.2.6. Glorie Extraction Assay
The method for the extraction of anthocyanins and polyphenols developed by Glorie (1984) [10] was adapted with modifications from the description by Kontoudakis et al. (2010) [4]. 100 g of berries were put into a kitchen blender (Mini-Prep Processor DLC-1BCH, Cuisinart, East Windsor, NJ, USA) and mashed on a low pulsed level to homogenize pulp and skin but leave the seeds intact. Two different pH solutions were prepared, a pH 1 solution with 0.3 M oxalic acid (Alfa Aesar, Ward Hill, MA, USA) adjusted with hydrochloric acid and a pH 3.2 with 0.3 M phosphoric acid (VWR International) adjusted with 10 M sodium hydroxide. 50 mL of the pH 1 solution was added to 50 g of grape mash and 50 mL of the pH 3.2 solution was added to the other 50 g of the grape mash. Both were incubated for 4 h at room temperature with shaking every 30 min. Both sample sets were centrifuged at 4200 RPM (3400 RCF) for 10 min. 21 mL extraction solvent (5 mL ethanol and 16.7 mL 12% HCl in 100 mL water) were added to 1 mL of each pH sample supernatant. 4 mL of a 15% (w/w) sulfur dioxide were added to 10 mL of each sample (sulfured samples), while 4 mL water were added to an additional 10 mL of each sample (native samples). All samples were incubated for 15 min and room temperature and analyzed at 280, 420, 520, and 620 nm against the dilution solution (ethanol and HCl in water) as a reagent blank. Extractable and potential anthocyanins were calculated using Formulas (1) and (2). An aliquot of each extraction was stored at −20 °C for further analysis.
Potential anthocyanins [mg/L] = [A520 (pH 1) − A520 (pH 1; SO2)] × 875
Extractable anthocyanins [mg/L] = [A520 (pH 3.2) − A520 (pH 3.2; SO2)] × 875
2.3. Analytical Tools
2.3.1. Photometric Quantification of Polyphenols and Anthocyanins
For quantitative analysis of anthocyanins and polyphenols in wines and extracts, a photometric approach was taken as suggested by Fragoso et al. (2010) [15]. The absorbance at 280 and 520 nm was analyzed for all wines and extracts and compared to a corresponding calibration curve. Samples were diluted with tartrate buffer at pH 3.2 (5 g/L tartaric acid, pH adjusted to 3.2 with 1.0 M NaOH) to fit the linear absorbance range. The polyphenol calibration curve at 280 nm was prepared from a 5.06 g/L gallic acid (gallic acid anhydrous 99%, Alfa Aesar, Heysham, UK) stock solution in 50% ethanol (200 proof, Koptec, King of Prussia, PA, USA) and diluted with tartrate buffer at pH 3.2 into four calibration levels. The anthocyanin calibration curve at 520 nm was prepared from a 2.1 g/L malvidin-3-glucoside (Oenin chloride, Fluka, St. Louis, MO, USA) stock solution in 1% hydrochloric acid (hydrochloric acid 36.5–38%, ACS grade, VWR International) and diluted with tartrate buffer at pH 3.2 into four calibration levels.
2.3.2. Berry, Juice, and Wine Analyses
Standard juice and wine analysis for density, sugar concentration, total acidity, and pH was performed using FT-MIR spectroscopy (FT 2, Foss, Hillerød, Denmark). Nitrogen attributes in the juice were analyzed using spectrophotometry with a commercial kit for ammonium (Ammonia Assay Kit, Megazyme, Bray, Ireland), and the NOPA method published by Dukes and Butzke (1998) for α-amino acids [19]. Total yeast available nitrogen (YAN) was adjusted to 10 mg/L per degree Brix at the second day of fermentation using diammonium phosphate. Total phenolics were analyzed as gallic acid equivalents (Folin−Ciocalteu) as described by Singleton and Rossi (1965) [20]. Total tannin content was determined using a methyl cellulose precipitations assay as described by Sarneckis et al. (2006) [21].
2.3.3. Analysis of Anthocyanins by LC-DAD
The analysis of anthocyanins by LC-DAD at 520 nm was adapted from Rentzsch et al. (2009) [22]. The LC instrument used was an Ultimate 3000 system (Dionex, Sunnyvale, CA, USA) with a Diode Array Multiwavelength Detector. 10 µL of sample was injected onto a Kinetex® 2.6 µm F5 100 Å separation column with the dimensions 50 mm × 2.1 mm (Phenomenex, Torrance, CA, USA). The oven temperature was set to 50 °C. A binary gradient at a constant flow of 0.6 mL/min was used with eluent A being water with 5% acetonitrile and a 10 mM KH2PO4/H3PO4 buffer and eluent B being a 50:50 acetonitrile–water mixture with a 10 mM KH2PO4/H3PO4 buffer. Conditions started at 90% eluent A decreased to 85% by 5 min, from 85% to 70% after 12 min, and from 70% to 60% by 15 min, and to 40% after 18 min. After 20 min, it was then set back to initial conditions (90% eluent A) for one minute to reach equilibrium (total analysis time 22 min).
Instrument control and data acquisition were performed with Chromeleon Version 6.80 (Dionex). Anthocyanins were quantified as malvidin-3-glucoside equivalents (standard purchased from Sigma-Aldrich, St. Louis, MO, USA).
2.4. Statistical Analyses
Data handling and statistical analysis were performed using SigmaPlot 12.5 (Systat Software Inc., San Jose, CA, USA) and XLstat 2018.3 (Addinsoft, New York, NY, USA).
3. Results and Discussion
Fermentations finished within 10 days varying with sugar level, which was greatly dependent on growing region and grape cultivar. However, extended macerations continued for a total duration of 14 days to standardize the extraction prior to pressing. Table 1 shows sugar, nitrogen, and acid levels prior to fermentation and prior to diammonium phosphate additions. Some cultivars did not require nitrogen addition, so diammonium phosphate (DAP) was added to deficient trials to reach the recommended 10 mg/L nitrogen per percent sugar.
All wines finished fermentation and fermented to dry. Table 2 shows analytical data collected from wines after pressing and clarification. Since berries were destemmed manually and mashed after separating them into duplicates, the solid-to-liquid ratio was not affected by processing. As a result, the variability among experimental duplicates is minimized and reflects only minor differences and inconsistencies within clusters of one cultivar. Since these fermentations were performed on a four liter scale, inconsistencies within clusters are exaggerated compared to a large scale production where differences are neutralized in a larger volume. The rate of ethanol production and therefore polyphenol extraction depends on the initial sugar concentration but also the solid-to-liquid ratio [23]. Total tannins and total phenols were analyzed as catechin and gallic acid equivalents, respectively. The numbers fall into the range that was previously reported for wines that were made from these cultivars.
In order to evaluate the levels of total phenols and total tannins after fermentation, it is important to know the relationship between extractable surface area (berry skin) and average berry volume. This information is commonly provided by the 100-berry-weight which leads to the average weight per berry and the weight of the skin in fresh and dried condition. This information is provided in Table 3 for all grape cultivars studied. Because of large differences in overall berry volume, the average weight per berry does not correlate with the fresh skin weight. In fact, berry weight shows much more variability than skin weight. The total amount of extractable anthocyanins and polyphenols shows a similar pattern to the concentrations that were actually analyzed in the wines after fermentation of the skins. However, some variability is caused by a changing solid-to-liquid ratio based on berry volume.
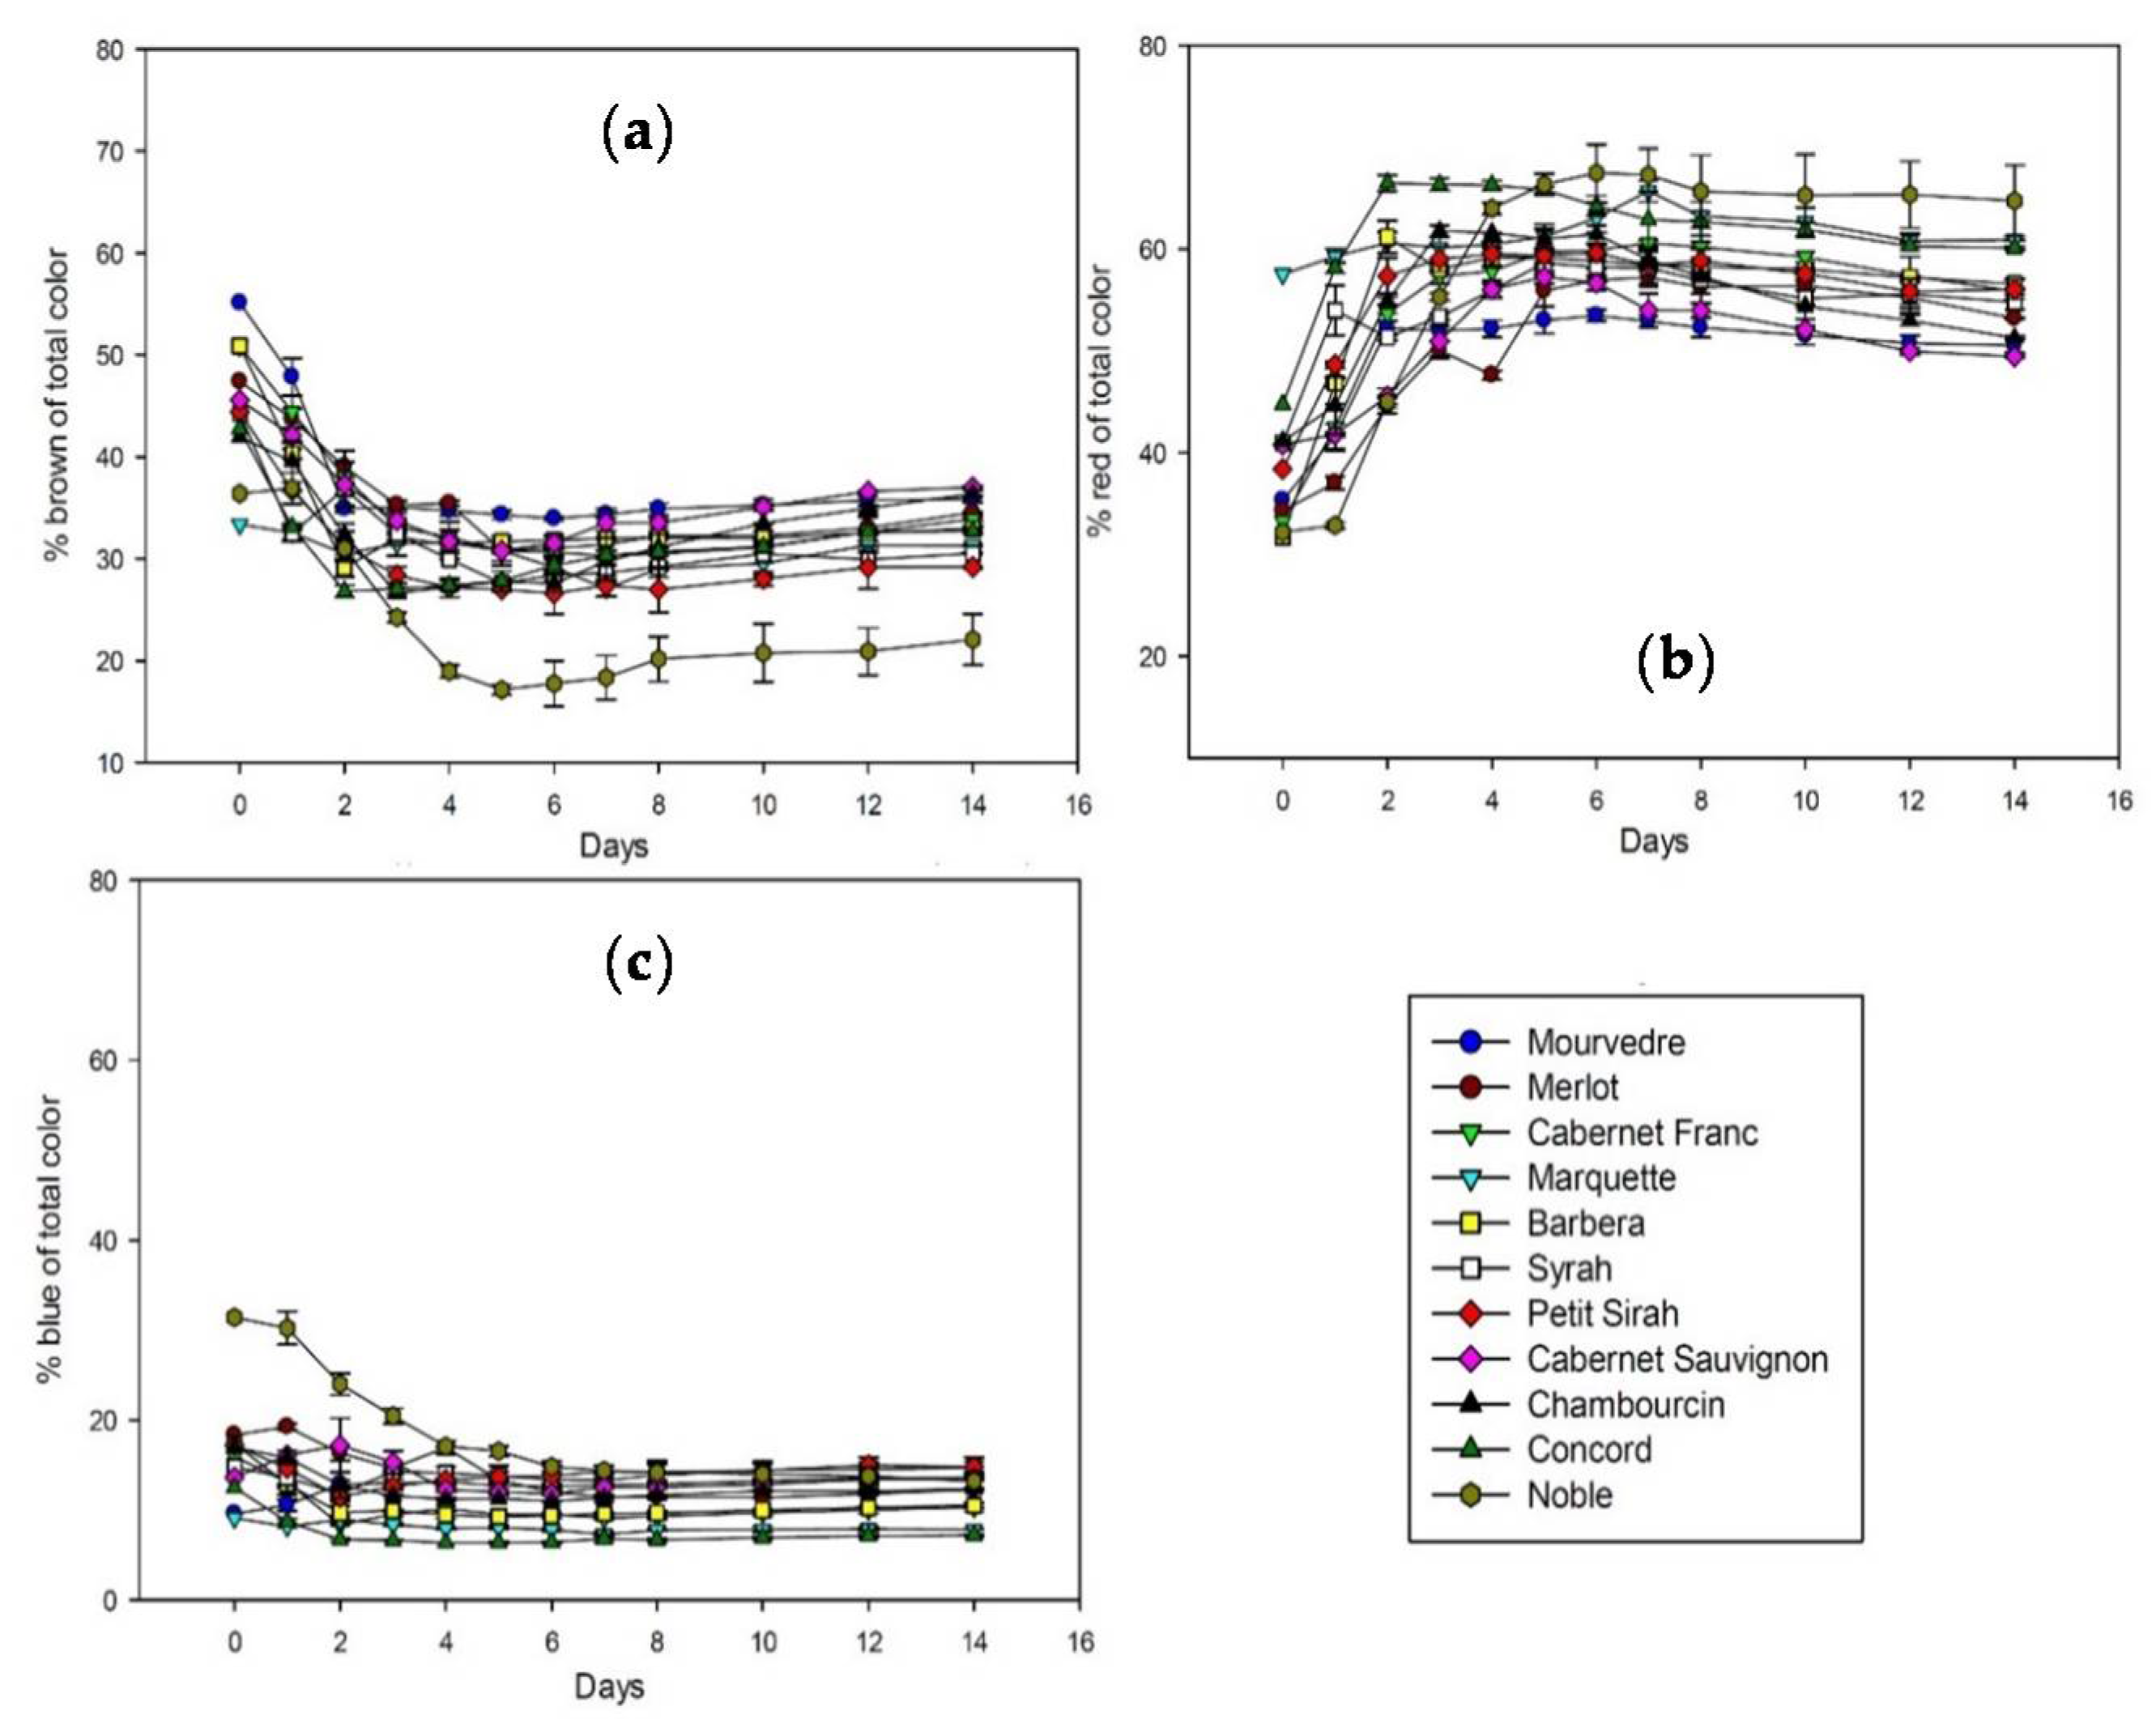
Although the amounts of extractable polyphenols and anthocyanins vary significantly among grape species and cultivars, the overall extraction pattern follows the same general trend. Figure 1 shows the extraction of brown, red, and blue color during fermentation and maceration of all studied cultivars. The percentage of brown relative to total color is decreasing after fermentation started and reaches a minimum after three to five days. The slow increase after that until day 14 is probably due to the slow development of polymeric pigments. Red color is constantly extracted in the first two to three days and stays at a stable level until day 14. Blue color remains stable throughout fermentation, with the exception of Noble that shows a decrease in blue color in the beginning of fermentation.
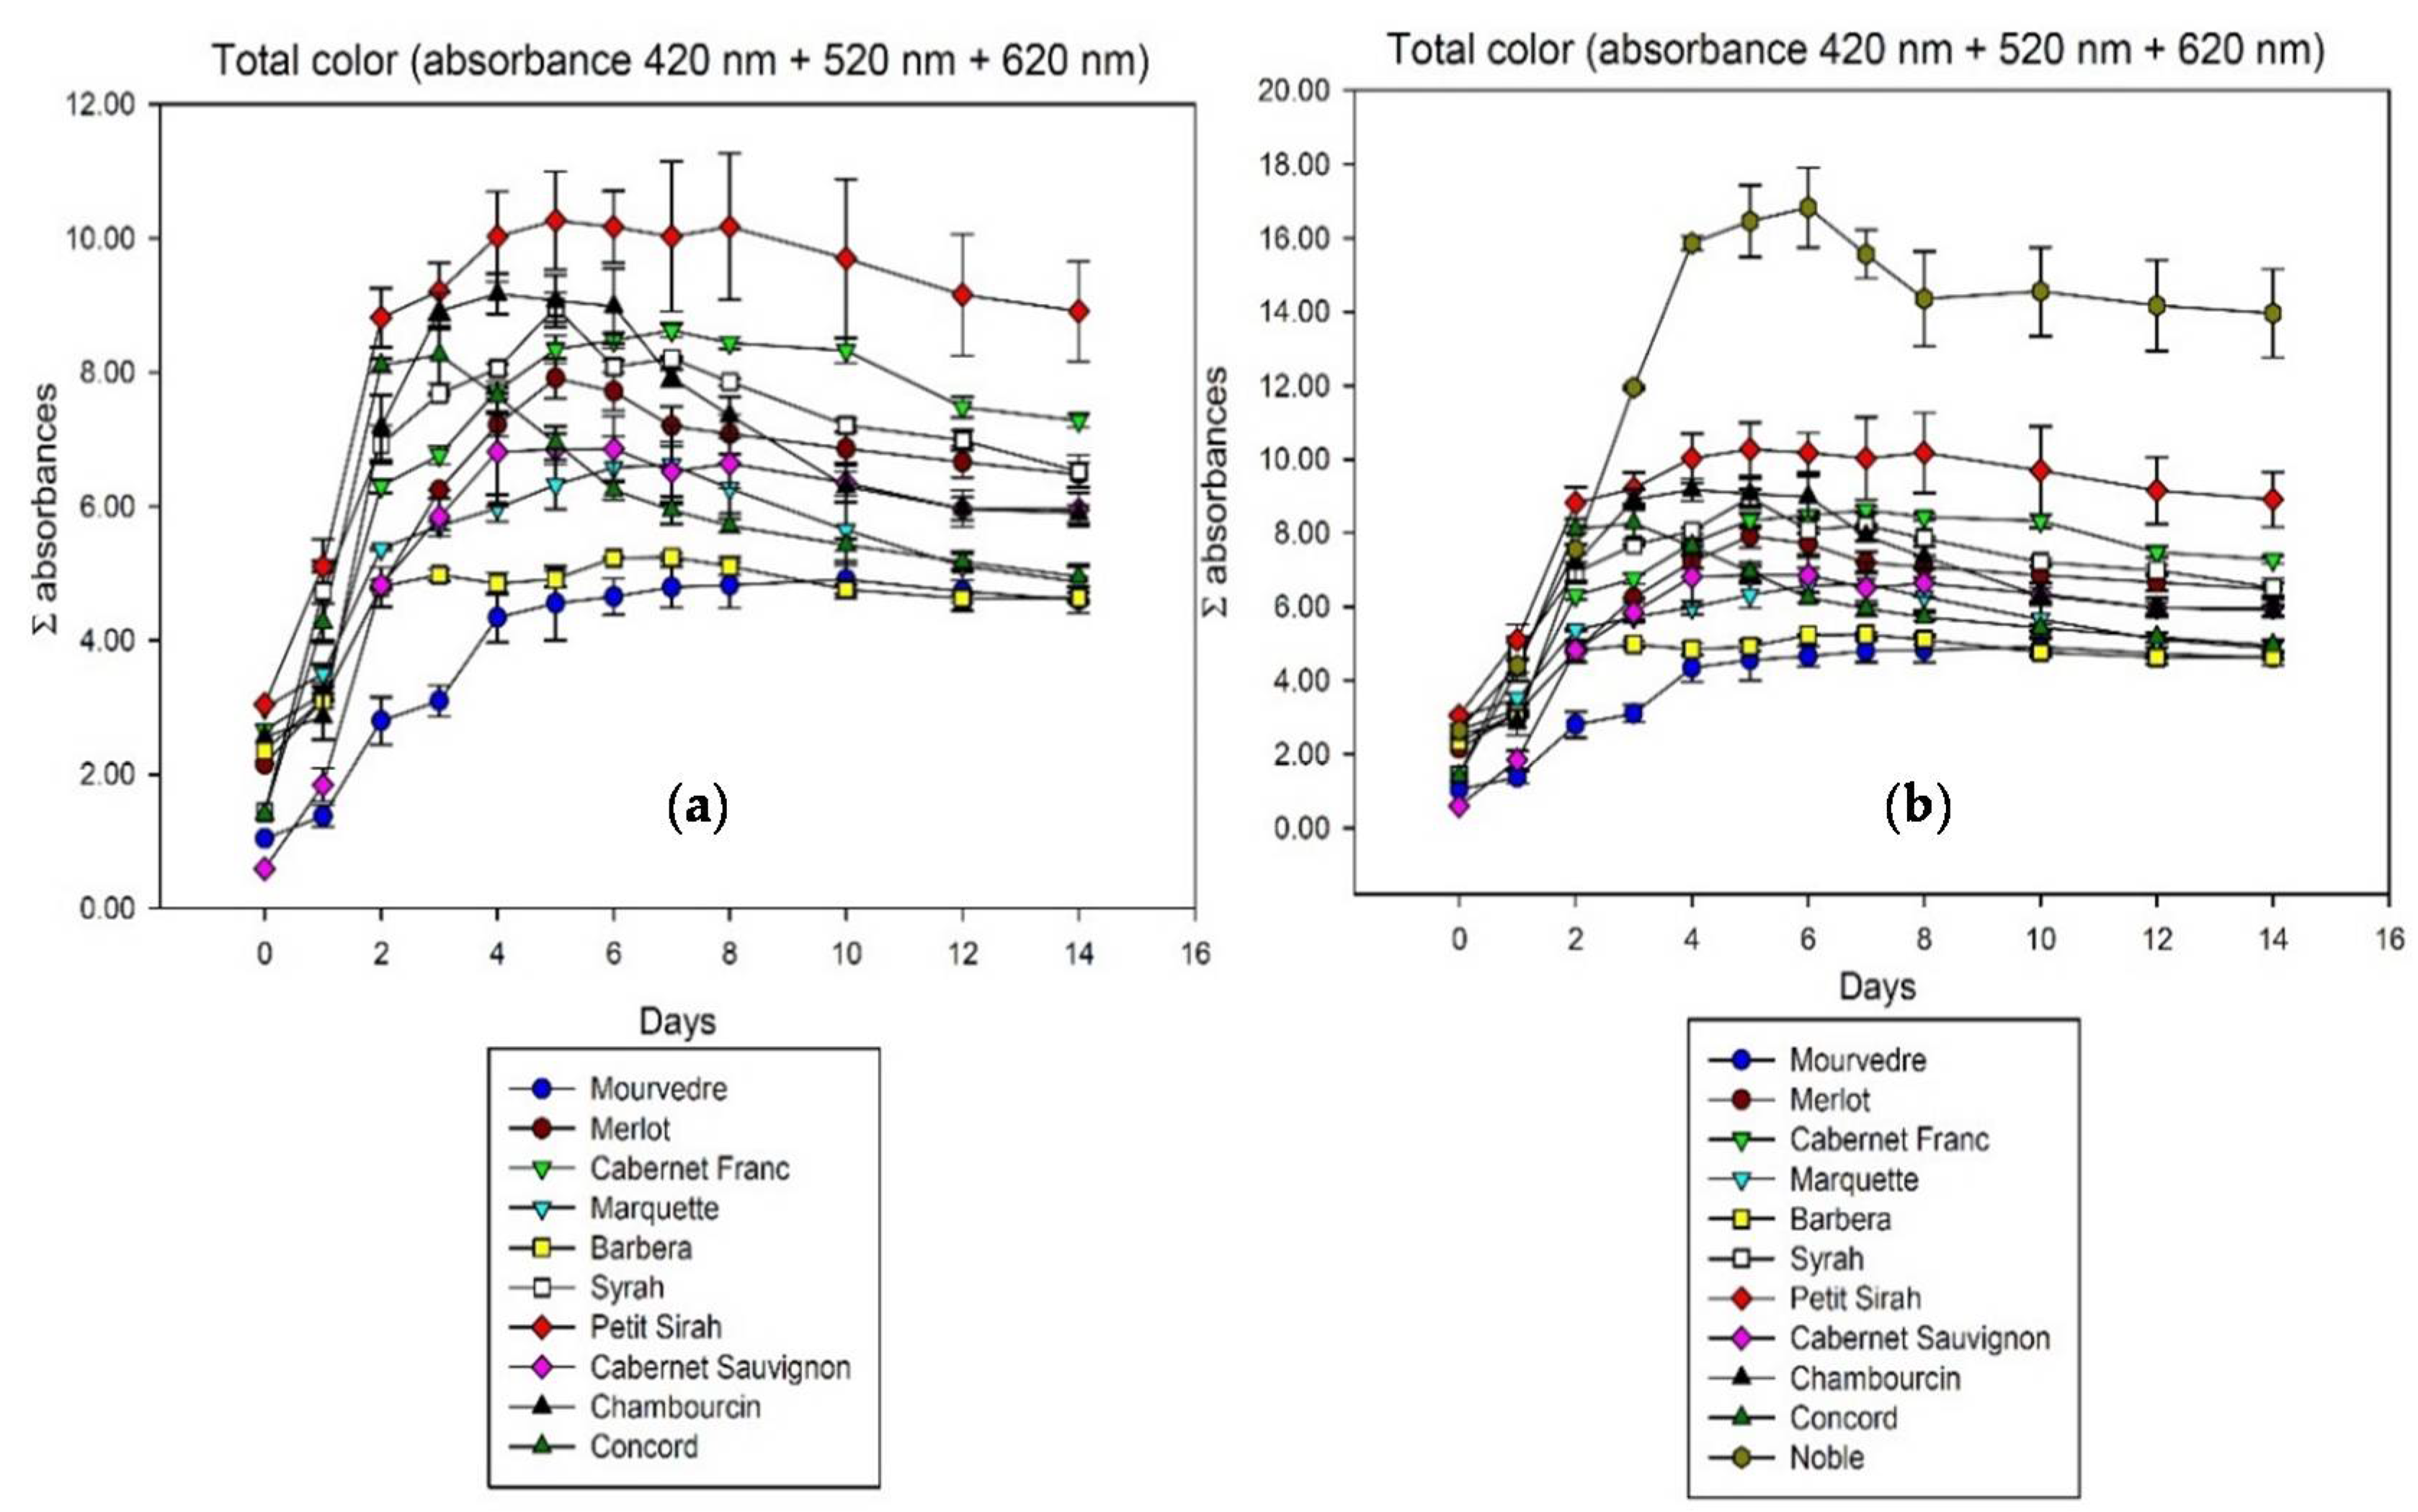
While the percentage of color does not reveal major differences, the total color shows more variability among grape varieties. Figure 2 summarizes the total color of all wines observed, expressed as the sum of photometric absorbances at 420, 520, and 620 nm. Noble as the only M. rotundifolia behaves differently due to a much higher overall extraction level, so Figure 2a shows all the wines except Noble improving the visibility of differences.
It was described before that anthocyanins are not all equally well extractable from berry skin [3,7]. The differences in extractability of anthocyanins show in the total time it takes to reach the color extraction maximum. While some cultivars like Cabernet Franc and Mourvedre need seven days or more to reach that point, color extraction of Concord peaks after only three days. Previous studies associated the extractability with the level of ripeness [4], in this study however, the grape species and cultivar also has an effect. The other main difference among samples is the rate of color loss after reaching that maximum. Although Concord color is extracted very fast, it also shows the fastest rate of loss with more than 40% until the end of maceration on day 14. The reasons for that are speculative at this point but might be related to the anthocyanin spectrum and the presence or absence of stabilizing factors like polysaccharides and other colorless polyphenols. The biggest color losses in the first 14 days of our experiments can be observed in North American Vitis species and hybrids. Concord (40.2%), Chambourcin (35.8%), and Marquette (26.5%) seem to have a less stable color than most Vitis vinifera grapes which lost an average of 15.1% in the same 14 days. There is of course variability among European grapes as well, a trend however can be hypothesized based on the present data.
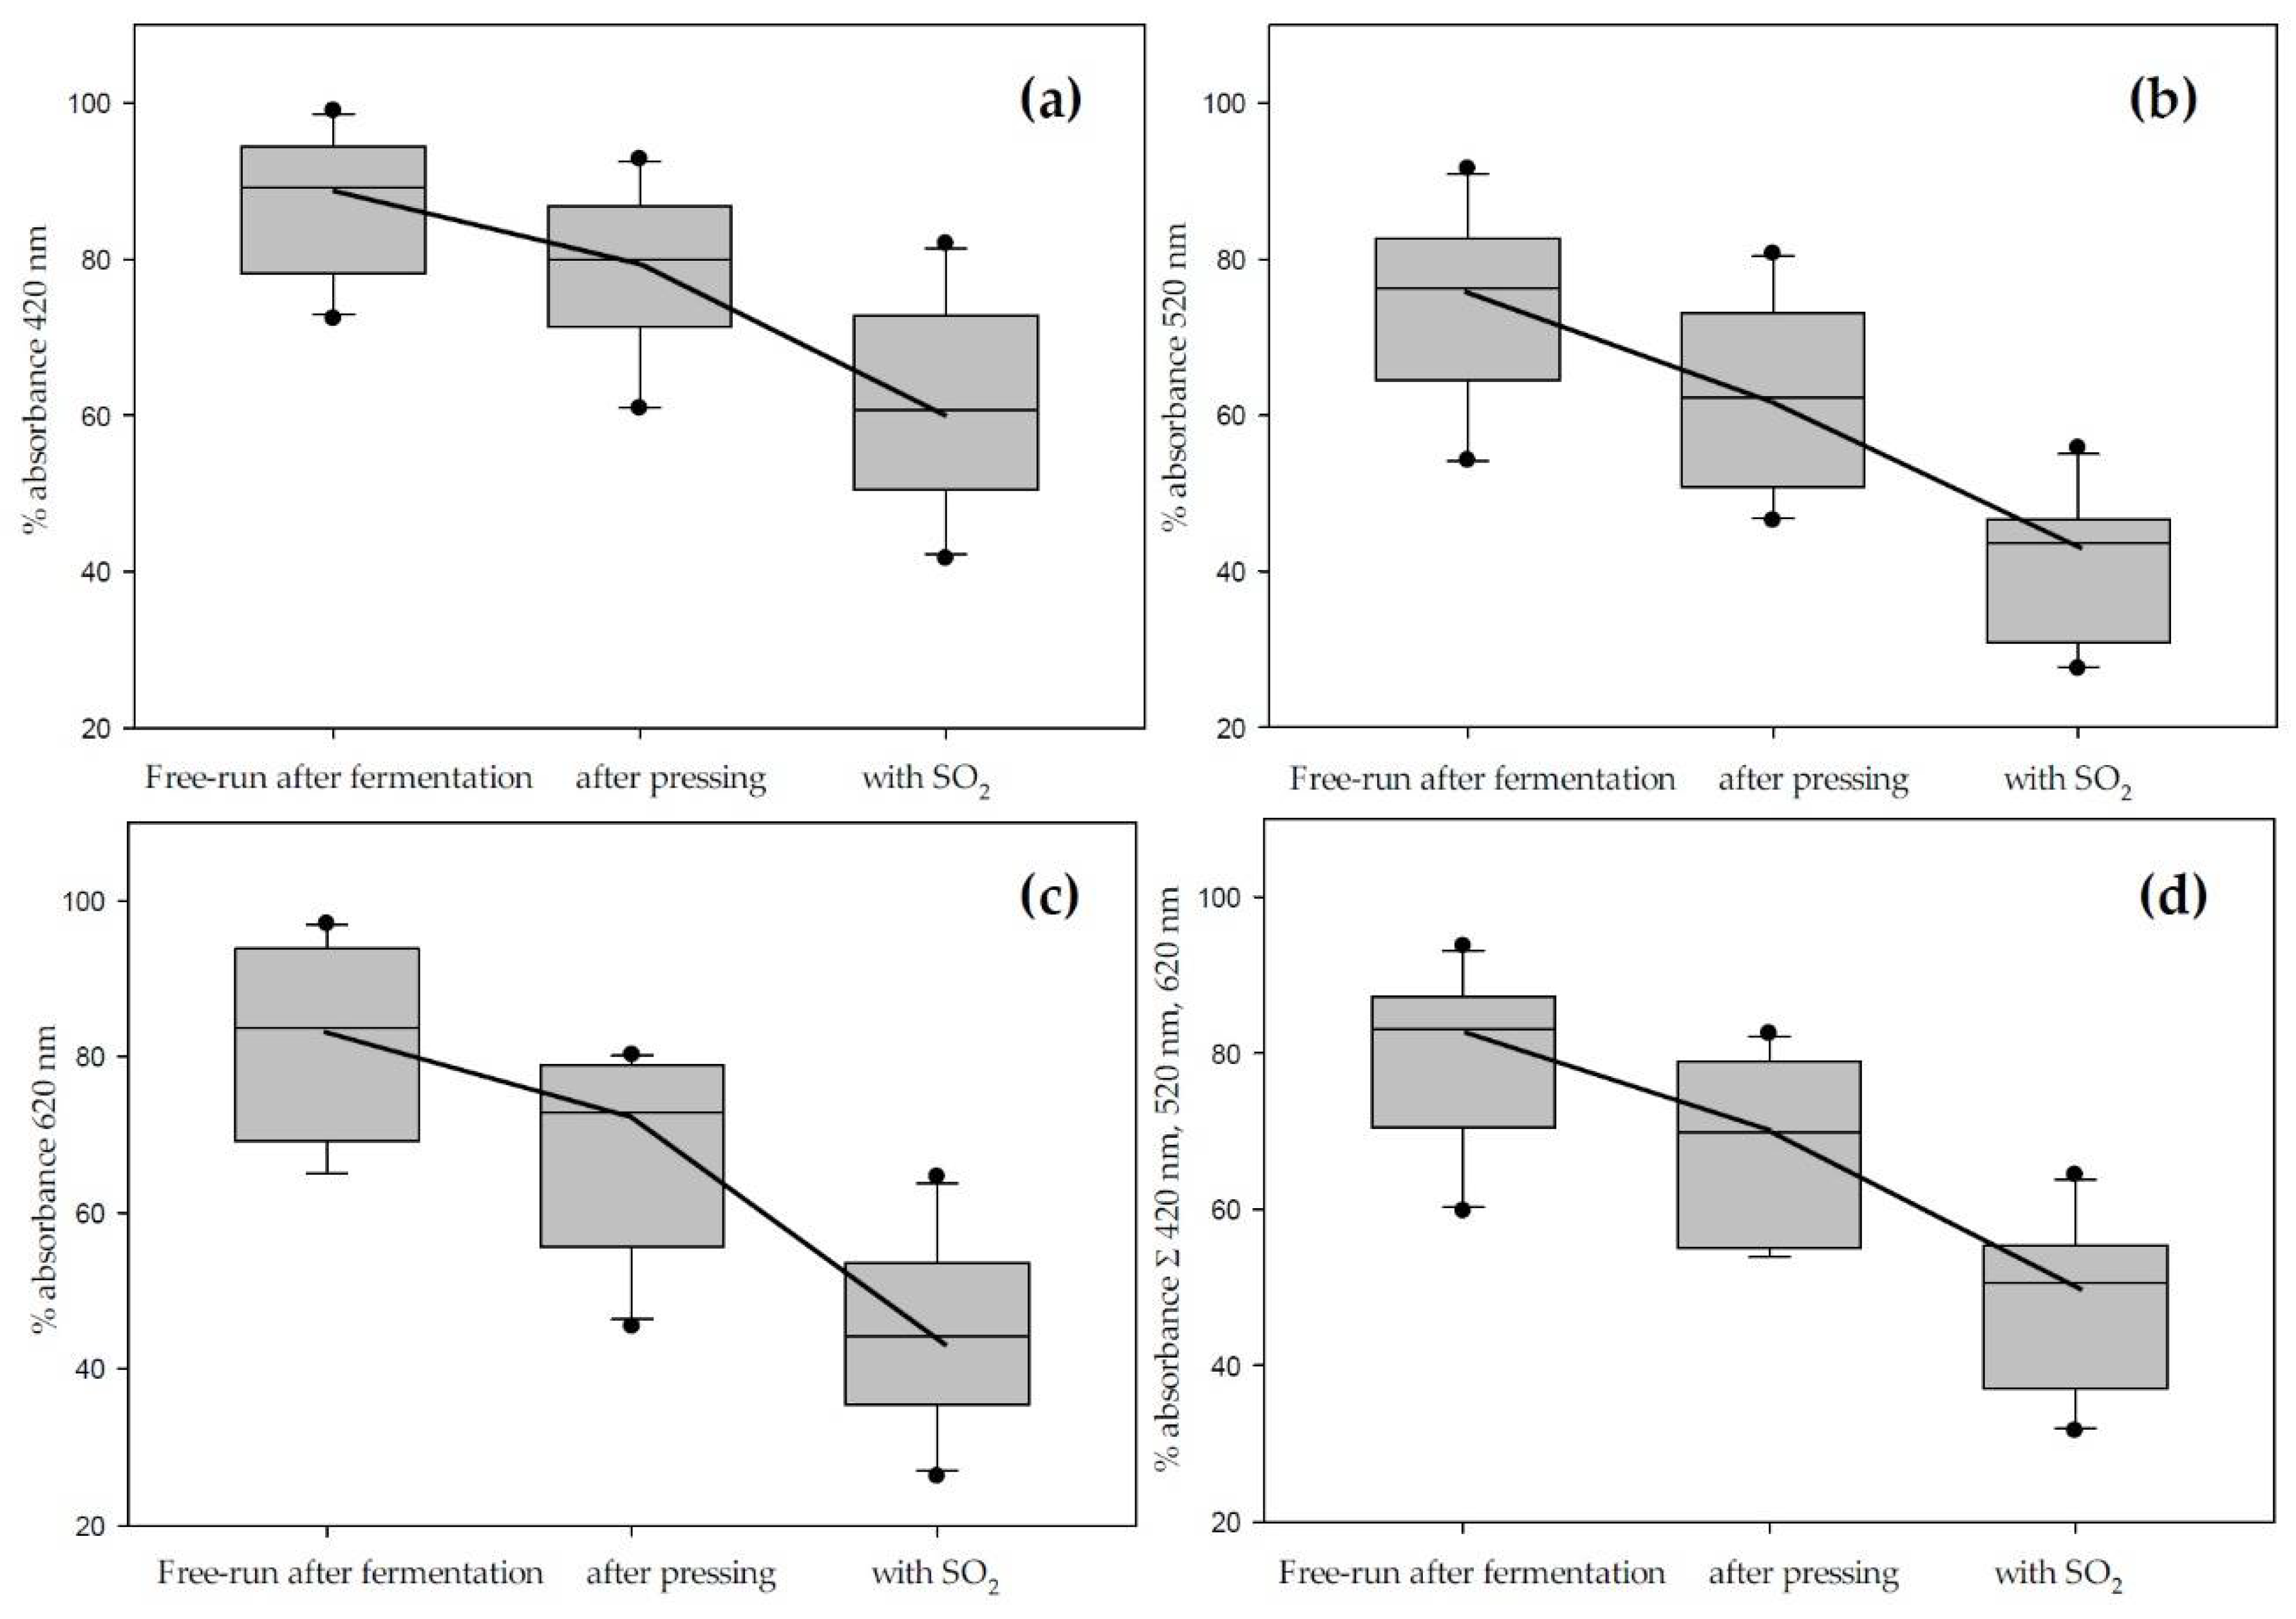
After 14 days of fermentation and extended maceration, all grapes were pressed, clarified and stabilized by sulfur dioxide addition. Since any physical force changes the extraction kinetics and SO2 has a bleaching effect on monomeric anthocyanins [24], the total color change was further monitored throughout the process.
Figure 3 and Table 4 illustrate the main findings. Figure 3 does not include data from the M. rotundifolia grape Noble due to differences that qualified the data points as outliers and changed the scaling. The boxplots show brown, red, blue, and total color analyzed at the appropriate wavelengths after fermentation, after pressing, and after sulfur dioxide addition. The color loss is most prominent in the blue spectrum but is very consistent across the whole range. Table 4 shows the individual color losses at each step of the winemaking process, including the days up to the color extraction maximum at each wavelength.
In order to predict the color characteristics and the amount of extractable phenolic material, the most common extraction procedures were performed and compared to the wines after fermentation. The main differences between traditional extraction techniques are pH, time, solvent strength, and temperature. For these experiments, we selected a large variation among these factors with ethanol being the main solvent and pH adjustments ranging from pH 1 to native pH around 3.9. Since extracted anthocyanins and total phenolics were quantified as malvidin-3-glucoside and gallic acid equivalents, respectively, the results can be directly compared to the wines after fermentation. Table 5 shows the extraction results for all grape cultivars.
Most extraction methods used here show the tendency to over-extract anthocyanins while underrepresenting total polyphenols. In order to see correlations and trends, statistical analyses, shown in Table 6, used correlation coefficients and calculated if the observation is significantly similar. The results indicate that most extraction methods correlate significantly with the phenolic composition of the finished wines. The color extraction discussed above however makes it a relatively weak correlation. While anthocyanins and other polyphenols in wine start to polymerize, oxidize, and react with other wine components immediately after their extraction, the extracts do not have the time to mimic that before they are analyzed. Table 6 therefore includes the mentioned color extraction maximum as well, which shows an improved correlation. In fact, when the extracts are compared to the peak color intensity, some of the correlations are highly significant with correlation coefficients above 85%. This observation illustrates the difficulties of predicting color characteristics in real wine fermentations. The factor time and the reactivity of wine polyphenols cannot be factored into the prediction model because it varies with grape cultivar, production method, and the overall redox potential throughout the process.
The microwave and ultrasound assisted extraction methods show no significant correlation with color characteristics but are highly significant for total phenolics. The explanation for this observation is most likely the pretty severe change in extraction conditions compared to wine. Both methods use physical force to break cell walls and could lead to a change in extraction kinetics. Especially for acylated anthocyanins, which were shown be extracted easier than mono-glucosides due to their higher solubility in water [4], a destruction of cell wall material favors their extraction. In addition, acylated anthocyanins are more entrapped in the matrix or form hydrogen bonds with polysaccharides, which can inhibit their extraction [12]. Microwave and ultrasound assisted extractions have the potential to release more phenolic material than solvent based methods by disrupting these structures.
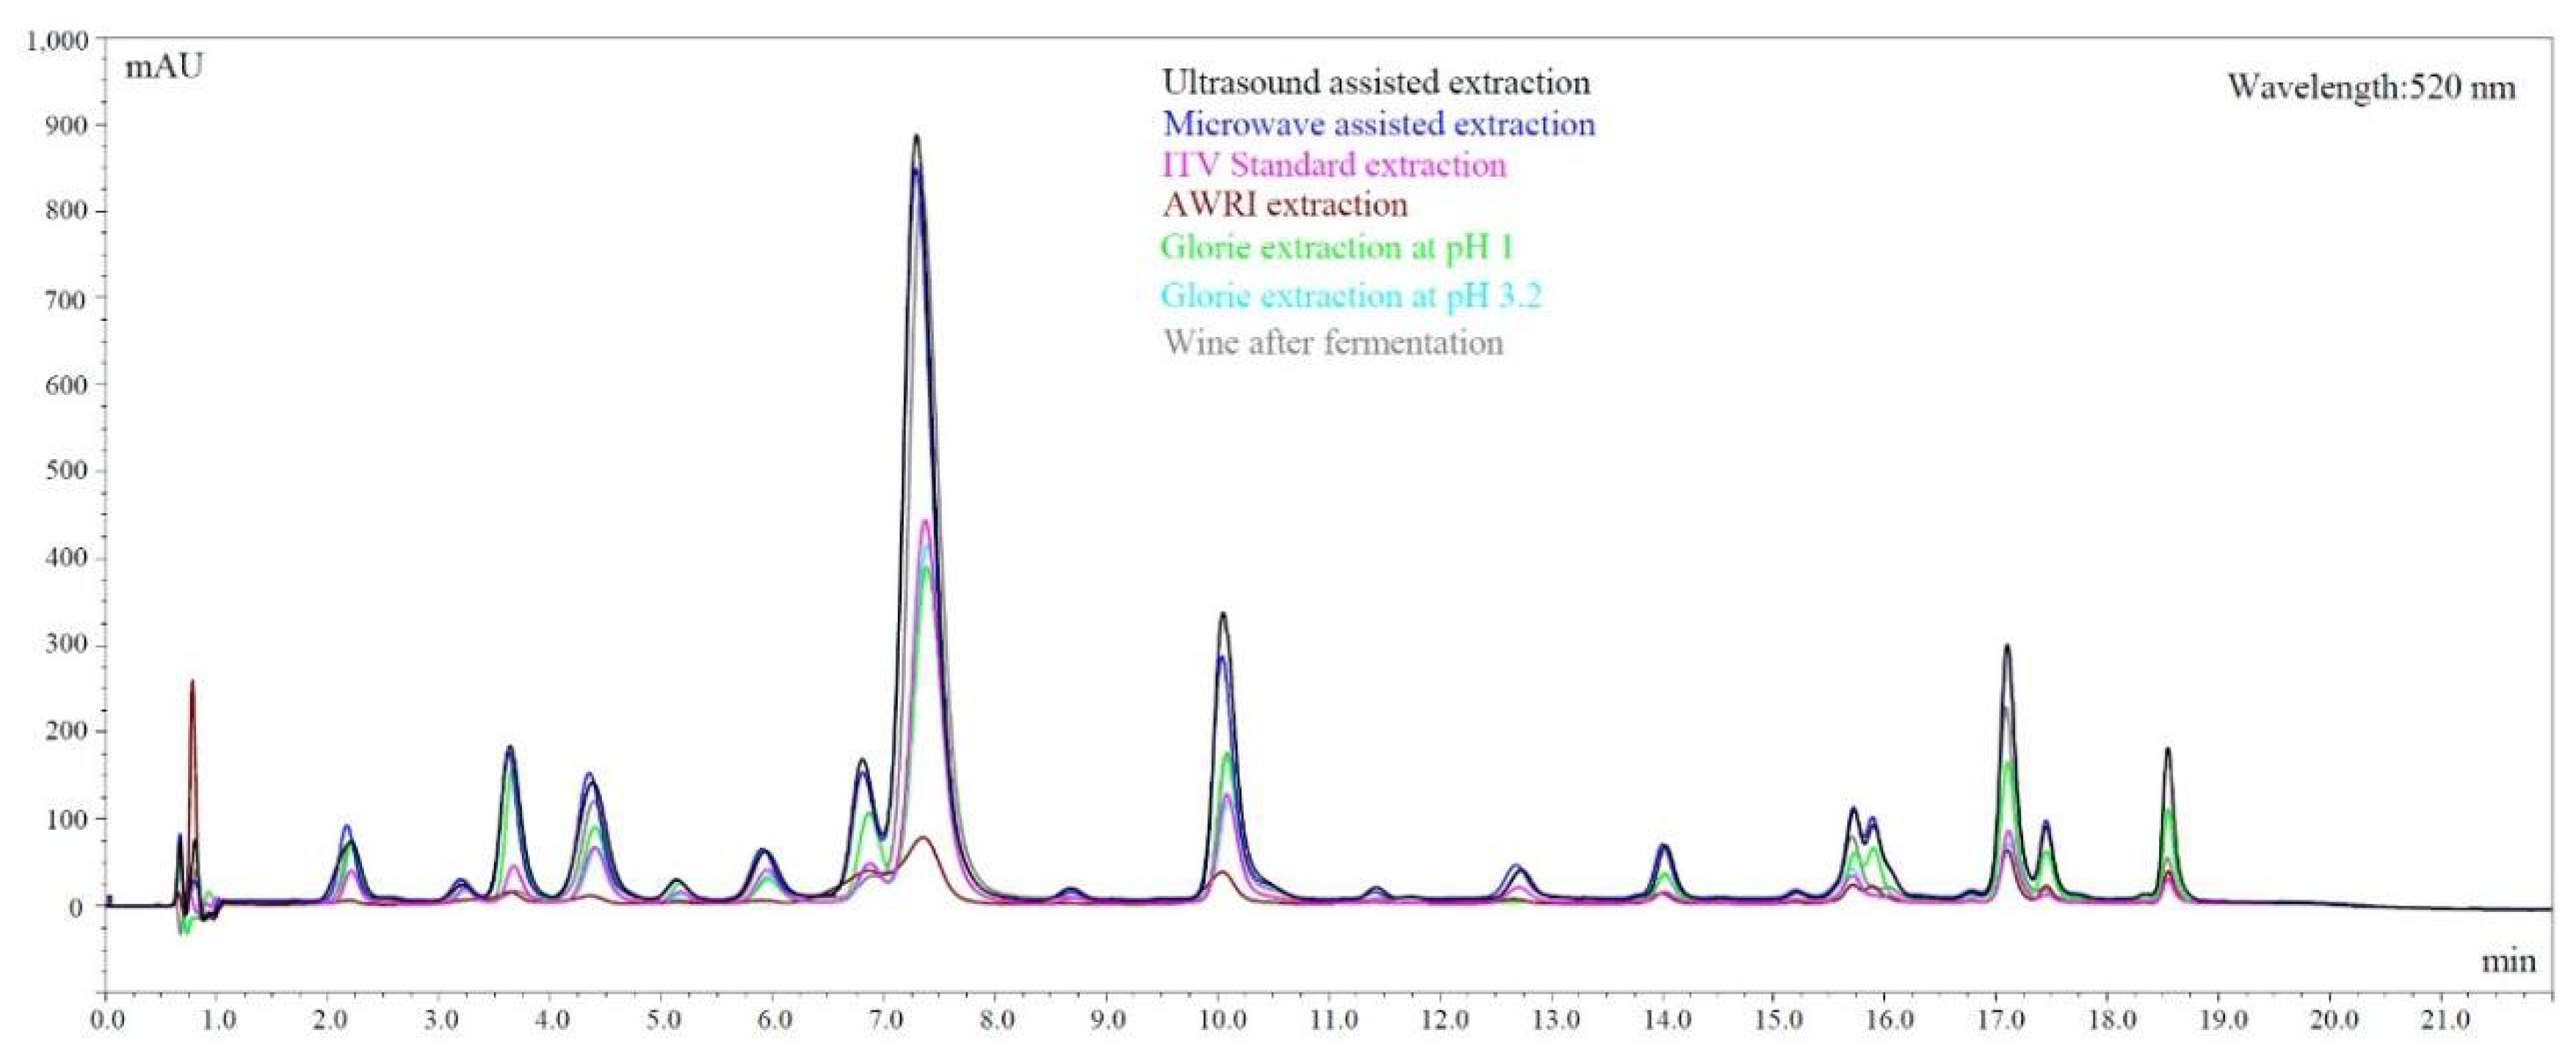
The overall differences in extraction between the methods are best visualized in an overlay of LC chromatograms, shown in Figure 4. For this figure, Chambourcin was chosen because, being a hybrid, the grape has one of the broadest anthocyanin spectrums in this study. Although not all compounds are baseline separated with this quick method, it is obvious that anthocyanins in the second half of the chromatogram are not or only poorly extracted by some of the methods used here. The method that stands out is the AWRI extraction. It was originally not designed to predict anthocyanins and although it shows a good correlation with the red wines after fermentation, it does not nearly extract as much anthocyanins as other methods. The spectrum however and the ratio between single anthocyanins is close to the corresponding wine. Ultrasound and microwave assisted extraction on the other hand severely over-extract color compounds as shown in Figure 4. The ratio is not close to the real wine, which explains the non-existing correlation shown in Table 6.
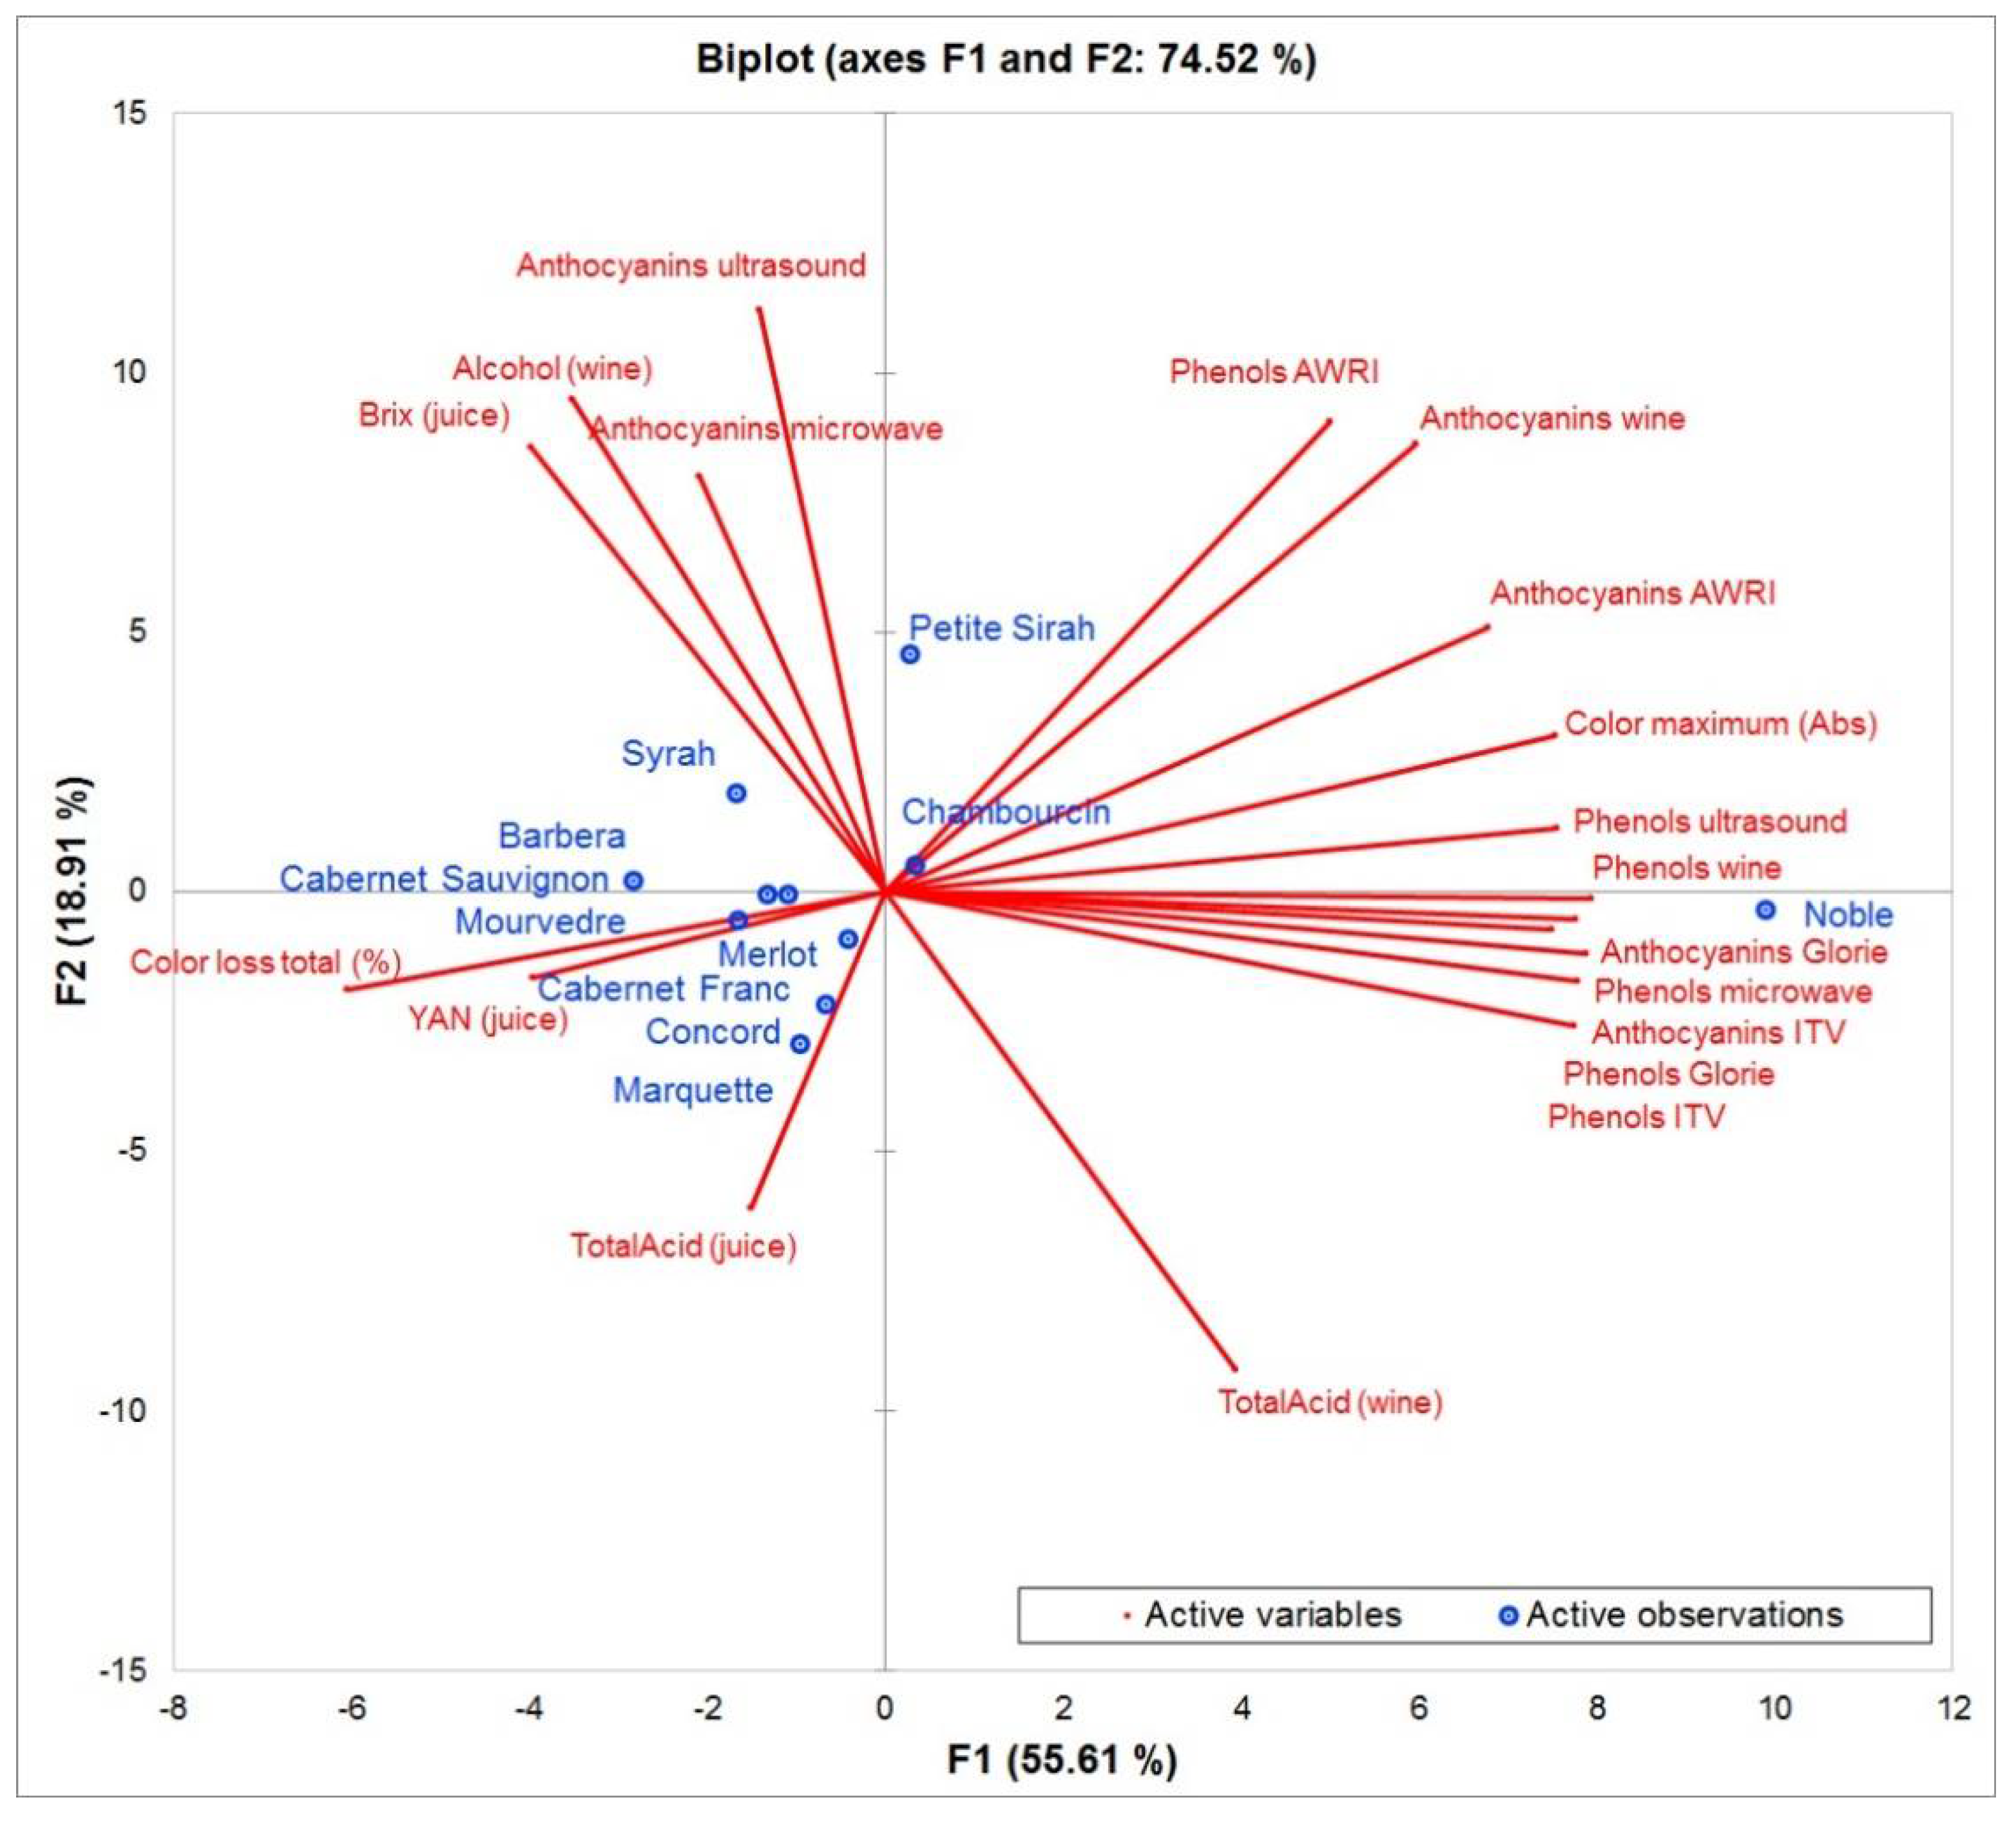
It can still be used to have a complete spectrum of anthocyanins but is not useful for the prediction of color characteristics. The grape crushing method suggested in our study should be considered, since it was less destructive than other methods. In previous studies, the grape material is often completely destroyed including seed material, which increases the rate of polyphenol extraction and could be less representative of an actual wine fermentation. Figure 5 summarizes these observations in a Principle Component Analysis. Most extraction methods are positively correlated, which implies that the quality of their prediction is similar. The vectors of anthocyanins extracted by microwave and ultrasound are located at a 90 degree angle to the other extractions, showing that there is no correlation between them.
4. Conclusions
The overall goal from a winemaker’s perspective when evaluating red grapes before harvesting is to predict the phenolic profile and color characteristics of the finished product and determine the harvest date accordingly. This study aimed to provide insight into different laboratory-based extraction methods and compare the extracts to wines that were fermented on the skins. Most previous publications used a limited number of extraction methods and looked primarily at Vitis vinifera grapes while we included hybrids and North American grape cultivars as well. During fermentation, all cultivars reached a color extraction maximum after a few days and then started to lose color. This presents the main challenge with predicting color characteristics, because most methods show much better correlations with the wine when they are compared to the maximum color intensity and not the finished wine after processing. The level of anthocyanin extraction as well as color loss due to oxidation, polymerization, pressing, and sulfur addition depends, among previously reported characteristics like the level of ripeness and the grape cultivar. Varieties with a more complex anthocyanin spectrum display a different extraction pattern that cannot be mimicked accurately with some of the extraction methods. Because most methods tend to over-extract phenolic material, the correlation with the peak of color intensity is much better.
Despite the large time commitment, the extraction suggested by Glorie is still the best way to predict extractable anthocyanins, mostly because the method compares different pH conditions in one assay. The ITV Standard method also correlated well with the color extraction maximum but had a larger discrepancy with the wines after processing. Physically invasive methods like ultrasound or microwave assisted extractions are great for extracting more anthocyanins but over-extract to an extent where the spectrum is too different from the corresponding wine to be useful for a prediction model. The correlation with total phenols on the other hand shows promising results. Ultrasound assisted extraction, for example, does not use harsh solvent conditions and consumes very little time and energy, which potentially makes it a very convenient method to predict total extractable phenolics as a cost-effective alternative for smaller wineries.
Author Contributions
Conceptualization, Methodology, Formal Analysis, S.S.; Formal Analysis and Resources, S.D.C.
Acknowledgments
This project was supported through generous grape donations by wineries in North Carolina. We would like to thank Grandfather Vineyards and Winery, Jones von Drehle Vineyards and Winery, Windsor Run Cellars, as well as Ivory Tower Inc. for their generosity and continuous research support.
Conflicts of Interest
The authors declare no conflict of interest.
References
- Revilla, E.; Garcı́a-Beneytez, E.; Cabello, F.; Martı́n-Ortega, G.; Ryan, J.-M.A. Value of high-performance liquid chromatographic analysis of anthocyanins in the differentiation of red grape cultivars and red wines made from them. J. Chromatogr. A 2001, 915, 53–60. [Google Scholar] [CrossRef]
- Wu, X.; Prior, R.L. Systematic identification and characterization of anthocyanins by hplc-esi-ms/ms in common foods in the United States: Fruits and berries. J. Agric. Food Chem. 2005, 53, 2589–2599. [Google Scholar] [CrossRef] [PubMed]
- Glories, Y.; Augustin, M. Maturité Phénolique du Raisin, Conséquences Technologiques: Application Aux Millésimes 1991 et 1992; CR Colloque Journée Techn; CIVB: Bordeaux, France, 1993; pp. 56–61. [Google Scholar]
- Kontoudakis, N.; Esteruelas, M.; Fort, F.; Canals, J.M.; Zamora, F. Comparison of methods for estimating phenolic maturity in grapes: Correlation between predicted and obtained parameters. Anal. Chim. Acta 2010, 660, 127–133. [Google Scholar] [CrossRef] [PubMed]
- García-Beneytez, E.; Revilla, E.; Cabello, F. Anthocyanin pattern of several red grape cultivars and wines made from them. Eur. Food Res. Technol. 2002, 215, 32–37. [Google Scholar] [CrossRef]
- Huang, Z.; Wang, B.; Williams, P.; Pace, R.D. Identification of anthocyanins in muscadine grapes with hplc-esi-ms. LWT Food Sci. Technol. 2009, 42, 819–824. [Google Scholar] [CrossRef]
- Ribéreau-Gayon, P.; Dubourdieu, D.; Donèche, B.; Lonvaud, A. Handbook of Enology; John Wiley & Sons: Hoboken, NJ, USA, 2006; Volume 1. [Google Scholar]
- Romero-Cascales, I.; Fernández-Fernández, J.I.; López-Roca, J.M.; Gómez-Plaza, E. The maceration process during winemaking extraction of anthocyanins from grape skins into wine. Eur. Food Res. Technol. 2005, 221, 163–167. [Google Scholar] [CrossRef]
- Cayla, L.; Cottereau, P.; Renard, R. Estimation de la maturité phénolique des raisins rouges par la méthode i.T.V. Standard. Rev. Fr. d’OEnol. 2002, 193, 10–16. [Google Scholar]
- Glories, Y. La couler des vins rouges: 2a. Partie mesure, origine et interpretation. Connaiss. Vigne Vin 1984, 18, 253–271. [Google Scholar]
- Iland, P.; Bruer, N.; Edwards, G.; Weeks, S.; Wilkes, E. Chemical Analysis of Grapes and Wine: Techniques and Concepts; Patrick Iland Wine Promotions PTY Ltd.: Campbelltown, Australia, 2004. [Google Scholar]
- Corrales, M.; Toepfl, S.; Butz, P.; Knorr, D.; Tauscher, B. Extraction of anthocyanins from grape by-products assisted by ultrasonics, high hydrostatic pressure or pulsed electric fields: A comparison. Innov. Food Sci. Emerg. Technol. 2008, 9, 85–91. [Google Scholar] [CrossRef]
- Li, Y.; Skouroumounis, G.K.; Elsey, G.M.; Taylor, D.K. Microwave-assistance provides very rapid and efficient extraction of grape seed polyphenols. Food Chem. 2011, 129, 570–576. [Google Scholar] [CrossRef]
- Liazid, A.; Guerrero, R.F.; Cantos, E.; Palma, M.; Barroso, C.G. Microwave assisted extraction of anthocyanins from grape skins. Food Chem. 2011, 124, 1238–1243. [Google Scholar] [CrossRef]
- Fragoso, S.; Mestres, M.; Busto, O.; Guasch, J. Comparison of three extraction methods used to evaluate phenolic ripening in red grapes. J. Agric. Food Chem. 2010, 58, 4071–4076. [Google Scholar] [CrossRef] [PubMed]
- Corrales, M.; García, A.F.; Butz, P.; Tauscher, B. Extraction of anthocyanins from grape skins assisted by high hydrostatic pressure. J. Food Eng. 2009, 90, 415–421. [Google Scholar] [CrossRef]
- Ageorges, A.; Fernandez, L.; Vialet, S.; Merdinoglu, D.; Terrier, N.; Romieu, C. Four specific isogenes of the anthocyanin metabolic pathway are systematically co-expressed with the red colour of grape berries. Plant Sci. 2006, 170, 372–383. [Google Scholar] [CrossRef]
- Barnes, J.S.; Nguyen, H.P.; Shen, S.; Schug, K.A. General method for extraction of blueberry anthocyanins and identification using high performance liquid chromatography-electrospray ionization-ion trap-time of flight-mass spectrometry. J. Chromatogr. A 2009, 1216, 4728–4735. [Google Scholar] [CrossRef] [PubMed]
- Dukes, B.C.; Butzke, C.E. Rapid determination of primary amino acids in grape juice using an o-phthaldialdehyde/N-acetyl-l-cysteine spectrophotometric assay. Am. J. Enol. Vitic. 1998, 49, 125–134. [Google Scholar]
- Singleton, V.L.; Rossi, J.A. Colorimetry of total phenolics with phosphomolybdic-phosphotungstic acid reagents. Am. J. Enol. Vitic. 1965, 16, 144–158. [Google Scholar]
- Sarneckis, C.J.; Dambergs, R.G.; Jones, P.; Mercurio, M.; Herderich, M.J.; Smith, P.A. Quantification of condensed tannins by precipitation with methyl cellulose: Development and validation of an optimised tool for grape and wine analysis. Aust. J. Grape Wine Res. 2006, 12, 39–49. [Google Scholar] [CrossRef]
- Rentzsch, M.; Weber, F.; Durner, D.; Fischer, U.; Winterhalter, P. Variation of pyranoanthocyanins in red wines of different varieties and vintages and the impact of pinotin A addition on their color parameters. Eur. Food Res. Technol. 2009, 229, 689–696. [Google Scholar] [CrossRef]
- Sacchi, K.L.; Bisson, L.F.; Adams, D.O. A review of the effect of winemaking techniques on phenolic extraction in red wines. Am. J. Enol. Vitic. 2005, 56, 197–206. [Google Scholar]
- Jurd, L. Reactions involved in sulfite bleaching of anthocyanins. J. Food Sci. 1964, 29, 16–19. [Google Scholar] [CrossRef]
Figure 1.
Color extraction in percent of total color during fermentation in contact with the skins analyzed by spectrophotometry at 420 nm (a); 520 nm (b); and 620 nm (c). Absorbance is calculated for 10 mm pathlength.
Figure 1.
Color extraction in percent of total color during fermentation in contact with the skins analyzed by spectrophotometry at 420 nm (a); 520 nm (b); and 620 nm (c). Absorbance is calculated for 10 mm pathlength.

Figure 2.
Total color extraction during fermentation in contact with the skins analyzed by spectrophotometry at 420, 520, and 620 nm. Cumulated absorbance is calculated for 10 mm pathlength ((a) without Noble; (b) including Noble).
Figure 2.
Total color extraction during fermentation in contact with the skins analyzed by spectrophotometry at 420, 520, and 620 nm. Cumulated absorbance is calculated for 10 mm pathlength ((a) without Noble; (b) including Noble).

Figure 3.
Total color loss during vinification in contact with the skins analyzed by spectrophotometry at 420 nm (a); 520 nm (b); 620 nm (c); and as sum of all three wavelengths (d). Cumulated absorbance is calculated for 10 mm pathlength (data does not include Noble).
Figure 3.
Total color loss during vinification in contact with the skins analyzed by spectrophotometry at 420 nm (a); 520 nm (b); 620 nm (c); and as sum of all three wavelengths (d). Cumulated absorbance is calculated for 10 mm pathlength (data does not include Noble).

Figure 4.
Chromatograms comparing extraction through fermentation and other techniques in Chambourcin grapes.
Figure 4.
Chromatograms comparing extraction through fermentation and other techniques in Chambourcin grapes.

Figure 5.
Principle component analysis of all grape cultivars included in this study (observations) and the most important influencing factors and analytical data-points (variables).
Figure 5.
Principle component analysis of all grape cultivars included in this study (observations) and the most important influencing factors and analytical data-points (variables).


Table 1.
Juice analysis data prior to fermentation obtained by FT-MIR spectroscopy and enzymatic assays (for nitrogen parameters only).
Table 1.
Juice analysis data prior to fermentation obtained by FT-MIR spectroscopy and enzymatic assays (for nitrogen parameters only).
| Cultivar | Density | Sugar [% Bx] | Total Acid [g/L] | pH | NOPA [mg/L] | NH4 [mg/L] | YAN [mg/L] |
|---|---|---|---|---|---|---|---|
| Mourvedre | 1.0838 | 20.2 | 5.5 | 3.58 | 265 | 60 | 325 |
| Cabernet Franc | 1.0744 | 18.1 | 9.7 | 3.28 | 81 | 14 | 95 |
| Marquette | 1.0799 | 19.3 | 14.0 | 3.19 | 270 | 83 | 353 |
| Syrah | 1.1021 | 24.2 | 4.3 | 3.63 | 122 | 10 | 132 |
| Merlot | 1.0843 | 20.3 | 4.8 | 3.69 | 111 | 37 | 148 |
| Barbera | 1.1119 | 26.3 | 6.3 | 3.72 | 226 | 36 | 262 |
| Petite Sirah | 1.1005 | 23.9 | 4.5 | 3.90 | 164 | 44 | 208 |
| Cabernet Sauvignon | 1.0934 | 22.3 | 5.8 | 3.74 | 139 | 24 | 163 |
| Chambourcin | 1.1038 | 24.6 | 5.6 | 3.77 | 192 | 40 | 232 |
| Noble | 1.0665 | 16.2 | 8.7 | 3.04 | 46 | 12 | 58 |
| Concord | 1.0645 | 15.8 | 2.3 | 3.36 | 93 | 14 | 107 |
Table 2.
Analytical data of wines after fermentation (standard deviation represents experimental duplicates).
Table 2.
Analytical data of wines after fermentation (standard deviation represents experimental duplicates).
| Cultivar | Density | Ethanol [g/L] | Total Acid [g/L] | pH | Total Phenols [mg/L] | Total Tannins [mg/L} |
|---|---|---|---|---|---|---|
| Mourvedre | 0.9965 ± 0.0004 | 83.7 ± 1.1 | 5.0 ± 0.1 | 4.0 ± 0.1 | 758 ± 32 | 932 ± 36 |
| Cabernet Franc | 0.9972 ± 0.0001 | 75.7 ± 0.4 | 7.7 ± 0.2 | 3.4 ± 0.1 | 823 ± 11 | 1154 ± 6 |
| Marquette | 0.9996 ± 0.0001 | 76.8 ± 0.1 | 8.9 ± 0.2 | 3.5 ± 0.1 | 519 ± 86 | 463 ± 158 |
| Syrah | 0.9921 ± 0.0001 | 111.2 ± 2.1 | 5.5 ± 0.1 | 3.5 ± 0.1 | 717 ± 75 | 976 ± 80 |
| Merlot | 0.9950 ± 0.0002 | 89.6 ± 0.6 | 5.1 ± 0.1 | 3.7 ± 0.1 | 1194 ± 99 | 1621 ± 131 |
| Barbera | 0.9933 ± 0.0001 | 118.2 ± 1.2 | 6.3 ± 0.2 | 3.4 ± 0.1 | 601 ± 2 | 332 ± 9 |
| Petit Sirah | 0.9934 ± 0.0001 | 107.1 ± 3.6 | 5.1 ± 0.1 | 3.8 ± 0.1 | 972 ± 135 | 1224 ± 312 |
| Cabernet Sauvignon | 0.9958 ± 0.0001 | 95.0 ± 0.9 | 5.8 ± 0.2 | 4.0 ± 0.1 | 1071 ± 39 | 1434 ± 104 |
| Chambourcin | 0.9946 ± 0.0003 | 107.0 ± 1.7 | 5.8 ± 0.1 | 3.6 ± 0.1 | 901 ± 52 | 942 ± 116 |
| Noble | 1.0015 ± 0.0001 | 68.2 ± 0.3 | 8.7 ± 0.2 | 2.9 ± 0.1 | 1858 ± 417 | 978 ± 77 |
| Concord | 0.9993 ± 0.0002 | 62.3 ± 0.2 | 7.8 ± 0.1 | 2.9 ± 0.1 | 688 ± 43 | 780 ± 119 |
Table 3.
Berry and skin weights of all analyzed grapes cultivars including the total extractable anthocyanins and polyphenols obtained by solvent extraction (standard deviation represents experimental duplicates).
Table 3.
Berry and skin weights of all analyzed grapes cultivars including the total extractable anthocyanins and polyphenols obtained by solvent extraction (standard deviation represents experimental duplicates).
| Cultivar | 100 Berry Weight | Average Weight per Berry | Skin Weight per Berry | Skin Dry Weight per Berry | Extractable Anthocyanins | Extractable Polyphenols |
|---|---|---|---|---|---|---|
| [g] | [g] | [g] | [g] | [mg/g Fresh Skin] | [mg/g Fresh Skin] | |
| Mourvedre | 219.6 ± 17.4 | 2.20 ± 0.17 | 0.565 ± 0.025 | 0.165 ± 0.007 | 0.37 ± 0.04 | 1.12 ± 0.35 |
| Merlot | 149.5 ± 1.9 | 1.50 ± 0.02 | 0.647 ± 0.032 | 0.211 ± 0.009 | 0.83 ± 0.09 | 1.56 ± 0.22 |
| Cabernet Franc | 139.4 ± 1.4 | 1.39 ± 0.01 | 0.638 ± 0.029 | 0.196 ± 0.009 | 1.44 ± 0.18 | 1.98 ± 0.64 |
| Marquette | 105.6 ± 7.8 | 1.06 ± 0.08 | 0.591 ± 0.032 | 0.154 ± 0.007 | 0.62 ± 0.11 | 1.23 ± 0.35 |
| Noble | 305.0 ± 3.2 | 3.05 ± 0.03 | 0.697 ± 0.063 | 0.251 ± 0.013 | 2.91 ± 0.41 | 3.90 ± 0.81 |
| Petite Sirah | 107.3 ± 7.6 | 1.07 ± 0.08 | 0.660 ± 0.030 | 0.230 ± 0.012 | 1.83 ± 0.08 | 3.41 ± 0.63 |
| Chambourcin | 228.2 ± 0.9 | 2.28 ± 0.01 | 0.612 ± 0.043 | 0.219 ± 0.009 | 1.37 ± 0.21 | 1.88 ± 0.53 |
| Cabernet Sauvignon | 143.3 ± 0.1 | 1.43 ± 0.01 | 0.608 ± 0.031 | 0.205 ± 0.010 | 1.46 ± 0.17 | 2.25 ± 0.21 |
| Barbera | 149.6 ± 2.0 | 1.50 ± 0.02 | 0.685 ± 0.041 | 0.242 ± 0.012 | 0.66 ± 0.09 | 1.03 ± 0.16 |
| Syrah | 153.5 ± 3.7 | 1.53 ± 0.04 | 0.708 ± 0.042 | 0.214 ± 0.011 | 1.62 ± 0.23 | 2.19 ± 0.42 |
| Concord | 300.2 ± 0.4 | 3.00 ± 0.01 | 0.858 ± 0.069 | 0.305 ± 0.015 | 1.29 ± 0.12 | 1.85 ± 0.66 |
Table 4.
Color characteristics of studied grapes varieties during fermentation and wine production analyzed by UV-Vis spectrophotometry.
Table 4.
Color characteristics of studied grapes varieties during fermentation and wine production analyzed by UV-Vis spectrophotometry.
| Days to Maximum Extraction | Average Color Loss in Free-Run until Pressing [%] | |||||||
| Cultivar | 420 nm | 520 nm | 620 nm | Total Σ | 420 nm | 520 nm | 620 nm | Total Σ |
| Mourvedre | 10 | 7 | 10 | 10 | 4.6 | 8.4 | 3.7 | 6.3 |
| Merlot | 4 | 5 | 4 | 5 | 12.6 | 22.2 | 35.0 | 18.2 |
| Cabernet Franc | 7 | 7 | 6 | 7 | 5.8 | 22.3 | 7.0 | 15.7 |
| Marquette | 5 | 7 | 6 | 7 | 21.7 | 31.9 | 25.6 | 26.5 |
| Barbera | 7 | 6 | 7 | 7 | 9.0 | 14.8 | 3.0 | 11.6 |
| Syrah | 2 | 5 | 5 | 5 | 22.1 | 32.1 | 22.7 | 27.3 |
| Petit Sirah | 5 | 5 | 8 | 5 | 6.2 | 18.2 | 8.7 | 13.3 |
| Cabernet Sauvignon | 10 | 5 | 3 | 6 | 1.0 | 25.0 | 10.1 | 13.1 |
| Chambourcin | 5 | 4 | 3 | 4 | 14.8 | 45.7 | 29.5 | 35.8 |
| Noble | 4 | 6 | 5 | 6 | −1.9 | 20.4 | 32.5 | 17.1 |
| Concord | 3 | 3 | 3 | 3 | 27.6 | 45.8 | 35.0 | 40.2 |
| Average Color Loss in Press-Wine [%] | Average Color Loss after SO2and 60 Days [%] | |||||||
| Cultivar | 420 nm | 520 nm | 620 nm | Total Σ | 420 nm | 520 nm | 620 nm | Total Σ |
| Mourvedre | 14.2 | 19.3 | 20.6 | 17.5 | 35.2 | 54.1 | 52.0 | 47.1 |
| Merlot | 21.3 | 36.3 | 45.4 | 30.5 | 37.6 | 56.4 | 63.9 | 49.9 |
| Cabernet Franc | 20.7 | 39.0 | 39.1 | 33.3 | 48.4 | 68.8 | 66.6 | 62.4 |
| Marquette | 14.7 | 39.8 | 28.4 | 29.8 | 28.0 | 56.3 | 44.1 | 45.8 |
| Barbera | 19.4 | 22.7 | 21.2 | 21.2 | 41.1 | 53.9 | 47.2 | 49.0 |
| Syrah | 38.5 | 48.6 | 54.6 | 46.1 | 58.4 | 72.5 | 73.8 | 68.4 |
| Petit Sirah | 7.2 | 28.4 | 19.8 | 21.2 | 18.0 | 44.2 | 35.4 | 35.6 |
| Cabernet Sauvignon | 9.9 | 29.9 | 24.7 | 20.8 | 24.6 | 51.8 | 48.0 | 41.1 |
| Chambourcin | 25.4 | 53.5 | 44.1 | 44.6 | 44.9 | 66.6 | 59.7 | 57.0 |
| Noble | −48.3 | 26.3 | 35.0 | 13.3 | 0.0 | 15.4 | 14.5 | 11.2 |
| Concord | 39.1 | 51.0 | 25.8 | 46.1 | 52.7 | 69.9 | 64.0 | 64.8 |
Table 5.
Total phenol and anthocyanin concentrations in the grape extracts spectrophotometrically quantified as gallic acid and malvidin-3-glucoside equivalents, respectively (standard deviation represents experimental duplicates).
Table 5.
Total phenol and anthocyanin concentrations in the grape extracts spectrophotometrically quantified as gallic acid and malvidin-3-glucoside equivalents, respectively (standard deviation represents experimental duplicates).
| Cultivar | Finished Wines | Microwave Extraction | Ultrasound Extraction | Glorie Method (pH 3.2) | ITV Standard | AWRI Method | ||||||
|---|---|---|---|---|---|---|---|---|---|---|---|---|
| Total Phenols | Anthocyanins | Total Phenols | Anthocyanins | Total Phenols | Anthocyanins | Total Phenols | Anthocyanins | Total Phenols | Anthocyanins | Total Phenols | Anthocyanins | |
| [g/L] | [g/L] | [g/L] | [g/L] | [g/L] | [g/L] | [g/L] | [g/L] | [g/L] | [g/L] | [g/L] | [g/L] | |
| Mourvedre | 1.02 ± 0.25 | 0.21 ± 0.01 | 2.09 ± 0.14 | 0.35 ± 0.05 | 2.09 ± 0.07 | 0.40 ± 0.02 | 0.44 ± 0.01 | 0.24 ± 0.01 | 0.96 ± 0.08 | 0.37 ± 0.01 | 0.59 ± 0.08 | 0.32 ± 0.01 |
| Merlot | 1.23 ± 0.08 | 0.24 ± 0.01 | 2.21 ± 0.16 | 0.39 ± 0.03 | 1.84 ± 0.04 | 0.37 ± 0.01 | 0.42 ± 0.19 | 0.29 ± 0.01 | 0.91 ± 0.01 | 0.38 ± 0.01 | 0.54 ± 0.09 | 0.32 ± 0.06 |
| Cabernet Franc | 0.98 ± 0.01 | 0.22 ± 0.01 | 1.83 ± 0.28 | 0.37 ± 0.01 | 1.99 ± 0.04 | 0.43 ± 0.02 | 0.44 ± 0.02 | 0.33 ± 0.02 | 1.14 ± 0.03 | 0.44 ± 0.01 | 0.72 ± 0.06 | 0.39 ± 0.03 |
| Petite Sirah | 1.43 ± 0.30 | 0.34 ± 0.05 | 2.24 ± 0.10 | 0.53 ± 0.02 | 2.37 ± 0.06 | 0.54 ± 0.03 | 0.37 ± 0.02 | 0.34 ± 0.01 | 0.78 ± 0.07 | 0.45 ± 0.03 | 0.90 ± 0.12 | 0.54 ± 0.08 |
| Cabernet Sauvignon | 1.46 ± 0.18 | 0.24 ± 0.01 | 1.96 ± 0.29 | 0.34 ± 0.04 | 2.05 ± 0.01 | 0.38 ± 0.01 | 0.30 ± 0.06 | 0.25 ± 0.01 | 0.69 ± 0.01 | 0.32 ± 0.02 | 0.56 ± 0.01 | 0.35 ± 0.01 |
| Barbera | 0.75 ± 0.02 | 0.21 ± 0.01 | 1.46 ± 0.19 | 0.33 ± 0.03 | 1.47 ± 0.10 | 0.36 ± 0.02 | 0.22 ± 0.02 | 0.23 ± 0.01 | 0.80 ± 0.07 | 0.31 ± 0.01 | 0.58 ± 0.01 | 0.39 ± 0.01 |
| Syrah | 1.03 ± 0.29 | 0.23 ± 0.01 | 1.78 ± 0.15 | 0.37 ± 0.04 | 2.44 ± 0.02 | 0.49 ± 0.01 | 0.25 ± 0.14 | 0.25 ± 0.01 | 0.80 ± 0.02 | 0.34 ± 0.02 | 0.65 ± 0.14 | 0.38 ± 0.11 |
| Chambourcin | 1.64 ± 0.04 | 0.24 ± 0.01 | 2.46 ± 0.04 | 0.39 ± 0.01 | 2.19 ± 0.22 | 0.36 ± 0.01 | 0.59 ± 0.01 | 0.56 ± 0.05 | 1.35 ± 0.01 | 0.70 ± 0.01 | 0.59 ± 0.16 | 0.49 ± 0.08 |
| Marquette | 1.04 ± 0.08 | 0.20 ± 0.01 | 1.86 ± 0.06 | 0.36 ± 0.01 | 1.98 ± 0.08 | 0.35 ± 0.01 | 0.44 ± 0.01 | 0.40 ± 0.02 | 1.07 ± 0.08 | 0.55 ± 0.01 | 0.49 ± 0.03 | 0.39 ± 0.01 |
| Noble | 4.87 ± 0.16 | 0.35 ± 0.01 | 3.93 ± 0.31 | 0.30 ± 0.03 | 3.95 ± 0.23 | 0.35 ± 0.01 | 1.26 ± 0.18 | 1.13 ± 0.12 | 2.92 ± 0.18 | 1.61 ± 0.09 | 0.89 ± 0.28 | 0.71 ± 0.13 |
| Concord | 1.45 ± 0.22 | 0.19 ± 0.01 | 2.61 ± 0.13 | 0.42 ± 0.05 | 2.32 ± 0.01 | 0.37 ± 0.01 | 0.34 ± 0.01 | 0.23 ± 0.01 | 1.03 ± 0.04 | 0.42 ± 0.01 | 0.41 ± 0.02 | 0.26 ± 0.02 |
Table 6.
Correlation coefficients (R2) between phenolic characteristics of wines during and after fermentation, and the predicted levels produced by grape extraction (n.s.: not significant, *: α = 0.05, **: α = 0.01, ***: α = 0.001).
Table 6.
Correlation coefficients (R2) between phenolic characteristics of wines during and after fermentation, and the predicted levels produced by grape extraction (n.s.: not significant, *: α = 0.05, **: α = 0.01, ***: α = 0.001).
| Observation | Microwave Assisted Extraction | Ultrasound Assisted Extraction | ITV Standard | AWRI Extraction | Glorie Extraction | Potential Anthocynins (Glorie) | Extractable Anthocyanins (Glorie) |
|---|---|---|---|---|---|---|---|
| Anthocyanins finished wines | 0.199 (n.s.) | 0.345 (n.s.) | 0.638 (*) | 0.797 (***) | 0.650 (*) | 0.674 (**) | 0.650 (*) |
| Color maximum during fermentation | 0.086 (n.s.) | 0.005 (n.s.) | 0.895 (***) | 0.741 (***) | 0.870 (***) | 0.898 (***) | 0.868 (***) |
| Total phenolics finished wines | 0.902 (***) | 0.924 (***) | 0.933 (***) | 0.452 (*) | 0.909 (***) |
Numbers in bold indicate statistical significance.
© 2018 by the authors. Licensee MDPI, Basel, Switzerland. This article is an open access article distributed under the terms and conditions of the Creative Commons Attribution (CC BY) license (http://creativecommons.org/licenses/by/4.0/).
Share and Cite
MDPI and ACS Style
Sommer, S.; Cohen, S.D. Comparison of Different Extraction Methods to Predict Anthocyanin Concentration and Color Characteristics of Red Wines. Fermentation 2018, 4, 39. https://doi.org/10.3390/fermentation4020039
AMA Style
Sommer S, Cohen SD. Comparison of Different Extraction Methods to Predict Anthocyanin Concentration and Color Characteristics of Red Wines. Fermentation. 2018; 4(2):39. https://doi.org/10.3390/fermentation4020039
Chicago/Turabian StyleSommer, Stephan, and Seth D. Cohen. 2018. "Comparison of Different Extraction Methods to Predict Anthocyanin Concentration and Color Characteristics of Red Wines" Fermentation 4, no. 2: 39. https://doi.org/10.3390/fermentation4020039
Note that from the first issue of 2016, this journal uses article numbers instead of page numbers. See further details here.