Article

Intensive Production of Carboxylic Acids Using C. butyricum in a Membrane Bioreactor (MBR)

by
Husnul Azan Tajarudin
1,2,
Myrto-Panagiota Zacharof
3,*,
Karnika Ratanapongleka
4,
Paul M. Williams
5,6 and
Robert W. Lovitt
7
1
School of Industrial Technology, Division of Bioprocesses, Universiti Sains Malaysia, 11800 Penang, Malaysia
2
Solid Waste Management Cluster, Science and Engineering Research Centre, Engineering Campus, Universiti Sains Malaysia, 14300 Nibong Tebal, Pulau Pinang, Malaysia
3
Centre for Cytochrome P450 Biodiversity, Institute of Life Science, Swansea University Medical School, Swansea, Wales SA2 8PP, UK
4
Department of Chemical Engineering, Faculty of Engineering, Ubon Ratchathani University, Ubon Ratchathani 34190, Thailand
5
Centre for Water Advanced Technologies and Environmental Research (CWATER), College of Engineering, Talbot building, Swansea University, Swansea SA2 8PP, UK
6
Systems and Process Engineering Centre (SPEC), College of Engineering, Swansea University, Swansea SA2 8PP, UK
7
Membranology Ltd. c/o Broomfield & Alexander Li Charter Court Phoenix Way, Swansea SA7 9FS, UK
*
Author to whom correspondence should be addressed.
Fermentation 2018, 4(4), 81; https://doi.org/10.3390/fermentation4040081
Submission received: 13 August 2018 / Revised: 18 September 2018 / Accepted: 19 September 2018 / Published: 21 September 2018

Abstract

:
This work reports on the use of a bench-scale chemostat (CSTR) in continuous mode and of a pilot-scale membrane bioreactor (MBR) in fed-batch mode to intensively produce acetic and butyric acids using C. butyricum grown on synthetic media. These studies were then used to perform a cost estimation study of the MBR system to assess the potential economic impact of this proposed methodology, regarding the production of carboxylic acids. The MBR system was found to be highly productive, reaching 37.88 g L−1 h−1 of acetic and 14.44 g L−1 h−1 of volumetric cell productivity, favoring acetic acid production over butyric acid at a ratio of 3 moles to 1. The cost of preparation and production of carboxylic acid using this system was found to be 0.0062 £PS/kg with up to 99% carbon recovery.

Graphical Abstract

1. Introduction

Uncoupling energy generation and acid production from petroleum is a high priority among Western Europe and the United States [1]. The carbon-based economy in the West is challenged by fossil fuel scarcity and socioeconomic changes, thus petroleum distillates, such as acetic and butyric acid from alternative sources, are an attractive option [2]. The production of carboxylic acid by fermentation, using the biorefinery concept (i.e., the biobased conversion of waste, plant biomass and other materials applied to bench, pilot, and industrial scale) is becoming an effective choice [3,4,5,6]. Acetic and butyric acid have numerous applications in the industry, as aroma enhances in food applications, components in cosmetics or precursors in bioplastics; thus, their intensive production in large volumes is necessary. Acetic acid is currently used as a precursor, an additive or a compound on a wide range of products, in the pharmaceutical, chemical, and food industries. Among its multiple uses is its use as a raw material for the generation of the monomer vinyl acetate, an important compound used for vinyl plastics, adhesives, textile finishes and latex paints. It is also used for acetyl cellulose, polyhydroxyalkanoates, esters and acetic anhydride production. Acetic anhydride is a raw material for the production for cellulose acetate and pharmaceuticals and plasticizer production. In households, diluted acetic acid is often used in desalting agent [7]. In the alimentary industry, acetic acid is an important additive for acidity regulation (i.e., E260).
Butyric acid on the other hand is a popular aroma, flavoring and texture additive in the feed and food industry but also an important drug agent in the pharmaceutical industry. It can also be used as raw material for the production of biobutanol, a promising biofuel of higher energy generation when burned, with low vapor pressure, less corrosiveness and low volatility when compared to ethanol [8,9]. Acetic acid global market is expected to reach 18.3 thousand kilotons by 2023 with a financial value to surpass 8.6 billion US$ [10,11] while butyric acid is projected to reach 329.9 US $ millions in value by 2022 and a 74.4 thousand tons by volume [12].
Among the carboxylic acid-producing bacteria, clostridia spp. has attracted significant attention in the industry and academia [13] as natural—acid-producing—bioreactors. C. butyricum, commonly cultured in mesophilic, neutral to alkali, microaerophilic conditions [14] produces a mixture of acetic and butyric acid simultaneously with hydrogen and carbon dioxide. The bacterium (see Supplementary Material: Figure S1a) is a saccharolytic microorganism able to ferment a wide variety of carbohydrates (see Supplementary Material: Figure S1b) including waste streams such as confectionery waste e.g., molasses [15,16,17], becoming an ideal candidate for intensive production of carboxylic acids. This, however, may be hindered by the toxic effect of the acids on microbial growth, limiting considerably their production.
An effective solution to this problem is the propagation and culturing of the organism in a system that would be operated either fed-batch or continuously, where simultaneously with the feed intake there would be removal of the spent effluent containing the produced acid. Such systems, usually developed in the form of upgraded batch reactors, are not currently preferred by the industry due to the complexity of operations, cost of construction and maintenance, demand for skilled operators, and danger of cross-contamination [18]. However, a membrane bioreactor (MBR) could offer a robust answer to this challenge. MBRs are well-established systems, traditionally used in wastewater treatment as a replacement for sedimentation—in activated sludge process—where filtration is used to retain biomass within the bioreactor [19,20]. They can be effectively used for intensive propagation of microorganisms, benefiting from the concept that cells can be retained by the membrane filter, thus increasing biomass concentration in the bioreactor. MBR systems have many advantages over continuous culture reactors or cell recycle reactors relying on sedimentation, since cell retention is controlled by a physical separation allowing application into numerous types of cells as well as versatility in operating strategies, scalability, and expandability.
For instance, an MBR system could be operated fed-batch, or continuously or having another membrane component added that would allow simultaneous downstream processing since the recovered permeates would be cell-free. Consequently, the rate feed flow rate (L h−1) can be very high, well above that observed rate in continuous culture and as such allowing an intensive carboxylic acid production process. Previous research [21,22] has shown that organic acid productivity and biomass concentration in such a system were over 20 times greater than those for continuously stirred reactor (CSTR) operated batchwise. Using this approach, toxic end products are removed, potentially boosting the kinetic performance of the cells.
Therefore, this work reports on the use of a pilot-scale MBR to intensively produce acetic and butyric acids using C. butyricum grown on optimized synthetic media. Comparative studies were done using a bench-top CSTR operated in continuous mode. These studies were then used to perform a cost estimation study of the MBR system to assess the potential economic impact of this proposed methodology. To the authors’ knowledge there are no prior reports of the growth C. butyricum with a membrane bioreactor.

2. Materials and Methods

2.1. Materials

2.1.1. Chemicals

The yeast extract, peptone, glucose, potassium dihydrogen orthophosphate, ammonium sulphate, sodium hydroxide (NaOH) were bought from Sigma-Aldrich Chemicals, Gillingham, UK.

2.1.2. Inoculum Source

C. butyricum NCIMB 7423 was provided in a lyophilized form by the National Collection of Industrial Food and Marine bacteria (NCIMB), Aberdeen, Scotland, UK.

2.2. Methods

2.2.1. Experimental

Preservation of Microorganism

C. butyricum was invigorated twice through inoculation of the strain into 50 mL alumina cap sealed serum vials containing yeast extract 10 g L−1, glucose 10 g L−1, ammonium sulphate 5 g L−1 and 2.5 g L−1 potassium dihydrogen orthophosphate and were incubated for 24 h statically. Cryopreservation method was used for the formulation of stock culture solutions. For regular use, C. butyricum was on a weekly basis propagated into 30 mL serum vials and preserved at 2 °C [23,24,25].

Inoculum Preparation

The specified quantities of powdered materials, namely yeast extract 10 g L−1, glucose 10 g L−1, ammonium sulphate 5 g L−1 and 2.5 g L−1 potassium dihydrogen orthophosphate were weighted into an electronic balance (Sartorius, CP4202S, JENCONS-PLS, Germany) and they were added and mixed into an Erlenmeyer flask containing 1 L of distilled water. To remove the existing dissolved oxygen, the medium was boiled using a Bunsen burner. Resazurin dye functioned as an anaerobiosis indicator (negative redox potential) changing its color from deep purple to colorless. Once cooled in room temperature and achieved a pH of 6.5, the medium was dispensed into serum vials under the presence of gaseous nitrogen flow to achieve complete anaerobic conditions [26]. The medium was decanted into 40 mL aliquots, which were placed into the serum vials. The head tubes went under gaseous flow of nitrogen [27] and then sealed with rubber stoppers and aluminum Wheaton seals. The sealed tubes were secured and were autoclaved at 121 °C for 15 min. The tubes were gently mixed in a vortex, inoculated with 4 mL inoculum size, and statically incubated at 37 °C until reaching late exponential phase (18 h of growth) [28]. The inoculum (10% v/v) was then transferred into 500 mL culture bottles containing 250 mL standard media with a nitrogen filled headspace, grown to late exponential phase. Having achieved a fully grown inoculum, it was taken into one 25.0 L culture bottles of 20.0 L working volume a nitrogen filled headspace. Inoculations were made 10% by volume.

Measurement of Cellular Growth and Biomass

The bacterial growth was measured using a spectrophotometer at 660 nm (1.8 cm. light path; PU 8625 UV/VIS Philips, France) equipped with a glass test tube holder. Biomass concentration (g L−1) and maximum specific growth rate (μmax, h−1) were calculated. The optical density measurements were converted into dry weight units (g L−1) by the dry weight determination assay [29] resulting into a linear equation (two variables) of an intercept-slope form of y = m x + b for dry weight units determination where x stands for optical density units. The equation for C. butyricum is the following y = 0.0959x + 0.0006.

Analysis of End Products Using Gas Chromatography

Head space gas chromatography was selected to analyze acetic butyric acid. The equipment used was an Varian ProsStar GC-3800, Varian, Inc., CA, USA fitted with flame ionization detector (FID), connected with a hydrogen generator (UHP-20H NITROX, Domnick Hunter Ltd., Gateshead England, UK) and equipped with a Nukol, fused silica high-quality coated polyamide capillary column 15 m × 0.32 mm I.D., 0.25 µm. Air was supplied and as carrier gas helium was selected. The acids were determined using a protocol, of a total holding time of 15 min, a gas flow rate of 30 mL min−1 and a pressure of 10 psi and an FID temperature of 220 °C as described by Sigma-Aldrich GC Supelko-Nukol columns manual.

Carbohydrate Consumption Rate Determination

Glucose concentration was measured using an enzymatic method, using glucose oxidase (GOD) and peroxidase (POD) enzymes. The glucose (GO) determination assay kit was provided by Sigma-Aldrich Chemicals, Gillingham, UK. The collected cultured samples were centrifuged, decanted and then microfiltered for complete removal of biomass. The integration of the color of the solution is proportional to the concentration of glucose. The measurements were performed in bioplastic cuvettes in a spectrophotometer (Thermo Spectronic Unicam UV-510 UV-Visible, Thermo Electron Corporation, UK) at 540 nm wavelength. The cuvettes, after the measurements, were cleaned with 50% v/v ethanol solution (Sigma-Aldrich Chemicals, Gillingham, UK) and distilled water.

Purity of Cultures

The purity of the cultures was tested regularly by optical microscopy (Olympus Education Microscope CX21Olympus Life science Europa GMBH, Hamburg, Germany). Two samples were taken from each culture and colorless liquid preparations were made. The samples were checked for morphology and cell damage using phase contrast microscopy. Scanning electron microscopy (SEM) (Hitachi S4800 Scanning Electron Microscope, Swansea University, Center of NanoHealth, Swansea, UK ) was also used to confirm pureness.

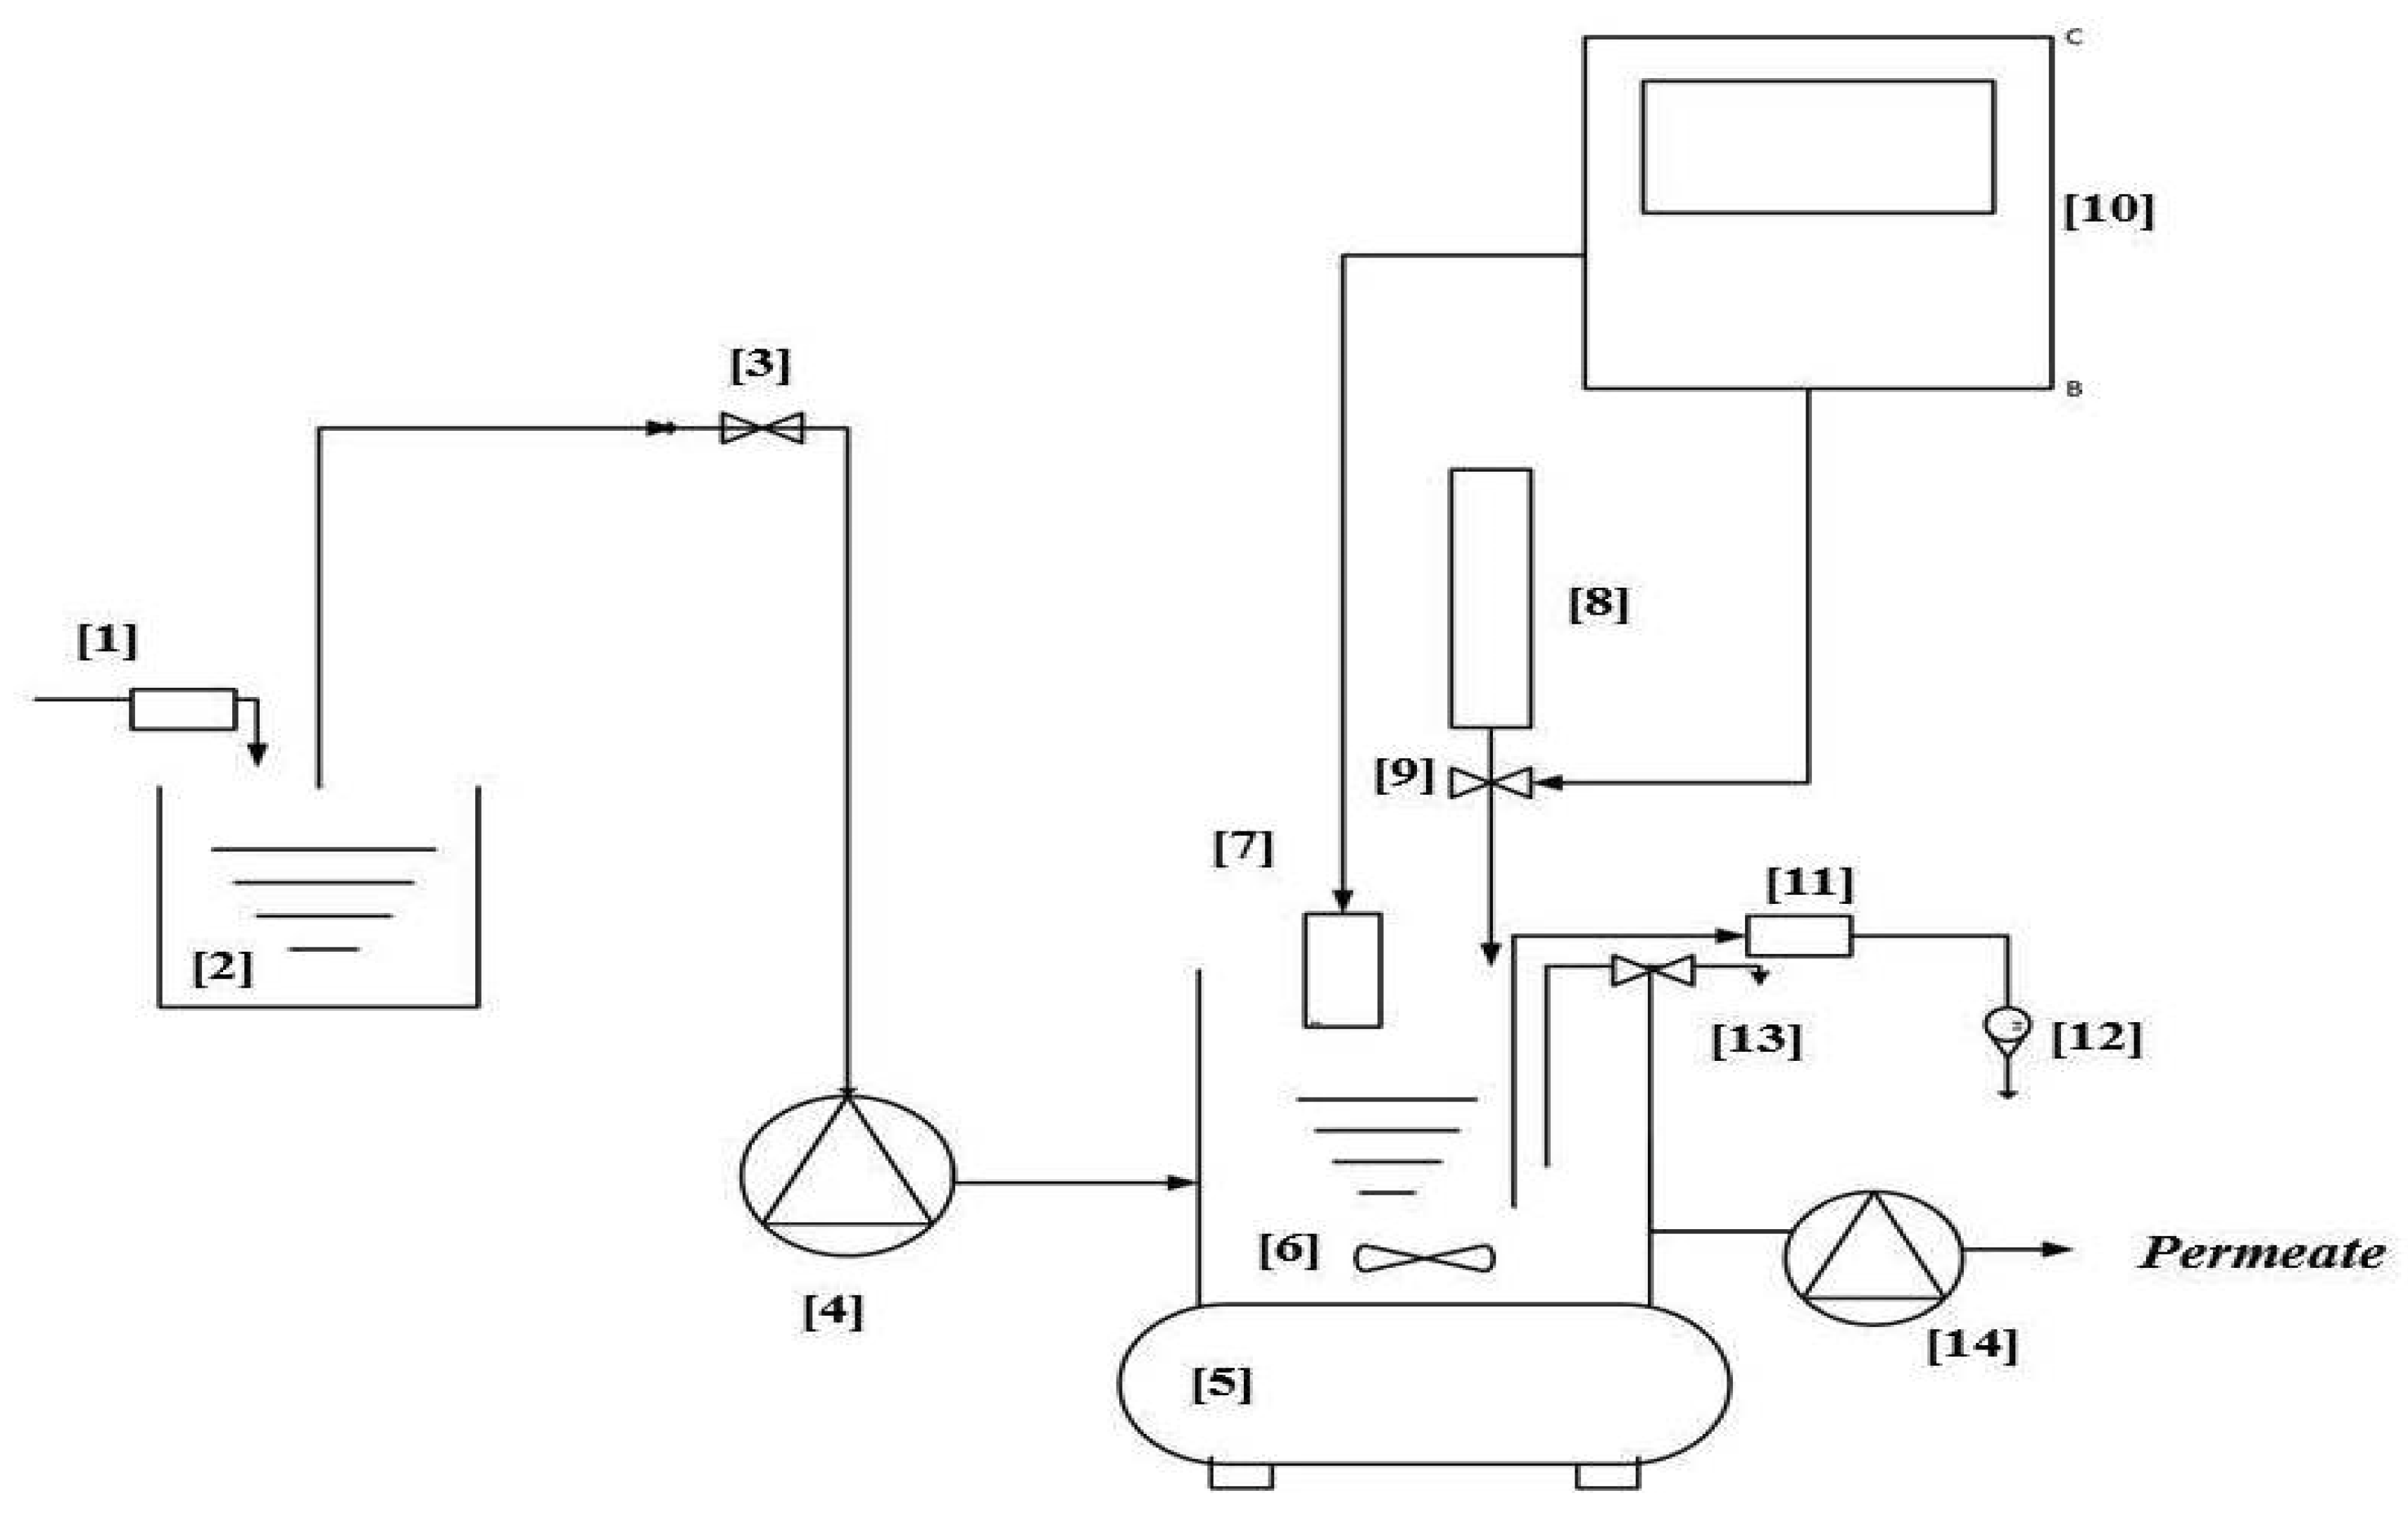
Continuously Stirred Tank Reactor (CSTR) Unit Design

C. butyricum were cultured (yeast extract 10 g L−1, glucose 10 g L−1, ammonium sulphate 5 g L−1 and 2.5 g L−1 potassium dihydrogen orthophosphate) [30] in a 2 L capacity CSTR (Figure 1) with numerous ports for control and sampling including a sampling and inoculation port and was sealed with silicone rubber, operated batchwise and in continuous mode. In the 2 L round glass fermenter, equipped with a glass air lock, gaseous nitrogen to the headspace ensured anaerobic conditions were maintained continuously, as gas in and gas out ports were fitted with filters (Whatman Polyvent filter, 0.2μm, Sigma-Aldrich Chemicals, Gillingham, UK) to prevent contamination. The operating temperature of 37 °C during the fermentation was monitored using a glass thermometer and was controlled through stainless steel coils connected to a thermostatically controlled water bath [31]. A pump supplying alkali to the culture was used to provide pH control (6.5) during the fermentation. The pump was connected to an FerMac 260 Electrolab biotech, Gloucestershire, UK an automated pH controller, which was attached to a Fisherbrand TM autoclavable pH probe (Fisher Scientific, Loughborough, UK) in the fermenter. A magnetic stirrer coupled bar provided agitation (350 rpm). Aseptic sampling on an hourly basis was done from the relevant port and transferred into 10 mL Fisherbrand TM conical plastic tubes (Fisher Scientific, Loughborough, UK) and centrifuged (Biofuge Stratos Sorall, Kendro Products, Langenselbold, Germany) (4 °C, 4000× g, 15 min) for complete biomass removal. The clarified samples were then filtered through a 0.2 μm pore size filter. When it was determined that growth was at early death phase, the fermentation was stopped.

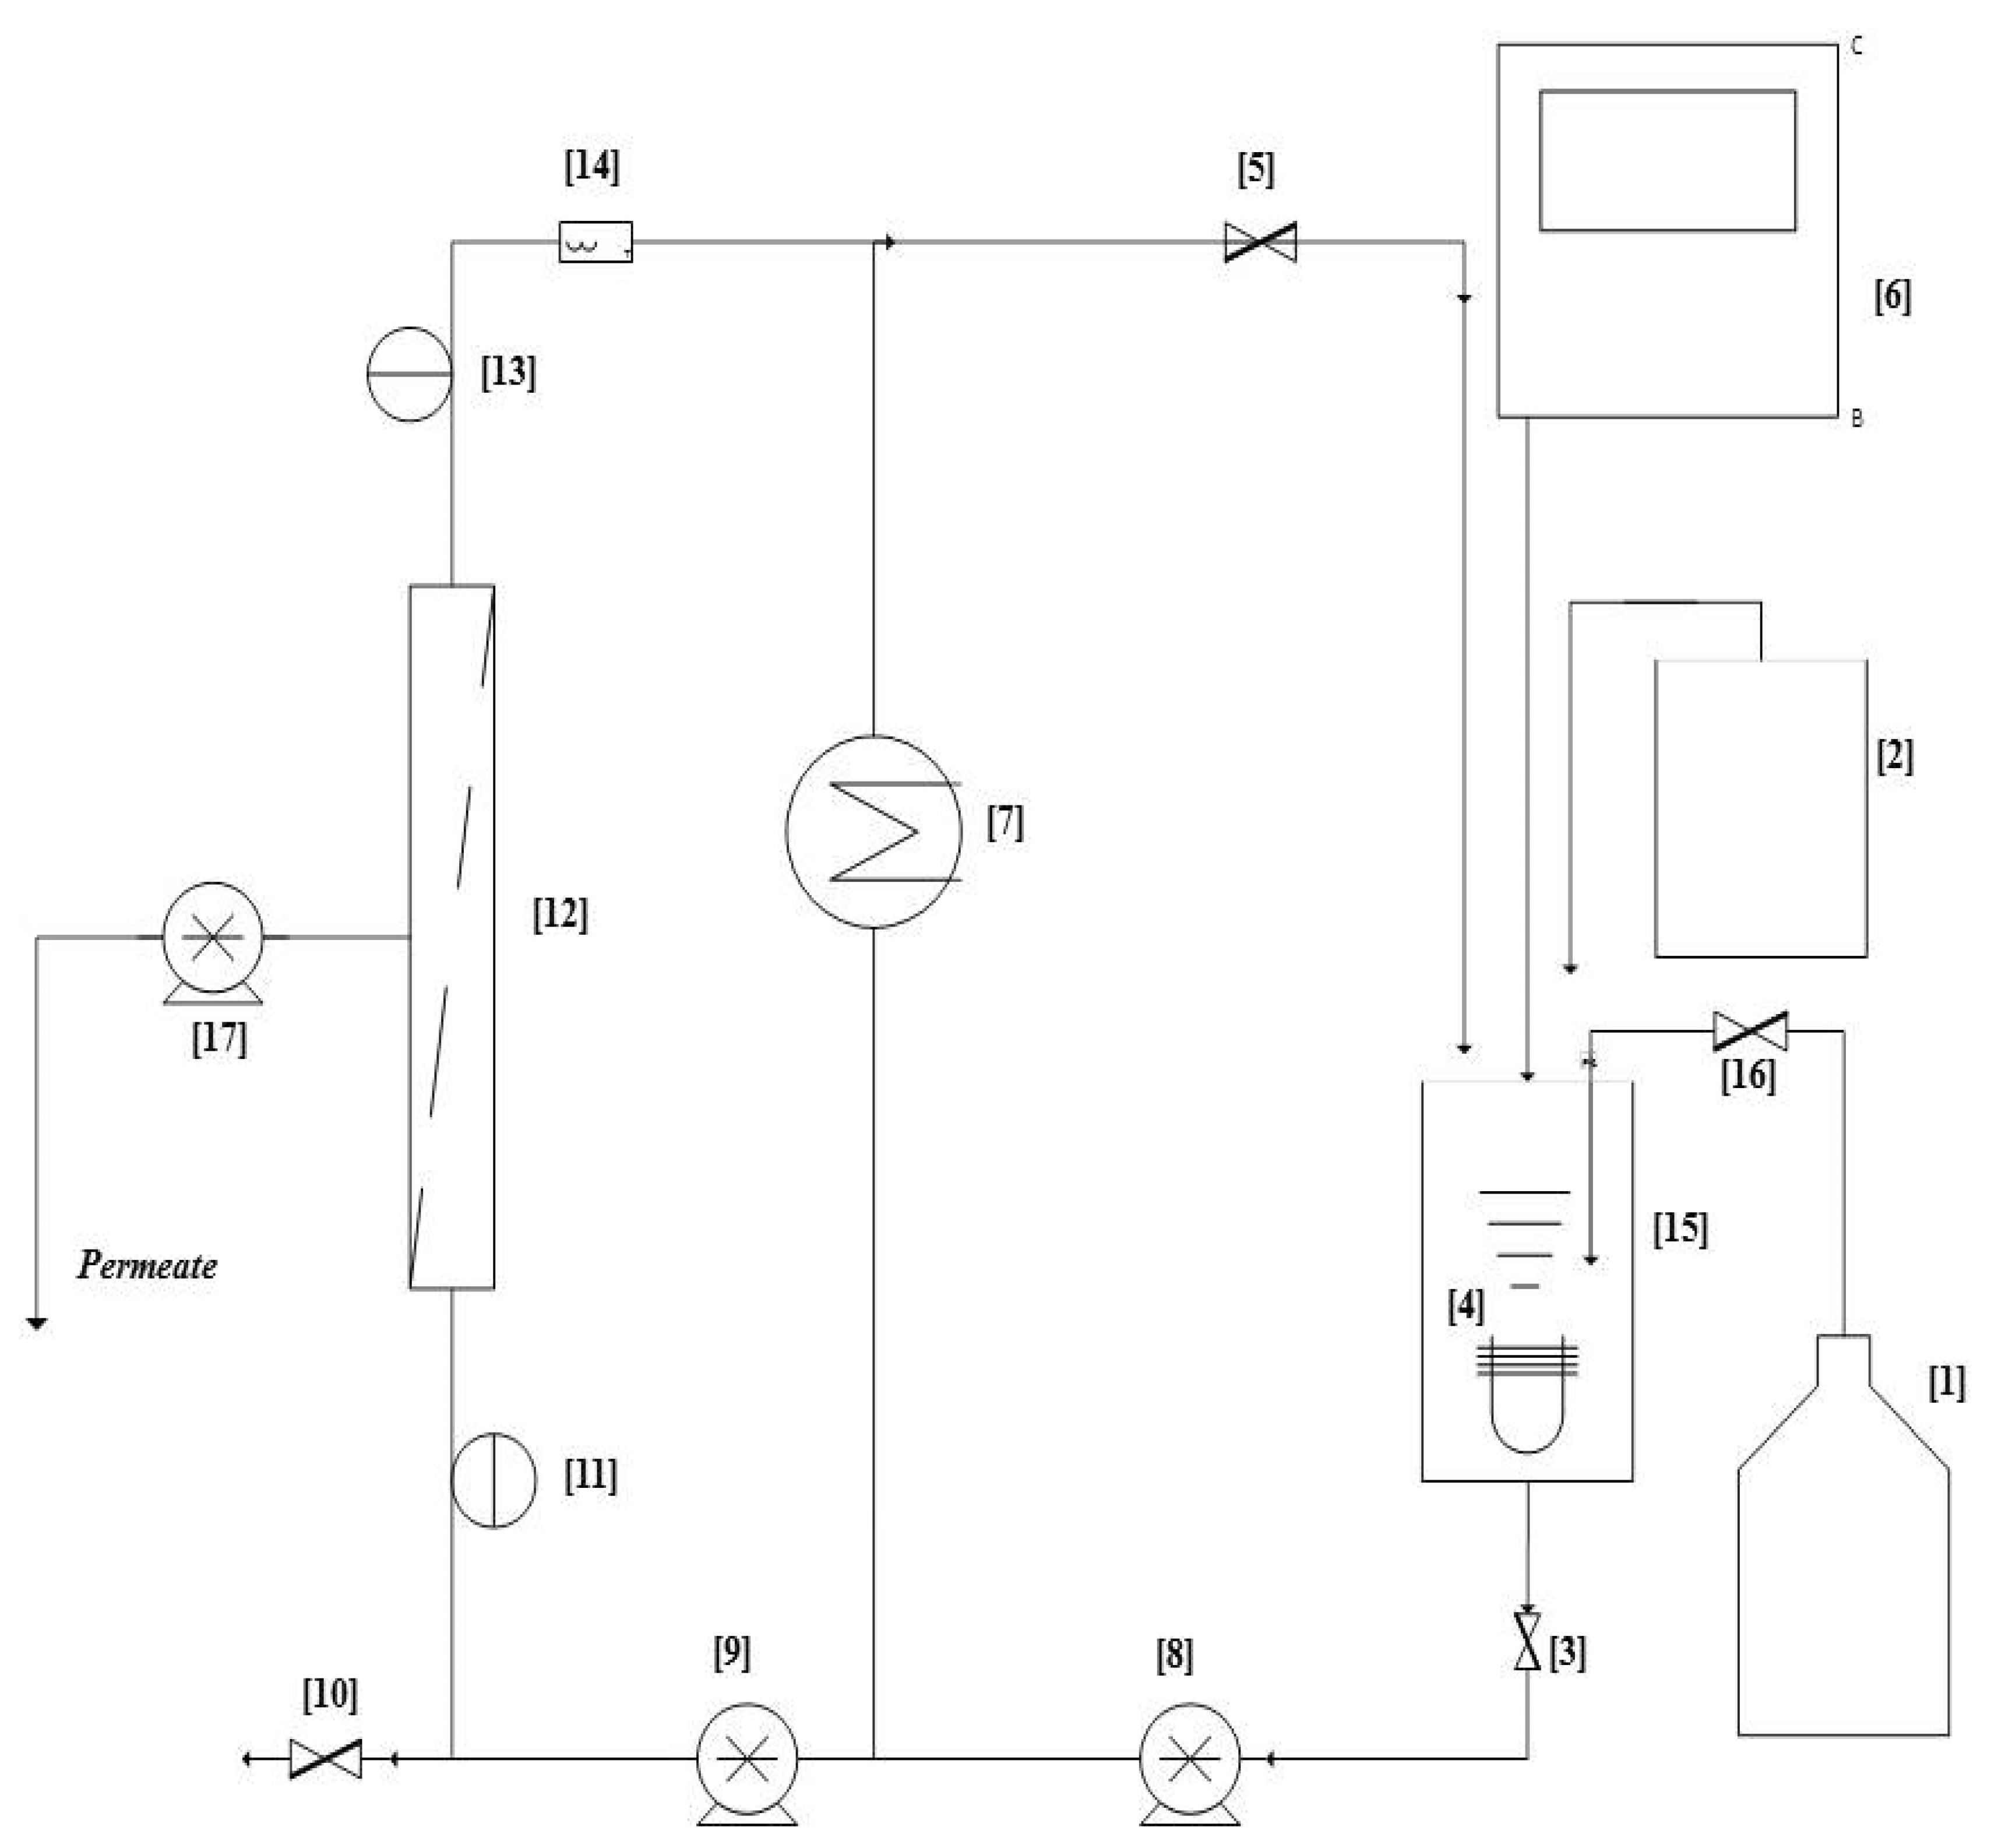
Membrane Bioreactor (MBR) Unit Design

A membrane bioreactor unit (Figure 2) was developed equipped with a ceramic membrane to process the nutrient media. The membrane used was a Membralox ceramic (a-Al2O3) monolith microfiltration module (pore size 0.2 mm) able to withstand a pH range between 2 and 13, temperatures up to 130 °C and operating pressures between 5 to 40 psi. The membrane was fitted in stainless steel housing, commercially available by Axium (Hendy, UK). This arrangement allowed limited pressure drop in this loop. The cells were effectively retained by the membrane, due to size exclusion, forming a compressible permeable cake. The effective membrane area was determined as 0.13 m2. The unit comprised of a pressure gauge, a 5 L of 76 cm depth and 12 cm diameter, conical fermentation vessel, equipped with stainless steel coils, gas inlet and outlet, feed/inoculation port, sampling port, and drain port at the bottom. This was linked through 2 m of 1-inch stainless steel pipes arranged into two fluid loops each one driven by a centrifugal pump type Brook Crompton (Michael Smith Engineers, UK). Nutrient medium was circulated from the tank into two loops, in the first loop a pump pressurized the system using an adjustable diaphragm valve (Axium Process, Hendy, Wales, UK); in the second loop a second pump was used to feed at high flow rates the membrane while water cooled heat exchanger in series.
All the parts of the unit were connected with stainless steel hygienic clamped flanges with polytetrafluoroethylene (PTFE) seals, provided by Axium Process (Hendy, Wales, UK). The MBR was sterilized at 103 °C for 20 min by circulating steam through the system, while the fermentation vessel was autoclaved separately at 121 °C for 30 min. The reactor was also equipped with a level control panel, a pH controller (FerMac 260 Electrolab biotech, Gloucestershire, UK, 230 V, 50 Hz, 50 W) connected to a pH probe and a peristaltic pump (Watson Marlow, UK) that was used to collect the membrane permeate.
The system was inoculated with 20 L carboy culture and once the working volume of the reactor was reached; (5 L) the membrane system loop was then started. From then on, the feed rate was controlled by the level sensor (a conductivity probe) which opened the feed valve. Thus, the filtration rate controlled the feed rate using the level controller. A peristatic pump on the permeate stream was used to control the filtration rate, thus the liquid residence time could be controlled by altering the permeate flow rate. The flow rate was initially set at 4 L h−1 then this increased to 8 L h−1 after one doubling time, and then 16 L h−1 after a further doubling time and finally 32 L h−1 after another doubling period. During these experiments, samples were taken periodically for analysis of cell concentration, substrates and products. Depending on the flow rate, the system was operated in a range of time from a few days when the flow rate is small to hours at higher flow rates.
A cleaning protocol was followed to maintain the MBR performance. The membrane was then rinsed with warm water at a temperature of around 50 °C. When the system appeared clean the water was allowed to drain from the membrane and stainless steel pipe work. Next, the drain was closed and the MBR was filled with warm water. Then sodium hydroxide was added to the system to make the system pH around 11. Then the system was drained and rinsed with cold water until the pH of the system became 7. The MBR was then operated for 30 min with the output from the membrane recycled into the glass vessel, and with the membrane peristaltic pump used to back-flush the system.

2.2.2. Statistical Analysis

All the experimental data that gathered were processed through Microsoft Excel software Version 2010 using linear regression analysis. The data were analyzed for accuracy and precision calculating by standard deviation, standard error, experimental error (below 5%) and regression factor. Each parameter was triplicated to obtain the average data (standard deviation of mean <5%, standard error <5%). All the numerical data were proven to be highly accurate and reproducible, having a regression factor between 0.98 and 1 and offering highly significant results.

3. Theoretical

Determination of Kinetic Parameters

For the estimation of the kinetic parameters used to quantify microbial growth, metabolic product generation, and substrate consumption, the following equations [31] were used. Further analysis of equations used to determine flow of substrate and product inflow and outflow of the system can be found in detail elsewhere [23]
Overall biomass concentration (X, g L−1) is being calculated according to the following formula
X = X f X i
where Xf stands for biomass concentration (g L−1) at the end of the fermentation period and Xi for the initial biomass concentration (g L−1) inoculated at the beginning of the process.
Specific growth rate (μmax) and doubling time (DT) were calculated from the logarithmic plots of the optical density (O.D.600nm) at an hourly basis versus time during the exponential growth phase according to the following equations
μ max ( h 1 ) = 1 X dX dt = d ( ln X ) dt = ln 2 DT = 0.693 DT
where DT
  DT   ( h ) = t 2 t 1 X  
The biomass yield (g L−1) produced per carbohydrate consumed in a certain period can be estimated by the following equation
Y x s = X 2 X 1 S 1 S 2
where X2 stands for biomass concentration (g L−1) at the end of the fermentation period and X1 for the initial biomass concentration (g L−1), S1 stands for initial carbohydrate concentration (g L−1) and S2 for the final carbohydrate concentration (g L−1).
Overall glucose consumption (ΔS) is calculated by
Δ S = S i S f  
where Si stands for initial substrate concentration (g L−1) and Sf for final substrate concentration (g L−1) measured at the end of the fermentation period.
The carboxylic acid yield (g L−1) produced per carbohydrate consumed in a certain period can be estimated by the following equation
Y p s = P 2 P 1 S 1 S 2
where P2 stands for final acid concentration (g L−1) and P1 for the initial acid concentration (g L−1), S1 stands for initial carbohydrate concentration (g L−1) and S2 for the final carbohydrate concentration (g L−1).
Volumetric acid productivity indicating the capacity of the biomass produced per bioreactor volume to produce the metabolites of interest was calculated using the following formula
Volumetric   acid   productivity   ( g   L 1   h 1 ) = Final   Concentration   of   acid   in   the   sytem   ( g   L 1   h 1 ) Total   fermentation   time   ( h )  
Specific acid productivity directly indicates the capacity of each cell to synthesize the metabolite of interest was calculated using the following formula
Specific   acid   productivity   ( g 1   g 1   h 1 ) = Total   acid   generated Integrall   cell   area   ( ICA )
where
ICA = ( final   cell   number initial   cell   number   ) days   in   culture log e   ( finall   cell   number   /   initial   cell   number )  
Ratio of acetic (mol L−1) to butyric acid (mol L−1) can be estimated by the following formula
C 2 H 4 O 2   ( acetic   acid ) C 3 C 7 COOH   ( butyric   acid )
The dilution rate (D, h-1) is given by the equation:
D = F V

4. Cost Estimation

4.1. Process Description

The wide adoption of such an intensive bioprocessing scheme is strongly influenced by the cost efficiency of this application when compared to either the conventional methods of production or other methods of biotechnological generation of the end products. Estimating the cost of such a process is a challenge as numerous aspects must be carefully considered including labor costs, transportation of goods and waste, and capital cost relevant to manufacturing and system maintenance. To investigate the feasibility of using a membrane bioreactor for industrially relevant fermentations, a costing study was conducted using the factorial method of cost estimation [32,33]. The study was based on the development of an industrial scale reactor. The unit would be able to receive 10 m3/h of liquid nutrient media. All costs are given in 2018 British pound £. Where necessary, costs were converted using the Marshall Swift Index (MSI) for equipment, the Producers Price Index (PPI) and the Consumer Price Index (CPI) for miscellaneous costs. The location of both units is assumed to be in the United Kingdom.

4.2. Design and Cost of the Units

The cost analysis was based on the assumption that the MBR would be processing 220 m3 per day of formulated nutrient broth made of powdered materials mixed in deionized water. The system was designed to deal with 10 m3/h, 2 h per day are assigned to cleaning and maintenance of the unit. Stainless steel 304 pipes with dairy fittings were connected to a membrane bioreactor. The microfiltration membrane selected of 0.15 m × 1.83 m, a total of 12.7 m2 surface area per module of 15 hollow fiber modules of a total surface area of 180 m2 [34,35]. All components of the unit are commercially available from numerous companies in the United Kingdom and worldwide. The unit is equipped with pressure gauges, pH and temperature meters and level gauges with the equipment used being commercially available.

4.3. General Economic Parameters

System operating costs can be placed into various categories such as raw materials, equipment, maintenance, utilities and labor. The total investment cost (TIC, £) is calculated by adding fixed capital (FC, £) and working capital (WC, £) [32,33,36].
Operating costs can be broken into several main categories including labor, and raw materials.
TIC = FC + WC
The direct production costs (DPC, £) or annual operating cost (AOC, £) are calculated by adding variable costs (VC, £) and fixed costs (FC, £)
DPC = AOC = VC + FC
The production cost (PC, £/kg) is calculated by annual operating cost (AOC, £/year) divided by the annual production rate (APR, kg/year).
PC ( £ kg ) = AOC ,   £ / year APR ,   kg / year

5. Results and Discussion

5.1. Growth on a CSTR on Continuous Mode

The continuous culture of C. butyricum was conducted in a chemostat, in other words, fresh medium [30] was continuously added, while the cultured liquid was continuously removed to maintain the culture volume constant. The propagation was initiated as a batch culture, when the growth reached early stationary phase, prior to the nutrient becoming a limiting factor, fresh feed was introduced, and the system was switched to continuous culture.
The continuous experiments required long periods of operation (weeks) during which the bioreactor was continuously flushed with nitrogen at a pressure of 0.5 bar and operated at 37 °C and pH 6.5. Glucose was selected as the main carbohydrate due to its higher production levels than those of xylose and starch. Glucose concentrations in the feed nutrient broth were 5, 10, 15, 20, and 28 g L−1. The feed nutrient broth was introduced to the CSTR at 5 different flow rates of 0.070, 0.14, 0.20, 0.25 and 0.28 L h−1, offering 5 dilution rates (D) varying between 0.058 h−1 to 0.23 h−1 (Table 1).
Five or more data points were selected to calculate the average of biomass for each dilution rate for the period during which the biomass was in steady state (Figure 3). The system was considered reaching steady state when after 5 volume changes (5 residence times) the change in volume in cellular biomass is not substantial. In the case of the CSTR continuous culture system, since there are various flow rates tested, the periods of time that the system remains at steady state are varying from hours when the flow is high to weeks when the flow is low. The level of biomass produced for concentrations of 15, 20 and 28 g L−1 glucose are initially increasing then gradually decreasing as glucose is spent by the bacterium’s metabolism (Table 1). For 5 g L−1, in contrast with 10 g L−1, the concentration biomass decreases while the dilution rates increase. Probably, in this case, there is poor uptake of glucose to support growth. At 0.058 h−1 the amount of biomass is 0.34 g L−1, dropping to 0.22 g L−1 at 0.23 h−1. When glucose concentration in the feed was raised to 15 g L−1, biomass increased from 0.50 g L−1 at 0.058 h−1 to 1.40 g L−1 at 0.21 h−1, and slightly decreased at 1.04 g L−1 at a dilution rate of 0.23 h−1. A similar pattern was developed when glucose concentration was elevated at 28 g L−1. Interestingly, at the 10 g L−1 of glucose concentration in the feed, the results are different to the glucose concentrations adopted, as a continuously increasing pattern is developed.

5.2. Product Formation on a CSTR on Continuous Mode

Samples of the propagation of C. butyricum in the chemostat were collected and analyzed, to estimate the systems productivity, volumetric and specific regarding the generation of carboxylic acid. C. butyricum is a mixed acid producer, simultaneously with other metabolic products as solvents i.e., ethanol, butanol or vicinal diaketones, glycerol or 1.3 propandiol [36,37,38]. The patterns of acid production exhibit certain similarities, with acetic and butyric acid at high glucose concentration (15 to 28 g L−1), being initially increased at low dilution rates followed by dramatic decreases as the dilution rate is increased (Table 1). The highest levels of butyrate production are achieved at 28 g L−1, at a D of 0.058 h−1 while acetic acid highest concentration was found at 15 g L−1 at a D of 0.21 h−1. As with the pattern of biomass generation at 10 g L−1 of glucose concentration in the feed, the concentration of acetic and butyric acid rose gradually and simultaneously (Table 1), from 5.87 to 7.70 g L−1 for acetic acid and 2.05 to 3.50 g L−1 for butyric acid.
However, in the minimum concentration of glucose in the feed that was used, 5 g L−1, low concentrations for both acids were observed with decreasing pattern formed over the whole range of dilution rates. Carboxylic acids production at these low glucose fermentations were markedly different showing a shift towards acetate production over butyrate. Glucose uptake kinetics are poor and the subsequently rates of carbon and electron flow pathways from glucose to butyrate are low. It can be assumed that product formation was directly related to the glucose consumed; this is clearly shown across the range of concentrations tested, in particular at 20 and 28 g L−1 glucose concentration in the feed. The generation of acetic acid is favored in this culturing system, with the highest ratio favoring acetic acid production being found at a 5 g L−1 initial glucose concentration, 30:1, while at 10 and 15 g L−1 initial of glucose the ratio becomes 4:1 or 3:1, and 3:1 or 2:1 at the highest concentrations of 20 and 28 g L−1 (Table 1). The ratios remain stable over the range of dilution rates but were altered by the amount of glucose present in the fermentation. Acetic acid production reached its highest at 15 g L−1 of glucose initial concentration at a D of 0.23 h−1, followed by 10 g L−1 at the same dilution rate. At elevated concentration of the feed substrate, acetic acid production is reduced possibly due to the formation of other products besides butyric acid, such as solvents or hydrogen [37,38,39]. This would be consistent with the observations associated with alkali consumption and the poor carbon recoveries observed at high sugar concentrations.
These observations are consistent with glucose uptake being limited caused by reduced cell yields and possible inhibition of glucose uptake by high concentrations of end products. This is a common phenomenon found in organic acid fermentations.
Another aspect of evaluating the efficiency for such an intensive culturing system is to examine the yield of organic acid generation in terms of carbon balance i.e., the carbon output and recovery in relation to carbon input. The carbon molecules contained in the carbohydrate and nitrogen feed source, in this case glucose and yeast extract, were considered carbon input while cellular biomass, carbon dioxide and acetic and butyric acid were held as carbon output. These calculations—carbon balances—were made taking into consideration the following assumptions: (a) cell biomass (CH1.77O0.49 N0.24) contains 50 wt. % carbon [40], (b) yeast extract which is mainly comprised of the water-soluble components of the yeast cell, the composition of which is primarily amino acids, peptides, carbohydrates, and salt, is assumed containing at least 50 wt. % carbon [41,42] that is consumed fully (c) during C. butyricum metabolism, for each mole of acetic acid produced, 1 mole of CO2 is generated, while for each mole of butyric acid 2 moles of CO2 are produced (see Supplementary Material: Figure S1b). Therefore, carbon recovery refers to the generation of the organic substances in relation to the organic, carbon-based materials available in the feed.
High percentages of carbon recoveries (above 60%) were observed in initial glucose concentrations of 10 and 15 g L−1 (Table 1) with high production of acids and biomass being observed, suggesting that the system is taking advantage of C. butyricum metabolism fully promoting intensive production of acids. On the other hand, when higher concentrations of glucose were introduced the carbon recovery percentage is not as high (above 40%), while the generation of microbial biomass is favored over the acid production, especially in the case of butyric acid (Table 1). The rate of glucose feed has a significant effect on the carbon balance, suggesting that the carbon and electron flow pathways within the cells are altered allowing new product formation and a shift of metabolism towards more reduced end product in butyrate. This suggests that the capacity of electron flow to hydrogen becomes saturated or altered so that additional reducing electron equivalent are passed to butyrate, thus reducing the proportion of the oxidized product, acetate. Further studies would be required to evaluate and confirm these interesting possibilities, for example the measurement of hydrogen and the determination of other potential end products that are also most certainly formed in cultures that contain high sugar concentration (i.e., >20 g L−1). Possibly, other neutral non-volatile solvent materials might also be formed, explaining the lower carbon recovery.
When the initial glucose feed was set at 5 g L−1, the lowest total carbon recovery was observed, both in terms of acids and biomass generation. Due to the overall elevated generation of carboxylic acid, it is being assumed that the carbon deriving from yeast extract is being completely used, while glucose is directed apart of carboxylic acid production towards biomass generation and systems maintenance.
However, most notable was the relative sugar uptake of systems which showed that the affinity for glucose uptake was related to glucose concentration, with the affinity increasing with increasing sugar concentrations.

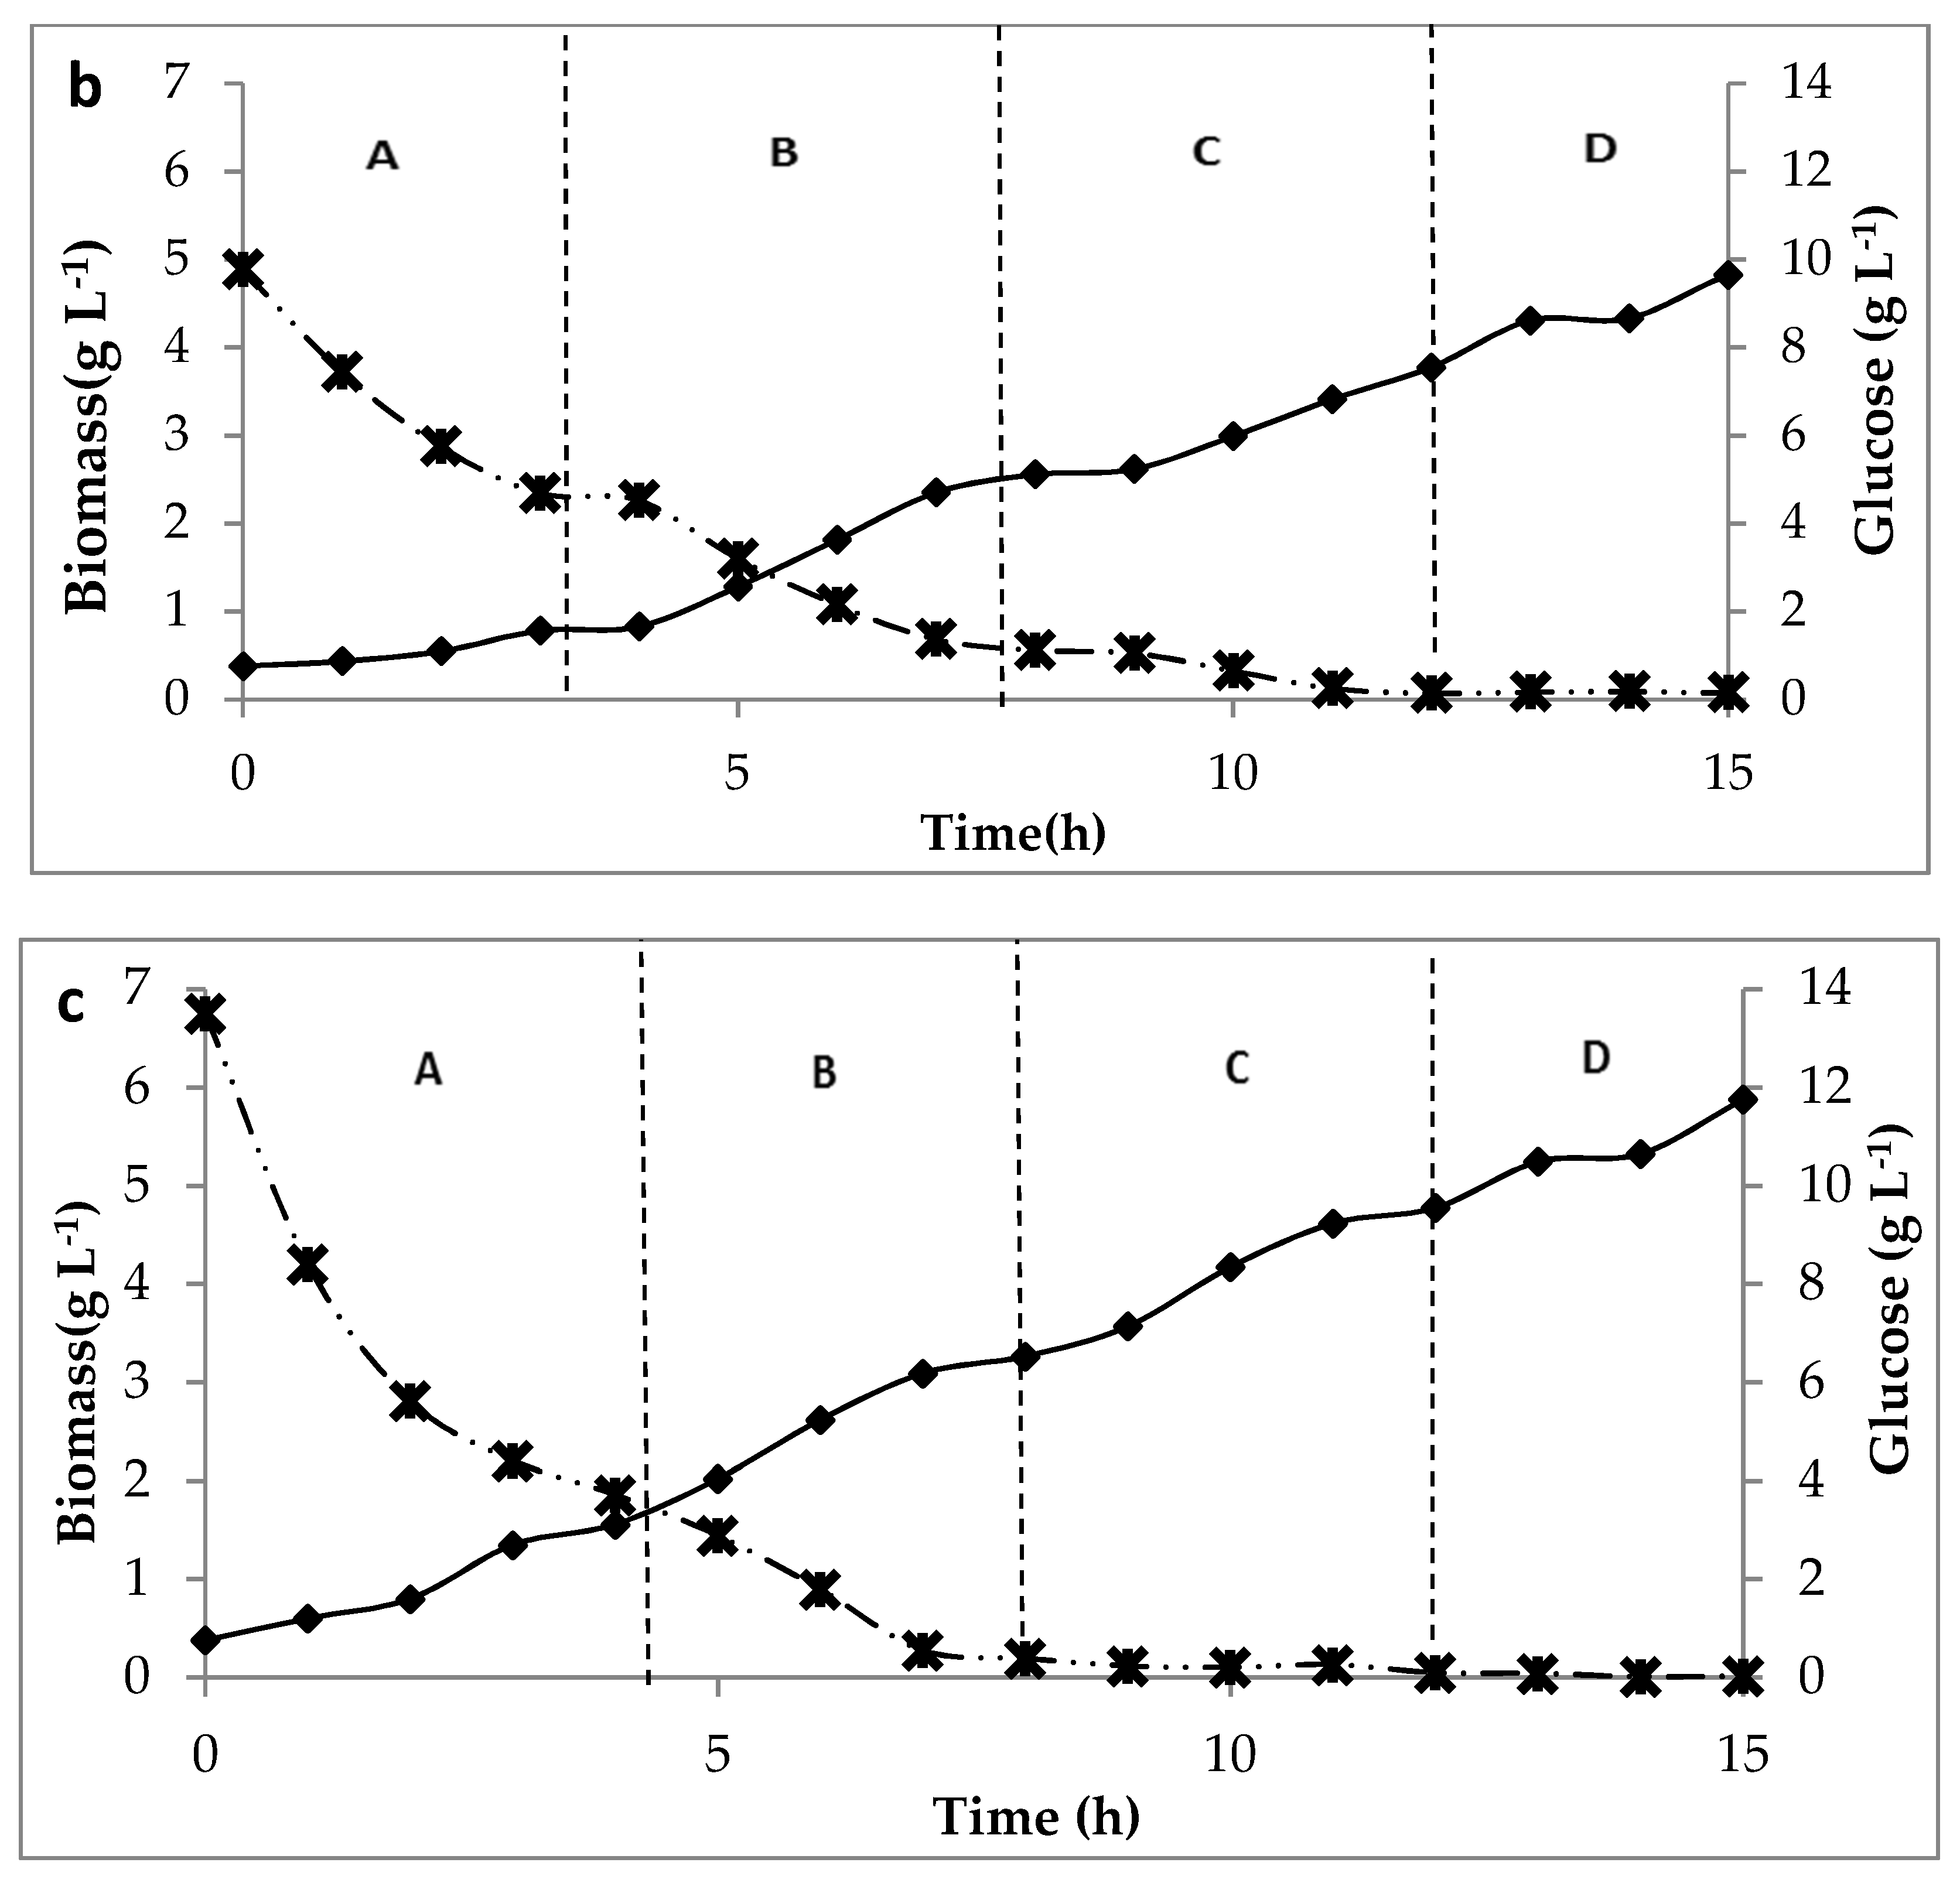
5.3. Growth on a Membrane Bioreactor (MBR) on Fed-Batch Mode with Varying Permeation Rates

The performance of the reactor was assessed using a range of glucose concentrations (5–15 g L−1), and a substrate supplementation strategy at every 4 h, of varying flow rates (4–32 L h−1) in the feed (Table 2). The pH and temperature were set at pH 6.5 and 37 °C and maintained during the process.
The system was inoculated with a 20 L volume of fully grown (mid stationary phase) of C. butyricum, followed by the initiation of the feeding strategy. The cells were retained in the system while the feed rate increased in proportion to the cell concentration increase with the aim of maintaining the medium in excess. The feed rate was initially set at 4 L h−1, then at every doubling time of the biomass was doubled (Table 2). During these trials, samples were taken periodically for analysis of cell concentration, substrate consumption and product generation.
Figure 4a—cdemonstrates the relationship between biomass development and glucose consumption in the MBR for three different feed glucose concentrations, 5, 10 and 15 g L−1) and four permeation rates (Zones A-D, 4, 8, 16, 32 L h−1) at each feed concentration. For all the concentrations; the consumption of glucose increased while, at the same time, the concentration of biomass increased.
Figure 4a show the results for a 5 g L−1 feed glucose concentration. In zone A, with a permeation rate of 4 L h−1, the amount of biomass almost doubled from 0.367 g L−1 to 0.489 g L−1, and glucose decreased from 4.87 g L−1 to 3.88 g L−1. In zone B, (permeation rate 8 L h−1), the concentration of biomass increased to 0.739 g L−1, approximately two times, while the concentration of glucose dropped to 2.63 g L−1. In zone C (permeation rate 16 L h−1), the biomass concentration gradually increased to 1.66 g L−1 while the glucose concentration decreased to 1.07 g L−1. Subsequently, zone D, with a permeation rate of 32 L h−1 shows the biomass concentration increased slowly to 1.93 g L−1 and glucose concentration was 0.92 g L−1. When glucose concentration is doubled (10 g L−1, Figure 4 b) zone A, biomass concentration increases slowly from 0.38 g L−1 to 0.83 g L−1 and glucose consumption decreases from 9.76 g L−1 to 4.51 g L−1. Then, in zone B, biomass increased rapidly to 2.56 g L−1, approximately a three and half times increase, while glucose concentration was 1.12 g L−1. In zone C, biomass still increased to 3.77 g L−1 with a glucose concentration of 0.14 g L−1. Finally, in zone D, the biomass continuously increased to 4.82 g L−1 with glucose concentration of 0.15 g L−1. Finally, in Figure 4 c (15 g L−1 feed glucose) the following results are observed, in zone A the biomass started with a concentration 0.38 g L−1; increasing to 1.56 g L−1, while reducing the glucose concentration from 13.50 g L−1 to 3.71 g L−1. In zone B, the biomass concentration increased substantially to 3.26 g L−1 with glucose concentration being reduced to 0.39 g L−1. In zone C, biomass increased gradually to 4.78 g L−1 and the concentration of glucose dropped to 0.09 g L−1. Then, in zone D the biomass slowly increased to 5.90 g L−1 and the concentration of glucose at 0.028 g L−1.
The highest growth rate (µmax) was achieved at 15 g L−1 glucose concentration (Table 2). It started with a µmax of 0.24 h−1 at a 4 L h−1 permeation rate, increasing dramatically to 0.75 h−1 at 8 L h−1, and then decreasing gradually at 16 L h−1 to 0.55 h−1 and at 32 L h−1 flow rate, decreased to 0.43 h−1. This is a common trend in all experiments the μ initially increases and then reduces at the higher rate feed rates.
This can be attributed mainly to two factors, the first being substrate limitation (Figure 4a–c, zone C and D) and the second is the relatively high biomass concentrations observed towards the end of the fermentations. At high biomass concentrations, the maintenance component of glucose consumption which is dependent on the biomass concentration means that the proportion of carbon used for maintenance increases. The implications of this are that growth rates will decline and so will cell yields on glucose.

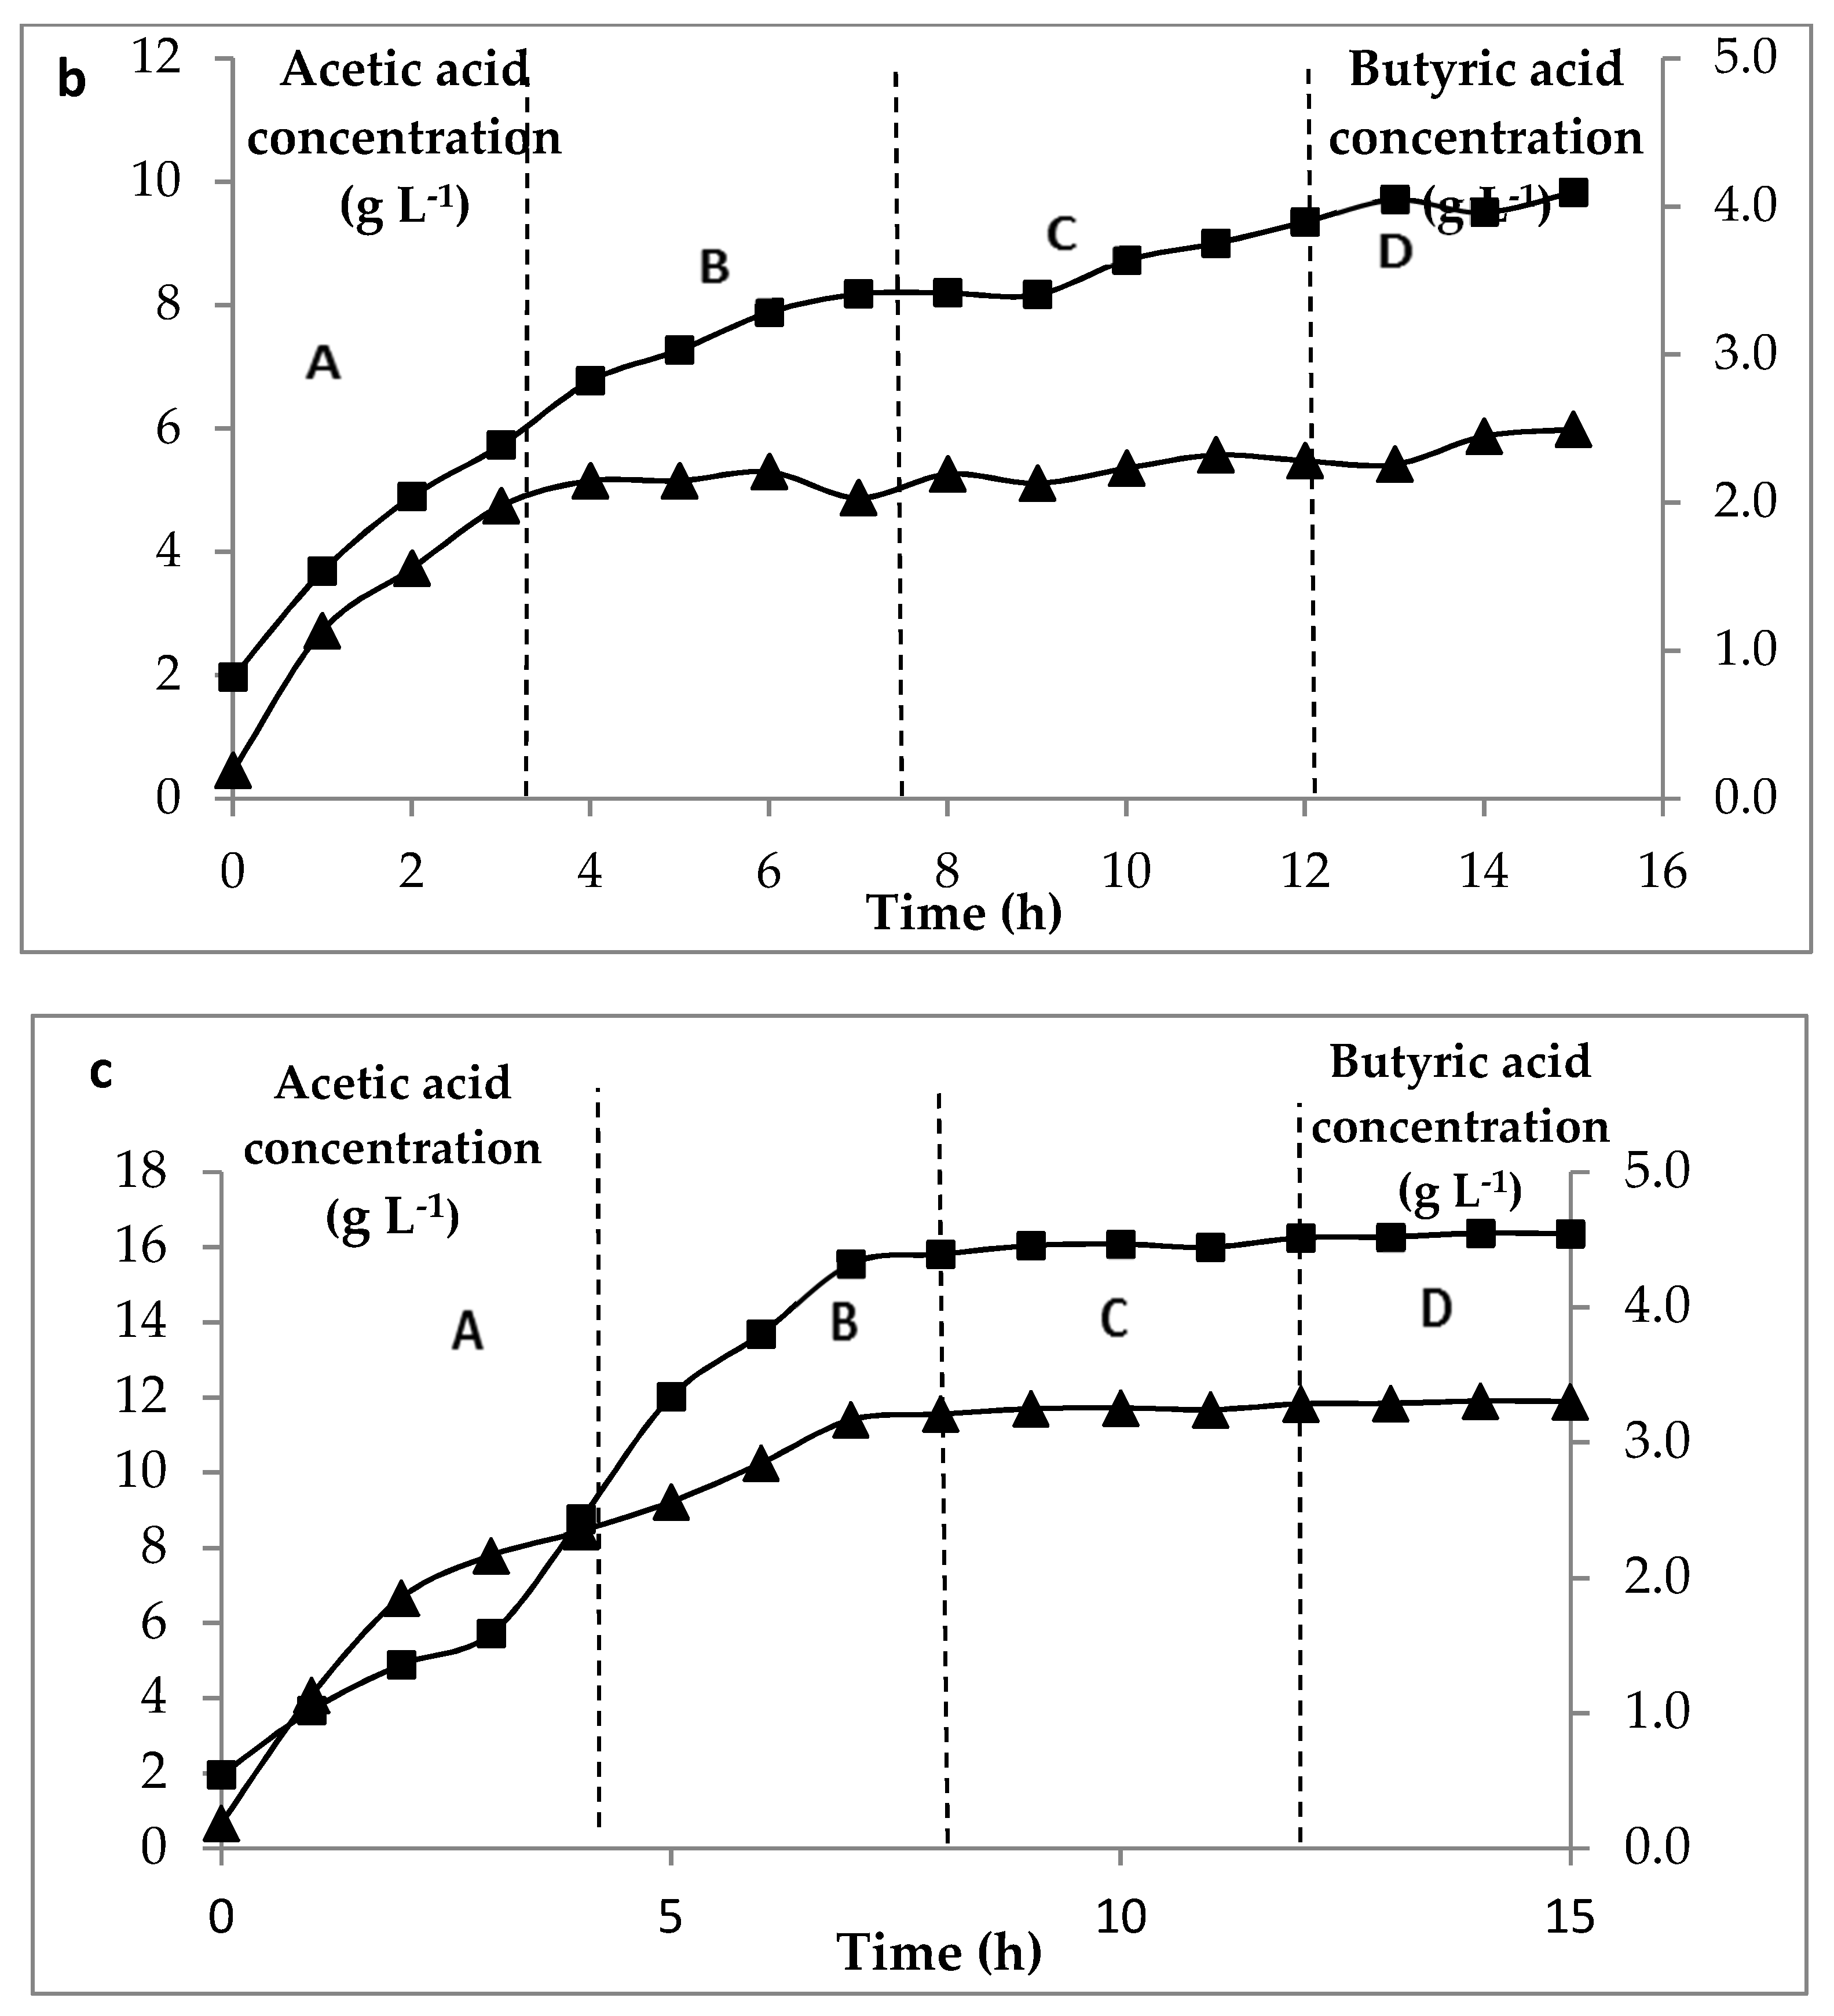
5.4. Product Formation on a Membrane Bioreactor (MBR) on Fed-Batch Mode with Varying Permeation Rates

Organic acid production, namely acetic and butyric acids, were monitored during the MBR fermentations, while the acids produced are removed in the permeate; however, there are still considerable amounts of organic acid present in the reactor during the operation. Figure 5 a–c demonstrates the production of acetic and butyric acid at different permeation rates (4, 8, 16, 32 L h−1) using 5, 10, 15 g L−1 glucose feed. It can be understood that for every increase of permeation rate, the production of acetic and butyric acids increased. In 5 g L−1 glucose feed (Figure 5a) zone A, acetic acid production, with a permeation rate of 4 L h−1, started at 0.14 g L−1 at 0 h and increased to 0.85 g L−1. The permeate flow rate was then increased to 8 L h−1, zone B. Here, there was an immediate increase in the concentration of acetic acid to 2.27 g L−1 while zone C, there was further increase to 3.70 g L−1. Then in the zone D acetic acid production was 4.20 g L−1. On the other hand, butyric acid concentrations did not change substantially over the range of permeation rates. For this concentration, the amount of butyric acid was measured at levels of 0.11 g L−1 to 0.14 g L−1 over the period of 0 h to 15 h. This indicates that the conditions within the MBR favor acetic acid production over butyric acid production. When 10 g L−1 glucose (Figure 5 b) is used in the feed rate, it produces higher concentrations in a rapid rate of acetic and butyric acids when compared to the 5 g L−1. Acetic acid concentration started at 1.96 g L−1, at 0 h, and increased to 6.76 g L−1 a 4 L h−1 permeation rate (zone A). In zone B, the concentration of acetic acid gradually increased to 8.19 g L−1, then, for zone C (16 L h−1) to 9.34 g L−1. At a permeation rate of 32 L h−1 (zone D), in acetic acid production reached 9.82 g L−1. Butyric acid production shares a similar trend increasing gradually at each permeation zone, zone A, 0.18 g L−1 at 0 h to 2.14 g L−1, in zone B to 2.19 g L−1, in zone C to 2.28 g L−1. Lastly, in zone D, butyric acid concentration levels reached 2.49 g L−1 by 15 h. When the feed concentration rose to 15 g L−1 (Figure 5c) production of acetic and butyric acid was faster and higher compared with the two previous feed concentrations. In zone A, (4 L h−1 permeation rate), the concentration of acetic acid started at 1.97 g L−1 and increased to 8.17 g L−1, at zone B, acetic acid concentration increased climbs to 15.81 g L−1 while in zones C and D the concentration was stable reaching 16.35 g L−1. Again, a similar trend is observed for butyric acid, in zone A, there initially was 0.187 g L−1 of butyric acid concentration which increased to 2.34 g L−1. Then, the concentration of butyric acid increased further in zone B, (permeation rate at 8 L h−1) to 3.20 g L−1. After this (in zone C and D) the amount of butyric acid increased slightly to 3.30 g L−1.
In the MBR culturing system the ratio between acetic to butyric acid is favored towards acetic acid, with the highest ratio being present at 5 g L−1 and increasing with increasing permeation rates. The ratio, at 4 L h−1 was approximately 18:1 mol. This is because cell concentration increases as the permeation rate increases, but the source of carbohydrate was limited to sustain the production of both acids. At 8 L h−1 the ratio increased to 30:1 favoring acetic acid, while at 16 g L−1 and 32 g L−1 reached 33:11 and 34:1 mol acetic to butyric acid.
At about 10 g L−1 the ratio of acetic acid to butyric acid, still favored acetic acid, decreasing as the permeation rates increased, possibly because the source of carbohydrate was adequate for butyric acid production since its production increased. The ratio, at 4 L h−1 reached 3.8: 1 mol, 8 L h−1 rose to 4.91:1, while at 16 g L−1 and 32 g L−1 dropped to 3.1:11 and 3:1 mol acetic to butyric acid. Then at 15 g L−1 glucose the ratio increased in the 4 L h−1 permeation rate, thereafter becoming similar to that of other permeation rates. When the permeation rate is at 4 L h−1 the ratio became 2.64:1 mol, 8 L h−1 rose to 3.31:1, while at 16 g L−1 and 32 g L−1 rose to 4.93:1 and 4.95:1 mol acetic to butyric acid.
In terms of carbon recovery supplemented in the feed (Table 2), at 5 g L−1 initial glucose concentration, only 31.29% was recovered at a 4 L h−1 permeate rate increased to 84.3% at 32 L h−1 permeate rate. At 10 g L−1 of initial glucose concentration, 61.7% was recovered at 4 L h−1 permeation rate and then increased to 99.5% at a 32 L h−1 rate. Using 15 g L−1 initial glucose, 64.2% of the carbon was recovered at 4 L h−1 and this increased to 99.7% carbon recovery at 32 L h−1. Carbon is used largely for acid generation, mainly acetic acid, during the microbial metabolism while an amount is used for cellular biomass generation and maintenance. Lower permeation rates lead to lower carbon recovery, while higher permeation rate combined with higher carbohydrate content in the feed, lead to higher carbon recovery therefore higher acid productivity.

5.5. Cost Estimation

The wide usage of the technology of membrane bioreactors for intensive propagation of industrially relevant microorganisms, will depend on their practical and cost-effective application to biotechnological production of acids and other bioproducts [43,44,45]. Estimation of costs is complex as they derive from numerous aspects of the process including labor, maintenance, and capital costs, namely equipment and scale of operations, energy consumption and water usage [46,47,48].
The development of an MBR in an industrial scale (Table 3) has been calculated at £457,416 (Table 4) of which the cost of powdered chemicals for the nutrient media is quite high [49,50]. The calculations are based on 2016 price catalogues provided by nutrient media distributors and manufacturers.
However, there are potential solutions of subsidizing the raw materials with alternative sources. C. butyricum has the propensity of fermenting multiple carbohydrates, making possible the use of vegetative waste such as lignocellulosic hydrolysates. These hydrolysates have been advocated as an economic sustainable substrate for the biochemical production of acids. It has nevertheless been found that the dilute acid treatment used to generate carbohydrates of them, leads to the formation of microbial growth inhibitors such as phenolics, organic compounds or furan compounds. Depending on various factors such as the origin of lignocellulosic biomass, the used pre-hydrolysis/ hydrolysis methods, and the applied operational conditions (e.g., pressure, time, pH, and temperature) regarding their nature, there are numerous detoxification methods to treat the hydrolysates [9]. Certain clostridia spp. growth and metabolites productivity have been found to be susceptible to the toxic effect of phenolic compounds such as vanillin, furfural, and high concentrations of organic acids [9].
C. butyricum has been grown successfully producing a high amount of carboxylic acid on treated agricultural sludge [34]. The nitrogen sources were supplemented via organic content in the form of ammonia and other components such as phosphate and metals necessary for the growth were also present. Other waste sources have been used effectively including industrial wastewaters from food processing industries and breweries [54]. These waste effluents, if used as growth and production media, can be highly profitable compared to the in vitro chemically defined media or those deriving from agricultural crops such as corn maze. These streams can be treated with membrane filtration and can then be blended enabling the formulation of different concentrations of appropriate proportions tailored to accommodate the nutritional needs of microbial fermentations for the intensive production of biofuels, acids, and other chemicals.
The productivity of the MBR system will be limited by the permeate rate of the fluid leaving the reactor. Ultimately, the membrane filtration rate will be limited by the cell concentration in the reactor and the consequent cake layer on the filter. Consequently, if all other conditions are constant, and the cell concentration increases, then the potential permeation rate will decline. There will therefore be an optimum set of conditions which can be calculated from the maintenance coefficient and the area of the membrane present in the systems.
The use of waste as growth and production fermentation media is effective and economical as well as environmentally advantageous, since the production of powdered yeast extract has a carbon footprint of 0.936 kg CO2 per kg of material [55,56]. However, even in the case of using powdered materials the cost is potentially offset by the value of the end products. The cost of preparation and production of carboxylic acid using this system was found to cost 0.0062 £PS/kg.
The MBR is proven a highly beneficial system in terms of cost effectiveness. As biomass is retained in the membrane module, the operational volume is reduced, the streams containing the acids can be further processed by membrane filters, developing an in situ extractive system, eliminating the potential difficulties due to fermentation debris (cellular or medium components) in the recovery of the end products of the microbial metabolism and the toxic effects of the organic acids to the microbial inoculum.
A previous study conducted by the authors of the group in a batch reactor has investigated the bacterium biomass and acids productivity in such a system [21]. When comparing three systems of culturing the bacterium, batch reactor [21], chemostat and membrane bioreactor, it was clearly shown that the MBR is a highly productive and efficient system, in terms of carboxylic acid production (Table 5). Previous research has shown that C. butyricum can grow efficiently in batch reactor; however, the system is not as productive. In the chemostat setting, the acetic acid productivity rate was 4.6 times and butyrate productivity rate was 7.7 times higher than the batch system. On the other hand, the MBR system shows a 40 times higher acetic acid productivity rate and 96 times higher butyric acid productivity rate better than batch system. The productivity of the MBR system will be limited by the permeate rate of the fluid leaving the reactor. Ultimately, the membrane filtration rate will be limited by the cell concentration in the reactor and the consequent cake layer on the filter. Thus, if all other conditions are constant, and the cell concentration increases, then the potential permeation rate will decline. There will therefore be an optimum set of conditions which can be calculated from the maintenance coefficient and the area of the membrane present in the systems
The main disadvantage of the MBR as an intensive bioprocess-based production system of either primary or secondary metabolites is the declining flux due to membrane fouling. Fouling occurs at the interface between the membrane and the mixed liquor. The mechanism is considered rather complicated; the main reasons include adsorption of macromolecular and colloidal matter; such as proteins and carbohydrates; growth of biofilms on the membrane surface; precipitation of inorganic matter; and aging of the membrane. Either configuration of MBR’s (side stream or submerged) use shear at the membrane surface to prevent fouling. It is likely in the case of side stream MBR’s that the shear generated by the pumping will increase cross-flow velocity and thereby supply aeration around the membrane to provide shear stresses. However, the increase of membrane aeration levels brings an increase in reactor operating costs. This can be solved by new jet and cycling aeration systems if the two systems are employed in membrane bioreactors to control membrane fouling, they are very efficient, and reduce energy demand. Other methodologies have also been suggested to prevent fouling such as aeration of the membrane surface or addition of activated carbon in mixed liquor. The most common method though of fouling prevention remains the membrane cleaning. The cleaning protocols are often provided by the membrane manufacturers, while most operators prefer the back-flushing technique. Certainly, cleaning methods are crucial in maximizing the life expectancy of a membrane bioreactor.
Previous studies [57,58,59] have examined considering the production of acetic and butyric acid using C. butyricum, with varying results, considerably different to the results achieved in this study. In most studies the production of butyric acid is favored over acetic acid, possibly due to the different substrate composition (molasses, glycerol) and culturing conditions. Interestingly, in one study [12] when glucose was used at high concentrations (30 g L−1) the production of butyric acid reached 11.75 g L−1 compared to 4.0 g L−1 acetic acid.
In this study, however, acetic acid production was higher than butyric acid. That can be possibly explained by the fact that growth could be derived from yeast extract rather than glucose. In such a case the oxidized constituents can act as electron acceptors, allowing the oxidation of glucose and the formation of acetic acid. Different biochemical pathways were used namely the enzymes involved in the integration of carbon and electron flow pathways. An alternate explanation could also be that redox balance must be maintained on glucose, so other end products would be produced to allow acetic acid to be formed, thus large quantities of hydrogen and other products such as formic acid, glyceraldehyde and possibly glycerol are developed.
In terms of productivity, previous studies were mostly performed in batch setting. The MBR system is much more efficient in terms of carboxylic acid and biomass productivity. In particular, with the system used in this study, 44.89 g L−1 and 13.63 g L−1 concentrations were found for acetic and butyric acid, respectively. Therefore, by comparison the MBR offers 50 times greater productivity for butyric acid and over 500 times greater for acetic acid when compared to previous studies.

6. Conclusions

Overall, this research has shown the potential of using an MBR as a production system for the intensive conversion of carboxylic acid from carbohydrates. The MBR system is most effective compared to other reactor systems although this is technically the most demanding of the three systems studied. In sum, the following points can be made:
  • MBR is the most productive system in terms of cellular biomass and carboxylic acid of the 2 (MBR, continuous reactor).
  • MBR is a truly beneficial system for intensive microbial culturing due to the ability to work around different modes and culture various microorganisms.
  • Depending on culturing conditions and nutrient composition, different acid productivities were observed on the 2 systems.
  • Depending on culturing conditions/nutrient composition, different acid ratios were observed, but overall acetic acid productions was favored.
Further steps could be taken to make the system even more efficient. For example, a system of nanofiltration and reverse osmosis membranes could be installed at the product stream line. They could be used to effectively separate the carboxylic acid from the liquid stream and recycle the water back to the reactor, so end-product inhibition could be avoided, and the acid stream would be concentrated. The high concentration of carboxylic acid produced will be of more value and could be further concentrated or used in other bioprocesses that ferment carboxylic acid to produce polyhydroxyalkanoates (PHAs) and poly-3-hydroxybutyrate (PHB) [60,61,62]. It has been clearly demonstrated that carboxylic acid production can be intensified, and such a system has the potential to become a viable alternative to conventional anaerobic digestion technology.

Supplementary Materials

The following are available online at https://www.mdpi.com/2311-5637/4/4/81/s1, Figure S1: (a) SEM image of pure cultures of C. butyricum NCIMB 7423 used in this study (b) Biochemical pathways used during microbial metabolism of C. butyricum [55].

Author Contributions

Conceptualization, R.W.L., H.A.T., P.M.W., M.-P.Z. and K.R.; Methodology, R.W.L., H.A.T., P.M.W., M.-P.Z. and K.R.; Validation, H.A.T.; Formal Analysis, H.A.T., M.-P.Z. and K.R.; Investigation, H.A.T., M.-P.Z. and K.R.; Writing—Original Draft Preparation, M.-P.Z., H.A.T., R.W.L. and K.R.; Writing—Review & Editing, M.-P.Z.; Supervision, R.W.L. and P.M.W.; Funding Acquisition, H.A.T. and M.-P.Z.

Funding

This research has been funded by the Research University Grant (1001/PTEKIND/811262) from Universiti Sains Malaysia and the Fundamental Research Grant (203/PTEKIND/6711373). Zacharof has been supported by the BEACON Convergence project, funded by the Welsh Government and the European Regional Development Fund (ERDF) of the European Union.

Acknowledgments

This work has benefited from the helpful comments of Anna Charalambidou, Lecturer in English Language at Middlesex University London.

Conflicts of Interest

The authors declare no conflict of interest.

References

  1. DECC (Department of Energy and Climate Change Website). Increasing the Use of Low Carbon Technologies. 2014. Available online: https://www.gov.uk/government/policies/increasing-the-use-of-low-carbon-technologies (accessed on 8 August 2018).
  2. Zacharof, M.-P.; Lovitt, R.W. Complex effluent streams as a potential source of volatile fatty acids. Waste Biomass Valor. 2013, 4, 4557–4581. [Google Scholar] [CrossRef]
  3. Elliott, D.C.; Orth, R.; Gao, J.; Werpy, T.; Eakin, D.; Schmidt, A.; Neuenschwander, G.; Murry, J.; Flagg, A.; Lahman, L. Biorefinery concept development based on wheat flour milling. Fuel Chem. Div. Prepr. 2002, 47, 361–362. [Google Scholar]
  4. Rostkowski, K.H.; Criddle, C.S.; Lepech, M.D. Cradle-to-gate life cycle assessment for a cradle-to-cradle cycle: Biogas-to-bioplastic (and back). Environ. Sci. Technol. 2012, 46, 9822–9829. [Google Scholar] [CrossRef] [PubMed]
  5. Zacharof, M.-P. Grape winery waste as feedstock for bioconversions: Applying the biorefinery concept. Waste Biomass Valor. 2016, 8, 1011–1025. [Google Scholar] [CrossRef]
  6. Bioref-Integ Project. 2008. Available online: http://www.bioref-integ.eu (accessed on 8 August 2018).
  7. Yang, S.T.; Yu, M.; Chang, W.L.; Tang, I.C. Anaerobic Fermentations for the Production of Acetic and Butyric Acids. In Bioprocessing Technologies in Biorefinery for Sustainable Production of Fuels, Chemicals, and Polymers; Wiley & Sons: Hoboken, NJ, USA, 2013. [Google Scholar]
  8. Chen, S.D.; Lee, K.S.; Lo, Y.C.; Chen, W.M.; Wu, J.F.; Lin, C.Y.; Chang, J.S. Batch and continuous biohydrogen production from starch hydrolysate by clostridium species. Int. J. Hydrogen Energy 2008, 33, 1803–1812. [Google Scholar] [CrossRef]
  9. Guan, W.; Shi, S.; Tu, M.; Lee, Y.Y. Acetone–butanol–ethanol production from Kraft paper mill sludge by simultaneous saccharification and fermentation. Bioresour. Technol. 2016, 200, 713–721. [Google Scholar] [CrossRef] [PubMed] [Green Version]
  10. Credence Research, Market Research Reports. Available online: https://www.credenceresearch.com/press/global-butyric-acid-market (accessed on 8 August 2018).
  11. Global Market, Insights to Innovation. Available online: https://www.gminsights.com/industry-analysis/acetic-acid-market (accessed on 8 August 2018).
  12. Murali, N.; Srinivas, K.; Ahring, B.K. Biochemical Production and Separation of Carboxylic Acids for Biorefinery Applications. Fermentation 2017, 3, 22. [Google Scholar] [CrossRef]
  13. Cision PR Newswire. Available online: https://www.prnewswire.com/news-releases/butyric-acid-market-by-application-by-type-by-geography---global-analysis-and-forecast-to-2020-for-the-289-million-industry-300142162.html (accessed on 8 August 2018).
  14. Yoki, H.; Maki, R.; Hirose, J.; Hayashi, S. Microbial production of hydrogen from starch-manufacturing wastes. Biomass Bioenergy 2002, 22, 389–395. [Google Scholar] [CrossRef]
  15. Yoki, H.; Mori, S.; Hirose, J.; Hayashi, S.; Takasoki, Y. H2 production from starch by a mixed culture of Clostridium butyricum and rhodobacter spp. M-19. Biotechnol. Lett. 1998, 20, 895–899. [Google Scholar] [CrossRef]
  16. Miyake, J.; Masato, M.; Yasuo, A. Biotechnological hydrogen production: Research for efficient light energy conversion. J. Biotechnol. 1999, 70, 89–101. [Google Scholar] [CrossRef]
  17. Abbad-Andaloussi, S.; Amine, J.; Gerard, P.; Petitdemange, H. Effect of glucose on glycerol metabolism by Clostridium butyricum DSM 5431. J. Appl. Microbiol. 1998, 84, 515–522. [Google Scholar] [CrossRef] [PubMed]
  18. Wang, X.; Jin, B. Process optimization of biological hydrogen production from molasses by a newly isolated Clostridium butyricum. J. Biosci. Bioeng. 2009, 107, 138–144. [Google Scholar] [CrossRef] [PubMed]
  19. Jung, I.S.; Lovitt, R.W. A comparative study of the growth of lactic acid bacteria in a pilot scale membrane bioreactor. J. Chem. Technol. Biotechnol. 2010, 85, 1250–1259. [Google Scholar] [CrossRef]
  20. Jung, I.S.; Lovitt, R.W. A comparative study of an intensive malolactic transformation of cider using Lactobacillus brevis and Oenococcus oeni in a membrane bioreactor. J. Ind. Microbiol. Biotechnol. 2010, 37, 727–740. [Google Scholar] [CrossRef] [PubMed]
  21. Tajaruddin, H.A.; Lovitt, R.W.; Nur, K.T.; Azwa, N.M.B. A Study of Fatty Acid Production in the Batch Reactor via the Carbohydrate Fermentation by C. butyricum. Int. J. Biol. Biomol. Agric. Food Biotechnol. Eng. 2013, 7, 828–833. [Google Scholar]
  22. Lovitt, R.; Jung, I.; Jones, M. The performance of a membrane bioreactor for the malolactic fermentation of media containing ethanol. Desalination 2006, 199, 24–28. [Google Scholar] [CrossRef]
  23. Zacharof, M.P.; Lovitt, R.W. Modelling and simulation of cell growth dynamics, substrate consumption, and lactic acid production kinetics of Lactococcus lactis. Biotechnol. Bioprocess Eng. 2013, 18, 52–64. [Google Scholar] [CrossRef]
  24. Kirsop, B.E.; Siell, J.J.S. Maintenance of Microorganisms: A Manual of Laboratory Methods, 1st ed.; Academic Press Ltd.: Cambridge, MA, USA, 1984. [Google Scholar]
  25. Demain, L.A.; Davies, J.E. Manual of Industrial Microbiology and Biotechnology; ASM Press: Washington, DC, USA, 1999; pp. 29–45, 49–60, 49–60, 61–75, 80–93, 183–147, 151–163, 165–179. [Google Scholar]
  26. Willis, P.A. Anaerobic Bacteriology, Clinical and Laboratory Practise, 3rd ed.; Butterworth and Co.: London, UK, 1977. [Google Scholar]
  27. Gerhard, G. Bacterial Metabolism, 1st ed.; Springer: New York, NY, USA, 1979. [Google Scholar]
  28. Bu’lock, J.D.; Kristiansen, B. Basic Biotechnology; Academic Press: New York, NY, USA; London, UK, 1978; pp. 75–132, 133–172, 371–374. [Google Scholar]
  29. McKane, L.; Kandel, J. Microbiology Essentials and Applications, 1st ed.; McGraw Hill Inc.: New York, NY, USA, 1996. [Google Scholar]
  30. Malek, I.; Beran, K.; Hospodka, J. Continuous Cultivation of Microorganisms, 1st ed.; Academic Press Ltd.: Cambridge, MA, USA, 1969. [Google Scholar]
  31. Gruger, A.; Gruger, W. Biotechnology: A Textbook of Industrial Microbiology, 1st ed.; Mass Sinauer Associates: Sunderland, MA, USA, 1989. [Google Scholar]
  32. Gerrard, A.M. Guide to Capital Cost Estimating; Institution of Chemical Engineers (IChemE): Rugby, UK, 2000. [Google Scholar]
  33. Towler, G.; Sinnott, R. Chemical Engineering Design Principles, Practice and Economics of Plant and Process Design, 2nd ed.; Elsevier: Oxford, UK, 2013. [Google Scholar]
  34. TAMI Industries INSIDE CeRAM. Available online: http://www.tami-industries.com/INSIDECeRAMTM.109þM54a708de802.0.html (accessed on 8 August 2018).
  35. Pall Corporation Membralox® Ceramic Membrane Products. Available online: http://www.pall.com/main/food-and-beverage/product.page?id¼41052 (accessed on 8 August 2018).
  36. Atkinson, B.; Mavituna, F. Biochemical Engineering and Biotechnology Handbook, 2nd ed.; Stockton Pr: New York, NY, USA, 1991. [Google Scholar]
  37. Zigová, J.; Sturdik, E. Advances in biotechnological production of butyric acid. J. Ind. Microbiol. Biotechnol. 2000, 24, 153–160. [Google Scholar] [CrossRef]
  38. Antoni, D.; Zverlov, V.V.; Schwarz, W.H. Biofuels from microbes. Appl. Microbiol. Biotechnol. 2007, 77, 23–35. [Google Scholar] [CrossRef] [PubMed]
  39. Zacharof, M.-P.; Vouzelaud, C.; Mandale, S.J.; Lovitt, R.W. Valorization of spent anaerobic digester effulents through production of platform chemicals using C. butyricum. Biomass Bioenergy 2015, 81, 294–303. [Google Scholar] [CrossRef]
  40. Yokoi, H.; Tokushige, T.; Hirose, J.; Hayashi, S.; Takasaki, Y. H2 production from starch by a mixed culture of Clostridium butyricum and Enterobacter aerogenes. Biotechnol. Lett. 1998, 20, 143–147. [Google Scholar] [CrossRef]
  41. Fröstl, J.M.; Seifritz, C.; Drake, H.L. Effect of nitrate on the autotrophic metabolism of the acetogens Clostridium thermoautotrophicum and Clostridium thermoaceticum. J. Bacteriol. 1996, 178, 4597–4603. [Google Scholar] [CrossRef] [PubMed]
  42. González-Pajuelo, M.; Meynial-Salles, I.; Mendes, F.; Andrade, J.C.; Vasconcelos, I.; Soucaille, P. Metabolic engineering of Clostridium acetobutylicum for the industrial production of 1,3-propanediol from glycerol. Metab. Eng. 2005, 7, 329–336. [Google Scholar] [CrossRef] [PubMed]
  43. Canganella, F.; Kuk, S.-U.; Morgan, H.; Wiegel, J. Clostridium thermobutyricum: Growth studies and stimulation of butyrate formation by acetate supplementation. Microbiol. Res. 2002, 157, 149–156. [Google Scholar] [CrossRef] [PubMed]
  44. Biebl, H. Fermentation of glycerol by Clostridium pasteurianum—Batch and continuous culture studies. J. Ind. Technol. Biotechnol. 2001, 27, 18–26. [Google Scholar] [CrossRef]
  45. Milic, T.V.; Rakin, M.; Siler-Marinkovic, S. Utilization of baker’s yeast (Saccharomyces cerevisiae) for the production of yeast extract: Effects of different enzymatic treatments on solid, protein and carbohydrate recovery. J. Serb. Chem. Soc. 2007, 72, 451–457. [Google Scholar] [CrossRef]
  46. Gomez-Pastor, R.; Perez-Torrado, R.; Garre, E.; Matallana, E. Recent advances in yeast biomass production. In Biomass Detection, Production and Usage; Matovic, D., Ed.; InTech: London, UK, 2011. [Google Scholar]
  47. Cote, P.; Buisson, H.; Pound, C.; Arakaki, G. Immersed membrane activated sludge for the reuse of municipal wastewater. Desalination 1997, 113, 189–196. [Google Scholar] [CrossRef]
  48. Buisson, H.; Cote, P.; Praderie, M.; Paillard, H. The use of immersed membranes for upgrading wastewater treatment plants. Water Sci. Technol. 1998, 37, 89–95. [Google Scholar] [CrossRef]
  49. Wisniewski, C.; Cruz, A.L.; Grasmick, A. Kinetics of organic carbon removal by a mixed culture in a membrane bioreactor. Biochem. Eng. J. 1999, 3, 61–69. [Google Scholar] [CrossRef]
  50. Du, J.; McGraw, A.; Lorenz, N.; Beitle, R.R.; Clausen, E.C.; Hestekin, J.A. Continuous fermentation of Clostridium tyrobutyricum with partial cell recycle as a long-term strategy for butyric acid production. Energies 2012, 5, 2835–2848. [Google Scholar] [CrossRef]
  51. LabM Limited Price Catalogue. Available online: http://www.labm.com/ (accessed on 8 August 2018).
  52. Neogen Corporation. Acumedia Manufacturing. Available online: http://www.neogen.com/Acumedia/ (accessed on 8 August 2018).
  53. Chegini, S. Removal of Potential Inhibitors from Hemicellulose Hydrolysate by Membrane Filtration. Master’s Thesis, École Polytechnique de Montréal, Montreal, QC, Canada, 2014. Available online: https://publications.polymtl.ca/1495/ (accessed on 8 August 2018).
  54. Choi, J.-I.; Lee, S.Y. Process analysis and economic evaluation for poly (3-hydroxybutyrate) production by fermentation. Bioprocess Eng. 1997, 17, 335–342. [Google Scholar] [CrossRef]
  55. Van Wegen, R.J.; Ling, Y.; Middelberg, A.P.J. Industrial production of polydroxyalkanoates using Escherichia coli: An economic analysis. Trans. IChemE 1998, 76, 417–426. [Google Scholar] [CrossRef]
  56. Naranjo, J.M.; Posada, J.A.; Higuita, J.C.; Cardona, C.A. Valorization of glycerol through the production of biopolymers: The PHB case using Bacillus megaterium. Bioresour. Technol. 2013, 133, 38–44. [Google Scholar] [CrossRef] [PubMed]
  57. Efremenko, E.N.; Nikolskaya, A.B.; Lyagin, I.V.; Senko, O.V.; Makhlis, T.A.; Stepanov, N.A.; Maslova, O.V.; Mamedova, F.; Varfolomeev, S.D. Production of biofuels from pretreated microalgae biomass by anaerobic fermentation with immobilized Clostridium acetobutylicum cells. Bioresour. Technol. 2012, 114, 342–348. [Google Scholar] [CrossRef] [PubMed]
  58. Petitdemange, H.; Cherrier, C.; Bengone, J.M.; Bray, R. Etude des activites NADH et NADPH-ferredoxine oxydoreductasiques chez Clostridium acetobutylicum. Can. J. Microbiol. 1977, 23, 152–160. [Google Scholar] [CrossRef] [PubMed]
  59. Karjalainen, P.P. Bin the Carbon Footprint of the Finnish Beverage Industry for Years 2000–2012 as Calculated with CCaLC. Master’s Thesis, University of Helsinki, Helsinki, Finland, 2013. [Google Scholar]
  60. Dwidar, M.; Park, J.-Y.; Mitchell, R.J.; Sang, B.-I. The Future of Butyric Acid in Industry. Sci. World J. 2012, 2012, 471417. [Google Scholar] [CrossRef] [PubMed]
  61. Vandak, D.; Zigová, J.; Šturdık, E.; Schlosser, S. Evaluation of solvent and pH for extractive fermentation of butyric acid. Process Biochem. 1997, 32, 245–251. [Google Scholar] [CrossRef]
  62. Melford Chemical and Biochemical Manufacturing Price Catalogue. Available online: http://melford.co.uk/ (accessed on 8 August 2018).
Figure 1. Schematic diagram of the continuous culture reactor (CSTR) (1) Air Filter (2) Feed vessel (3) valve (4) Feed pump (5) Magnetic stirrer plate (6) Stirring bar (7) pH probe (8) Alkali reservoir (9) valve (10) pH controller (11) Air filter (12) Rotameter (13) Sampling port (14) Effluent pump.
Fermentation 04 00081 g001
Figure 2. Schematic diagram of the membrane bioreactor (MBR) (1) Nitrogen gas supply (2) Feed vessel (3) diaphragm valve (4) Coils (5) Diaphragm valve (6) control panel(including level and temperature controller) (7) Heat exchanger (8) Feed pump (9) recirculation pump (10) drain valve (11) Pressure gauge (12) Hollow fiber module (13) Pressure gauge (14)Thermocouple (15) reaction vessel (16) feed valve (17) peristaltic pump.
Fermentation 04 00081 g002
Figure 3. The growth of C.butyricum on glucose media at three concentrations of glucose on steady state (◆) for 5 g L−1 feed, (×) 10 g L−1 feed (▲) 15 g L−1 feed, (■) 20 g L−1 feed and (•) 28 g L−1 feed.
Fermentation 04 00081 g003
Figure 4. (ac): The growth (◆) and consumption of feed ( Fermentation 04 00081 i001) of C. butyricum on glucose media at three concentrations of glucose. (a) for 5 g L−1 feed, (b) 10 g L−1 feed and (c) 15 g L−1, at permeation rates: A: 4 L h−1, B: 8 L h−1, C: 16 L h−1, D: 32 L.
Fermentation 04 00081 g004aFermentation 04 00081 g004b
Figure 5. (ac): The production of acetic (■) and butyric acid (▲) by C. butyricum growth on glucose media at three concentrations of glucose. (a) for 5 g L−1 feed, (b) 10 g L−1 feed and (c) 15 g L−1, at permeation rates: A: 4 L h−1, B: 8 L h−1, C: 16 L h−1, D: 32 L.
Fermentation 04 00081 g005aFermentation 04 00081 g005b
Table 1. Performance of C. butyricum (carboxylic acid productivity, biomass generation, glucose consumption, carbon recovery) in a continuous culture (chemostat) system.
Initial Glucose Concentration (Si, g L−1)Dilution Rate (D, h−1)Glucose Spent (ΔS, g L−1)Biomass (X, g L−1)Carboxylic Acids Concentration (g L−1)Carboxylic Acids Volumetric Productivity (g−1 L−1 h−1)Carboxylic Acids Specific Cell Productivity (g−1 g−1 h−1)Biomass Yield (Yx/s)Carboxylic Acid Yield (Yp/s)Total Carbon Recovery (%)
Acetic AcidButyric AcidAcetic AcidButyric AcidAcetic AcidButyric Acid
50.0581.40.343.490.180.20.010.590.030.240.7333.70
0.1171.20.33.130.180.370.021.230.070.250.6635.32
0.1671.10.292.830.180.470.031.620.100.260.6036.87
0.211.00.232.710.180.570.042.480.170.230.5840.11
0.230.80.222.650.090.610.022.770.090.280.5543.74
100.0585.10.485.872.050.340.120.710.250.090.7977.16
0.1175.580.566.022.620.70.311.250.550.10.8683.45
0.1677.190.96.362.911.060.491.180.540.130.9383.46
0.217.861.086.933.051.460.641.350.590.141.0086.78
0.238.11.257.73.51.770.811.420.650.151.1296.91
150.0588.410.56.162.090.360.120.720.240.060.5568.06
0.1178.960.786.782.930.790.341.010.440.090.6580.42
0.1679.451.067.083.611.180.61.110.570.110.7188.64
0.2110.21.47.784.461.630.941.160.670.140.8299.87
0.2310.01.057.393.781.70.871.620.830.110.7490.18
200.05813.50.547.044.670.410.270.760.500.040.5980.40
0.11713.790.988.245.20.960.610.980.620.070.6792.61
0.16714.041.565.663.330.950.560.610.360.110.4565.24
0.2113.681.454.472.310.940.490.650.340.110.3450.80
0.2313.321.273.771.920.870.440.690.350.10.2843.44
280.05817.650.777.765.110.450.30.580.390.040.4680.00
0.11714.491.676.985.030.820.590.490.350.120.4378.25
0.16713.051.555.233.530.870.590.560.380.120.3161.93
0.2112.491.464.812.821.010.590.690.400.120.2755.07
0.2311.031.273.851.940.890.450.700.350.120.2141.39
Table 2. Performance of C.butyricum (carboxylic acid productivity, biomass generation, glucose consumption, carbon recovery) in a MBR fed-batch culture system.
Initial Glucose Concentration (Si, g L−1)Flow Rate (L h−1)Glucose Spent (ΔS, g L−1)µmax (h−1)Doubling Time (h)Acetic Acid Volumetric Productivity (g−1 L −1 h−1)Butyric Acid Volumetric Productivity (g−1 L −1 h−1)Biomass (X, g L−1)Acetic Acid Specific Cell Productivity (g−1 g−1 h−1)Butyric Acid Specific Cell Productivity (g−1 g−1 h−1)Total Carbon Recovery (%)
542.260.0713.561.650.090.742.230.1231.29
84.170.185.516.260.292.252.780.1358.04
164.720.224.5614.330.634.233.390.1577.65
324.850.166.4229.680.855.685.230.1584.31
1045.320.185.563.560.920.834.291.1161.69
88.880.522.0310.423.142.623.981.284.31
169.350.501.9418.686.924.334.311.690.03
329.810.402.5437.8814.345.766.462.4599.46
15410.590.254.104.161.581.354.481.1764.23
814.450.751.3314.373.212.625.481.2384.53
1614.740.551.8328.296.494.176.781.5690.11
3214.970.432.3557.1914.515.889.732.4799.71
Table 3. Major equipment specification and purchase cost (based on 2018) to obtain 220 m3/d of media [51].
UnitElementTypeSurface Area (m2)MaterialTotal Cost (GBP, £)Power Usage (MJ)Cooling Water (kg/day)
MBRTankProcessing 37.3Stainless steel Type 30474,500-17,000
Collection37.3-
PumpsFeed -Plastic/Metal220037.15
Recirculation-
MembraneHollow fiber180Polymeric (PVDF)5680-
Heat Exchanger Shell and tube173.2Stainless steel Type 30452,000-
Raw materials Powdered chemicals i.e., yeast extract, glucose, sodium chloride etc. and tap water-Powder or liquid317,034
Table 4. Total Plant Direct Cost (TPDC, £) (Physical Cost) (based on 2018 prices) of production of carboxylic acids using the MBR system [51,52,53].
Fixed Capital Estimate Summary MBR
Total Plant Direct Cost (TPDC, £) (Physical Cost)
Equipment erection 0.4
Piping0.7
Instrumentation 0.2
Electricals 0.1
Buildings none required
Utilitiesnot applicable
Storage provided in PCE
Site development not applicable
Ancillary buildingsnone required
Design and Engineering0.3
Variable Costs
Raw materials £317,034.00
Miscellaneous materials£1316.92
Utilities Cost
Cooling water£294.81
Power£2227.57
Water£5500
Shipping and Packagingnot applicable
Fixed Costs
Maintenance £13,169.24
Operating labor £54,000
Plant overheads £27,000.00
Capital charges £34,240.02
Insurance £2633.85
Local taxes not applicable
Royaltiesnone required
Sales expenses not applicable
General overheads not applicable
R&Dnot applicable
Total annual production rate(rounded)£457,416.41
Table 5. Comparison of productivity of acetic and butyric acid in the batch, continuous and MBR systems [21].
Reactor SystemInitial Glucose Concentration (g L−1)Acetic Acid Volumetric Productivity (g−1 L −1 h−1)Butyric Acid Volumetric Productivity (g−1 L −1 h−1)Acetic Acid Productivity RatioButyric Acid Productivity Ratio
Batch100.950.151.01.0
Continuous4.411.274.68.7
MBR37.8814.4439.996.0

