Microbial Effects on the Production of Aquaponically Grown Lettuce

Department of Biological and Environmental Engineering, Cornell University, Ithaca, NY 14853, USA
*
Author to whom correspondence should be addressed.
Horticulturae 2017, 3(3), 46; https://doi.org/10.3390/horticulturae3030046
Submission received: 26 April 2017
/
Revised: 21 July 2017
/
Accepted: 2 August 2017
/
Published: 8 August 2017
Abstract
:In the study of aquaponics, questions have risen concerning the role of microbiota upon plant growth. This experiment compared unaltered aquaponic nutrient solution at pH 7.0 (treatment A7) with sterilized aquaponic nutrient solution at pH 7.0 (treatment SA7) to quantify effects that live microorganisms had on the growth of lettuce (Lactuca sativa). Baseline comparisons were made to conventional hydroponic conditions using inorganic nutrients at pH 5.8 (treatment H5) or pH 7.0 (treatment H7), which showed a 51% reduction in lettuce fresh weight (FW) growth, indicating a strong negative effect of the higher pH nutrient solution; a similar large difference (38%) occurred for dry weight (DW) comparisons between these two treatments. No difference occurred between the sterilized aquaponic treatment (SA7) and H5 in FW or DW. H5 produced more FW and DW than the non-sterile aquaponic treatment (A7). Responses were not different in FW and DW between the two aquaponic conditions. Reduced FW and DW of A7 compared to H5 may be related to the 50 times higher microbial community living in the A7 treatment water than in H5 at the beginning of each trial. Given that the sterile aquaponic solution SA7 and the H5 hydroponic condition were not different in performance, we concluded that the beneficial effects of the microbial community in the fish recirculating aquaculture system (RAS) occurred before the water was sterilized. An interesting implication of our findings is that an RAS can be decoupled from the hydroponic growing system, since its benefits are not dependent upon continuous recirculation between the plant and fish system and its living biotic community.
Keywords:
aquaponics; hydroponics; root zone; microorganisms; rhizobacteria; microbes; sterilization1. Introduction
Aquaponics is the incorporation of fish and hydroponically grown plants into one system. Standard aquaponic systems are composed of fish rearing tanks, a clarifier to collect and mineralize suspended solids, and a filtering tank to minimize the remaining suspended solids [1,2]. This system provides a sustainable, closed-loop system for raising both fish and vegetable crops concurrently.
Aquaponic nutrient solutions have lower nutrient concentrations than comparable hydroponic systems, yet plant yields do not decrease [3]. It has been postulated that aquaponic systems supply more than just nutrients, and somehow cultivate an ecosystem of microorganisms, rhizobacteria, or fungi that are beneficial to the plants in the system [4]. It is well known that nitrifying bacteria associated with an aquaponic system reduce ammonia and nitrite nitrogen to nitrate, all of which can be harmful to fish [5,6]. The integration of fish and plant components raises the possibility that there are other organisms and products or byproducts associated with the fish system that improve the growth of aquaponic plants using less than the ideal nutrient conditions supplied from closely controlled hydroponic-type nutrient conditions. Previous research by our group had shown that lettuce grown at a pH of 7.0 using fish nutrient water performed as well as lettuce grown under ideal hydroponic conditions and a pH of 5.8, while hydroponic lettuce grown at an elevated pH of 7.0 saw a 26% decrease in fresh shoot weight at harvest [7].
The objective of this experiment was to discover if the benefits of aquaponic nutrient solution are due solely to the nutrients provided by the fish and the microbial activity in the fish system, or if there is a previously unknown microbial ecosystem benefitting the plants once the fish nutrient water is supplied to the lettuce growing system. We investigated this question by comparing lettuce grown using hydroponic water at an ideal pH of 5.8 and an elevated pH of 7.0 as well as two aquaponic conditions at pH 7.0 where one of the aquaponic conditions used sterilized aquaponic water.
2. Materials and Methods
2.1. Experimental Setup
The experiment was conducted at Cornell University’s Kenneth Post Laboratory greenhouse complex in Ithaca, New York at a latitude of approximately 42° N and a longitude of 76° W. Trial 1 occurred between 24 February and 21 March 2016, and Trial 2 occurred between 8 March and 4 April 2016. All environmental parameters were monitored by an Argus system (Argus Control Systems Ltd., Surrey, BC, Canada), in which data samples were collected every two seconds, averaged every 2 min, and logged. The experiment was conducted in a middle section of a multi-sectioned glass greenhouse with dimensions 9 m × 10 m × 7 m high to the ridge, oriented east-west. The greenhouse was kept at a constant temperature of 24 °C, maintained by two identical forced air water-to-air heat exchangers on opposite ends of the greenhouse, rated at 115,000 kJ/h.
A daily light integral (DLI) was maintained at 17 mol/m2·day of photosynthetically active radiation (PAR) by a combination of natural and supplemental light. Day length increased over the course of the experiment’s post-seedling stage from 11:43 h to 12:55 h. Since we maintained the same DLI over the entire experiment, we assumed there was no effect from the day length change. Supplemental light was provided by an array of 20 high-pressure sodium (HPS) lights (General Electric, 400 watt clear S51/O, Mogul Base rated ED18 HSP, LU 400/H/ECO). Lights were arrayed to ensure that each plant received the same amount of light. A LiCor quantum sensor (LI-190R, LI-COR Biosciences, Lincoln, NE, USA) was used to quantify lighting at the plant level. CO2 was not controlled or measured, but was assumed to be ambient. Humidity was not controlled but monitored and left at ambient conditions, typically between 50% and 60% during the daytime period. Root zone temperature was not controlled, but was within 1.9 °C of the average room temperature of 24 °C. Each trial took place over 27 days with the last 13 of these days in the bucket environment. All plants were grown in buckets, described in more detail below.
All seeds for all trials were germinated in an ebb and flow seeding bench and then were transplanted after 14 days to the bucket system for days 15 to 27. Seedlings at day 14 were randomly selected from the available seedlings after discarding atypical (including large or small) plants.
2.2. Treatments
Two trials of 10 replicates of four treatments were performed. The four treatments are shown in Table 1. Each treatment will be referenced by their respective acronym throughout the paper. The H5 treatment of conventional hydroponic at pH 5.8 was considered the control treatment, and was used as a basis for comparisons with other treatments.
Nutrient concentrations used for the four treatments at the beginning of the trial and then at the replacement of solution every two days are given in Table 2. H5 was a standard Sonneveld and Straver nutrient solution for lettuce [8], modified to half concentration, adjusted to pH 5.8, and without silicon. H7 was the same nutrient solution as H5, adjusted to pH 7.0. Two hundred liters of H5 and H7 solution were prepared at once using reverse osmosis (RO) water and concentrated stock solutions. The modified solutions were created following details provided in our previous publications [7,9]. The starting nutrient conditions for our four treatments were assumed to be the same as H5, H7, and A7 reported by Vandam et al. [10], since they used the same fish system, nutrient solution stocks, and protocols, and were analyzed within one month of when we started this experiment. A7 and SA7 nutrient elemental concentrations would be similar, since the same water from the fish system was used for both. We did not investigate whether the autoclaving process had any impact on the compounds present due to heat transformation.
Chelated iron (Fe-DTPA, brand name Sprint 330, BASF Corporation, Research Triangle Park, Durham, NC, USA) was included for all treatments at 11 mg/L (10% of the material is active as elemental iron or 1.1 mg/L). A7 received the Fe-DTPA immediately after its removal from the main aquaponic system, while SA7 received Fe-DTPA after sterilization. The Fe values in Table 2 are for total Fe present, which would be exclusively from the chelated additive for H5 and H7, while the higher Fe value for A7 included the Fe in the chelated material, as well as Fe from other compounds in the fish water and residual non-chelated Fe from previous experiments. The chelated form of Fe from the fish system water was assumed to be minimal, since the chelated product breaks down fairly rapidly to other Fe compounds due to UV radiation from sunlight, as was the case for our experimental setup. Humic and fulvic acids can act as natural chelators and are the byproduct of decomposition [11], and thus were likely present in our system. Selectivity for elements and the concentration of these natural chelators was not evaluated in this experiment.
Nutrient solutions in each bucket were changed every two days to restore nutrient conditions to their initial known values. Given the frequent change to known conditions and that nutrient solutions are designed to provide surplus nutrients, we considered our data collection every two days to be sufficient to characterize the nutrient conditions that the plants were grown under. Lettuce plants were harvested after 27 days of growth to ensure that elements would not be depleted between solution changes, e.g., our plants at 27 days were only 15% to 20% of a commercial harvest size of 150 g. From a mass balance perspective, we calculated that macro elements in solution declined by only 2% to 4% from their initial values.
The H5 and H7 solutions were adjusted daily to the targeted pH five days in advance of plant placement using KOH for base and HNO3 for acid corrections. While H5 did not require any corrections after the first day, H7 experienced precipitation from the elevated pH that required daily adjustments for a period (discussed in our previous papers [7,9]). The five-day adjustment period for the nutrient solutions was to ensure that the majority of any pH-related precipitation occurred before we used the nutrient solution for the plants and that the pH in the stock container remained relatively constant once the experiment was initiated.
A7 used unsterilized water from a 1400-L recirculating aquaculture system growing approximately 52 adult koi (Cyprinus carpio) being fed 90 g per day of a commercial koi pelleted feed. Koi feed (Max Growth Diet floating extruded pellet) was purchased from Blackwater Creek Farms (Eustis, FL, USA, www.koisale.com). All food was used within six months of the mill date to ensure nutritional quality; details of the fish system and feeding protocols are given in our earlier papers [7,9]). SA7 solution was obtained from the same system as A7 and then autoclaved following an established liquid autoclaving protocol [12]. Our sterilization protocol heated the nutrient solutions to approximately 120 °C and 1.36 atmospheres of gage pressure. Autoclave tape was applied to ensure that the liquid reached the necessary sterilization temperature. After autoclaving, the nutrient solutions were allowed to cool to room temperature before use.
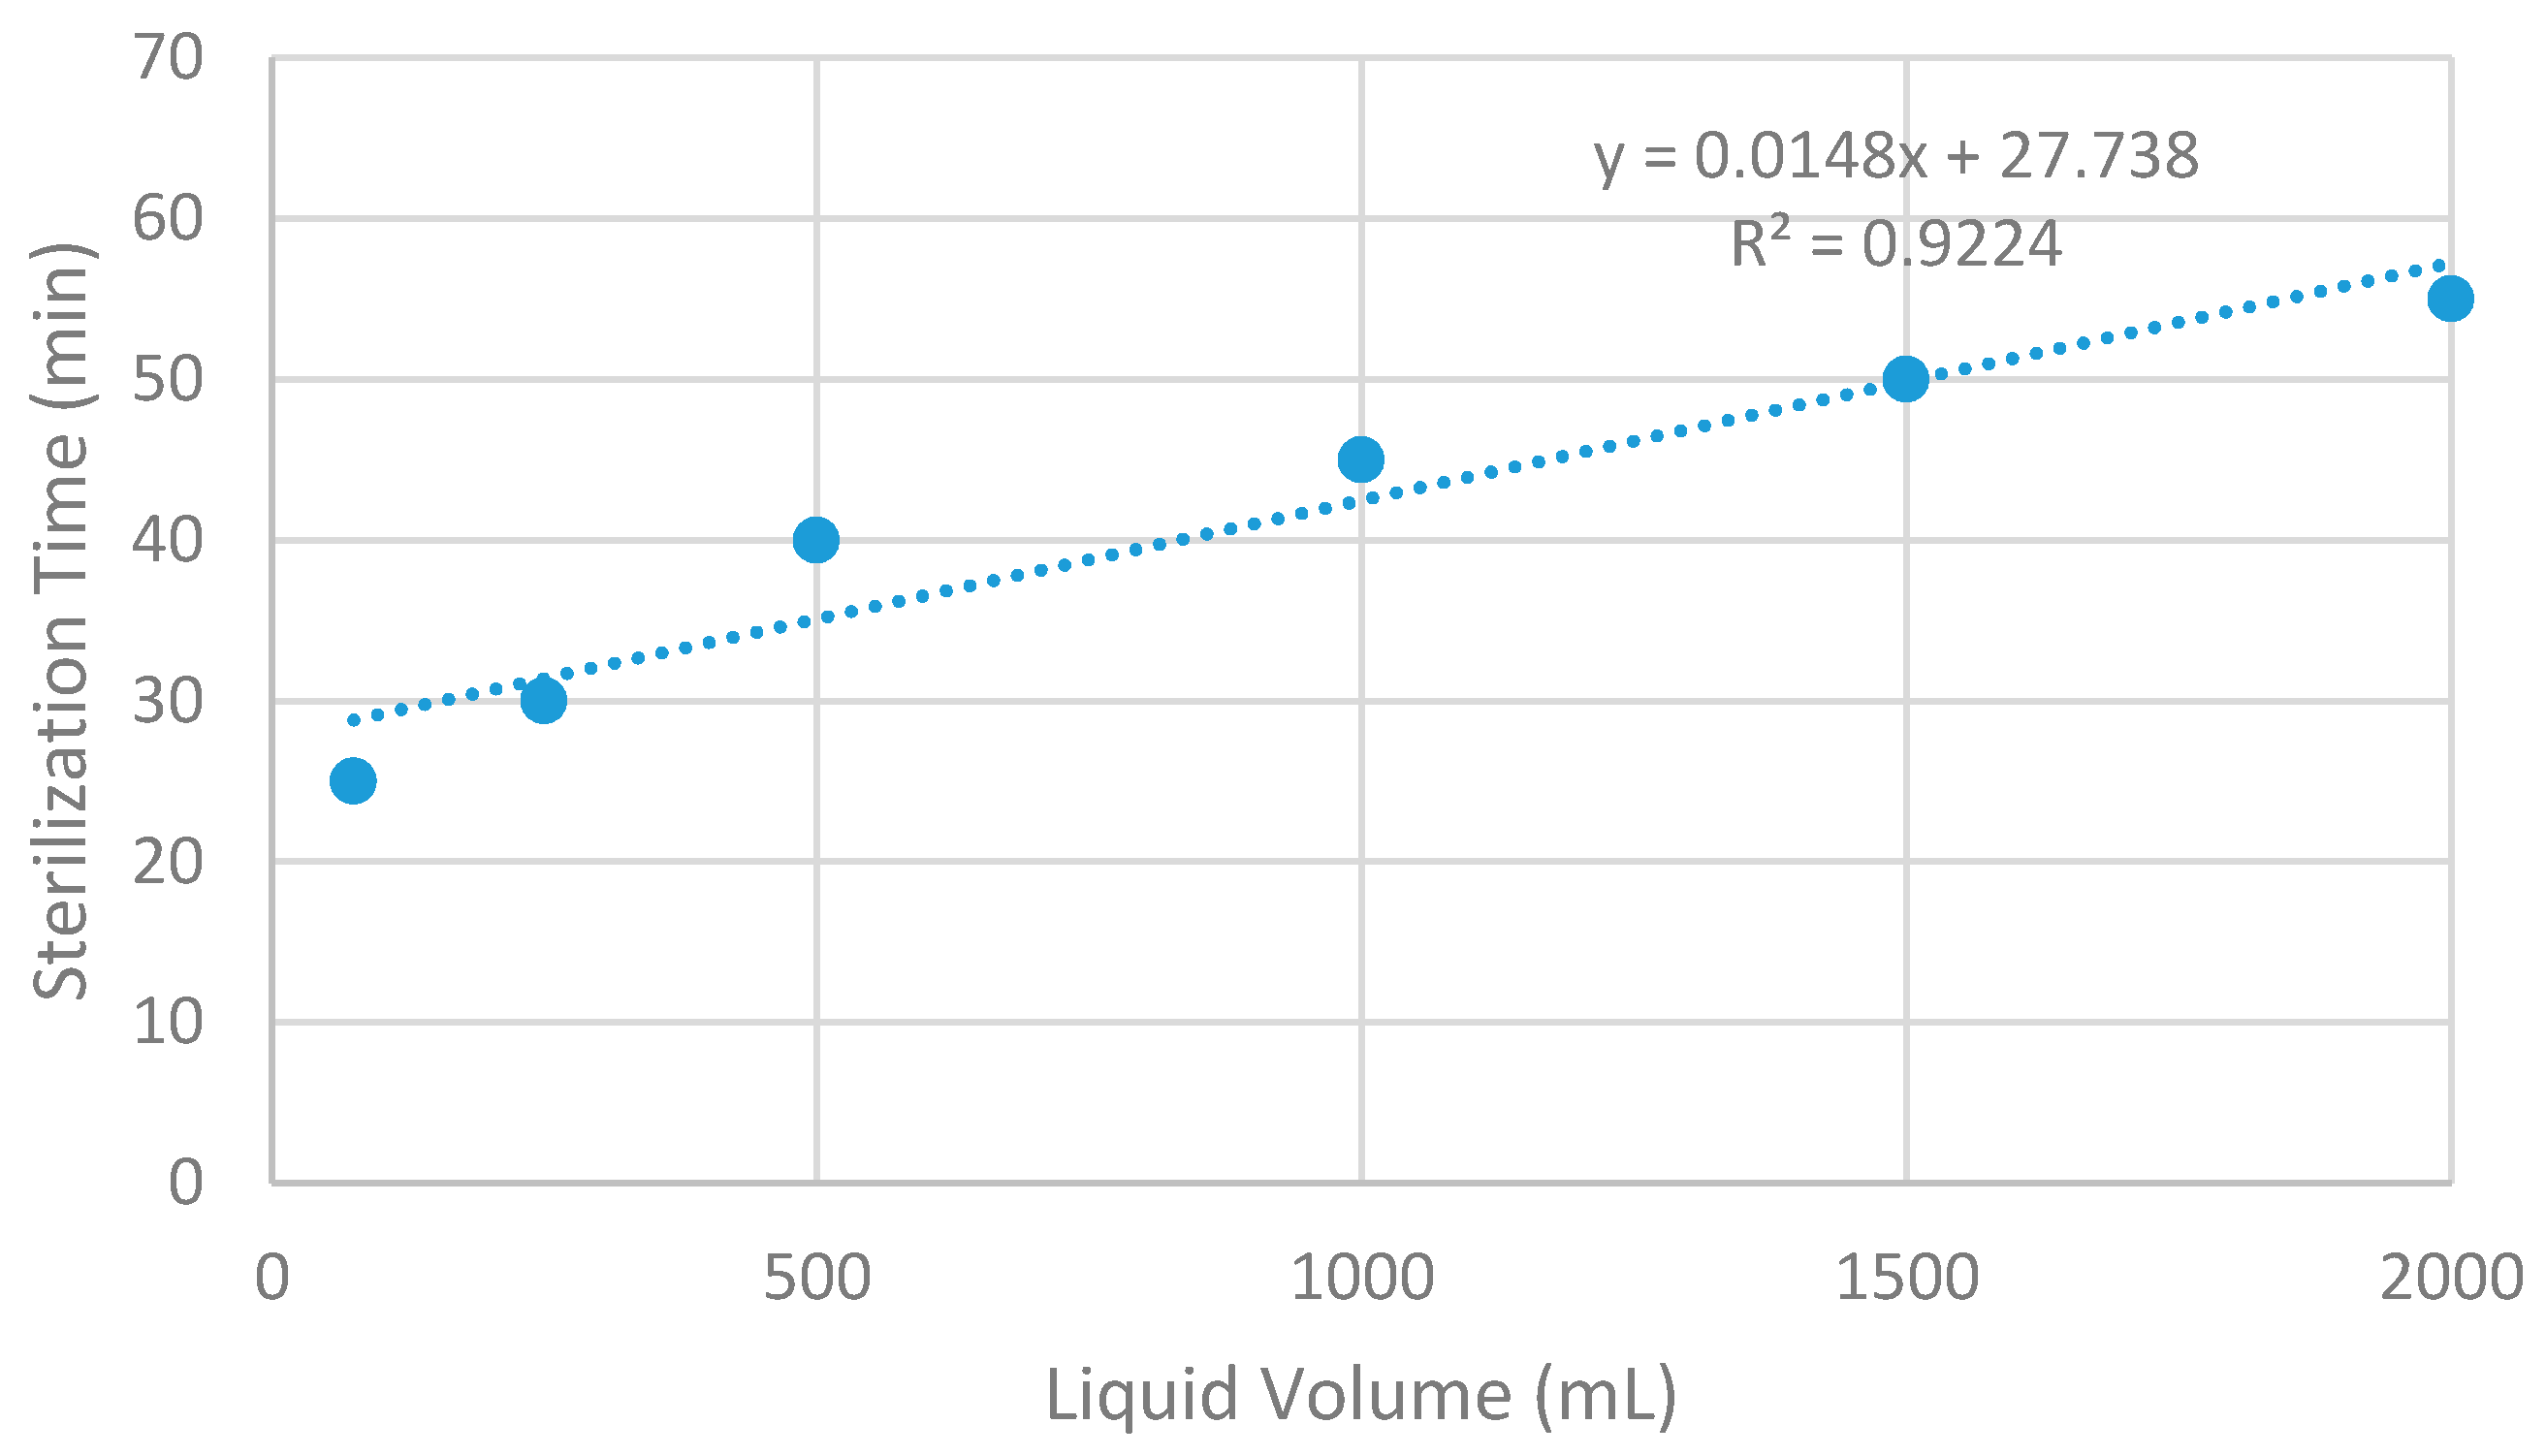
Based upon the data from the referenced manual [12], the regression shown in Figure 1 was developed and used to prescribe the minimum autoclaving time-period for sterilization; we rounded this time up to 90 min to be confident of solution sterilization. To verify that autoclave sterilization was effective in reducing microorganism populations, an adenosine triphosphate (ATP)-based monitoring system (novaLUM System manufactured by Charm Sciences, Lawrence, MA, USA) was utilized to determine the relative living cells in the solution via Relative Light Units (RLU). RLUs are a comparative measure of ATP present in a solution after cell lysing. A high RLU indicates that the solution contains a large amount of ATP, meaning it contains a large amount of living cells [13]. Verification data is reported in Section 3.
2.3. Experimental Protocol
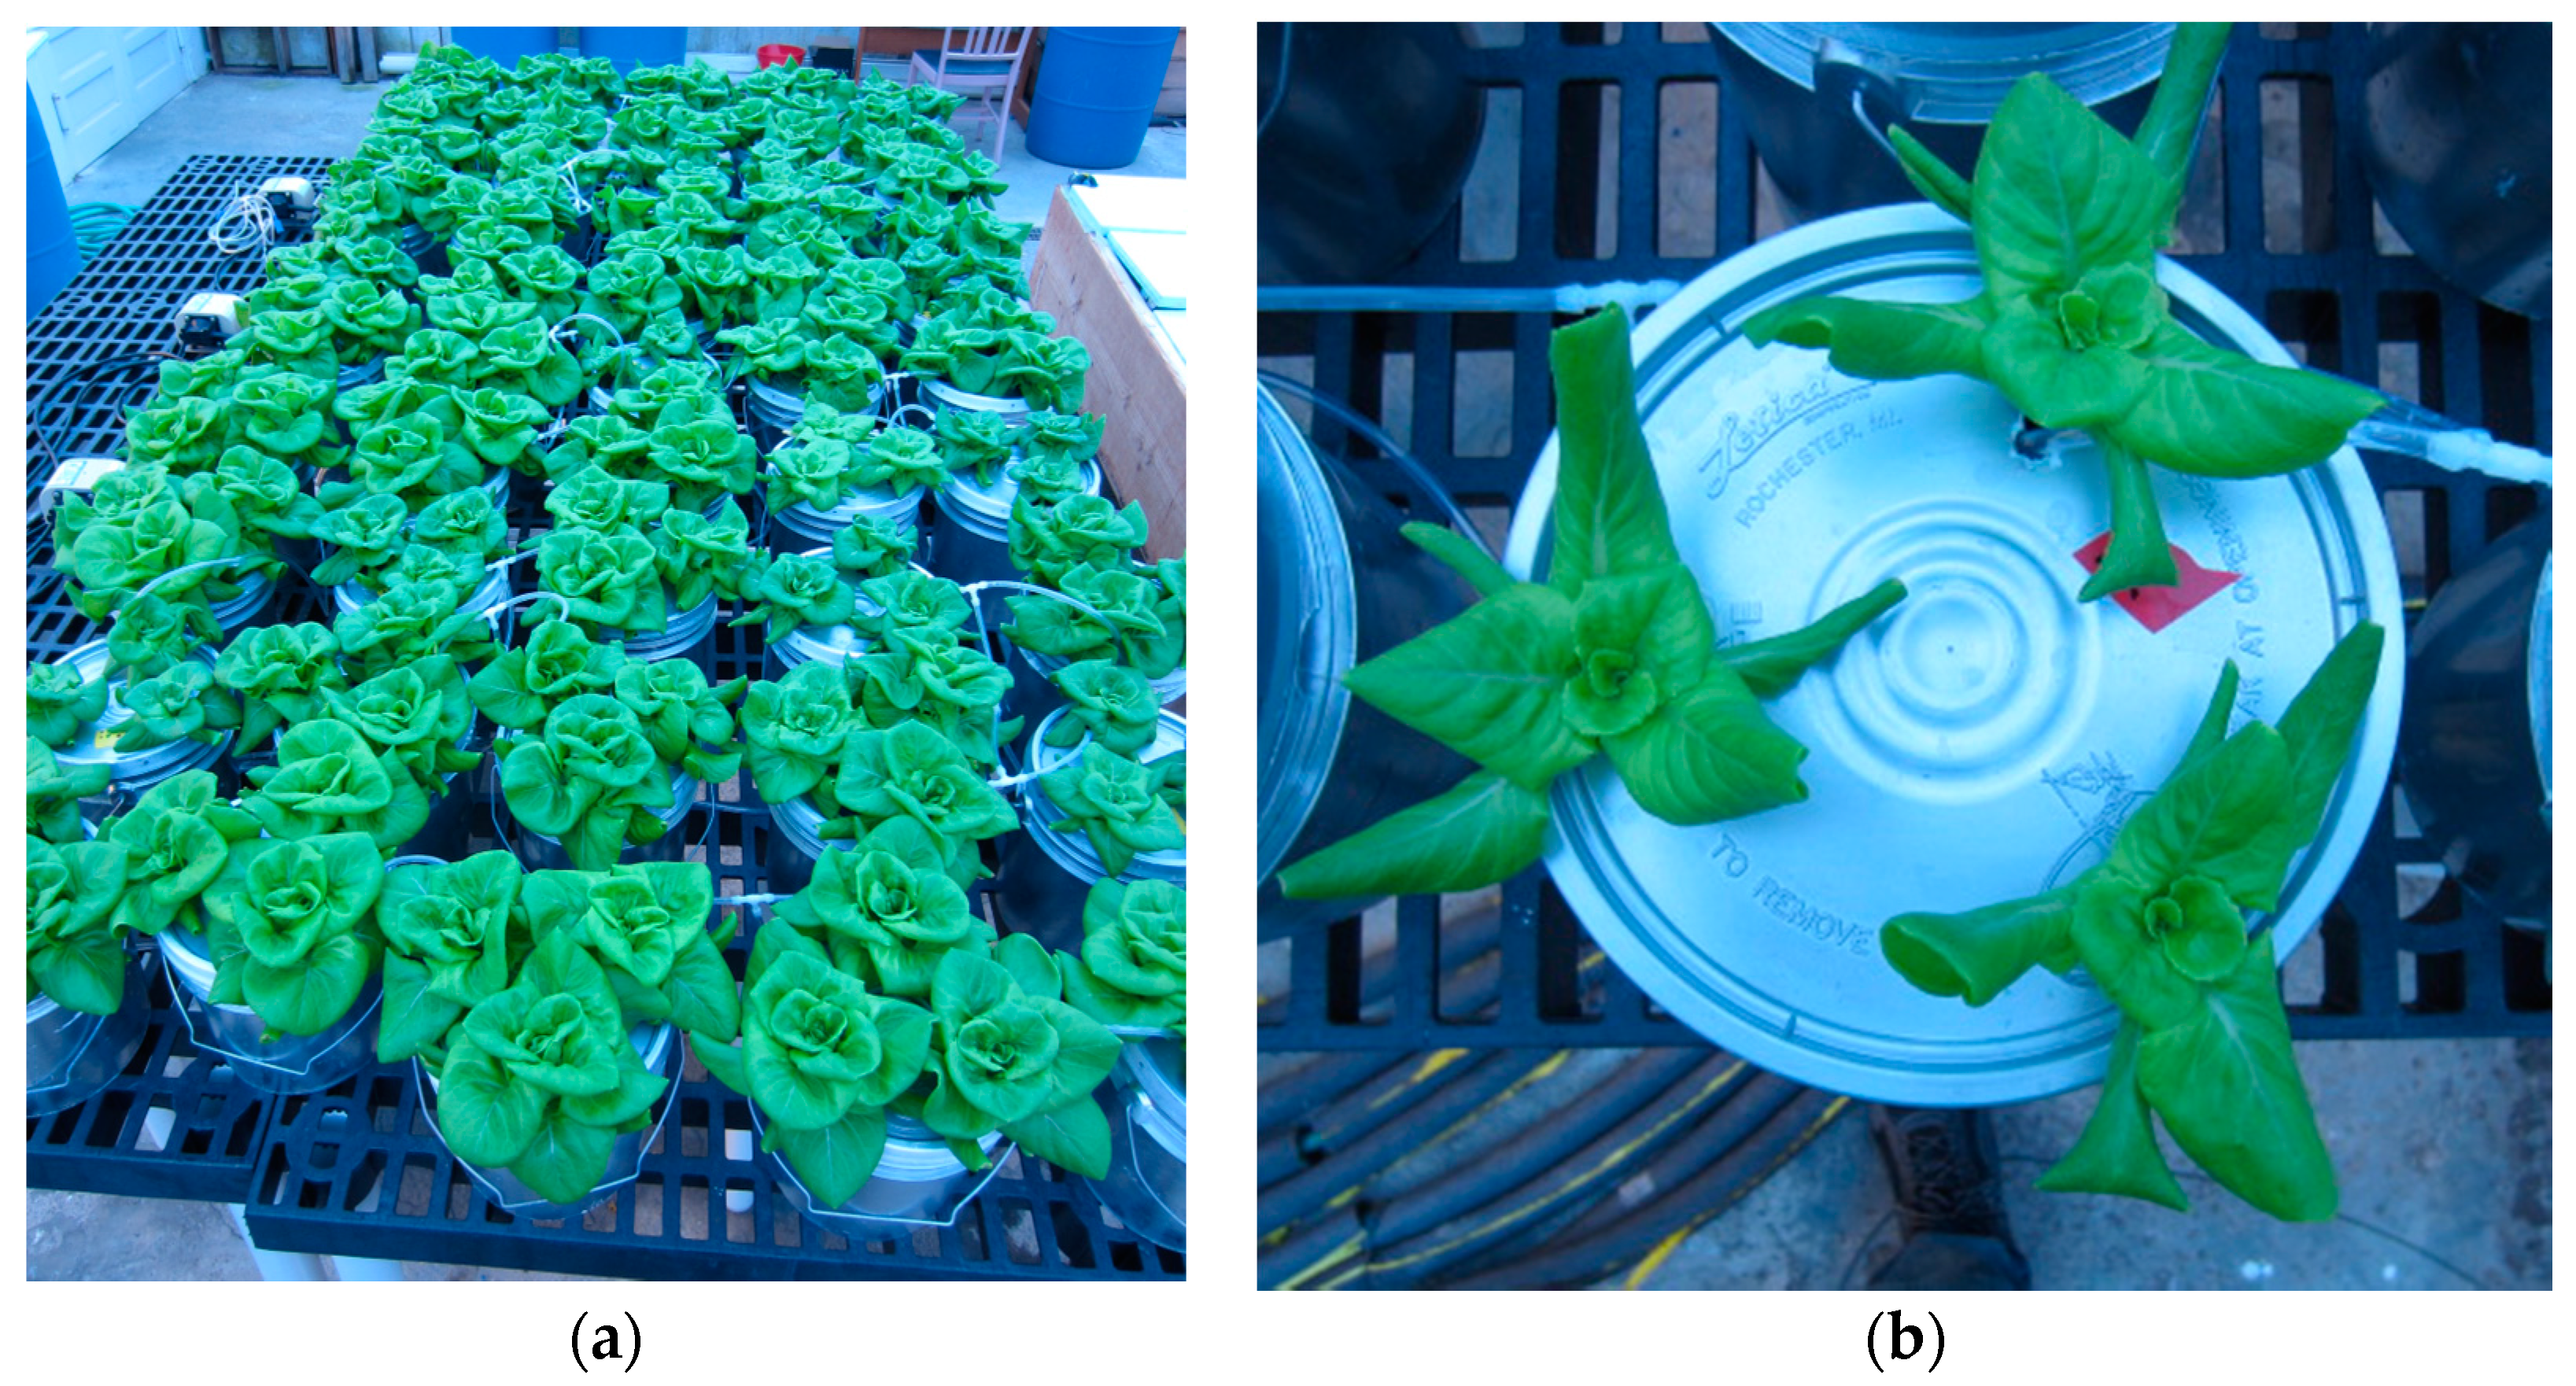
The bucket system consisted of 40 plastic buckets, each filled near to the brim with 4 L of one of the four treatments (Figure 2). Treatments and buckets were placed randomly within the growing area. Each bucket contained an air stone placed in the nutrient solution that constantly aerated the nutrient solution from common air pumps. Each bucket was covered with a 200-mm diameter lid containing three 25-mm diameter holes drilled equidistant from each other. Buckets and lids were painted silver to reduce chelation degradation and limit algal growth by preventing sunlight from reaching the nutrient solution.
Flats of rockwool (Grodan AO25/40, 25 mm; Grodan, Roermond, The Netherlands) were prepared by soaking them in RO water for 10–20 min and then flushing each flat with RO water for 5 min. Flats were then soaked for an additional 10–20 min using the ½ Sonneveld and Straver solution adjusted to a pH of 4.5 to 5.0, following which flats were flushed with 6 to 7 L of nutrient solution that had been adjusted to a pH of 5.8 (control pH for H5). We then did a final flushing using RO water for 7 min and considered the flats ready for seed placement.
Un-pelleted lettuce seeds (Lactuca sativa cv. Flandria) purchased from Rijk-Zwaan (De Lier, The Netherlands) were planted in the rockwool cubes 14 days prior to the desired transplant date and placed in the mentioned greenhouse space within the DLI maintained light array. The day of seeding is the reference date, day 1. Standard perforated 1020 trays of seeds in rockwool were covered with an opaque cover for the first 24 h, after which the cover was replaced with a clear germination cover. This cover was removed after the fourth day, leaving the seedlings exposed. Seedlings were placed in an ebb and flood bench that supplied nutrient solution at pH 5.8 four times a day (7 a.m., 11 a.m., 3 p.m., and 7 p.m.). Individual cubes were separated from the pre-cut rockwool slab and seedlings that were considered typical (not large, smaller, or abnormal) were then transplanted to the bucket system on Day 14. One cube was placed in each of the three lid holes. Roots were submerged in nutrient solution when the cubes were placed in the lids. New buckets were used in Trial 1 (cleaned and disinfected before use) and then cleaned thoroughly before reuse in Trial 2.
Once placed into the buckets, the nutrient solutions were emptied every two days (days 16, 18, 20, 22, 24, and 26) and replaced with fresh nutrient solution for each treatment. Plants were removed at day 27, compared to normal harvests occurring at day 35 (150 g plants). We harvested at the earlier date to minimize the changes occurring in natural day length and before the late stage exponential growth of the lettuce plant. Also, our experience was that we would see any effects of nutrient deficiencies or environmental variables well before plants reach a typical market size at day 35.
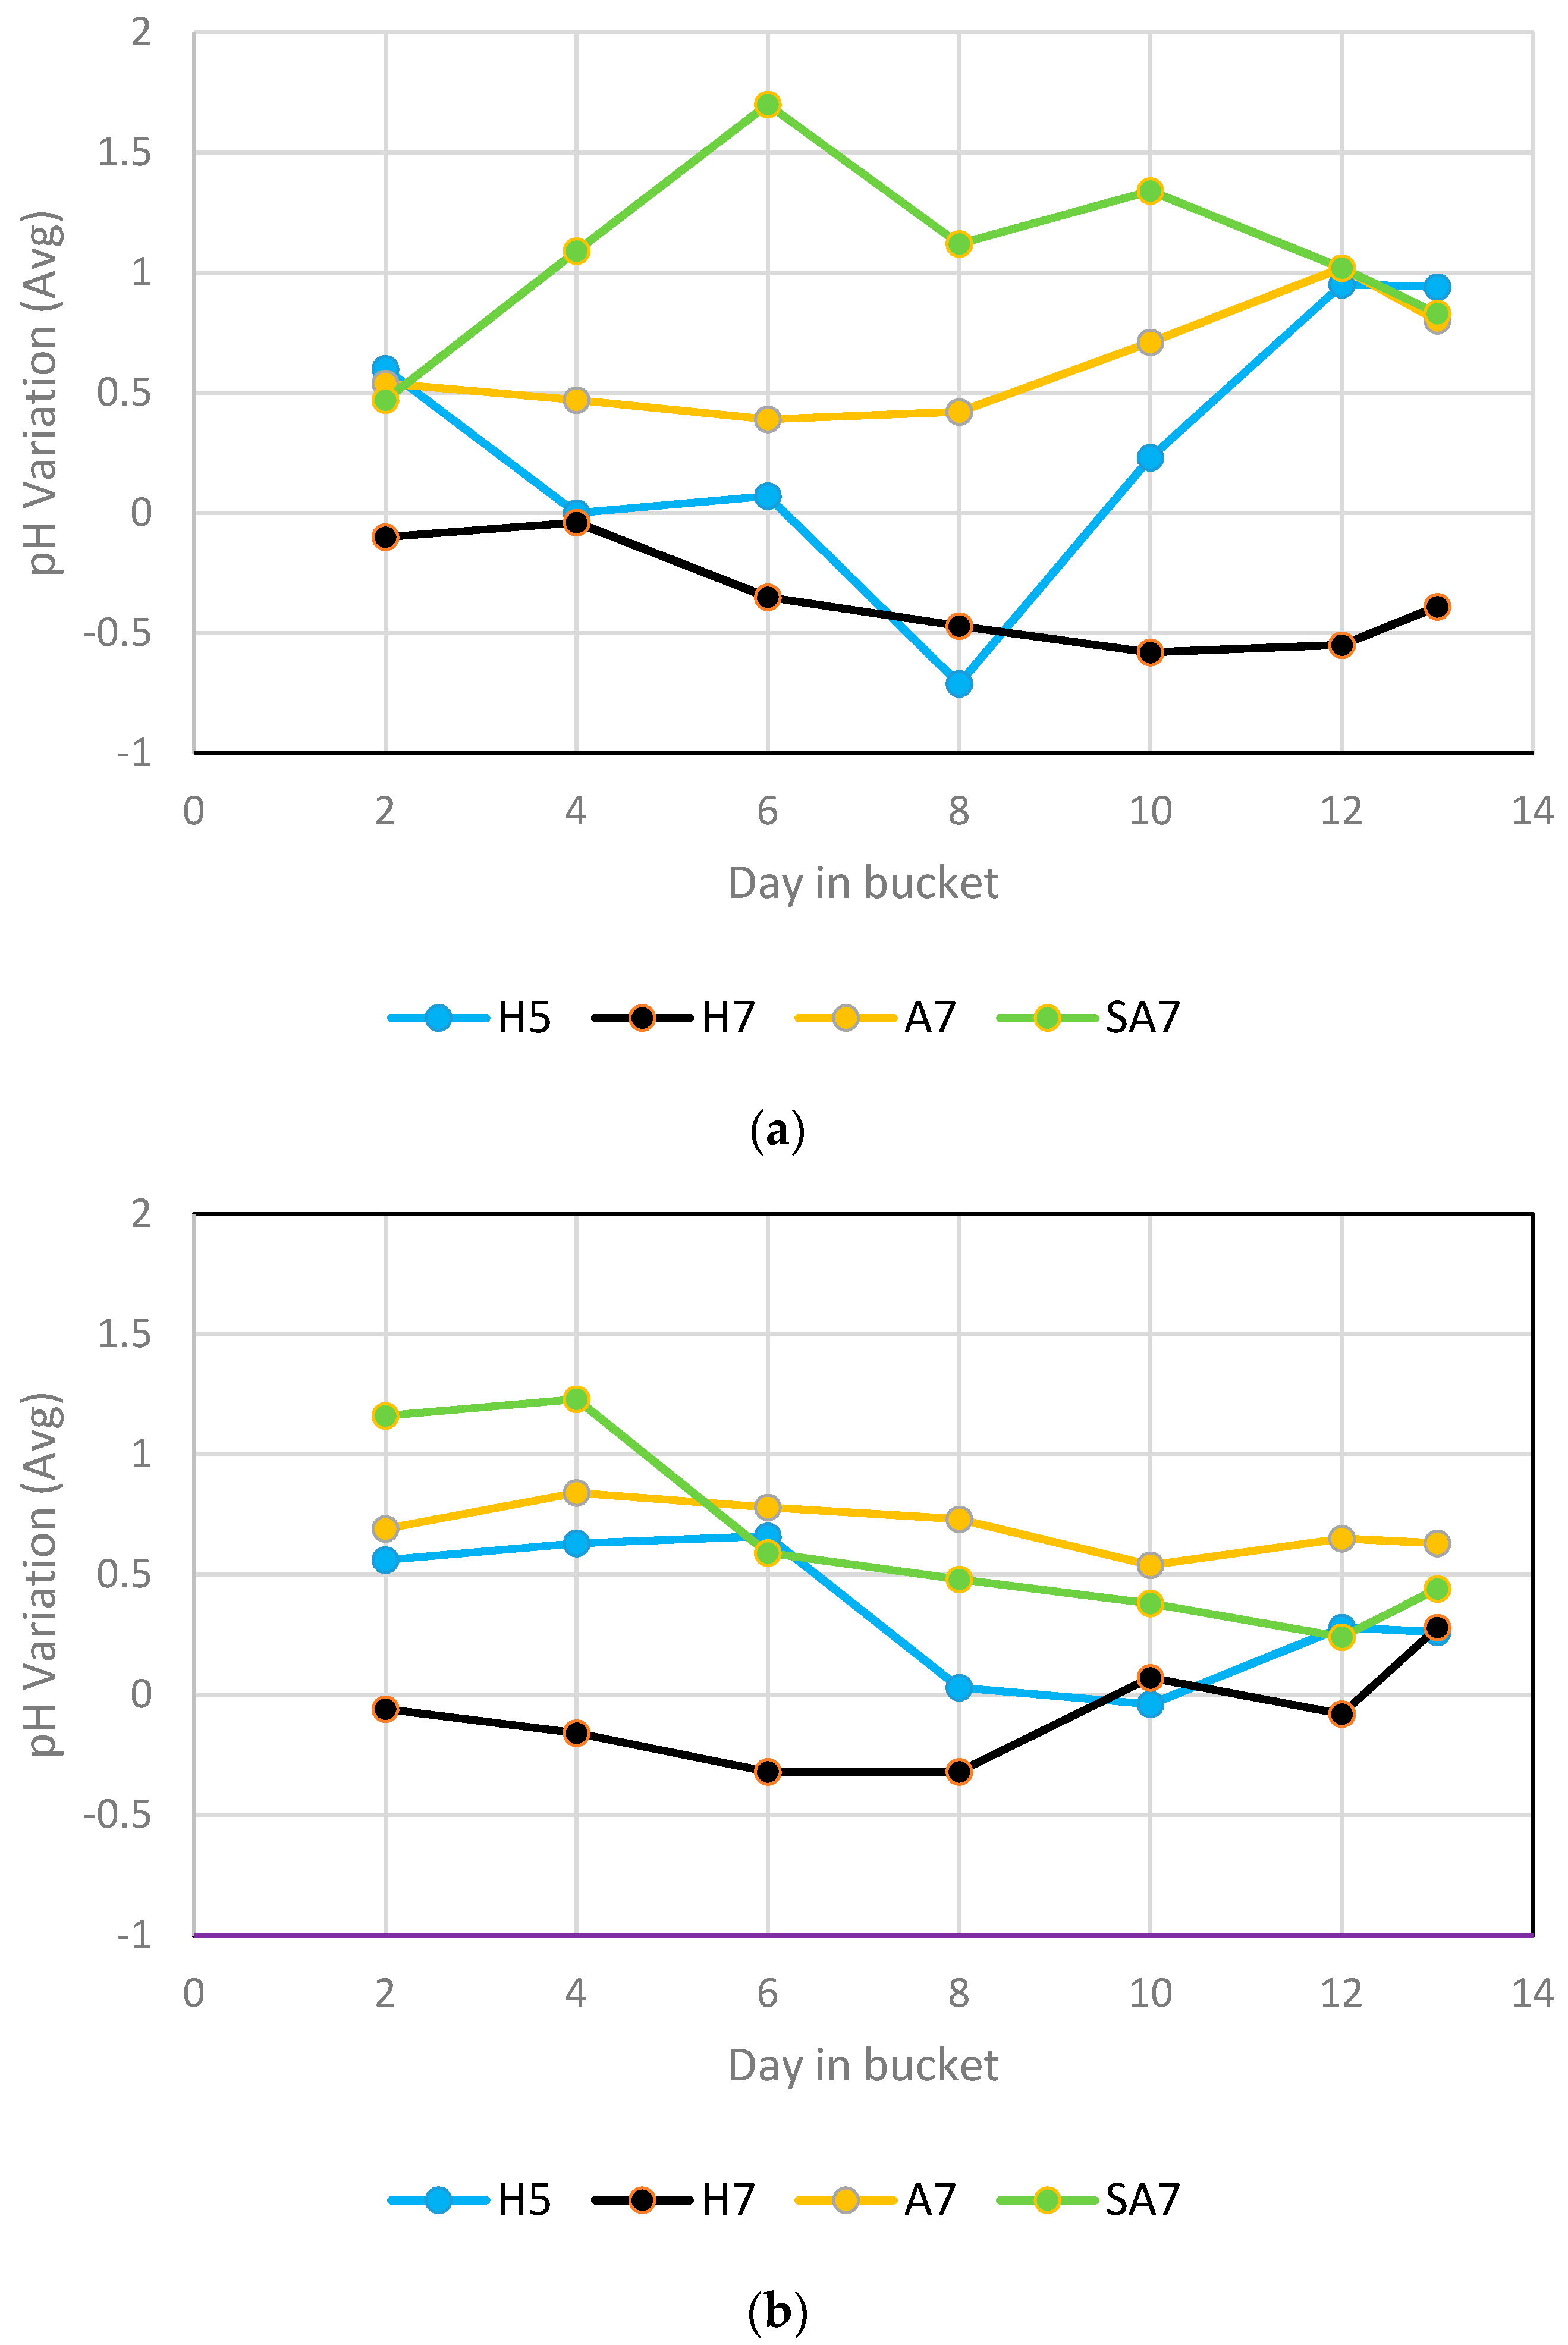
Frequent replacement of nutrient solution, in addition to the factors mentioned in the treatments in Section 2.2, were intended to maintain pH and nutrient availability at near target values. The pH variations of each solution immediately before replacing the nutrient solution with fresh replacement at the target pH value are shown in Figure 3.
2.4. Measurements
The pH, electrical conductivity (EC), and root zone temperature were measured prior to the addition of new nutrient solution to each bucket. All treatment pH values were adjusted to their target values (5.80 ± 0.02 for H5, 7.00 ± 0.02 for H7, A7, and SA7) before the addition of nutrient solutions to individual buckets. Old nutrient solution from each treatment was collected into a barrel and mixed thoroughly. After mixing, the pH, EC, and root zone temperature were measured and recorded for each of the treatments. Change in nutrient concentrations was not measured and was assumed to be minimal due to the small head size at harvest, circa 16% of a commercial head target size of 150 g.
Nutrient solution data were recorded for the final time on day 27. Shoots were cut level with the rockwool cube and individual fresh weights were measured and recorded. Each shoot was individually bagged and placed in a 70 °C drying oven for approximately 72 h. After this time-period, each shoot’s dry weight was measured and recorded, from which the dry weight (DW) to fresh weight (FW) ratio (DW/FW) or dry matter percentage was determined.
2.5. Statistical Analysis
Mixed effect models using least squares analyses were conducted using JMP Pro software (version JMP PRO 11; JMP a Division of SAS, Cary, NC, USA). Shoot (FW, DW, and DW/FW) data were treated as response variables, treatment and trial were treated as fixed effects, and plant number nested within buckets was treated as a random effect to account for the three plants per bucket. Pairwise comparisons between treatments were made using Tukey’s honest significant difference (HSD) at an alpha value of 0.05.
3. Results
3.1. Sterilization Verification
As shown in Table 3, RLU values from non-sterilized A7 solutions (aquaponic water at pH 7.0) were approximately 300 times higher than values from sterilized aquaponic water (SA7) solution, indicating that sterilization killed the vast majority of microorganisms. Also, the RLU values for the two hydroponic conditions H5 and H7 (combined as a single water source) were about five times the values measured in the autoclaved SA7 solution water, indicating active bacterial action in the hydroponic solutions but not nearly as much as the aquaponic solution (A7). This is strong evidence that we were successful in killing most of the living organisms in the autoclaved treatment water. In this testing procedure, we combined H5 and H7 since they were identical except for pH variation, which would not significantly alter the presence or absence of microorganisms.
Standard operating procedures for this instrument state that an RLU reading less than 1000 indicates sterilization [13]. These guidelines are for laboratory animal cages, which would have ATP from lysed cells wiped away as part of cleaning procedures. Water for SA7 contained the remnants of killed microorganisms, including ATP. Therefore, even though the RLU reading is higher than the recommended level to indicate sterilization, there is no reason to believe that SA7 was not sterilized effectively. Further, we regard the five-fold difference between SA7 and H5 and H7 and the 300-fold difference between A7 and SA7 water to be a clear indicator of dramatic reductions in bacterial activity in the SA7 water, which is the major variable of interest in this research paper.
3.2. Lettuce Response to Treatment
Biomass responses for shoot fresh weight (FW), dry weight (DW), and DW/FW ratio are tabulated for Trials 1 and 2 and as a combined dataset in Table 4. Table 5 shows the least squares mean analysis (LSM) results of the combined Trials 1 and 2 datasets. Trial effect was significant, with the largest variation between trials occurring for the non-sterilized aquaponic condition (A7). Trial effect was accounted for in the LSM analysis.
4. Discussion
The nutrient solution used for the aquaponic conditions (A7 and SA7) was a less well-balanced nutrient solution than the two hydroponic solutions H5 or H7. A7 was different (larger) than H7 in both FW and DW, but was different (smaller) for both FW and DW compared to H5 (Table 5). Surprisingly, SA7 was not different from A7 for FW and DW, but was different (lower) for the DW/FW ratio. Previous results [7] showed A7 FW and DW to be greater than those of H7, but A7 and H5 did not differ in that study. There were many differences in the experimental setup and protocols, including harvest size, which we did not evaluate. Importantly, the sterilized aquaponic treatment (SA7) was not different from H5, considered the optimum nutrient solution, in both FW and DW comparisons, while the A7 treatment was. We can conclude that there was some advantage to the sterilization of the aquaponic treatment water.
The higher DW/FW ratio for A7 compared to SA7 was also consistent with H7’s DW/FW ratio being higher than H5, which is reflective of the water treatment condition being a more stressful environment for growth in A7 and H7 compared to the other two conditions. We have previously reported that DW/FW was higher for H7 than A7 or H5 [7], which suggests that when the plant is nutritionally or environmentally stressed, DW/FW ratios may be affected.
The data clearly indicated that there was a net positive effect gained from sterilizing the aquaponic water prior to transferring to the plants which may have contributed some benefits. Results suggest that the primary beneficial effects from the living microbes in the RAS was created while the water was recirculated in the fish RAS and was retained even after the living microbes were killed by sterilization. It is possible that the much larger bacterial community in A7 could have compromised plant nutrient availability by consuming nutrients or by increasing the energetic cost to import nutrients across the root interface. Ling and Chen [14] showed that increased organic loading on autotrophic biological filters reduced nitrification rates exponentially as the C/N ratio increased from 0 to 2, which would support our observation that increased bacterial loading on the roots compromised plant growth rates.
Trial effects were shown in Table 4 and expressed in Table 6 as a ratio of Trial 2 to their corresponding values from Trial 1. Fresh weight was always larger in Trial 2; dry weight was generally larger in Trial 2, although not as much as fresh weight was; and the DW/FW ratio was always lower in Trial 2. This indicates that while the lettuce grew larger in Trial 2, most of this mass was due to an increased uptake of water. Note also that the ratios for the different response variables were much larger for the A7 treatment than the other treatments. This observation also supports our hypothesis that it was the large living microbial community transferred into the A7 treatment that caused the reduction in FW and DW compared to H5 and SA7, but A7 was still able to produce more FW and DW biomass than H7 treatment. While light was maintained at 17 mol/m2·day (combined natural and supplemental), Trial 2 occurred later in the season and therefore received a larger portion of its light integral from natural light. As previously described, day length only increased by roughly an hour over the course of the two trials and we do not believe that this would explain the larger shoots in Trial 2. While it is unlikely that the autoclave sterilization of the fish nutrient water significantly altered the nutrient composition and compounds present, it is a possibility. Replicates of this experiment would benefit from separate sterilized control treatments that are created in the same manner as the sterilized aquaculture solution, i.e., SH5 and SH7 treatments.
In similar research by our group [7], we conducted extensive trials growing lettuce to 150 g under treatment conditions represented by three of the same conditions as those used in the research reported herein (H5, H7, and A7), but with no sterilized treatment of A7. Supporting the results reported here, we saw a 26% reduction in fresh weight when comparing H7 to H5 and no significant difference between H5 and A7 [7]. In that previous research, we had hypothesized that the enhanced performance of the A7 treatment (we expected the pH 7.0 condition in A7 to have a negative effect from the higher pH compared to the control pH of 5.8 with H5) was due to the living biotic factors in the water. However, the research presented here refutes that concept, indicating that other factors affected the nutrient availability in hydroponic lettuce culture than the live biotic community present in the root zone. Microbiota in the biofilters of aquaponic systems are poorly understood, and this research did not attempt to investigate them. Our research does indicate that while microbiota in the root zone supplied directly from the RAS are unimportant to the growth of the plant, microbial communities in the biofilter cause currently unknown biochemical processes on the RAS water that likely result in the RAS water providing increased growth to the plants. Natural chelators, cofactors, enzymes, hormones, differing forms of nutrients, mycorrhizal communities, and more are possibilities for further research into possible causal agents. We do know that humic acids, a byproduct of organic decomposition such as that occurring regularly in our aquaculture system, has been shown to increase root size, permeability, and uptake of micronutrients, as well as stimulate growth beyond mineral-only nutrients [11,15].
5. Conclusions
Lettuce plants grown in sterilized aquaponic water (SA7) produced similar FW and DW to those in ideal hydroponic conditions at pH 5.8 (H5), while plants in non-sterile aquaponic water (A7) had reduced FW and DW. This strongly suggests that the positive contribution of the living microbes in the RAS had already occurred prior to the RAS water being removed and then sterilized for the SA7 treatment. Since the only difference between these two aquaponic treatments was the 50 times higher microbial community in the A7 nutrient water, a conjecture is that root zone competition for nutrients between plant and bacteria or thicker bacterial biofilms on the A7 roots affected nutrient transport phenomena. Further research and water quality analysis of the differences between the fish water and the inorganic nutrient solutions is warranted in order to determine any unidentified growth factors that can be attributed to having caused the growth advantages provided by SA7 compared to A7. An interesting implication of our findings is that a RAS can be decoupled from the hydroponic growing system, since its benefits are not dependent upon continuous recirculation between the plant and fish system and its living biotic community.
Acknowledgments
This research was supported entirely by the Cornell University Agricultural Experiment Station federal formula funds, Project No. 1237650 and NYC-123421 received from Cooperative State Research, Education, and Extension Service, U.S. Department of Agriculture. Any opinions, findings, conclusions, or recommendations expressed in this publication are those of the author(s) and do not necessarily reflect the view of the U.S. Department of Agriculture. We would like to thank Francoise Vermeylen and Kevin Packard from the Cornell Statistical Consulting Unit for their assistance and guidance in the statistical models and analysis and to Jonathan Allred who assisted in the JMP analysis on the normalized data. Also, particular appreciation is expressed to the academic reviewers who assisted in the interpretation and understanding of the data by the authors. This work was performed under an Animal Use Protocol approved by the Institutional Animal Care and Use Committee (IACUC) of Cornell University.
Author Contributions
Zachary J. Wielgosz, Tyler S. Anderson, and Michael B. Timmons conceived and designed the experiments; Zachary J. Wielgosz performed the experiments; Zachary J. Wielgosz, Tyler S. Anderson, and Michael B. Timmons analyzed the data; Zachary J. Wielgosz wrote the paper with significant contributions from Tyler S. Anderson and Michael B. Timmons.
Conflicts of Interest
The authors declare no conflict of interest. The founding sponsors had no role in the design of the study; in the collection, analyses, or interpretation of data; in the writing of the manuscript, and in the decision to publish the results.
References
- Pantanella, E.; Cardarelli, M.; Colla, G.; Rea, E.; Marcucci, A. Aquaponics vs. Hydroponics: Production and Quality of Lettuce Crop. In Proceedings of the XXVIII International Horticultural Congress on Science and Horticulture for People (IHC 2010): International Symposium on Greenhouse 2010 and Soilless Cultivation, Lisbon, Portugal, 22–27 August 2010; Castilla, N., Ed.; International Society for Horticultural Science: Leuven, Belgium, 2012; pp. 887–893. [Google Scholar]
- Timmons, M.; Ebeling, J. Recirculating Aquaculture, 3rd ed.; Ithaca Publishing Company LLC: Ithaca, NY, USA, 2013. [Google Scholar]
- Rakocy, J.E.; Shultz, R.C.; Bailey, D.S.; Thoman, E.S. Aquaponic Production of Tilapia and Basil: Comparing a Batch and Staggered Cropping System. In Proceedings of the South Pacific Soilless Culture Conference, Palmerston North, New Zealand, 10–13 February 2003; Nichols, M.A., Ed.; International Society for Horticultural Science: Leuven, Belgium, 2004; pp. 63–69. [Google Scholar]
- Goddek, S.; Schmautz, Z.; Scott, B.; Delaide, B.; Keesman, K.J.; Wuertz, S.; Junge, R. The effect of anaerobic and aerobic fish sludge supernatant on hydroponic lettuce. Agronomy 2016, 6, 37. [Google Scholar] [CrossRef]
- Rakocy, J.E. Aquaponics—Integrating Fish and Plant Culture; Oklahoma Cooperative Extension Service: Stillwater, MN, USA, 2012. [Google Scholar]
- Tokuyama, T.; Mine, A.; Kamiyama, K.; Yabe, R.; Satoh, K.; Matsumoto, H.; Takahashi, R.; Itonaga, K. Nitrosomonas communis strain YNSRA, an ammonia-oxidizing bacterium, isolated from the reed rhizoplane in an aquaponics plant. J. Biosci. Bioeng. 2004, 98, 309–312. [Google Scholar] [CrossRef]
- Anderson, T.S.; de Villiers, D.; Timmons, M.B. Growth and tissue elemental composition response of butterhead lettuce (Lactuca sativa, cv. Flandria) to Hydroponic and Aquaponic Conditions. Horticulturae 2017, 3, 43. [Google Scholar] [CrossRef]
- Sonneveld, C.; Straver, N. Nutrient solutions for vegetables and flowers grown in water of substrates. In Series: Voedingsoplossingen Glastuinbouw; Proefstation voor Tuinbouw onder Glas te Naaldwijk: Naaldwijk, The Netherlands, 1994; Volume 8, pp. 1–45. [Google Scholar]
- Anderson, T.S.; Martini, M.; de Villiers, D.; Timmons, M.B. Growth and tissue elemental composition response of Butterhead lettuce (Lactuca sativa, cv. Flandria) to hydroponic conditions at different pH and alkalinity. Horticulturae 2017, 3, 41. [Google Scholar] [CrossRef]
- Vandam, D.; Anderson, T.S.; de Villiers, D.; Timmons, M.B. Growth and tissue elemental composition response of spinach (Spinacia oleracea) to hydroponic and aquaponic water quality conditions. Horticulturae 2017, 3, 32. [Google Scholar] [CrossRef]
- Canellas, L.P.; Olivares, F.L. Physiological responses to humic substances as plant growth promoter. Chem. Biol. Technol. Agric. 2014, 1, 3. [Google Scholar] [CrossRef]
- Consolidated Sterilizer Systems. The Definitive Guide to Steam Sterilization Cycles; Consolidated Sterilizer Systems: Boston, MA, USA; p. 10. Available online: https://consteril.com/steam-sterilization-cycles-guide/ (accessed on 7 August 2017).
- Turner, D.E.; Daugherity, E.K.; Altier, C.; Maurer, K.J. Efficacy and limitations of an ATP-based monitoring system. J. Am. Assoc. Lab. Anim. Sci. 2010, 49, 190–195. [Google Scholar] [PubMed]
- Ling, J.; Chen, S. Impact of organic carbon on nitrification performance of different biofilters. Aquac. Eng. 2005, 33, 150–162. [Google Scholar] [CrossRef]
- Chen, Y.; Aviad, T. Effects of humic substances on plant growth 1. In Humic Substances in Soil and Crop Sciences; MacCarthy, P., Clapp, C.E., Malcolm, R.L., Bloom, P.R., Eds.; Selected Readings, SSSA: Madison, WI, USA, 1990; pp. 161–186. [Google Scholar]
Figure 1.
Required sterilization time as affected by liquid volume using an autoclave at 121 °C and 1.0 atmospheres (15 psi gage) pressure (data from Reference [12]).
Figure 1.
Required sterilization time as affected by liquid volume using an autoclave at 121 °C and 1.0 atmospheres (15 psi gage) pressure (data from Reference [12]).

Figure 2.
The experimental bucket system, showing: (a) the entire system; (b) an individual bucket.

Figure 3.
Magnitude of difference in pH value of nutrient solution between its addition to the bucket system and its replacement two days later. A positive y-value indicates an increase in pH while in the bucket system. ‘Day in bucket’ represents time in bucket after transplanting at day 14. (a) pH variation for Trial 1; (b) pH variation for Trial 2.


Table 1.
Tabulation of the four treatments tested.
| Treatment | Description |
|---|---|
| H5 | ½ Sonneveld nutrient solution at pH 5.8 (control treatment) |
| H7 | ½ Sonneveld nutrient solution at pH 7.0 |
| A7 | Untreated aquaponic water at pH 7.0 |
| SA7 | Sterilized aquaponic water at pH 7.0 |
Table 2.
Nutrient solutions for treatments employed (SA7 same as A7) expressed in mg/L. Differing superscript letters within response variables identify that significant differences occur between values (p-level = 0.05), from Reference [10].
Table 2.
Nutrient solutions for treatments employed (SA7 same as A7) expressed in mg/L. Differing superscript letters within response variables identify that significant differences occur between values (p-level = 0.05), from Reference [10].
| Element (mg/L) | A7 | H5 | H7 |
|---|---|---|---|
| Macronutrients | |||
| K | 214 | 216 | 219 |
| Ca | 87.6 a | 93.8 b | 94.0 b |
| Mg | 22.6 c | 12.8 a | 13.1 a |
| S | 21.0 | 19.3 | 19.6 |
| Na | 19.34 c | 4.73 a | 5.59 a |
| P | 12.4 | 30.5 | 31.1 |
| NO3-N | 135.1 | 149.7 | 154.7 |
| TAN | 1.1 | 8.9 | 9.5 |
| Micronutrients | |||
| Fe | 2.891 c | 0.868 a | 0.870 a |
| Sr | 0.552 | 0.586 | 0.590 |
| Zn | 0.517 b | 0.182 a | 0.184 a |
| Cu | 0.045 | 0.050 | 0.050 |
| Co | 0.003 b | 0.001 a | 0.001 a |
| Mn | 0.033 a | 0.162 c | 0.157 c |
| Mo | 0.002 | 0.025 | 0.026 |
| Other elements | |||
| Al | 0.100 | 0.090 | 0.090 |
| Ba | 0.018 | 0.016 | 0.011 |
| As | 0.010 | 0.006 | 0.006 |
| Pb | 0.010 c | 0.000 a | 0.000 a |
| Cd | 0.004 | 0.003 | 0.003 |
| V | 0.0029 | 0.0025 | 0.0025 |
Table 3.
Measure of ATP in solution as indicated by Relative Light Units (RLU).
| Treatment | Relative Light Units |
|---|---|
| H5, H7 | 47,093 |
| A7 | 2,537,609 |
| SA7 | 8484 |
Table 4.
Summary data for shoot fresh and dry weights (g) and for dry weight to fresh weight ratio (DW/FW), separated by treatment and trial. For the last three columns, values to the left are mean values, while values in parentheses are standard deviations.
Table 4.
Summary data for shoot fresh and dry weights (g) and for dry weight to fresh weight ratio (DW/FW), separated by treatment and trial. For the last three columns, values to the left are mean values, while values in parentheses are standard deviations.
| Trial | Treatment | n | Fresh Weight (g) | Dry Weight (g) | DW/FW |
|---|---|---|---|---|---|
| 1 | H5 | 30 | 24.9 (3.71) | 1.61 (0.192) | 0.065 (0.004) |
| 1 | H7 | 30 | 13.6 (2.43) | 1.06 (0.140) | 0.079 (0.009) |
| 1 | A7 | 30 | 14.1 (4.52) | 1.04 (0.260) | 0.077 (0.013) |
| 1 | SA7 | 30 | 22.5 (2.99) | 1.40 (0.151) | 0.063 (0.003) |
| 2 | H5 | 30 | 34.6 (6.53) | 1.74 (0.310) | 0.051 (0.002) |
| 2 | H7 | 30 | 15.2 (5.03) | 1.00 (0.254) | 0.068 (0.008) |
| 2 | A7 | 30 | 33.5 (6.41) | 1.67 (0.273) | 0.050 (0.003) |
| 2 | SA7 | 30 | 31.8 (9.11) | 1.62 (0.426) | 0.052 (0.004) |
| Combined | H5 | 60 | 29.8 (7.19) | 1.68 (0.264) | 0.058 (0.008) |
| Combined | H7 | 60 | 14.4 (4.01) | 1.03 (0.206) | 0.073 (0.010) |
| Combined | A7 | 60 | 23.8 (11.2) | 1.35 (0.414) | 0.064 (0.017) |
| Combined | SA7 | 60 | 27.2 (8.18) | 1.51 (0.336) | 0.057 (0.007) |
Table 5.
Least squares mean analysis (LSM) of the combined data from both trials. Levels not connected by the same letter are statistically different by Tukey’s honest significant difference (HSD) (alpha value = 0.05).
Table 5.
Least squares mean analysis (LSM) of the combined data from both trials. Levels not connected by the same letter are statistically different by Tukey’s honest significant difference (HSD) (alpha value = 0.05).
| Treatment | Fresh Weight (g) | Dry Weight (g) | Fraction Dry |
|---|---|---|---|
| H5 | 29.76 a | 1.676 a | 0.0577 c |
| H7 | 14.38 c | 1.031 c | 0.0734 a |
| A7 | 23.77 b | 1.354 b | 0.0637 b |
| SA7 | 27.16 a,b | 1.514 a,b | 0.0571 c |
Table 6.
Ratio between trials of fresh and dry shoot weights. Ratios were obtained by dividing values for Trial 2 by their corresponding values from Trial 1.
Table 6.
Ratio between trials of fresh and dry shoot weights. Ratios were obtained by dividing values for Trial 2 by their corresponding values from Trial 1.
| Treatment | Fresh Weight Ratio | Dry Weight Ratio | Dry to Fresh Ratio |
|---|---|---|---|
| H5 | 1.39 | 1.08 | 0.78 |
| H7 | 1.12 | 0.94 | 0.85 |
| A7 | 2.38 | 1.61 | 0.65 |
| SA7 | 1.41 | 1.16 | 0.83 |
© 2017 by the authors. Licensee MDPI, Basel, Switzerland. This article is an open access article distributed under the terms and conditions of the Creative Commons Attribution (CC BY) license (http://creativecommons.org/licenses/by/4.0/).
Share and Cite
MDPI and ACS Style
Wielgosz, Z.J.; Anderson, T.S.; Timmons, M.B. Microbial Effects on the Production of Aquaponically Grown Lettuce. Horticulturae 2017, 3, 46. https://doi.org/10.3390/horticulturae3030046
AMA Style
Wielgosz ZJ, Anderson TS, Timmons MB. Microbial Effects on the Production of Aquaponically Grown Lettuce. Horticulturae. 2017; 3(3):46. https://doi.org/10.3390/horticulturae3030046
Chicago/Turabian StyleWielgosz, Zachary J., Tyler S. Anderson, and Michael B. Timmons. 2017. "Microbial Effects on the Production of Aquaponically Grown Lettuce" Horticulturae 3, no. 3: 46. https://doi.org/10.3390/horticulturae3030046
Note that from the first issue of 2016, this journal uses article numbers instead of page numbers. See further details here.