
Response of Eustoma Leaf Phenotype and Photosynthetic Performance to LED Light Quality


1
The United Graduate School of Agricultural Sciences, Ehime University, 3-5-7 Tarumi, Matsuyama, Ehime 790-8566, Japan
2
Department of Plant Resource Production, Kochi University, Monobe B 200, Nankoku, Kochi 783-8502, Japan
3
Faculty of Agriculture and Marine Science, Kochi University, Monobe B 200, Nankoku-shi, Kochi 783-8502, Japan
*
Author to whom correspondence should be addressed.
Horticulturae 2017, 3(4), 50; https://doi.org/10.3390/horticulturae3040050
Submission received: 29 July 2017
/
Revised: 2 October 2017
/
Accepted: 3 October 2017
/
Published: 20 October 2017
Abstract
:In a controlled environment, light from light-emitting diodes (LEDs) has been associated with affecting the leaf characteristics of Eustoma. LEDs help plant growth and development, yet little is known about photosynthetic performance and related anatomical features in the early growth stage of Eustoma leaves. In this study, we examined the effects of blue (B), red (R), and white (W) LEDs on the photosynthetic performance of Eustoma leaves, as well as leaf morphology and anatomy including epidermal layer thickness, palisade cells, and stomatal characteristics. Leaves grown under B LEDs were thicker and had a higher chlorophyll content than those grown under the R and W LEDs. Leaves under B LEDs had greater net photosynthetic rates (A), stomatal conductance (gs), and transpiration rates (E), especially at a higher photon flux density (PPFD), that resulted in a decrease in the intercellular CO2 concentration (Ci), than leaves under the W and R LEDs. B LEDs resulted in greater abaxial epidermal layer thickness and palisade cell length and width than the R and W LED treatments. The palisade cells also developed a more cylindrical shape in response to the B LEDs. B LED leaves also showed greater guard cell length, breadth, and area, and stomatal density, than W or R LEDs, which may contribute to increased A, gs and E at higher PPFDs.
1. Introduction
Light is the sole energy source for photosynthesis and an environmental trigger in a wide range of plant growth and development phenomena. In a controlled environment, in response to requirements for optimal light quality, quantity, and distribution, light-emitting diodes (LEDs) have been proposed as a promising light source for plants [1], either as a main or supplementary light source [2], and for space-based plant growth [3,4]. Compared with light intensity and photoperiod, light quality filters have much more complex effects on plant morphology and physiology. Using different color lights greatly influences the plant development cycle and physiology [5]. Hence, blue (B) and red (R) LED light absorbed by photosynthetic pigments are more effective than other wide-spectrum light [6]. B light is associated with physiological responses such as plant photo-morphogenesis, phototropism, vegetative growth, stomatal opening, leaf expansion, anatomy and photosynthetic functioning, enzyme synthesis, chloroplast movement, and gene expression [6,7,8,9,10,11]. The range of wavelengths of B light impacting growth of plants is diverse and crop-specific [10,12]. In contrast, R light produces a narrow-spectrum light that regulates root-to-shoot ratio, chlorophyll content, and the photosynthetic apparatus [13,14]. Although R light is the main light absorbed for photosynthesis, plants cannot develop optimally without B light [15,16]. In addition, plants under white (W) LED light alone have regular leaf morphology and a higher photosynthetic rate compared with plants grown under R or B light [9,17,18].
Generally, net photosynthetic rate (A), stomatal conductance (gs), transpiration rate (E), and intercellular CO2 concentration (Ci) vary under different light spectrums. In particular, stomata strongly affect photosynthesis in plants, where stomatal conductance is correlated with CO2 assimilation and limits excessive water loss in response to changing external environments [19,20,21,22]. An increasing proportion of B light stimulated A and gs in cucumber plants [17], and components of stomatal function affecting photosynthesis were both dependent on and independent of B light, whereas stomatal function affecting photosynthesis were dependent on response to R light [23].
Eustoma grandiflorum (Raf.) Shinn originated as a wild flower from North America to South America, and has bright colorful petals and a long postharvest life compared with other cut flowers. However, conventional Eustoma plant production is often shortened by climatic conditions, especially in summer and winter in tropical and temperate regions, respectively. In addition, the environment (temperature, water, sunlight availability, etc.) can retard growth during the seedling stage to early developmental stage of Eustoma, resulting in plants with irregularly shaped leaves. Currently, plant production under controlled environmental conditions has been explored in many countries. Using artificial light for plants, in which the system controlling major environmental factors is strongly maintained, results in easier plant production regardless of border climatic conditions [24]. Eustoma leaves respond to different color LED lights in their physiological performance and stomatal function, which act as gateways linking the intercellular gas spaces to the external environment for photosynthesis because light significantly regulates plant response in terms of leaf phenotype and canopy architecture [25,26]. The optimal epidermal layer traits and stomatal activities of Eustoma leaves under B, R, and W LEDs have not been determined to date, nor have there been studies on the effects of B, R, and W LED light on leaf photosynthetic performance in the early growth stage of Eustoma leaves.
The objective of this study was to examine the effects of B, R, and W LEDs on leaf phenotypic and photosynthetic performance, the epidermal layer, palisade cells, and stomatal behavior in the early growth stage of Eustoma.
2. Materials and Methods
2.1. Plant Materials and Growth Conditions
Voyage type 2 pink Eustoma (Eustoma grandiflorum) seeds (Sakata Seed Corporation, Kanagawa, Japan) were sown in half-strength MS medium with 3% sucrose concentration for in vitro culture. During seed germination and seedling growth in vitro, the temperature and light conditions were 23 ± 2 °C under 16/8 h (light/dark) and 98 µmol m−2 s−1, respectively. After 8 weeks, morphologically uniform, 4th fully-expanded leaf pair were removed from the culture bottle and washed carefully in running water. Afterward, the cultured seedlings were transferred to plastic pots (6 cm in diameter and 9 cm in depth) containing fertilized soil with 380, 290, and 340 mg L−l of N:P:K (Tanekura No. 42; Sumirin Agricultural Industry Co., Ltd., Tokyo, Japan) and quickly transferred to a phytotron to establish the seedlings in the soil during acclimatization. After 2 days, the 30 seedlings were transferred to a walk-in-type, environmentally-controlled LED growth chamber (fabricated environment controlled growth chamber; Nikkan Co., Ltd., Tokyo, Japan); the air temperature was 22/18 °C during the light and dark period, respectively. Photoperiod, relative humidity and CO2 concentration were 16 h day/8 h night, 65%, and 400 µmol mol−1 during LED light acclimation, respectively. The seedlings were watered daily and acclimated for 65 days in the growth chamber. The seedlings were subjected to B, R, and W LED lights (Tube LED light; Beamtech Co., Ltd., Tokyo, Japan, with an average photosynthetic photon flux density (PPFD) of 100 ± 25 μmol m−2 s−1 under each of the LED treatments. The quality of irradiance of the B, R, and W LEDs was individually maintained by adjusting the DC power supply for each treatment. The LED lights were positioned 25 cm above the plants. The B, R, and W LEDs had peak wavelengths of 420–550, 580–670, and 420–750 nm, respectively (Figure S1; Light Analyzer, LA-105; NK-System, Osaka, Japan).
2.2. Leaf Morphological Measurements
At the early growth stage (65 days), leaf length and width, and fresh weight were measured on single leaves of 10 plants to determine the effect of each light treatment. Leaf thickness, relative content of chlorophyll, and leaf area were recorded at the third internode with fully-expanded leaves. Leaf thickness was measured using a Vernier caliper (Mitutoyo Corp., Kawasaki, Kanagawa, Japan), and the relative content of chlorophyll was estimated using a chlorophyll meter (SPAD-502; Minolta, Osaka, Japan). The development of leaf area was analyzed using ImagJ software (version 1.8.0; http://imagej.nih.gov/ij/) at a 1 cm scale bar.
2.3. Leaf Gas Exchange and Photosynthetic Measurements
The method for measuring leaf gas exchange parameters was reported previously [27]; a portable photosynthesis system (Li–6400XT; Li-Cor Inc., Lincoln, NE, USA) was used between 09:00 a.m. and 12:00 p.m. at 1 h intervals for each LED treatment, to avoid midday depression of photosynthesis and transpiration [28]. Leaf photosynthetic rate (A), transpiration rate (E), stomatal conductance (gs), and intercellular CO2 (Ci) at different photosynthetic photon flux densities (PPFD) were measured. In each LED light treatment, PPFD was obtained at representative single leaves in mid-canopy. During the experiments, the CO2 concentration in the gas chamber and leaf temperature were set at 360 ppm and 20 °C, respectively, and the photon flux density (PPFD) was started at 250 µmol m−2 s−1, followed by 500, 750, 1000, 1250, and 1500 µmol m−2 s−1. Marchese et al. [28] reported that the photosynthetic performance of Eustoma improved under a high light condition (1441.6 µmol m−2 s−1). Photosynthetic light response curves and photosynthetic characteristics were analyzed using the portable photosynthesis system on single fully-expanded 65-day-old leaves of 10 plants exposed to each LED light (B, R, and W) using the method of Li et al. [29], with little modification. Hence, leaf photosynthesis was recorded in the range of 250 to 1500 µmol m−2 s−1 (PPFD), with a 3–5 min equilibration time at each step of the light response curve to compare the difference in photosynthetic performance under a controlled environment using B, R, and W LED lights.
2.4. Leaf Anatomy and Stomatal Character Measurements
The 65-day-old leaf samples from the plants grown under B, R, and W LED light were collected and immediately kept in autoclaved water. Leaves were manually cut into thin transverse sections using a double-edged disposable razor blade on a rubber cutting mat [30]. Leaf segments were fixed in red stain (Acetocarmine solution; Kishida Chemicals Co. Ltd., Osaka, Japan) for 30 s. After staining, sections were mounted on a microscope slide and the orientation checked before being covered with a glass slide. To measure the thickness of the upper and lower epidermis, the leaf adaxial and abaxial layers and palisade cell size were observed under a light microscope (DX-50; Olympus, Tokyo, Japan) at a magnification of 200×.
To observe the stomata, a layer of transparent nail polish was applied to the lower epidermis of the fully expanded leaves and allowed to dry for 5–10 min. Slides were made using the leaf epidermal fingerprint with transparent nail polish method [31]. A piece of clear cellophane tape was placed over the section of nail polish, carefully peeled from the leaf, and the ‘impression’ was transferred to a microscope slide. Imprints were observed under a light microscope equipped with a digital microscope camera (DP-12; Olympus, Tokyo, Japan). Images were saved to a computer and analyzed in ImageJ. The abaxial layer of the leaves was examined for leaf stomatal aperture under each LED-light treatment. Guard cell length and width, and cell area were measured using the light microscope at a magnification of 400×, and stomatal density was measured at a magnification of 200×. Internal leaf anatomy was likewise recorded in a subset of samples including ten replicates for each LED-light treatment (n = 10) because of the time needed to clear, fix, embed, section, and analyze microscopic features.
2.5. Statistical Analysis
A completely randomized design was used with ten replicates for the LED-light treatments. Significant differences among the means were determined by one-way ANOVA with Tukey’s HSD test at P < 0.05. For all statistical analysis, KaleidaGraph-4.5.0 (Synergy Software, Reading, PA, USA) was used. Data are reported as means ± standard error (SE).
3. Results
3.1. Influence of LEDs on Leaf Morphology
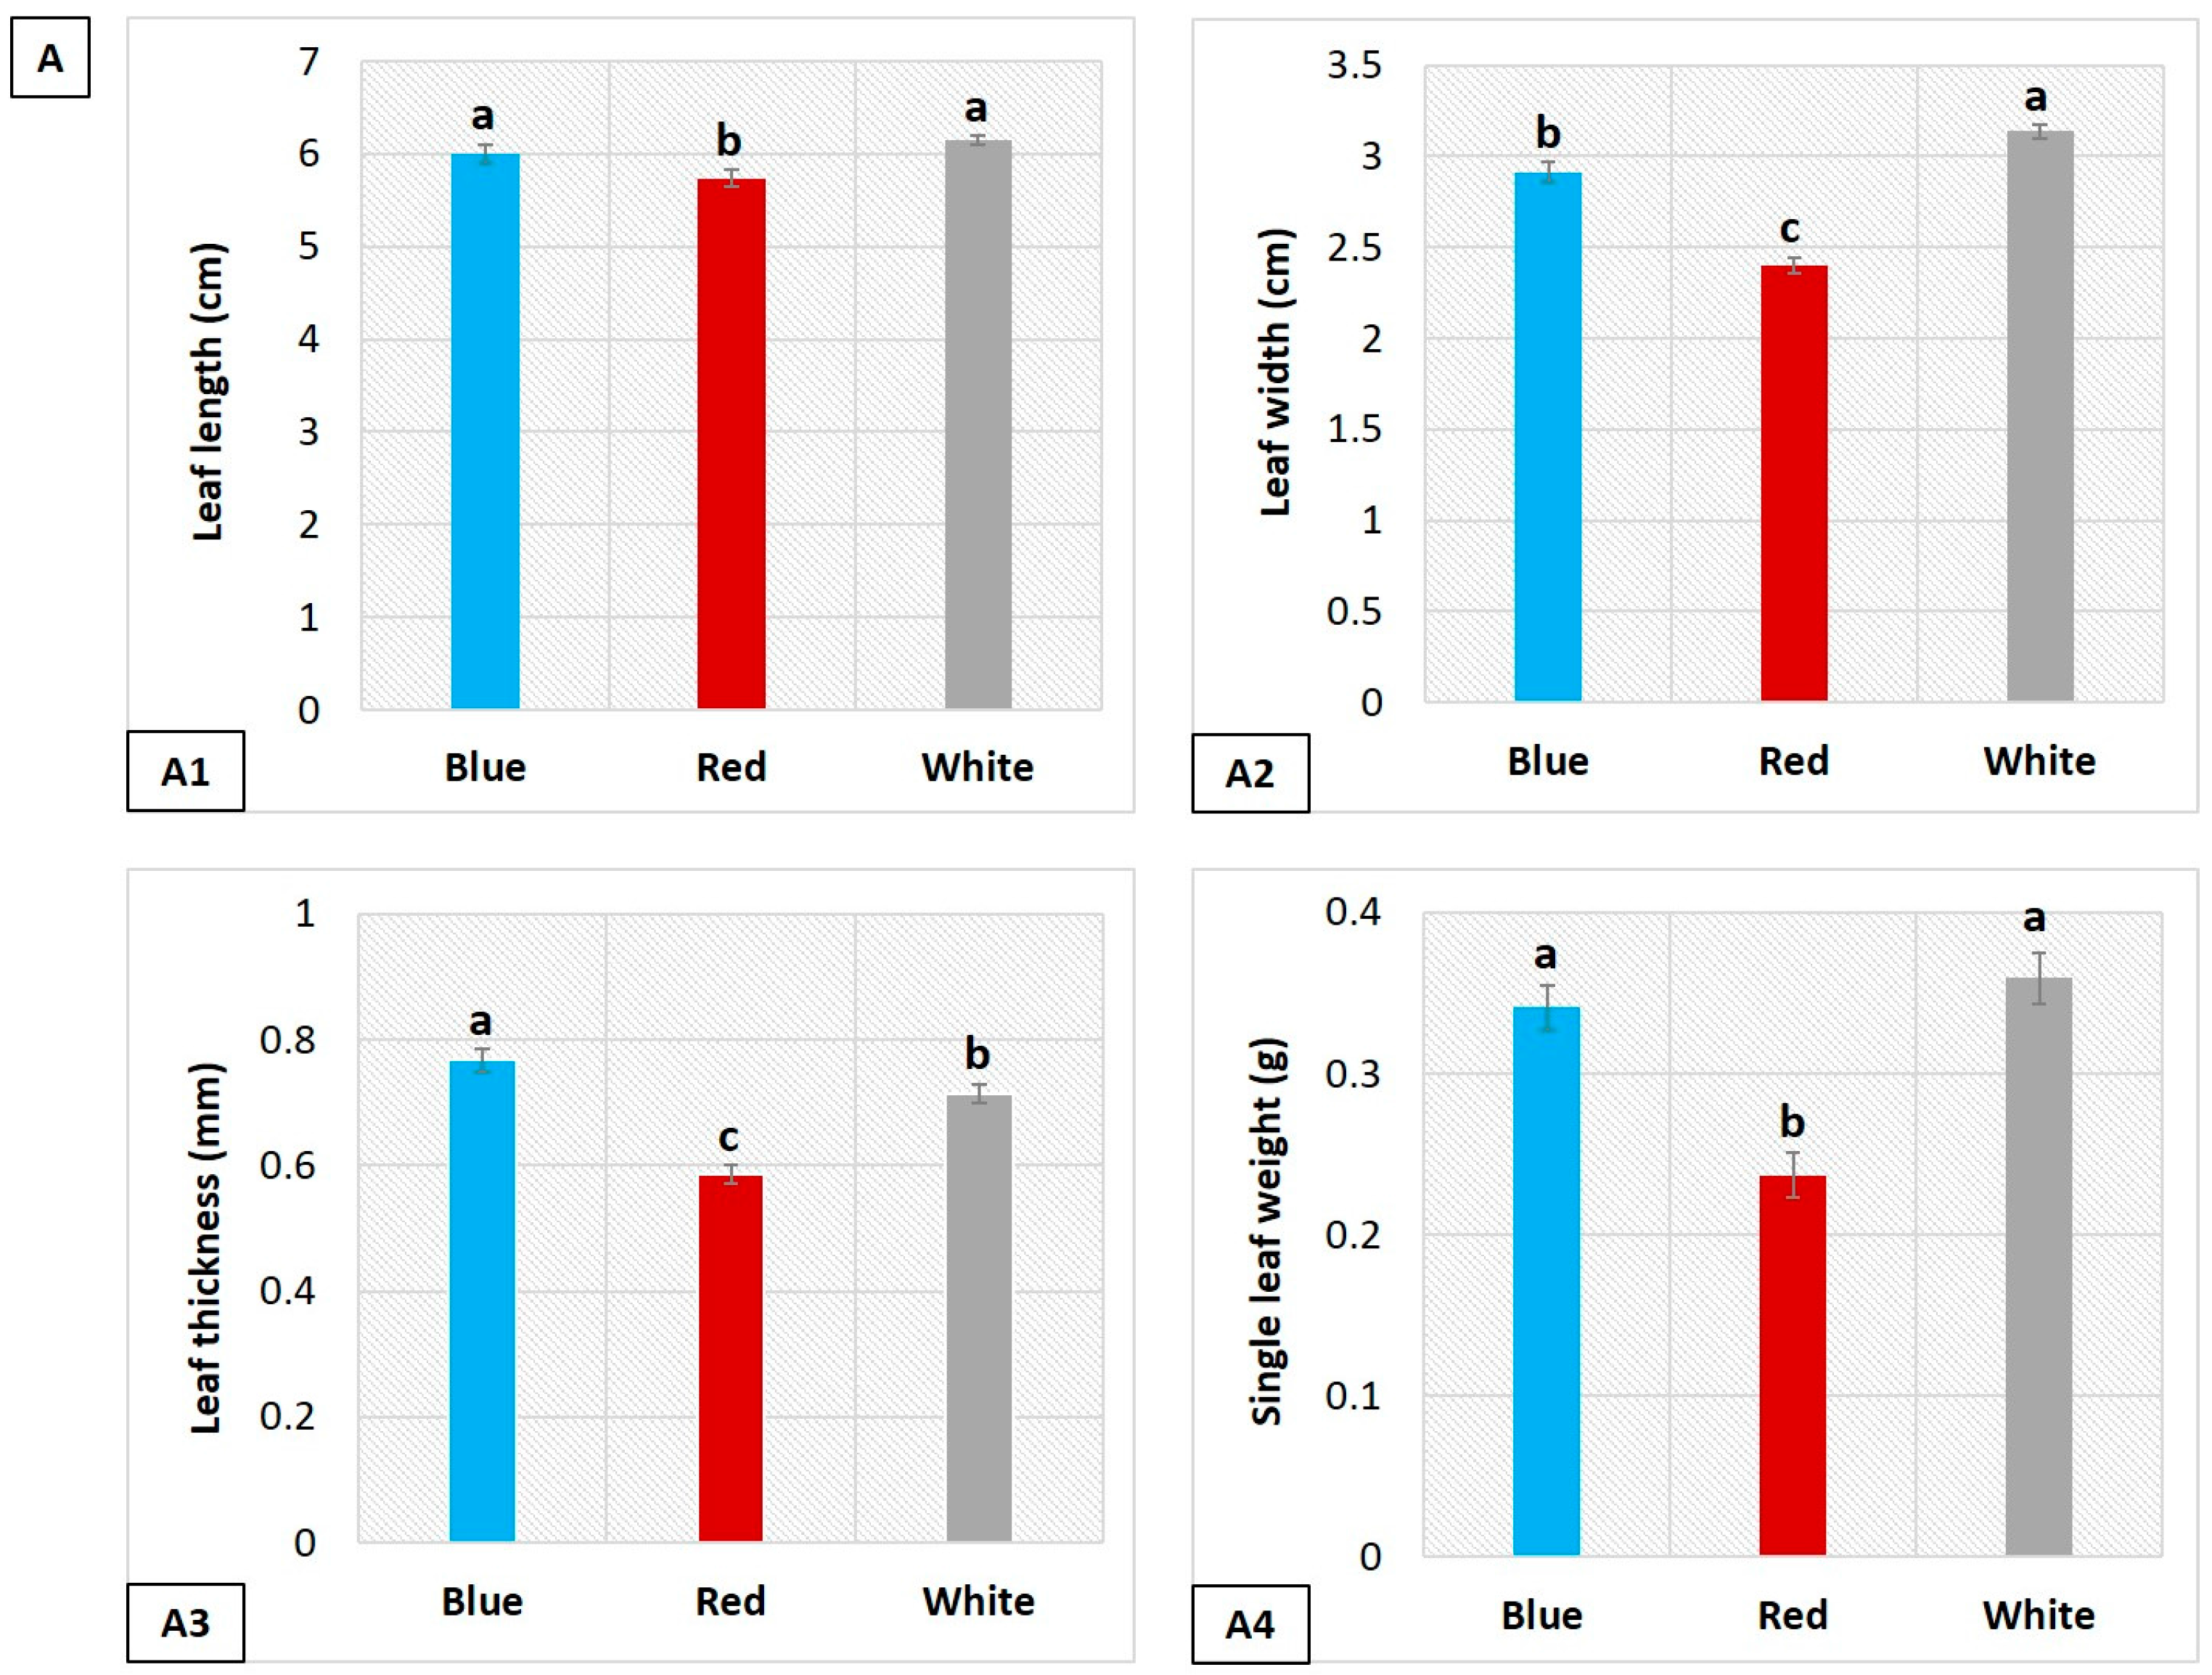
The growth and morphology of the Eustoma leaves were significantly affected under the B, R, and W LED treatments (Figure 1A), particularly leaf shape and size (Figure 1C). The leaves grown under the B and W LEDs were longer than those grown under the R LEDs (Figure 1(A1)). On the other hand, the leaves grown under the W LEDs were wider than the leaves grown under the B or R LEDs (Figure 1(A2)). Leaf thickness was greater under the B LEDs than the R and W LED treatments (Figure 1(A3)). The highest values of single leaf fresh weight were for leaves grown under the B and W LEDs, but there was no significant difference between the B and W LED treatments (Figure 1(A4)).
3.2. Influence of LEDs on Leaf Area and Chlorophyll Content
3.3. Influence of LEDs on Leaf Gas Exchange and Photosynthetic Performance
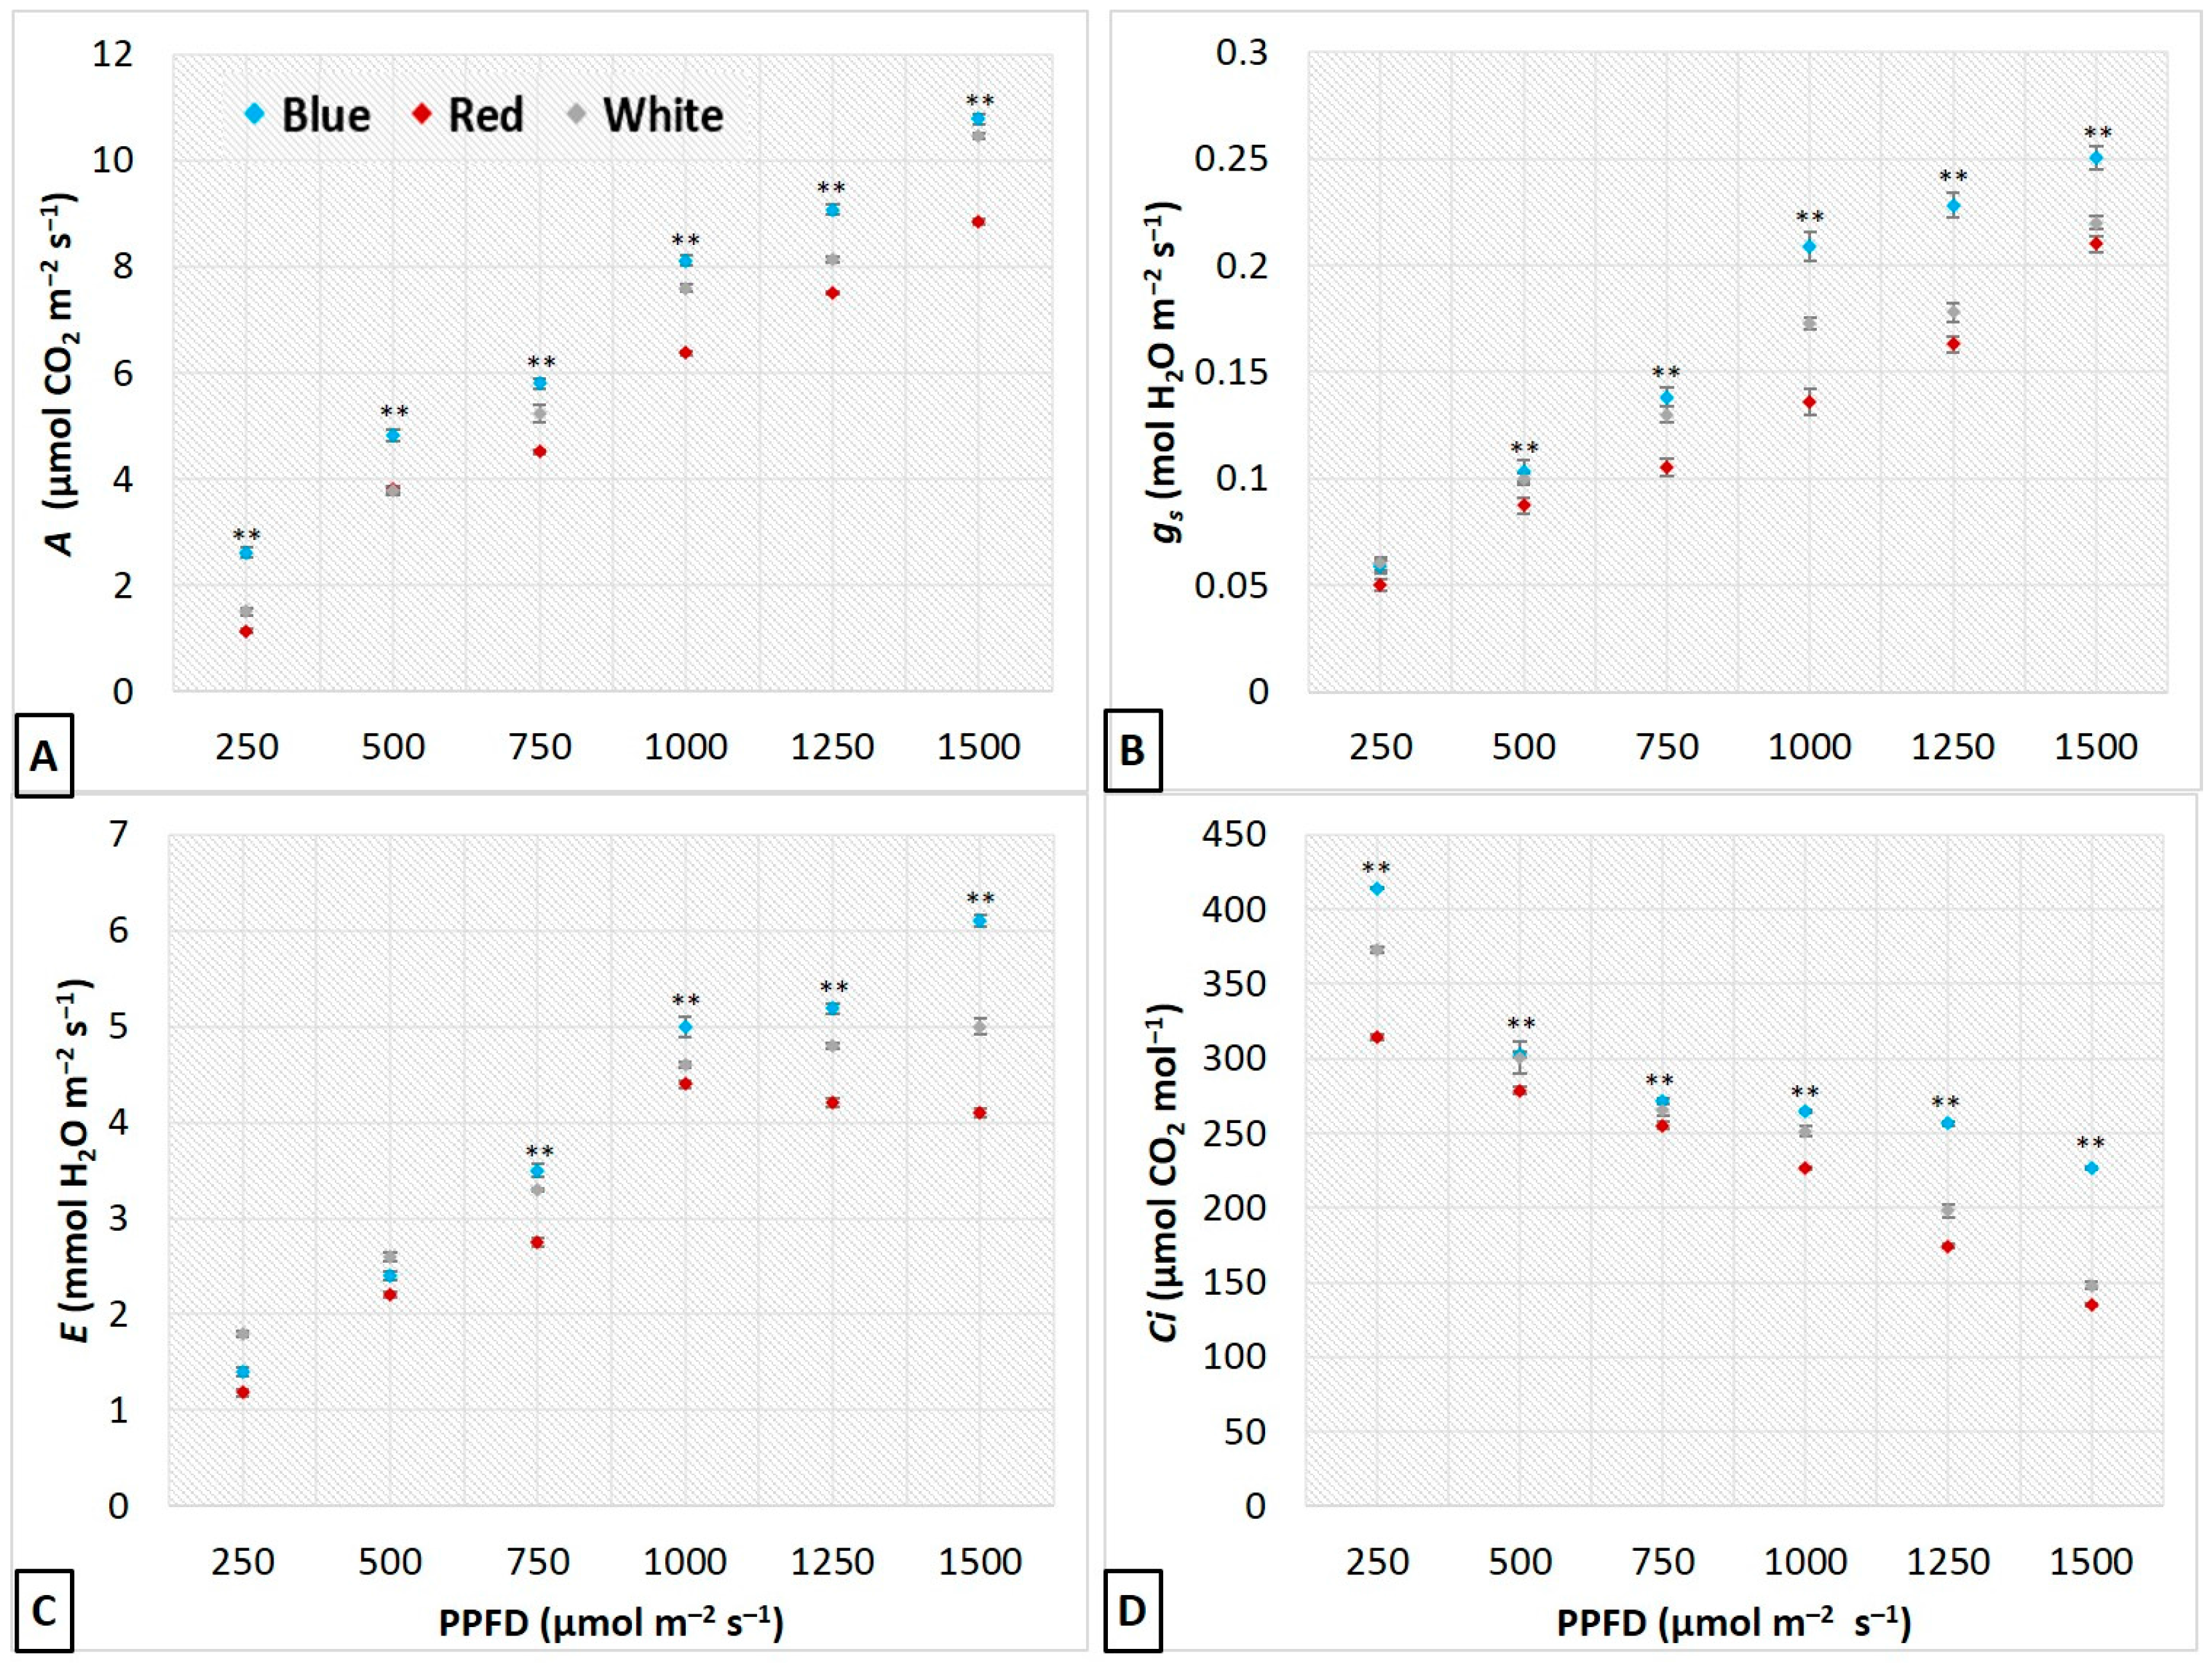
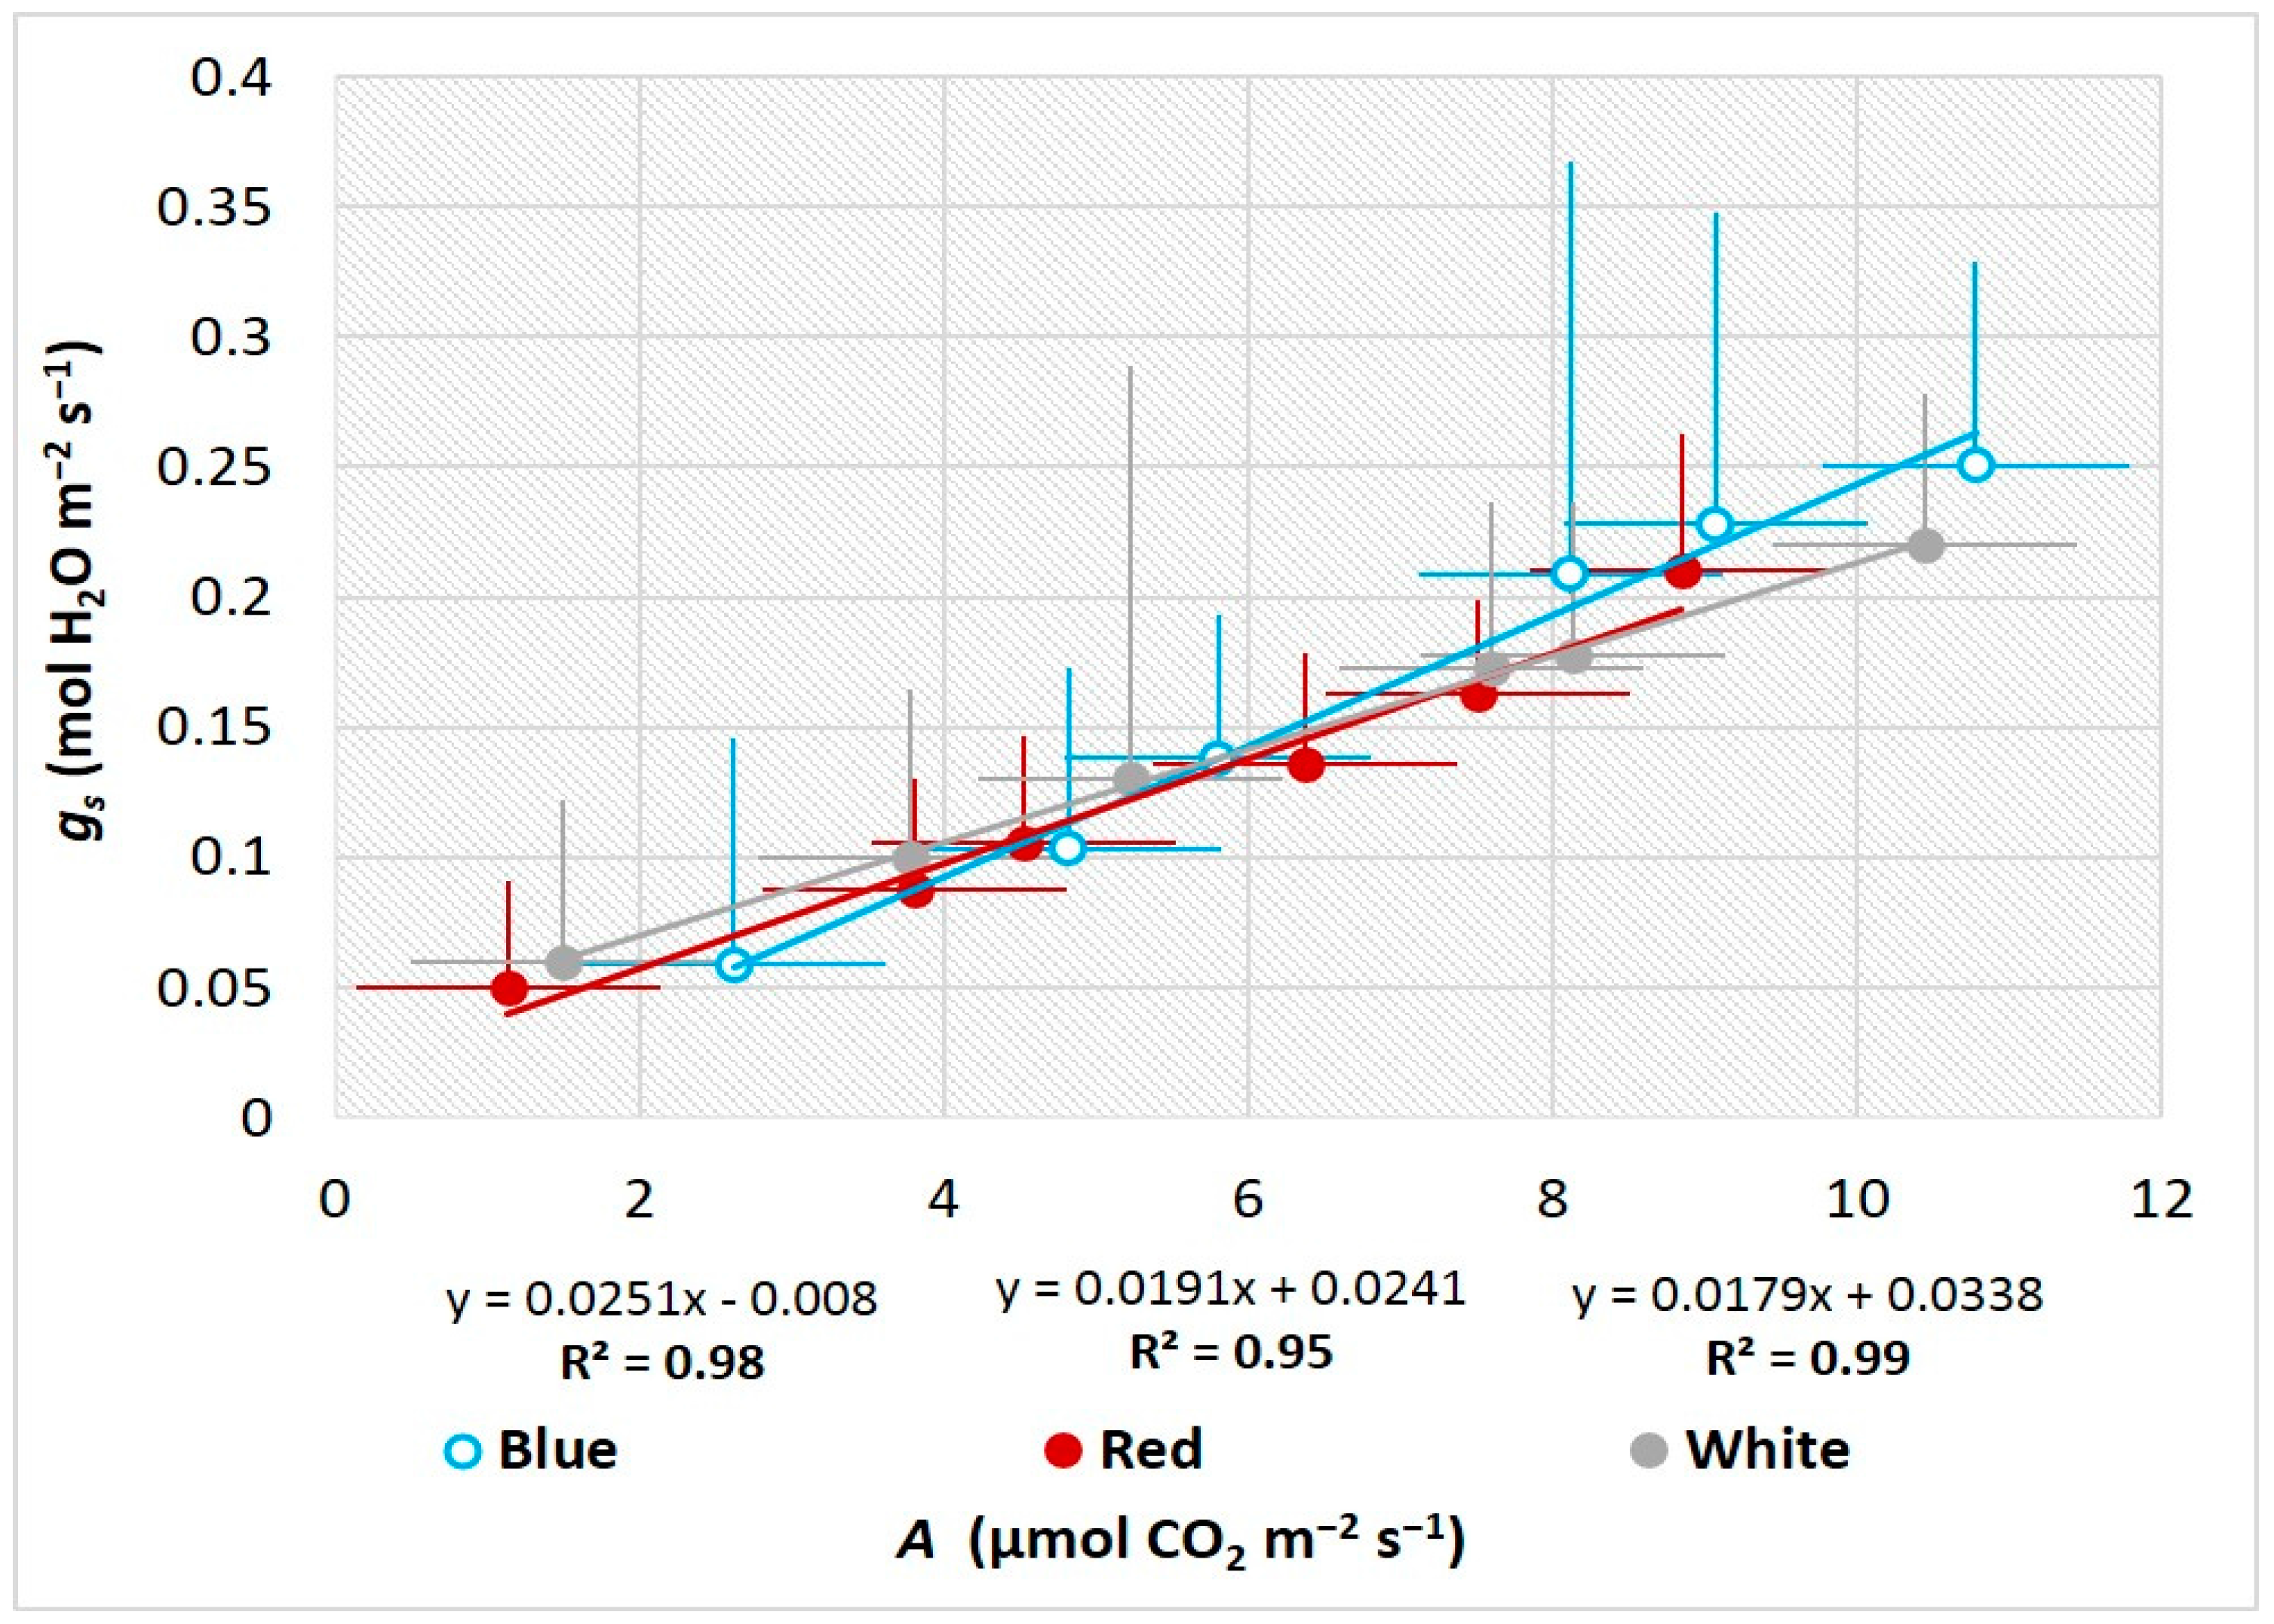
Figure 2 indicates that leaf A (Figure 2A), gs (Figure 2B), and E (Figure 2C) increased for each PPFD value from 250 μmol m−2 s−1 to 1500 μmol m−2 s−1, and that Ci decreased (Figure 2D). For the plants grown under the B LED light, Ci; A, gs, and E were greater at most PPFDs than the plants grown under the R and W LEDs (Figure 2A–C and Figure S1). In contrast, Ci differed significantly between the plants grown under the B, R, and W LEDs; the values were higher in the plants grown under the B LEDs than under the R LEDs at all PPFDs (Figure 2D). Therefore, B LED light at 1500 μmol m−2 s−1 PPFD resulted in increased photosynthetic function of leaves, with the greatest increase occurring for A, gs, and E compared with the values for the R and W LEDs. The correlation between A and gs (Figure 3) may be explained either by the effect of the B, R, and W LEDs or by the different PPFDs (Figure S1).
3.4. Influence of LEDs on Leaf Epidermal Layer
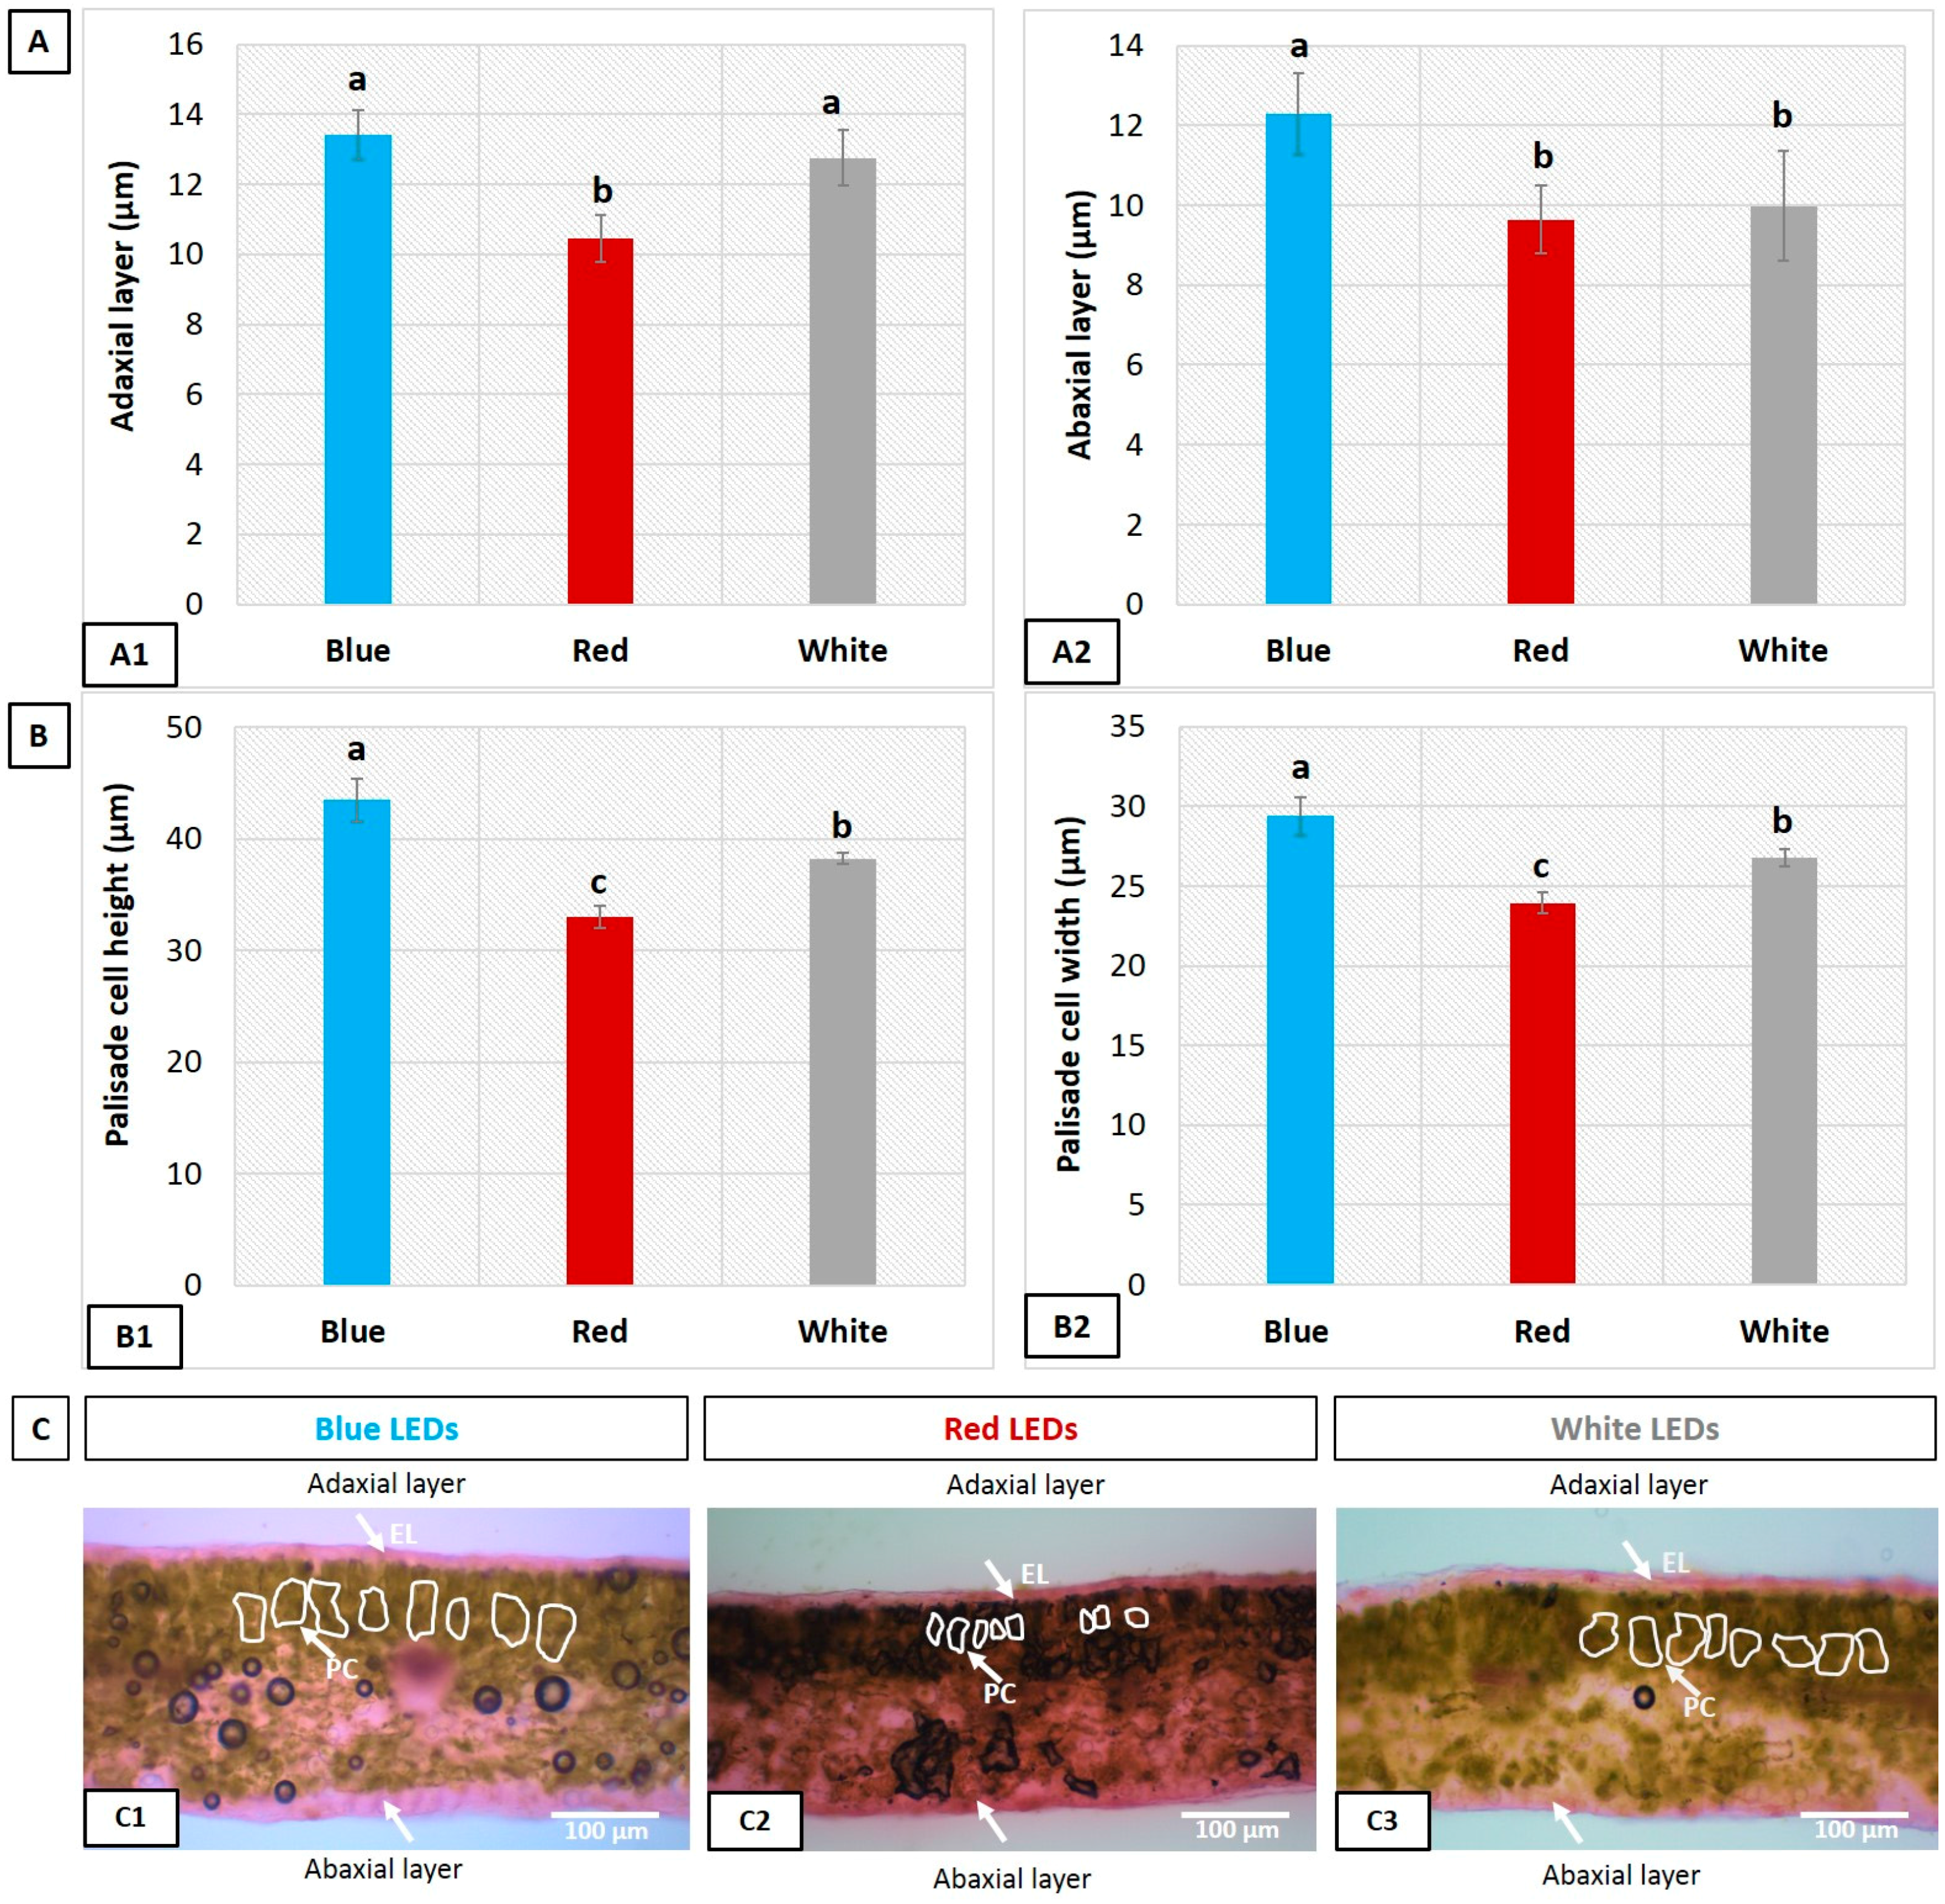
Significant differences were found in the adaxial and abaxial epidermal layers of the leaves grown under the B, R, and W LED treatments (Figure 4). There was no significant difference between the leaf adaxial epidermal layer under the B and W LEDs, but the adaxial layer was thicker under both than those under the R LEDs. (Figure 4(A1)). Likewise, the abaxial layer was thicker in the leaves grown under the B LEDs compared with those grown under the R and W LEDs (Figure 4(A2)); however, no significant difference was observed between the R and W LED treatments. Significant differences were also observed at the microscopic level in both the adaxial and abaxial epidermal layers (Figure 4C). A transverse section of the leaves showed increased palisade cell height and width in the B LED-treated leaves compared with those treated under the R and W LEDs and the difference was significant (Figure 4(B1,B2)). The cylindrical shape of the palisade cells increased under the B LEDs, whereas the cells remained almost spherical under the R LEDs (Figure 4(C1,C2)). A cylindrical cell shape was also found in the leaves treated under the W LEDs (Figure S1 and Figure 4(C3)).
3.5. Influence of LEDs on Stomata
Microscopic analyses of leaf stomata indicated significant differences among the leaves grown under the B, R, and W LED treatments (Figure 5). The B LED-treated leaves showed well-organized guard cells with open stoma, and greater guard cell length, width, and area than the R and W LED-treated leaves (Figure 5(A1–A3,B1–B3); Figure S1). Stomatal density was higher for the leaves grown under the B LEDs followed by those under the W and R LEDs (Figure 5(A4,B1–B3)). The blue (B) LED light resulted in open stomata, which helps gas exchange.
4. Discussion
LED lights are widely used in Eustoma cultivation in controlled environments. LEDs therefore provide opportunities for altering leaf structure and physiology in the early growth stages during horticultural production in either greenhouses or space. In general, light affects plant growth and development [32], and numerous studies have already been conducted with LED lights on various horticultural crops [33,34]. In this work, we explored leaf phenotypic and photosynthetic performance, and microscopically examined the leaf epidermal layers and stomata of Eustoma leaves, grown under B, R, and W LEDs.
Leaves varied in length and width under the LED light treatments. Leaf shape and size change as a function of plasticity, natural variation, and environmental adaptation [35]. In the early growth stage, Eustoma leaves grew faster because photosynthetic performance under the W LED light leads to vigorous growth [18]. In the B LED light-treated leaves, repression of gibberellin (GA) biosynthetic-related genes and induction of the GA inactivation-related genes has been reported, which constrained the elongation of rice leaves [36]. In Figure 1(A1,A2), leaves under B and W LEDs were longer compared with the leaves under R LEDs, and the leaves under W LEDs were wider compared with the leaves under B and R LEDs. The shortest and narrowest leaves were those under the R LEDs. Notably, leaf length of the leaves treated under the W and B LEDs was not significantly different, but leaf width under all LEDs was significantly different. The wavelengths of the B and W LEDs broadened leaf width compared with the R LEDs [37]. Furthermore, no leaf blade curling was observed in the B and W LED-treated leaves, but there was in the R LED-treated leaves. Leaf curling is a response to phytochrome B [38].
The structure and physiology of leaf thickness is controlled by light [39], and mesophyll cell size is also induced to increase, which in turn increases leaf thickness under different light intensities [40]. From the results, leaf thickness was significantly greater in the leaves under the B LEDs compared with the other LED treatments (Figure 1(A3)). Additionally, exposure to the R LEDs decreased the single leaf fresh biomass compared with the other LEDs, and there was no significant difference in leaf fresh weight between the B and W LEDs (Figure 1(A4)). However, partitioning of B and W LEDs has increased the fresh weight for other processes, possibly leaf thickening or the production of carbohydrates [16].
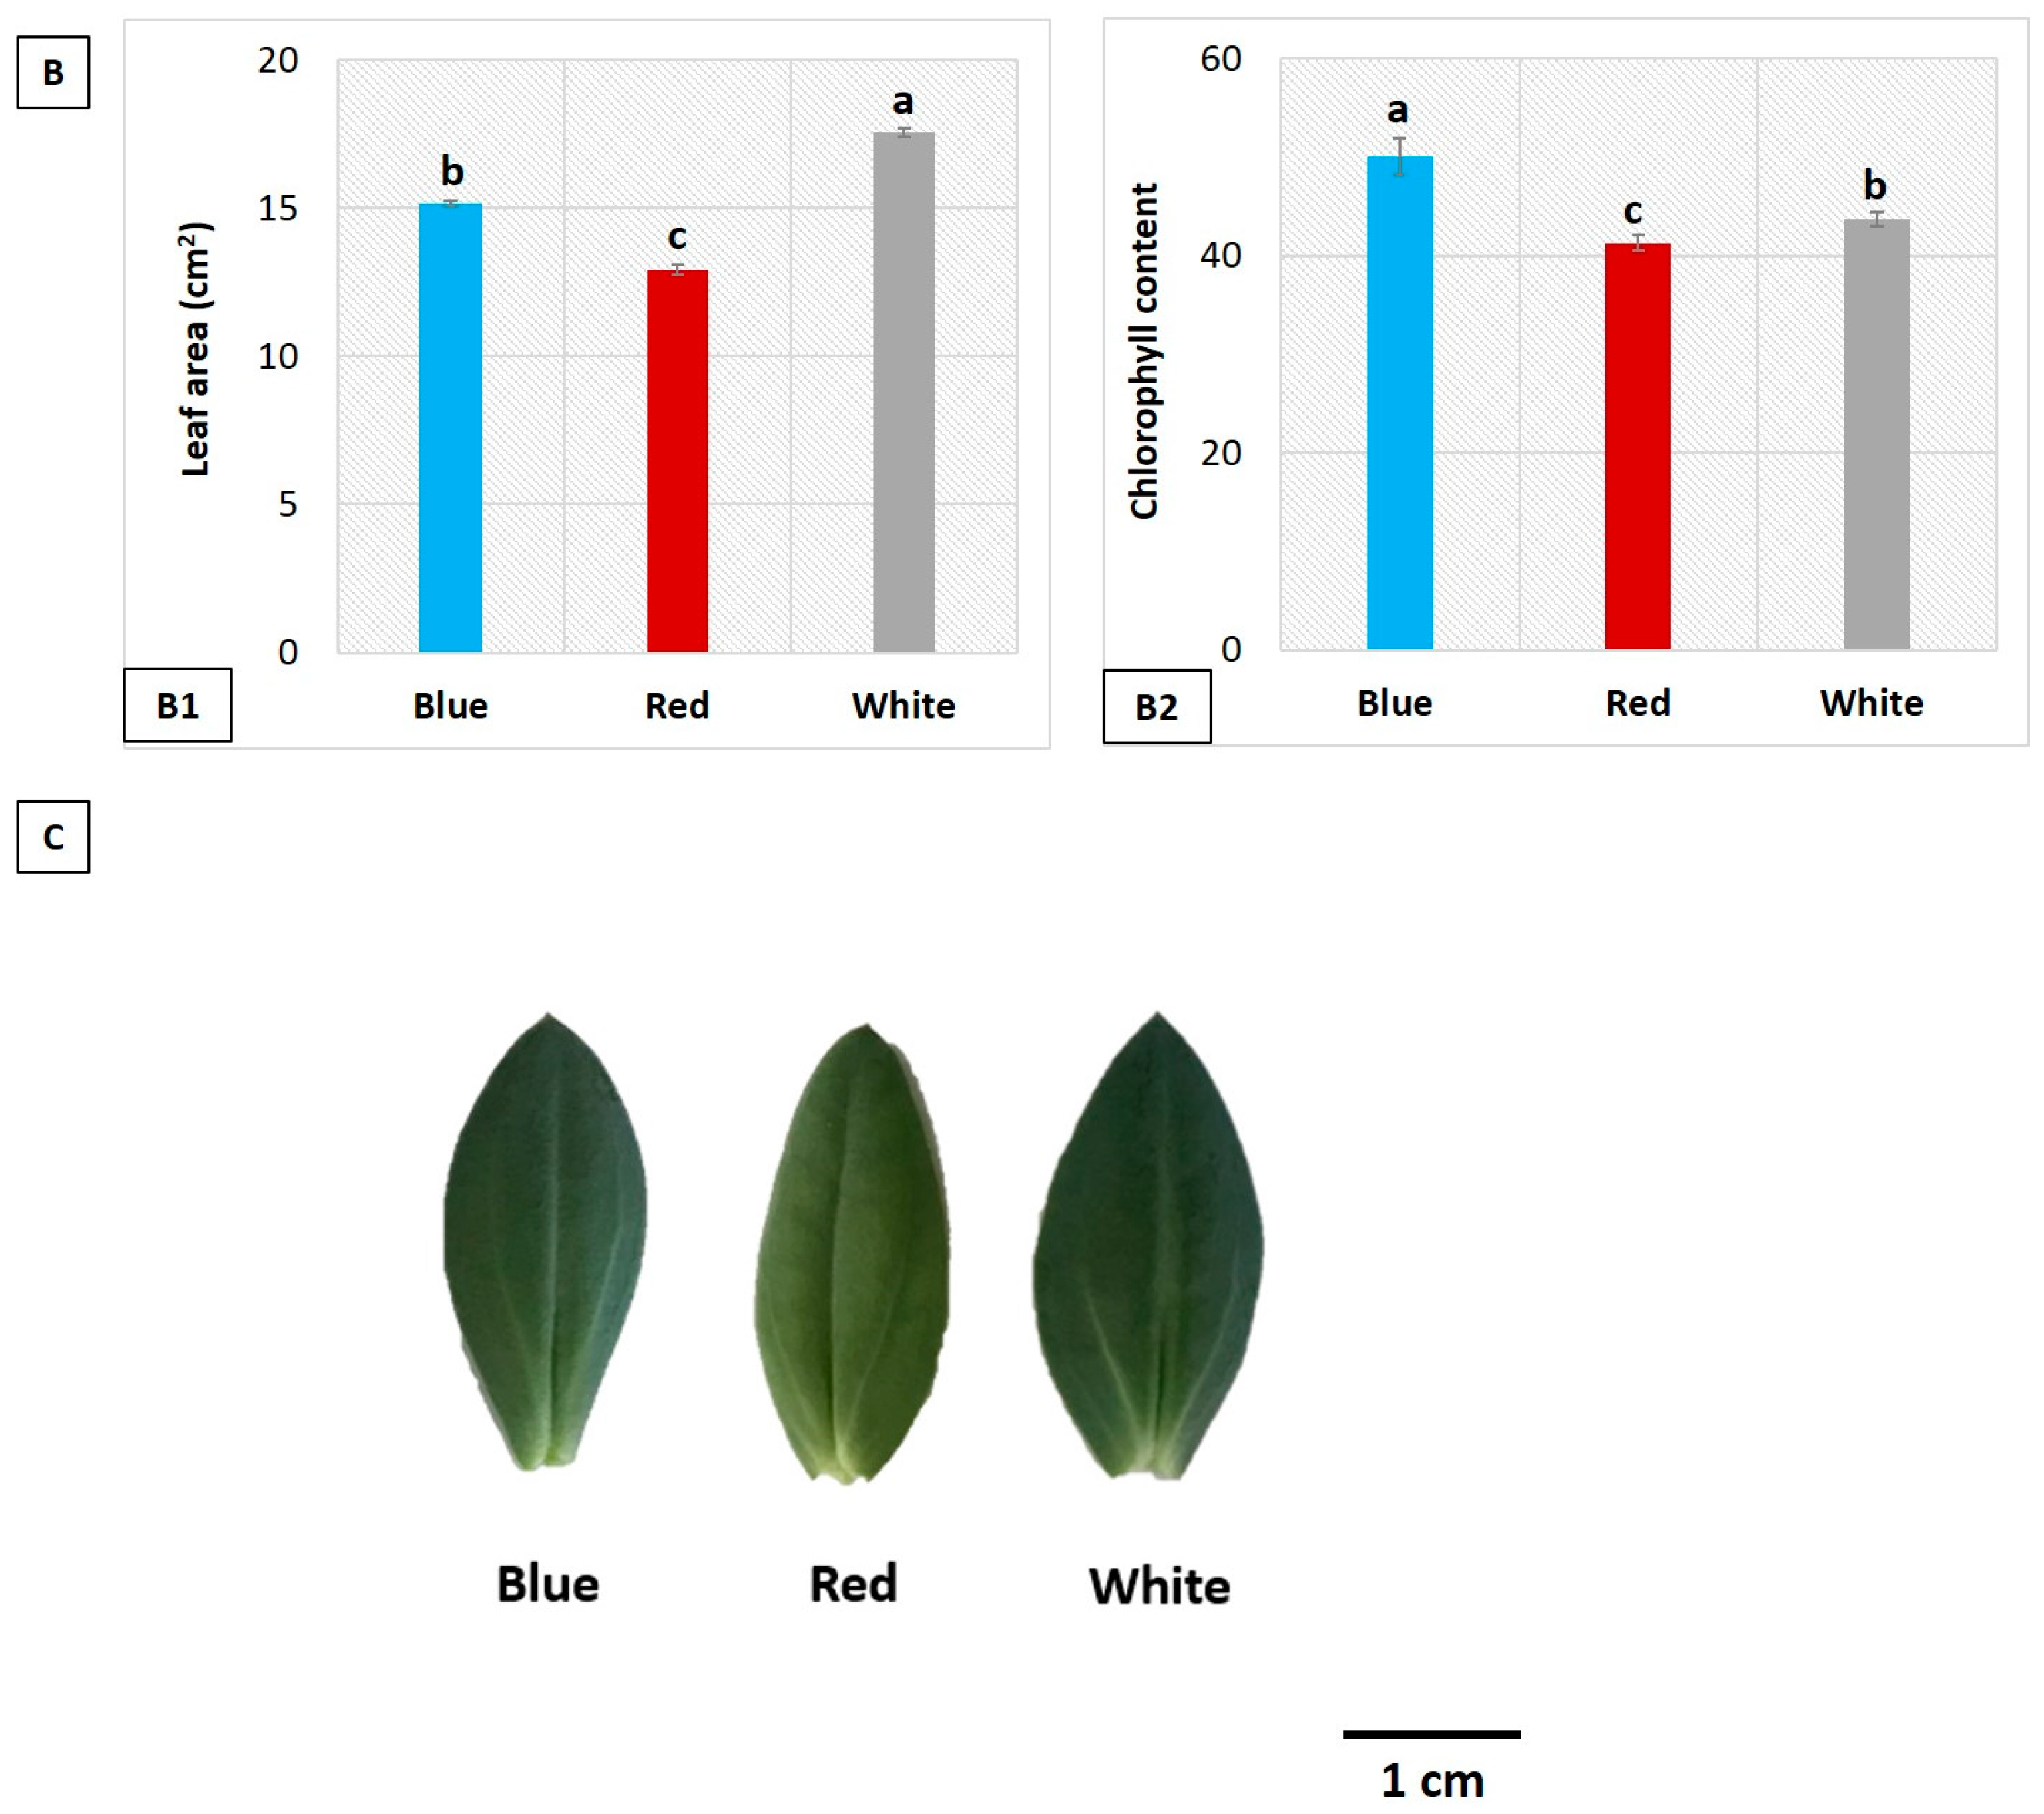
In this work, leaf growth and biomass were greatly promoted by the B and W LEDs, showing that the morphology and growth of the Eustoma leaves were regulated by the LED light in the early growth stages. Leaf area increases in response to the photomorphogenic function of phytochrome during photosynthesis, polyploidization, and environmental or physiological conditions [17,41]. R LEDs resulted in reduced leaf area compared with other LED light in chrysanthemum, tomato, and lettuce [42]. Moreover, lack of appropriate LED light arrangement (distribution, positioning above and below, and angle) in a growth chamber has resulted in reduced leaf area under B LEDs compared with W LEDs in lettuce [43]. Figure 1(B1) shows that leaves grown under the W LEDs had a greater leaf area than the B LED-treated leaves. LEDs may promote cell expansion or division, increasing leaf size, although the effect of B LEDs on leaf area is crop specific. Dougher and Bugbee [44] and Wang et al. [45] tested the effect of a B light on leaf area in lettuce and Cucumis sativus, respectively, and found the maximum leaf area in leaves subjected to B-light treatments. Chlorophyll content receives much attention because it is involved in light absorption and leaf photosynthesis. Generally, chlorophyll absorbs B and R light and additional B LEDs increased the chlorophyll content in leaves more than other LED lights because chlorophyll absorbs light from B LEDs at 440 to 470 nm [46]. Consequently, chlorophyll a and b molecules in the B LED-treated leaves may absorb light in a different ratio than the other LED treatments (Figure S1) [47,48]. Our results indicated that leaves grown under the B LEDs had a higher chlorophyll content (Figure 1(B2)), which may account for their increased photosynthetic rate.
LED light is likely a key controller of leaf photosynthetic capacity and growth in a controlled environment. In general, B and R LEDs have a combined effect on photosynthesis at different wavelengths [17,49]. Increasing the percentage of blue light and light irradiance results in increased photosynthesis, as reported by Hogewoning et al. [17]. In this study, higher A occurred under the B LEDs at higher PPFDs, followed by the W LEDs and R LEDs (Figure 2A), with the greatest differences at the highest PPFDs (Figure S1, Figure 2A). A reduction in quantum efficiency (PSII) in the B LED-treated leaves may activate energy distribution in the photosystem, increase non-photochemical quenching (NPQ), and protect the leaf from LED-light injury [16,50]. In contrast, a lower rate of photosynthesis was found in R LED-treated leaves in lettuce [51], rice [52], and wheat [53]. Consequently, the lower rate of photosynthesis occurred due to low N-content of leaves under R LEDs with lower chlorophyll content [17]. At low PPFD (250 μmol m−2 s−1) under B LEDs, a higher photosynthetic light compensation point was observed compared with the other treatments (Figure 2A). Low light may result in lower chlorophyll content and consequently low light absorption, which means fewer electrons are excited; this results in fewer electrons passing down the two electron transport chains (PSI and PSII) during photosynthesis. Consequently, it appears that in the plants grown under B LEDs, leaf morphology (Figure 1A), chlorophyll content (Figure 1(B2)), and palisade mesophyll cell size (Figure 4B) resulted in better photosynthetic functioning in response to low light conditions compared with the plants grown under R and W LEDs. The current observation is supported by a recent report by Lanoue et al. [54], who stated that low light intensity under monochromatic LED lights results in photosynthesis, but there was no significant difference among the treatments.
Stomatal conductance (gs), a photosynthesis parameter, is a bridge for gas exchange and water transpiration, and is significantly correlated with the light spectrum (Figure 3) [53,55,56]. CO2 diffuses through the leaf stomata to be used for photosynthesis. B LEDs increase gs because blue light is perceived directly by blue-light photoreceptors (phototropin and cryptochrome), activating a signaling cascade that results in fast stomatal opening under background R [19,57]. Our results also showed that gs increased in leaves grown under B LEDs compared with leaves grown under R and W LEDs (Figure 2B). In contrast, gs in R LED-treated leaves decreased when the A and demand for Ci were high [19]. W LEDs may also affect gs regulation. Several other studies have shown a positive correlation between the proportion of B light and gs values [17,58]. In this study, the increase in the A in the leaves under B LEDs led to a decrease in Ci (Figure 4D) and to an increase in E and gs (Figure 2B,C). The relationship between photosynthesis and Ci may also affect the diffusion of CO2 in response to the light intensity under LED treatments. In the B LED-treated leaves, a low PPFD (250 μmol m−2 s−1) led to increased Ci compared with the R and W LEDs, whereas A decreased at low PPFD (Figure 2A,D). We propose that increasing Ci may limit RuBP regulation under low PPFD (250 μmol m−2 s−1) in plants treated with B LEDs. Thus, RuBisCO regulation in the mesophyll cells (Figure 4B), and stomatal shape, aperture, and density (Figure 5A), may have resulted in acclimation of gs and A to high CO2 at low PPFD under B LEDs compared with the other treatments. In contrast, RuBP may be regulated differently to decrease Ci at higher light intensity under LEDs for Eustoma leaves. Whiteman and Koller [59] and Lawson et al. [60] also examined stomatal and mesophyll cell responses to CO2 and irradiance, concluding that stomata were more likely to respond to Ci. In addition, the rate of diffusion of CO2 into or out of the leaf depends on the partial pressure gradient and the resistance of the diffusion pathway from outside the leaf to the site of fixation in the chloroplasts [61]. Notably, the leaves grown under W LEDs showed a higher transpiration at 250 μmol m−2 s−1, but the change in transpiration rate response to light quality was small compared with the other treatments (Figure S1 and Figure 2C). In particular, the higher A observed supported the growth of Eustoma leaves from our results [28]. It is well established that gs correlates with the A [62] and a lower E is also related to a reduction in gs [63]. The higher E under the B and W LEDs led to an increase in fresh biomass and a change in leaf shape compared with the R LEDs at higher PPFDs (Figure 1(A4),C; Figure 2C).
In the internal leaf anatomical observations, thicker and thinner adaxial and abaxial epidermal layers were found under different light intensities; a thicker adaxial layer had thicker palisade mesophyll cells and increased cell length and thickness [64]. In addition, a higher A was related to thicker palisade mesophyll cells, and these palisade cells are key photosynthetic sites [65]. In Figure 4A-C, our results indicated that the higher A in the B LED-treated leaves were related to thicker leaf adaxial and abaxial layers compared with the leaves treated under the R and W LEDs. Indeed, a thicker abaxial epidermal layer resulting from treatment with B LEDs may be beneficial for increasing the photosynthetic rate and CO2 fixation of Eustoma leaves.
We also observed a cylindrical shape of the palisade cells that developed in response to B LED-light treatment compared with the W and R LEDs (Figure 4(B1,B2),C, Figure 2A). Kozuka et al. [66] reported that cylindrical palisade cells under blue light leads to increased photosynthesis. Phototropin 2 under B LEDs affects the development of palisade cells [66]. Other studies have found that the development of cylindrical palisade cells was promoted by blue light in Pelargonium zonale [67] and Alternanthera brasiliana [68]. In this study, palisade cells under the W LEDs also resulted in a mostly cylindrical cell shape that had higher A compared with the R LEDs (Figure 4B and Figure S1). However, it remains unclear from our results to what extent the shape of LED-treated palisade cells contributed to A. The difference might be too small to be detected with the methods used in this study.
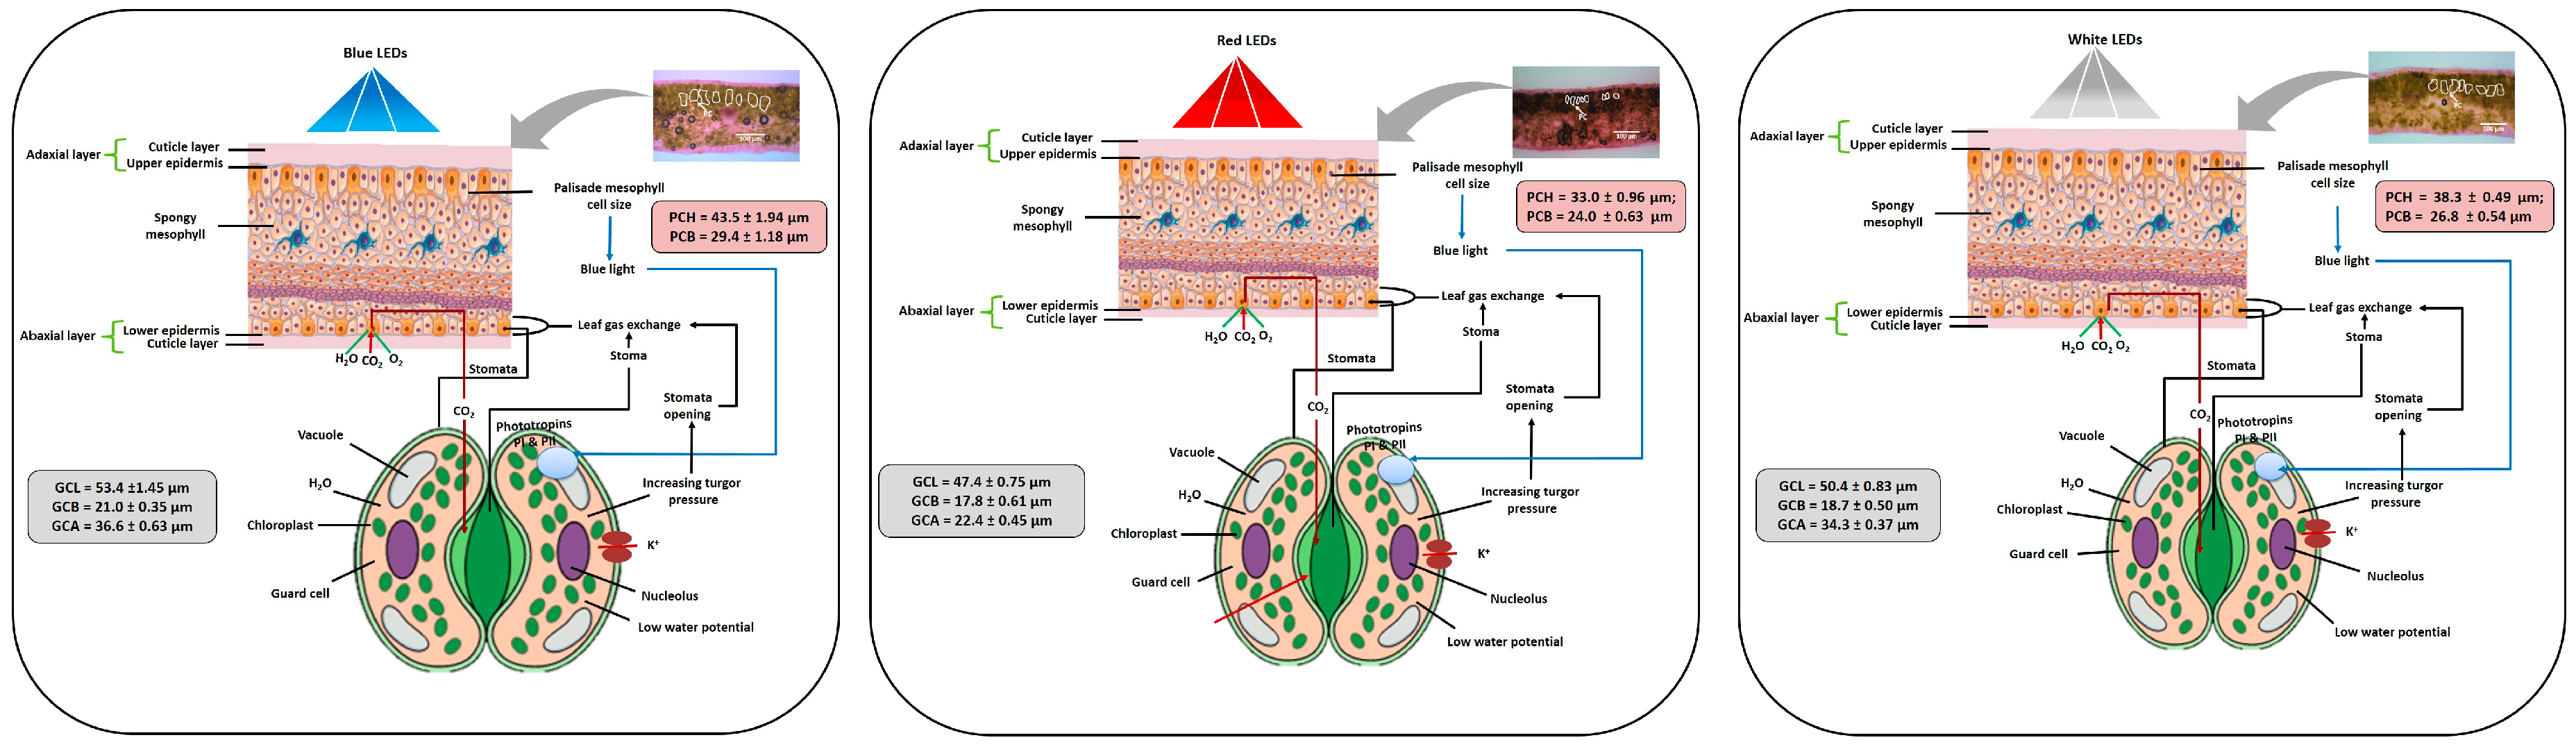
Figure 6 shows stomatal aperture response to light intensity and quality, the size of which is determined by the accumulation of K+ salts and/or sugars in the guard cells resulting in reduced water potential, uptake of water into the cell via osmosis, and photosynthesis in the leaves [19,69,70]. Stomatal aperture is also larger under B LEDs than R and W LEDs [19,71]. In general, elongation of the guard cell is subject to widening of the stomatal opening [72], and loss of water from the guard cell drives stomatal closure [73]. We found that the increase in guard cell length, width, and area in the leaves treated with B LEDs relative to the other LEDs may be associated with stomatal conductance (Figure 5(A1–A3,b1–b3); Figure S1). In addition, a larger stomatal aperture was observed in the leaves grown under the B LEDs than in the leaves grown under R and W LEDs, as shown in Figure S1 and Figure 5B. Stomatal density increased in the leaves treated with the B LEDs compared with the other LEDs (Figure 5(B1–B3); Figure S1). However, stomatal density in the R LED-treated leaves was lower (Figure 5(A4,B2)), which may be related to the lower water loss during transpiration in the plants and leaf edge curling. Therefore, the higher light intensity with the B LEDs increases stomatal density [50,74] and may enhance the photosynthetic rate and stomatal conductance in the early growth stage of Eustoma leaves.
5. Conclusions
From a practical standpoint, B LEDs, compared with R and W LEDs, provoked both a qualitative signaling effect enabling greater photosynthetic functioning, A, gs, E, and Ci, in Eustoma leaves under a high photon flux density (PPFD), and a quantitative response stimulating leaf phenotype and anatomy normally associated with acclimation to different LEDs. Leaf phenotype was influenced more by B LEDs than those grown under the R and W LEDs. However, single leaf fresh weight was higher in the plants treated with the B and W LEDs than the R LEDs., Chlorophyll content in the B LED-treated leaves was highest. Further, we observed that the B LEDs were associated with thicker leaf abaxial epidermal layers that may be related to greater leaf A and apparent enhancement of gs. In addition, the color and wavelength of the light altered stomatal characters such as length, width, and area of guard cells, and stomatal density (Figure 6). The B LED light also promoted more cylindrical palisade cell development than other LEDs, which may have led to increased A and higher chlorophyll content. Further studies are needed to elucidate the specific genetic mechanisms of LED responses of Eustoma leaves.
Supplementary Materials
Figure S1 is available online at www.mdpi.com/2311-7524/3/4/50/s1.
Acknowledgments
This research was supported by the Laboratory of Floriculture and Vegetable Science, Kochi University, Japan. MZK Roni thanks the Japanese Government for providing a scholarship (Monbukagakusho: MEXT). We thank Yuta Inoue for his help in photosynthesis measurement using an LI-Core 6400 XT portable photosynthesis system. We also thank Kazutoshi Hamada for his support during microscopic and image analysis.
Author Contributions
All authors contributed sufficiently to this work. Md Zohurul Kadir Roni conducted and designed the experiments, analyzed the data, and wrote the manuscript; Md Saiful Islam observed the experiments and revised the manuscript, and Kazuhiko Shimasaki supervised the analysis and edited the manuscript. All authors discussed the results and implications and commented on the manuscript at all stages.
Conflicts of Interest
The authors declare no conflict of interest.
Abbreviations
| LED | Light-emitting diode |
| B | Blue |
| R | Red |
| W | White |
| A | Photosynthetic rate |
| gs | Stomatal conductance |
| E | Transpiration |
| Ci | Intercellular CO2 concentration |
| PPFD | Photosynthetic photon flux density |
| PSI and PSII | Photosystem I and II |
| NPQ | Non-photochemical quenching |
| RuBP | Ribulose 1,5-biphosphate |
| RuBisCO | Ribulose-1,5-bisphosphate carboxylase oxygenase |
References
- Massa, G.D.; Kim, H.-H.; Wheeler, R.M.; Mitchell, C.A. Plant productivity in response to LED lighting. HortScience 2008, 43, 1951–1956. [Google Scholar]
- Marcelis, L.F.M.; Elings, A.; Bakker, M.; Brajeul, E.; Dieleman, J.A.; de Visser, P.H.B.; Heuvelink, E. Modelling dry matter production and partitioning in sweet pepper. Acta Hortic. 2006, 718, 121–128. [Google Scholar] [CrossRef]
- Mitchell, C.A. Plant lighting in controlled environments for space and earth applications. Acta Hortic. 2012, 956, 23–36. [Google Scholar] [CrossRef]
- Poulet, L.; Massa, G.D.; Morrow, R.C.; Bourget, C.M.; Wheeler, R.M.; Mitchell, C.A. Significant reduction in energy for plant-growth lighting in space using targeted LED lighting and spectral manipulation. Life Sci. Space Res. 2014, 2, 43–53. [Google Scholar] [CrossRef]
- Morrow, R.C. LED lighting in horticulture. HortScience 2008, 43, 1947–1950. [Google Scholar]
- Pfündel, E.; Baake, E. A quantitative description of fluorescence excitation spectra in intact bean leaves greened under intermittent light. Photosynth. Res. 1990, 26, 19–28. [Google Scholar] [PubMed]
- Christie, J.M. Phototropin blue-light receptors. Annu. Rev. Plant Biol. 2007, 58, 21–45. [Google Scholar] [CrossRef] [PubMed]
- Inoue, S.I.; Kinoshita, T.; Matsumoto, M.; Nakayama, K.I.; Doi, M.; Shimazaki, K. Blue light-induced autophosphorylation of phototropin is a primary step for signaling. Proc. Natl. Acad. Sci. USA 2008, 105, 5626–5631. [Google Scholar] [CrossRef] [PubMed]
- Wang, H.; Gu, M.; Cui, J.; Shi, K.; Zhou, Y.; Yu, J. Effects of light quality on CO2 assimilation, chlorophyll-fluorescence quenching, expression of Calvin cycle genes and carbohydrate accumulation in Cucumis sativus. J. Photochem. Photobiol. B Biol. 2009, 96, 30–37. [Google Scholar] [CrossRef] [PubMed]
- Islam, M.A.; Kuwar, G.; Clarke, J.L.; Blystad, D.R.; Gislerød, H.R.; Olsen, J.E.; Torre, S. Artificial light from light emitting diodes (LEDs) with a high portion of blue light results in shorter poinsettias compared to high pressure sodium (HPS) lamps. Sci. Hortic. 2012, 147, 136–143. [Google Scholar] [CrossRef]
- Nascimento, L.; Leal-Costa, M.V.; Coutinho, M.A.; Moreira, N.D.S.; Lage, C.L.; Barbi, N.D.S.; Tavares, E.S. Increased antioxidant activity and changes in phenolic profile of Kalanchoe pinnata (Lamarck) Persoon (Crassulaceae) specimens grown under supplemental blue light. Photochem. Photobiol. 2013, 89, 391–399. [Google Scholar] [CrossRef] [PubMed]
- Johkan, M.; Shoji, K.; Goto, F.; Hashida, S.N.; Yoshihara, T. Blue light-emitting diode light irradiation of seedlings improves seedling quality and growth after transplanting in red leaf lettuce. HortScience 2010, 45, 1809–1814. [Google Scholar]
- Appelgren, M. Effects of light quality on stem elongation of Pelargonium in vitro. Sci Hortic. 1991, 45, 345–351. [Google Scholar] [CrossRef]
- Sæbø, A.; Krekling, T.; Appelgren, M. Light quality affects photosynthesis and leaf anatomy of birch plantlets in vitro. Plant Cell Tissue Organ Cult. 1995, 41, 177–185. [Google Scholar] [CrossRef]
- Briggs, W.R.; Huala, E. Blue-light photoreceptors in higher plants. Annu. Rev. Cell Dev. Biol. 1999, 15, 33–62. [Google Scholar] [CrossRef] [PubMed]
- Ouzounis, T.; Parjikolaei, B.R.; Fretté, X.; Rosenqvist, E.; Ottosen, C.O. Predawn and high intensity application of supplemental blue light decreases the quantum yield of PSII and enhances the amount of phenolic acids, flavonoids, and pigments in Lactuca sativa. Front. Plant Sci. 2015, 6, 1–14. [Google Scholar] [CrossRef] [PubMed]
- Hogewoning, S.W.; Trouwborst, G.; Maljaars, H.; Poorter, H.; van Ieperen, W.; Harbinson, J. Blue light dose–responses of leaf photosynthesis, morphology, and chemical composition of Cucumis sativus grown under different combinations of red and blue light. J. Exp. Bot. 2010, 61, 3107–3117. [Google Scholar] [CrossRef] [PubMed]
- Tran, L.H.; Jung, S. Effects of light-emitting diode irradiation on growth characteristics and regulation of porphyrin biosynthesis in rice seedlings. Int. J. Mol. Sci. 2017, 18, 641. [Google Scholar] [CrossRef] [PubMed]
- Shimazaki, K.; Doi, M.; Assmann, S.M.; Kinoshita, T. Light regulation of stomatal movement. Annu. Rev. Plant Biol. 2007, 58, 219–247. [Google Scholar] [CrossRef] [PubMed]
- Mott, K.A.; Sibbernsen, E.D.; Shope, J.C. The role of the mesophyll in stomatal responses to light and CO2. Plant Cell Environ. 2008, 31, 1299–1306. [Google Scholar] [CrossRef] [PubMed]
- Kim, T.H.; Böhmer, M.; Hu, H.; Nishimura, N.; Schroeder, J.I. Guard cell signal transduction network: Advances in understanding abscisic acid, CO2, and Ca2+ signaling. Annu. Rev. Plant Biol. 2010, 61, 561–591. [Google Scholar] [CrossRef] [PubMed]
- Kim, J.A.; Kim, J.S.; Hong, J.K.; Lee, Y.-H.; Choi, B.S.; Seol, Y.J.; Jeon, C.H. Comparative mapping, genomic structure, and expression analysis of eight pseudo-response regulator genes in Brassica rapa. Mol. Genet. Genom. 2012, 287, 373–388. [Google Scholar] [CrossRef] [PubMed]
- Wang, Y.; Noguchi, K.; Terashima, I. Photosynthesis Dependent and -independent responses of stomata to blue, red and green monochromatic light: Differences between the normally oriented and inverted leaves of sunflower. Plant Cell Physiol. 2011, 52, 479–489. [Google Scholar] [CrossRef] [PubMed]
- Kozai, T.; Niu, G. Chapter 27—Challenges for the next-generation PFAL. In Plant Factory: An Indoor Vertical Farming System for Efficient Quality Food Production, 1st ed.; Kozai, T., Niu, G., Takagaki, M., Eds.; Academic Press Elsevier: Amsterdam, The Netherlands, 2016; pp. 387–393. [Google Scholar]
- Monteith, J.; Unsworth, M. Principles of Environmental Physics; Academic Press: Elsevier, London, UK, 2007. [Google Scholar]
- Niinemets, Ü. Responses of forest trees to single and multiple environmental stresses from seedlings to mature plants: Past stress history, stress interactions, tolerance and acclimation. For. Ecol. Manag. 2010, 260, 1623–1639. [Google Scholar] [CrossRef]
- Yamori, W.; Takahashi, S.; Makino, A.; Price, G.D.; Badger, M.R.; Von Caemmerer, S. The roles of ATP synthase and the cytochrome b6/f complexes in limiting chloroplast electron transport and determining photosynthetic capacity. Plant Physiol. 2011, 155, 956–962. [Google Scholar] [CrossRef] [PubMed]
- Marchese, J.A.; Mattana, R.S.; Ming, L.C.; Broetto, F.; Vendramini, P.F.; Moraes, R.M. Irradiance stress responses of gas exchange and antioxidant enzyme contents in pariparoba [Pothomorphe umbellata (L.) Miq.] plants. Photosynthetica 2005, 46, 501–505. [Google Scholar] [CrossRef]
- Li, T.; Heuvelink, E.; Dueck, T.A.; Janse, J.; Gort, G.; Marcelis, L.F.M. Enhancement of crop photosynthesis by diffuse light: Quantifying the contributing factors. Ann. Bot. 2014, 114, 145–156. [Google Scholar] [CrossRef] [PubMed]
- Ruzin, S.E. Plant Microtechnique and Microscopy; Oxford University Press: New York, NY, USA, 1999; Volume 198. [Google Scholar]
- Zeng, B.; Wang, Q.Y.; Tang, C.M. Anatomic analysis on heterosis in three transgenic bt pest-resistant hybrid cotton (G. hirsutum L.). Acta Agron. Sin. 2008, 34, 496–505. [Google Scholar] [CrossRef]
- Whitelam, G.; Halliday, K. Light and Plant Development; Blackwell Publishing: Oxford, UK, 2007. [Google Scholar]
- Chen, X.L.; Guo, W.Z.; Xue, X.Z.; Wang, L.C.; Qiao, X.J. Growth and quality responses of ‘Green Oak Leaf’lettuce as affected by monochromic or mixed radiation provided by fluorescent lamp (FL) and light-emitting diode (LED). Sci. Hortic. 2014, 172, 168–175. [Google Scholar] [CrossRef]
- Frąszczak, B.; Golcz, A.; Zawirska-Wojtasiak, R.; Janowska, B. Growth rate of sweet basil and lemon balm plants grown under fluorescent lamps and led modules. Acta Sci. Pol. Hortorum Cultus 2014, 13, 3–13. [Google Scholar]
- Tsukaya, H. The leaf index: Heteroblasty, natural variation and the genetic control of polar processes of leaf expansion. Plant Cell Physiol. 2002, 43, 372–378. [Google Scholar] [CrossRef] [PubMed]
- Hirose, F.; Inagaki, N.; Hanada, A.; Yamaguchi, S.; Kamiya, Y.; Miyao, A.; Hirochika, H.; Takano, M. Cryptochrome and phytochrome cooperatively but independently reduce active gibberellin content in rice seedlings under light irradiation. Plant Cell Physiol. 2012, 53, 1570–1582. [Google Scholar] [CrossRef] [PubMed]
- Godo, T.; Fujiwara, K.; Guan, K.; Miyoshi, K. Effects of wavelength of LED-light on in vitro asymbiotic germination and seedling growth of Bletilla ochracea Schltr.(Orchidaceae). Plant Biotechnol. 2011, 28, 397–400. [Google Scholar] [CrossRef]
- Kozuka, T.; Suetsugu, N.; Wada, M.; Nagatani, A. Antagonistic regulation of leaf flattening by phytochrome B and phototropin in Arabidopsis thaliana. Plant Cell Physiol. 2013, 54, 69–79. [Google Scholar] [CrossRef] [PubMed]
- Kim, K.; Kook, H.S.; Jang, Y.J.; Lee, W.H.; Kamala-Kannan, S.; Chae, J.C.; Lee, K.J. The effect of blue-light-emitting diodes on antioxidant properties and resistance to Botrytis cinerea in tomato. J. Plant Pathol. Microb. 2013, 4, 203. [Google Scholar]
- Wilson, D.; Cooper, J.P. Effect of light intensity during growth on leaf anatomy and subsequent light-saturated photosynthesis among contrasting lolium genotypes. New Phytol. 1969, 68, 1125–1135. [Google Scholar] [CrossRef]
- Ye, Y.M.; Tong, J.; Shi, X.P.; Yuan, W.; Li, G.R. Morphological and cytological studies of diploid and colchicine-induced tetraploid lines of crape myrtle (Lagerstroemia indica L.). Sci. Hortic. 2010, 124, 95–101. [Google Scholar] [CrossRef]
- Mortensen, L.M.; Strømme, E. Effects of light quality on some greenhouse crops. Sci. Hortic. 1987, 33, 27–36. [Google Scholar] [CrossRef]
- Zhang, G.; Shen, S.; Takagaki, M.; Kozai, T.; Yamori, W. Supplemental upward lighting from underneath to obtain higher marketable lettuce (Lactuca sativa) leaf fresh weight by retarding senescence of outer leaves. Front. Plant Sci. 2015, 6, 1110. [Google Scholar] [CrossRef] [PubMed]
- Dougher, T.A.; Bugbee, B. Differences in the response of wheat, soybean and lettuce to reduced blue radiation. Photochem. Photobiol. 2001, 73, 199–207. [Google Scholar] [CrossRef]
- Wang, X.Y.; Xu, X.M.; Cui, J. The importance of blue light for leaf area expansion, development of photosynthetic apparatus, and chloroplast ultrastructure of Cucumis sativus grown under weak light. Photosynthetica 2015, 53, 213–222. [Google Scholar] [CrossRef]
- Davies, K. (Ed.) Plant pigments and their manipulation. Annu. Plant Rev. 2004, 14, 1–342. [Google Scholar]
- Buschmann, C.; Meier, D.; Kleudgen, H.K.; Lichtenthaler, H.K. Regulation of chloroplast development by red and blue light. Photochem. Photobiol. 1978, 27, 195–198. [Google Scholar] [CrossRef]
- Lamb, J.J.; Eaton-Rye, J.J.; Hohmann-Marriott, M.F. An LED-based fluorometer for chlorophyll quantification in the laboratory and in the field. Photosynth. Res. 2012, 114, 59–68. [Google Scholar] [CrossRef] [PubMed]
- Lin, K.H.; Huang, M.Y.; Huang, W.D.; Hsu, M.H.; Yang, Z.W.; Yang, C.M. The effects of red blue and white light-emitting diodes on the growth development and edible quality of hydroponically grown lettuce (Lactuca sativa L. var. Capitata). Sci. Hortic. 2013, 150, 86–91. [Google Scholar] [CrossRef]
- Maxwell, K.; Johnson, G.N. Chlorophyll fluorescence—A practical guide. J. Exp. Bot. 2000, 51, 659–668. [Google Scholar] [CrossRef] [PubMed]
- Muneer, S.; Kim, E.J.; Park, J.S.; Lee, J.H. Influence of green, red and blue light emitting diodes on multiprotein complex proteins and photosynthetic activity under different light intensities in lettuce leaves (Lactuca sativa L.). Int. J. Mol. Sci. 2014, 15, 4657–4670. [Google Scholar] [CrossRef] [PubMed]
- Matsuda, R.; Ohashi-Kaneko, K.; Fujiwara, K.; Goto, E.; Kurata, K. Photosynthetic characteristics of rice leaves grown under red light with or without supplemental blue light. Plant Cell Physiol. 2004, 45, 1870–1874. [Google Scholar] [CrossRef] [PubMed]
- Yano, A.; Fujiwara, K. Plant lighting system with five wavelength-band light-emitting diodes providing photon flux density and mixing ratio control. Plant Methods. 2012, 8, 46. [Google Scholar] [CrossRef] [PubMed]
- Lanoue, J.; Leonardos, E.D.; Ma, X.; Grodzinski, B. The effect of spectral quality on daily patterns of gas exchange, biomass gain, and water-use-efficiency in tomatoes and lisianthus: An assessment of whole plant measurements. Front. Plant Sci. 2017, 8, 1–15. [Google Scholar] [CrossRef] [PubMed]
- Kim, H.H.; Goins, G.D.; Wheeler, R.M.; Sager, J.C. Green-light supplementation for enhanced lettuce growth under red- and blue-light-emitting diodes. HortScience 2004, 39, 1617–1622. [Google Scholar]
- Sabir, A.; Yazar, K. Diurnal dynamics of stomatal conductance and leaf temperature of grapevines (Vitis vinifera L.) in response to daily climatic variables. Acta Sci. Pol. Hortorum Cultus 2015, 14, 3–15. [Google Scholar]
- Savvides, A.; Fanourakis, D.; van Ieperen, W. Co-ordination of hydraulic and stomatal conductances across light qualities in cucumber leaves. J. Expt. Bot. 2012, 63, 1135–1143. [Google Scholar] [CrossRef] [PubMed]
- Hernández, R.; Kubota, C. Physiological responses of cucumber seedlings under different blue and red photon flux ratios using LEDs. Environ. Exp. Bot. 2016, 121, 66–74. [Google Scholar] [CrossRef]
- Whiteman, P.C.; Koller, D. Interactions of carbon dioxide concentration, light intensity and temperature on plant resistance to water vapour and carbon dioxide diffusion. New Phytol. 1967, 66, 463–473. [Google Scholar] [CrossRef]
- Lawson, T.; Oxborough, K.; Morison, J.I.; Baker, N.R. The responses of guard and mesophyll cell photosynthesis to CO2, O2, light, and water stress in a range of species are similar. J. Exp. Bot. 2003, 54, 1743–1752. [Google Scholar] [CrossRef] [PubMed]
- Morison, J.I.; Gallouët, E.; Lawson, T.; Cornic, G.; Herbin, R.; Baker, N.R. Lateral diffusion of CO2 in leaves is not sufficient to support photosynthesis. Plant Physiol. 2005, 139, 254–266. [Google Scholar] [CrossRef] [PubMed]
- Farquhar, G.D.; Sharkey, T.D. Stomatal conductance and photosynthesis. Annu. Rev. Plant Physiol. 1982, 33, 317–345. [Google Scholar] [CrossRef]
- Wang, F.; Coe, R.A.; Karki, S.; Wanchana, S.; Thakur, V.; Henry, A.; Lin, H.C.; Huang, J.; Peng, S.; Quick, W.P. Overexpression of Ossap16 regulates photosynthesis and the expression of a broad range of stress response genes in rice (Oryza sativa L.). PLoS ONE 2016, 11, e0157244. [Google Scholar] [CrossRef] [PubMed]
- Kim, H.H.; Wheeler, R.M.; Sager, J.C.; Goins, G.D.; Norikane, J.H. Evaluation of lettuce growth using supplemental green light with red and blue light-emitting diodes in a controlled environment—A review of research at Kennedy Space Center. Acta Hortic. 2006, 711, 111–119. [Google Scholar] [CrossRef]
- Yarkhunova, Y.; Edwards, C.E.; Ewers, B.E.; Baker, R.L.; Aston, T.L.; McClung, C.R.; Lou, P.; Weinig, C. Selection during crop diversification involves correlated evolution of the circadian clock and ecophysiological traits in Brassica rapa. New Phytol. 2016, 210, 133–144. [Google Scholar] [CrossRef] [PubMed]
- Kozuka, T.; Kong, S.G.; Doi, M.; Shimazaki, K.I.; Nagatani, A. Tissue-autonomous promotion of palisade cell development by phototropin 2 in Arabidopsis. Plant Cell 2011, 23, 3684–3695. [Google Scholar] [CrossRef] [PubMed]
- Fukuda, N.; Fujita, M.; Ohta, Y.; Sase, S.; Nishimura, S.; Ezura, H. Directional blue light irradiation triggers epidermal cell elongation of abaxial side resulting in inhibition of leaf epinasty in geranium under red light condition. Sci. Hortic. 2008, 115, 176–182. [Google Scholar] [CrossRef]
- Macedo, A.F.; Leal-Costa, M.V.; Tavares, E.S.; Lage, C.L.S.; Esquibel, M.A. The effect of light quality on leaf production and development of in vitro-cultured plants of Alternanthera brasiliana Kuntze. Environ. Exp. Bot. 2011, 70, 43–50. [Google Scholar] [CrossRef]
- Lee, S.H.; Tewari, R.K.; Hahn, E.J.; Paek, K.Y. Photon flux density and light quality induce changes in growth, stomatal development, photosynthesis and transpiration of Withania somnifera (L.) Dunal. plantlets. Plant Cell Tissue Organ Cult. 2007, 90, 141–151. [Google Scholar] [CrossRef]
- Hattori, T.; Sonobe, K.; Inanaga, S.; An, P.; Tsuji, W.; Araki, H.; Eneji, A.E.; Morita, S. Short term stomatal responses to light intensity changes and osmotic stress in sorghum seedlings raised with and without silicon. Environ. Exp. Bot. 2007, 60, 177–182. [Google Scholar] [CrossRef]
- Talbott, L.D.; Zhu, J.; Han, S.W.; Zeiger, E. Phytochrome and blue light-mediated stomatal opening in the orchid, paphiopedilum. Plant Cell Physiol. 2002, 43, 639–646. [Google Scholar] [CrossRef] [PubMed]
- Wang, J.; Lu, W.; Tong, Y.; Yang, Q. Leaf morphology, photosynthetic performance, chlorophyll fluorescence, stomatal development of lettuce (Lactuca sativa L.) exposed to different ratios of red light to blue light. Front. Plant Sci. 2016, 7, 1–10. [Google Scholar] [CrossRef] [PubMed]
- Kollist, H.; Nuhkat, M.; Roelfsema, M. Closing gaps: Linking elements that control stomatal element. New Phytol. 2014, 203, 44–62. [Google Scholar] [CrossRef] [PubMed]
- Sakhonwasee, S.; Tummachai, K.; Nimnoy, N. Influences of LED light quality and intensity on stomatal behavior of three petunia cultivars grown in a semi-closed system. Environ. Control Biol. 2017, 55, 93–103. [Google Scholar] [CrossRef]
Figure 1.
Effect of blue, red, and white LEDs on leaf traits of Eustoma. (A1), leaf length (cm); (A2), leaf width (cm); (A3), leaf thickness (mm); (A4), single leaf weight (g); (B1), leaf area (cm2); (B2), chlorophyll content; and (C), leaf morphology. Data are mean values (n = 10) and the vertical bars represent ± SE (Tukey’s HSD at P < 0.05).


Figure 2.
Effects of blue, red, and white LED light on leaf gas exchange at different photosynthetic photon flux densities (PPFD) in Eustoma leaves. (A), A (μmol CO2 m−2 s−1); (B), gs (mol H2O m−2 s−1); (C), E (mmol H2O m−2 s−1), and (D), Ci (μmol CO2 mol−1). Data represent means ± SE (n = 10); asterisks indicate a significant difference among the LED treatments at P < 0.01 (**) by Tukey’s HSD-test. The SE bar may not be seen on data points due their small values.

Figure 3.
Correlation between photosynthetic rate (A) and stomatal conductance (gs) in Eustoma leaves under blue, red, and white LEDs at different PPFDs. Data are mean values (n = 10); the vertical and horizontal bars represent ± SE. All R2 values are statistically significant at P < 0.01.
Figure 3.
Correlation between photosynthetic rate (A) and stomatal conductance (gs) in Eustoma leaves under blue, red, and white LEDs at different PPFDs. Data are mean values (n = 10); the vertical and horizontal bars represent ± SE. All R2 values are statistically significant at P < 0.01.

Figure 4.
Effect of blue, red, and white LEDs on the leaf anatomy of Eustoma: (A1), adaxial layer (µm) and (A2), abaxial layer (µm); (B1), palisade cell height (µm) and (B2), palisade cell width (µm). Representative cross-sections showing anatomical parameters of the adaxial and abaxial epidermal layers in Eustoma leaves under B, R, and W LEDs: (C1), blue (B); (C2), red (R), and (C3), white (W) LEDs. Data are mean values (n = 10) and the vertical bars represent ± SE (Tukey’s HSD at P < 0.05).

Figure 5.
Effect of B, R, and W LED light on stomatal characteristics of the abaxial layer of Eustoma leaves. (A1), guard cell length (µm); (A2), guard cell breadth (µm); (A3), guard cell area (µm2); and (A4), stomatal density (mm2). Distribution and anatomical parameters of the stomata in the abaxial epidermal layer of Eustoma leaves using blue, red, and white LEDs from representative cross-sections. (B1,b1), blue; (B2,b2), red; and (B3,b3), white LED light. Data are mean values (n = 10), the vertical bars represent ± SE, and means are separated by Tukey’s HSD at P < 0.05.
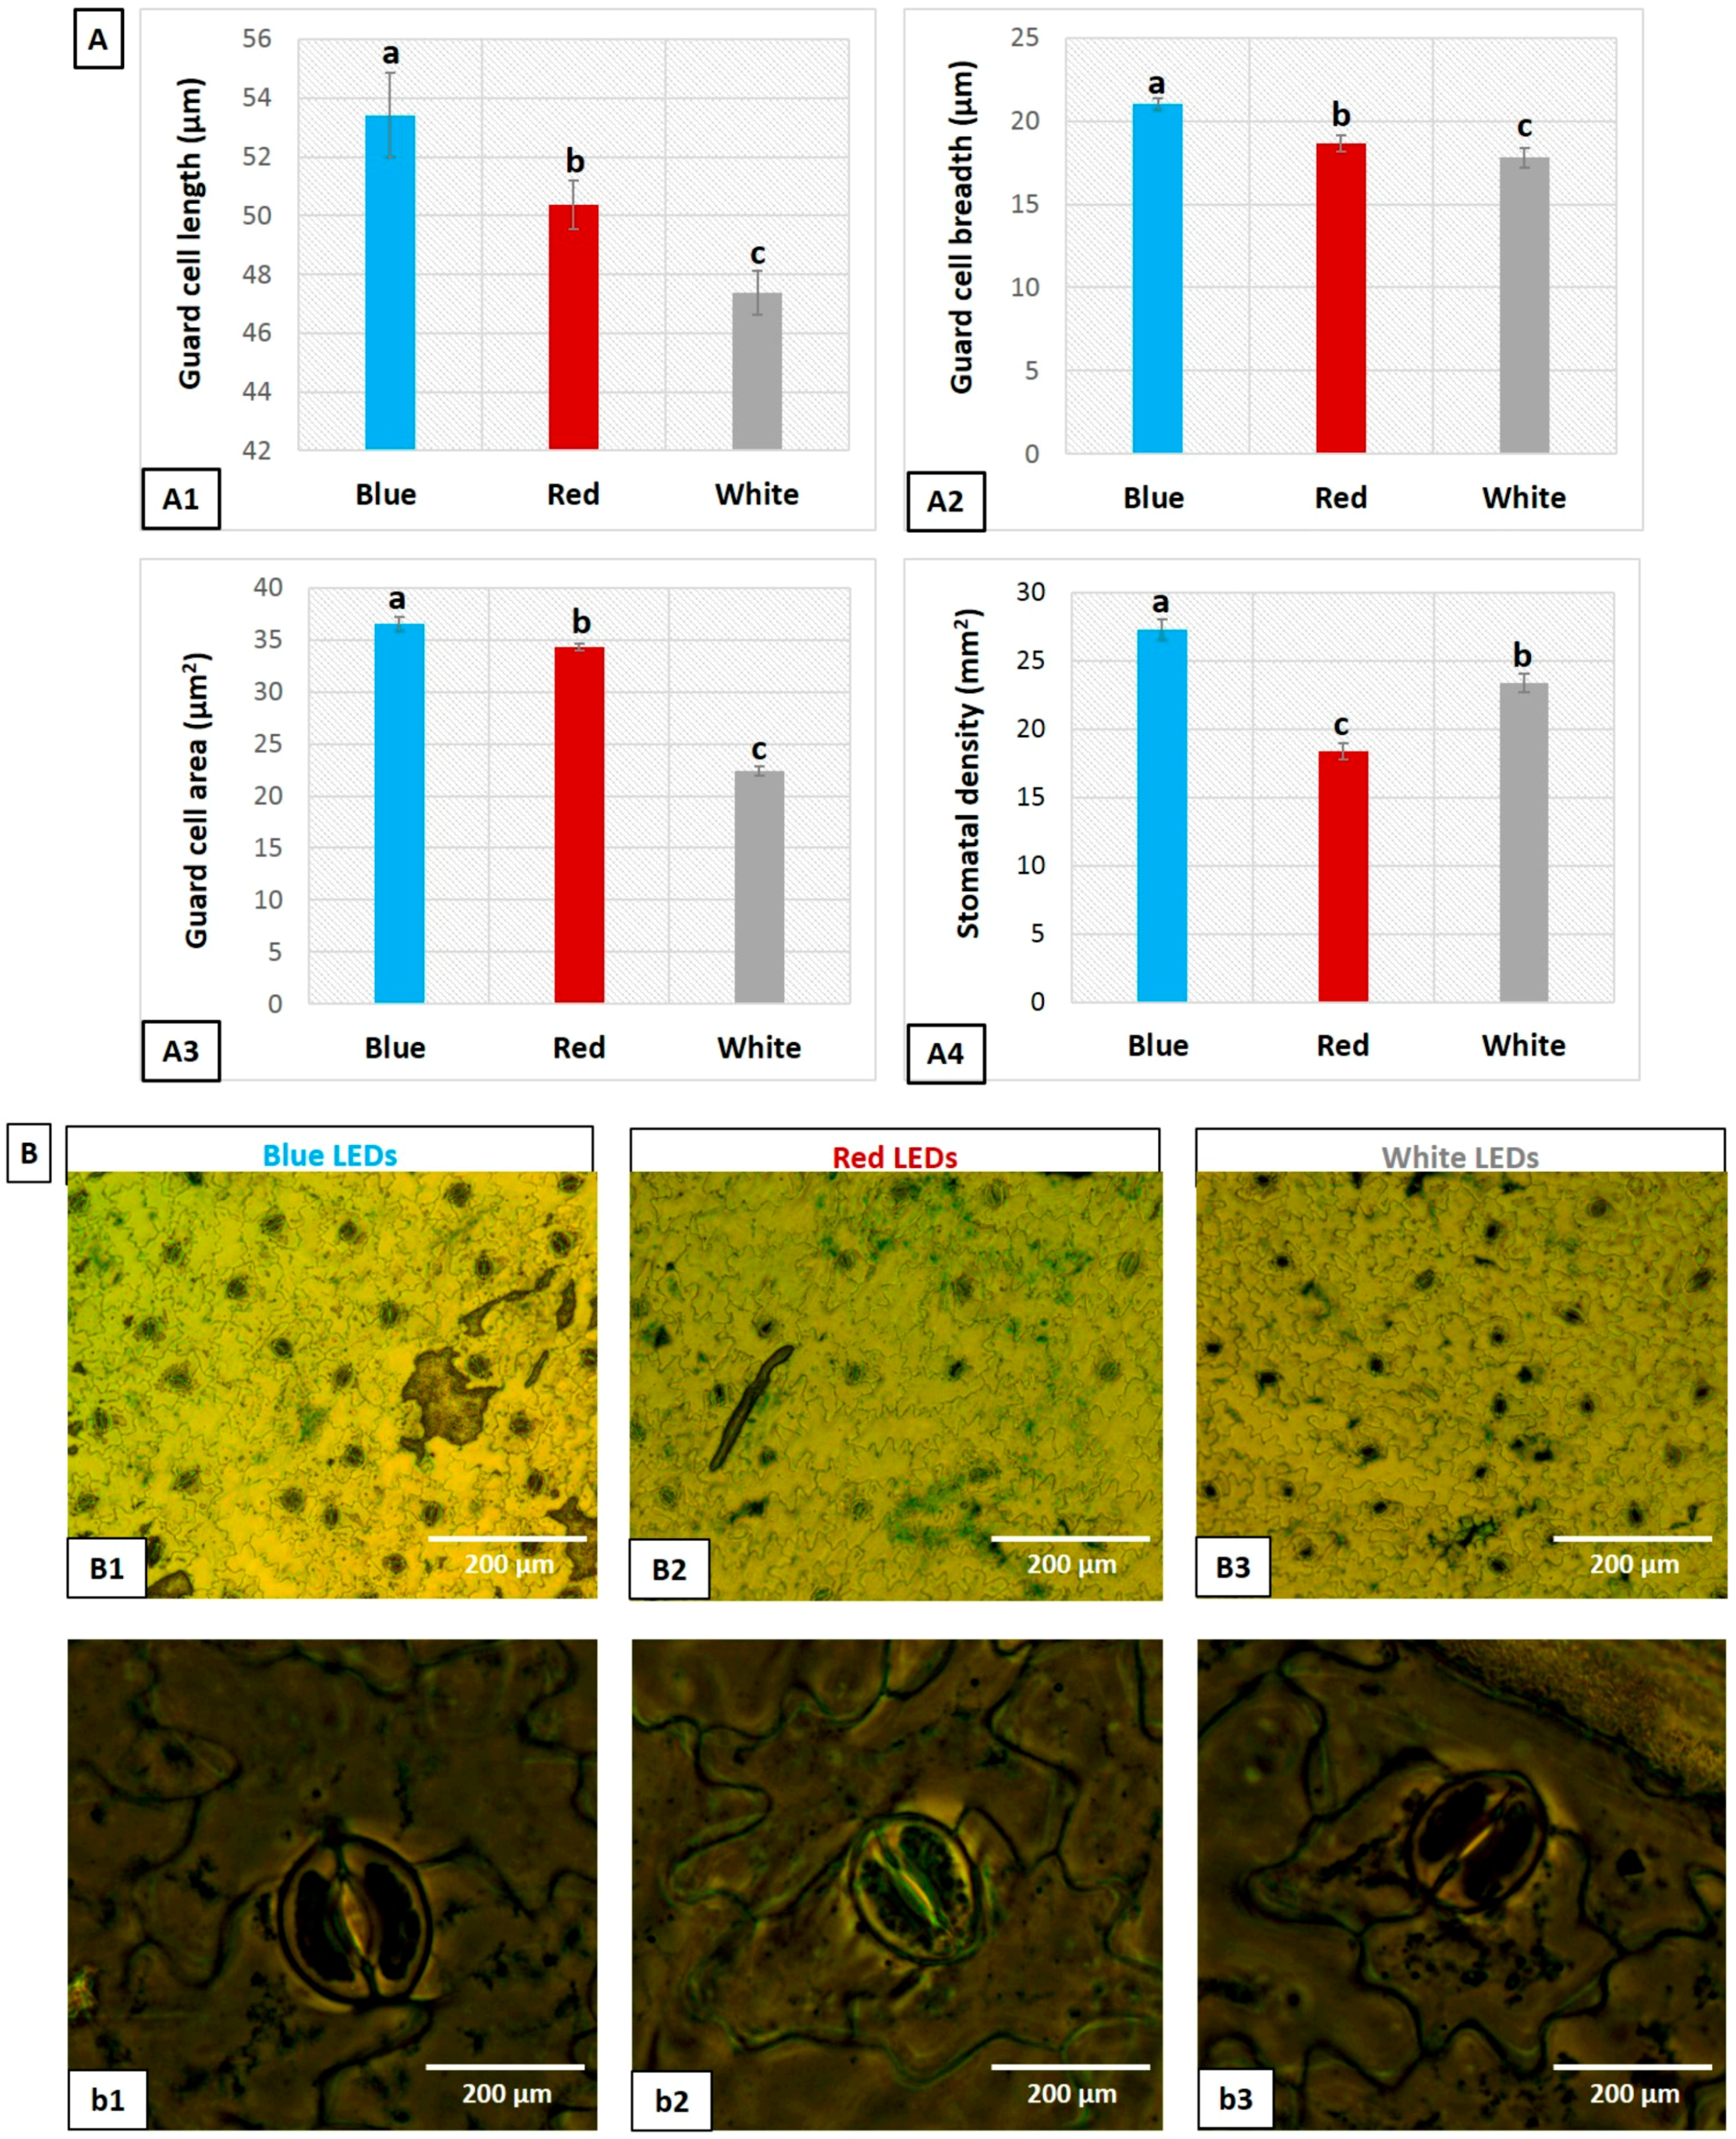
Figure 6.
Hypothetical representation of leaf gas exchange, photosynthetic performance, epidermal layer thickness, palisade cell, and stomatal opening traits under blue, red and white LED light. PCH = palisade cell height, PCB = palisade cell breadth, GCL = guard cell length, GCB = guard cell breadth and GCA = guard cell area. Palisade cell image bar = 100 µm.
© 2017 by the authors. Licensee MDPI, Basel, Switzerland. This article is an open access article distributed under the terms and conditions of the Creative Commons Attribution (CC BY) license (http://creativecommons.org/licenses/by/4.0/).
Share and Cite
MDPI and ACS Style
Roni, M.Z.K.; Islam, M.S.; Shimasaki, K. Response of Eustoma Leaf Phenotype and Photosynthetic Performance to LED Light Quality. Horticulturae 2017, 3, 50. https://doi.org/10.3390/horticulturae3040050
AMA Style
Roni MZK, Islam MS, Shimasaki K. Response of Eustoma Leaf Phenotype and Photosynthetic Performance to LED Light Quality. Horticulturae. 2017; 3(4):50. https://doi.org/10.3390/horticulturae3040050
Chicago/Turabian StyleRoni, Md Zohurul Kadir, Md Saiful Islam, and Kazuhiko Shimasaki. 2017. "Response of Eustoma Leaf Phenotype and Photosynthetic Performance to LED Light Quality" Horticulturae 3, no. 4: 50. https://doi.org/10.3390/horticulturae3040050
Note that from the first issue of 2016, this journal uses article numbers instead of page numbers. See further details here.