Effect of Irrigation on Growth, Yield, and Chemical Composition of Two Green Bean Cultivars


1
Horticultural Crops Technology Department, National Research Centre, 12622 Dokki, Giza, Egypt
2
Beijing Vegetable Research Center, Beijing Academy of Agriculture and Forestry Sciences, Beijing 100097, China
3
INRES, Division for Horticultural Science, University of Bonn, D-53121 Bonn, Germany
*
Author to whom correspondence should be addressed.
Horticulturae 2018, 4(1), 3; https://doi.org/10.3390/horticulturae4010003
Submission received: 20 November 2017
/
Revised: 2 February 2018
/
Accepted: 7 February 2018
/
Published: 13 February 2018
Abstract
:A study was conducted in an environmentally controlled greenhouse to evaluate two green bean cultivars, ‘Bronco’ and ‘Paulista’, under three application volumes of irrigation water based on replacing 100, 80, and 60% of evapotranspiration (ET). The experiment was in a split-plot design with three replications, recording vegetative growth, yield, pod parameters, water use efficiency (WUE), and chemical content of pods. The results showed that there were no differences between 80% ET and 100% ET for most parameters. In addition, 80% of ET increased the pod yield and improved the pod parameters and chemical composition. Therefore, this irrigation treatment can increase green bean productivity and improve pod quality. Reducing water application from 100 to 60% of ET progressively increased WUE. The ‘Bronco’ cultivar had a higher plant height, pod yield, WUE, pod weight, pod diameter, and total fiber amount than ‘Paulista’, while the ‘Paulista’ cultivar was superior in total chlorophyll, number of pods per plant, pod length, P, Ca, Mg, Fe, Cu, protein, vitamin C, titratable acid, and soluble sugar.
1. Introduction
Agriculture is the largest water consumer worldwide, using 70% of the total renewable fresh water resources, as reported by WWAP [1]. Declines in precipitation have a huge impact on agricultural production [1]. Water resources are a scarce and limiting factor for expanding cultivation and plant production in many arid and semi-arid areas, including Egypt, as reported by Quda [2]. Environmental stresses and climate change impact agricultural production and the food supply, and are the primary causes of crop losses, reducing average yields for most major crops by more than 50% [3,4]. According to Bisbis et al. [4], global warming is expected to increase both the mean temperature and temperature extremes in the future, thereby changing the production conditions for vegetables. Egypt is seeking to increase the cultivated area of vegetables as cash crops. However, limited agricultural land and water resources constrain ambitious expansion plans [5,6]. Therefore, Egypt initiated a strategic program aiming to reclaim 1.4 million hectares of desert during the coming years till 2020 [5]. Climate change has forced scientists and decision makers to think about the future of water resources [4] and their sustainability in a scarcity situation, taking into account less water coming from Ethiopia to Egypt and a high rate of population growth [2]. Therefore, Badr et al. [7] and Saleh et al. [8] recommend the use of modern irrigation systems such as drip or subsurface drip irrigation, instead of traditional surface irrigation. Efficient water delivery systems can contribute towards increased crop yield and improving crop water and fertilizer use efficiency [7]. In addition, improving water use efficiency (WUE) without any reduction in productivity to satisfy present and future requirements of a high population growth rate is a very important issue. This may help minimize water consumption, reduce losses of irrigation water, and increase cultivated area.
Green bean (Phaseolus vulgaris L.) is an important vegetable crop widely used as a protein source and for other nutrients in many developing countries. The total worldwide cultivated area of green beans is 1,527,613 hectares, producing 21,720,588 tons, as reported by FAO [9]. China is the world’s leading producer of green beans, with a total cultivated area of 635,385 hectares and a production of 17,031,702 tons [9]. In Egypt, green beans are a major cash crop, important not only for export but also for local markets, where it is an important protein source with high nutritional value for Egyptian families [10]. Approximately 3.5% of the total world production of green beans comes from Egypt [11].
The actual crop evapotranspiration (ETc) for green bean varies, according to previous investigations. Based on a lysimeter study, Tarantino and Rubino [12] calculated the seasonal water requirement for maximum bean yield as 235 L/m2. According to Sazen et al. [13], a significant linear relationship was found between supplied water and pod yield ranging from 276 to 472 L/m2 for green bean cultivated in the open field. El-Noemani et al. [11] recommended applying 371 L/m2 for maximum pod yield of green beans cultivated in an open field. Although there are several studies demonstrating the effects of a water regime on green bean in open fields [11,13,14,15], the results from such studies are limited only to the examined area and mostly done using a single cultivar. Thus, studies on green bean are needed under environmentally controlled conditions to determine the actual water requirement for more than one cultivar. In the present study, we evaluated two green bean cultivars, ‘Bronco’ and ‘Paulista’, grown with different amounts of irrigation water, aiming to find the optimum water volume and WUE and maximum productivity for each cultivar under environmentally controlled conditions.
2. Materials and Methods
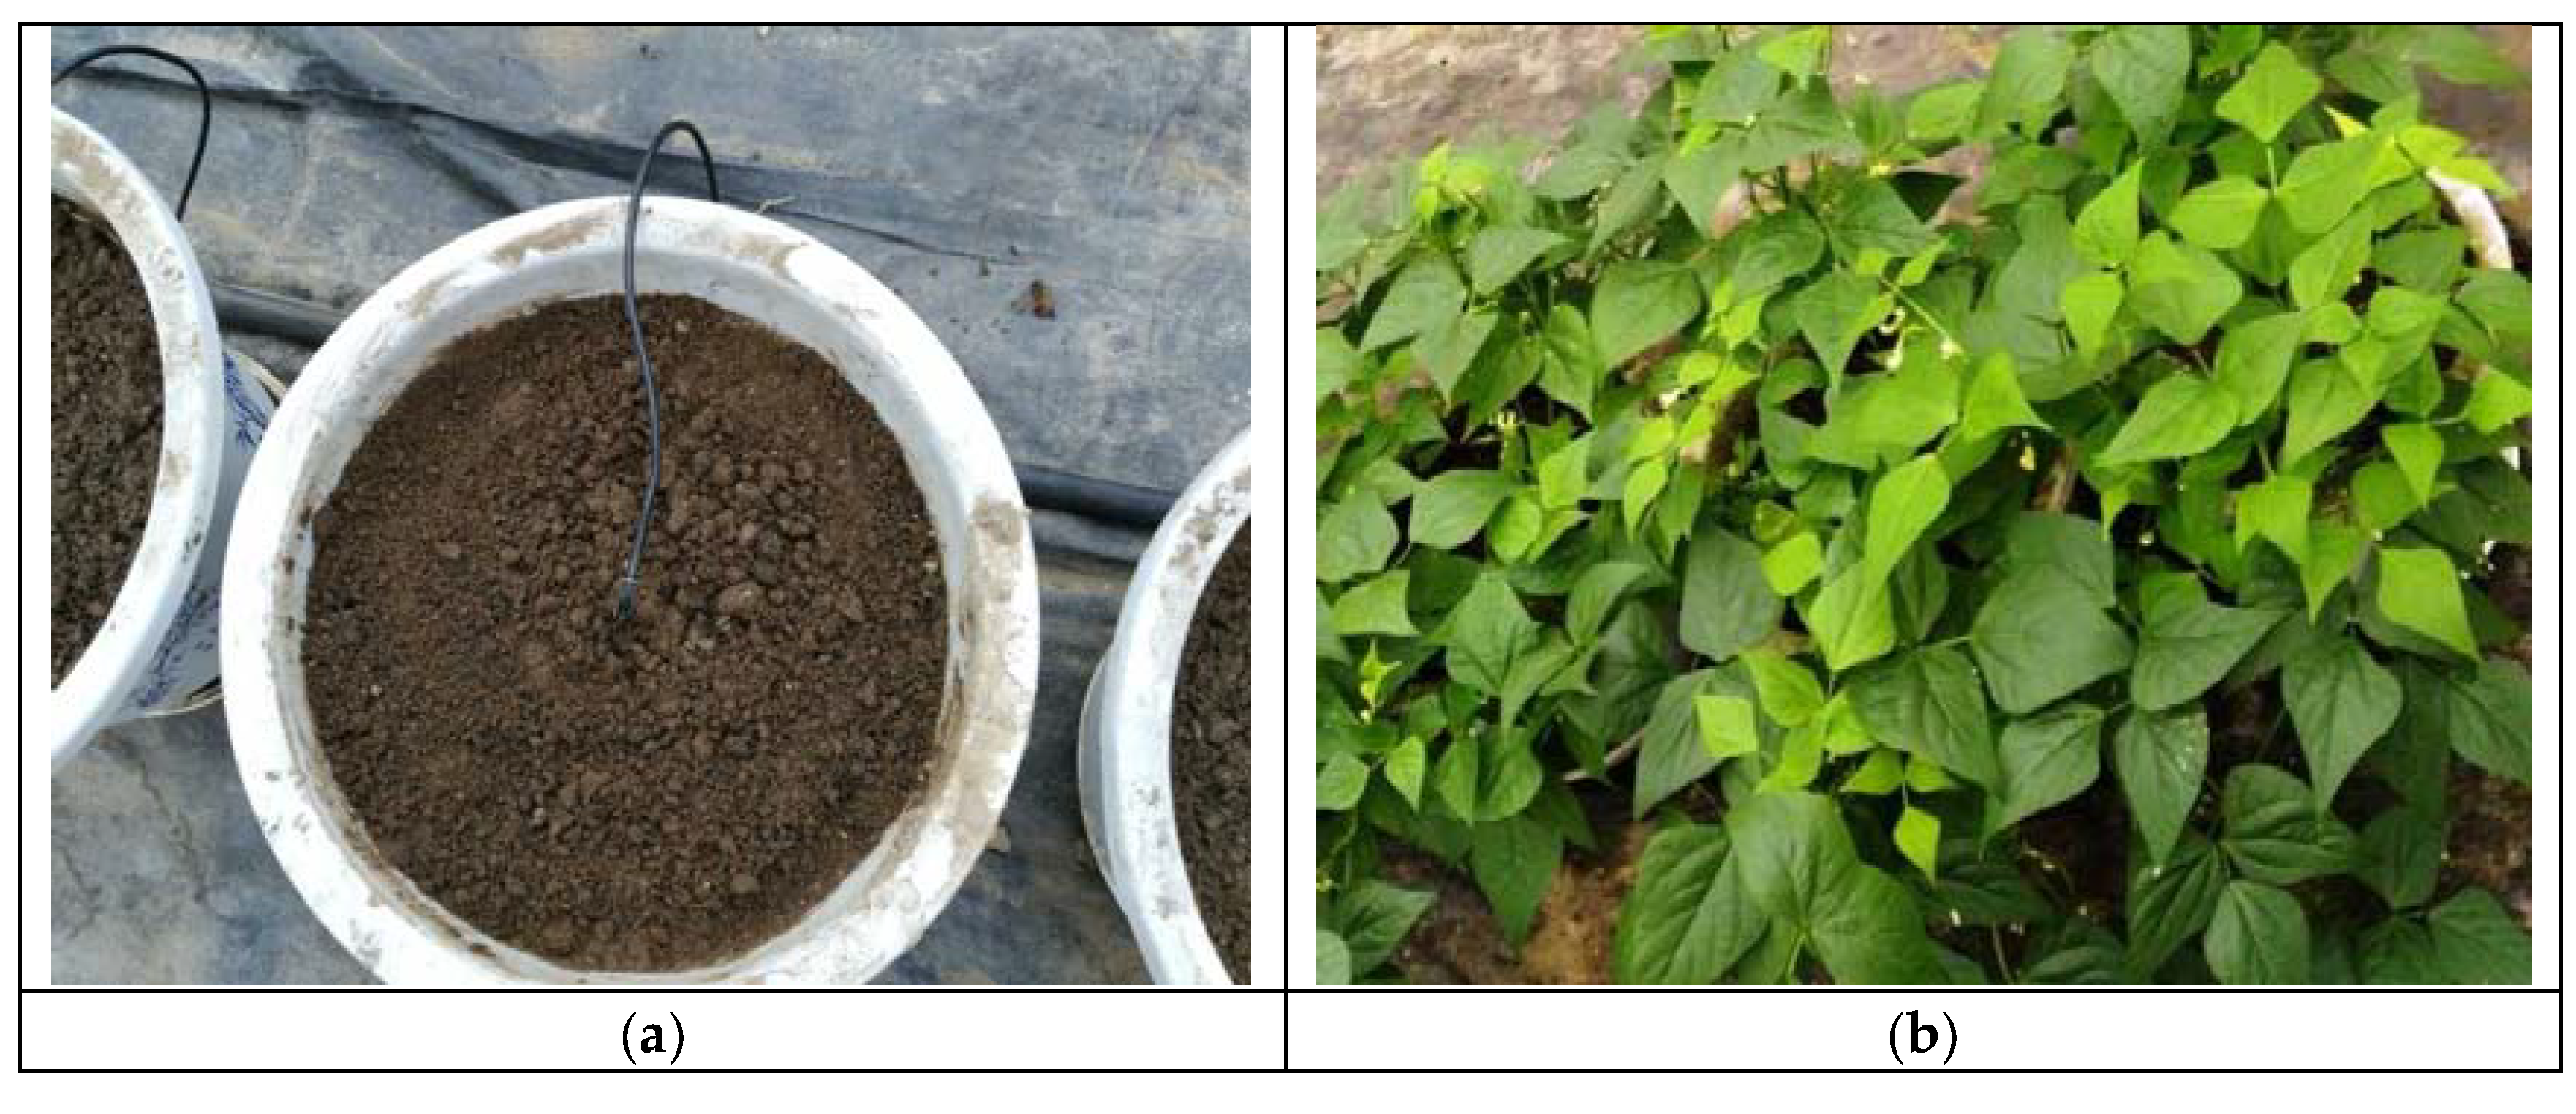
A study was conducted at the research station of Beijing Vegetable Research Center in Beijing, China in 2016, in an environmentally controlled greenhouse. The temperature inside the greenhouse ranged from 14 to 25 °C during the cultivation period from September to November. The maximum relative humidity ranged from 60 to 70%. Seed of two green bean cultivars, ‘Bronco’ and ‘Paulista’, were sown in plastic pots (37 × 40 cm), filled with silty clay soil (12 kg), and simple perlite layer (5 cm) in the bottom of the pots. Most green beans grown in open fields are cultivated in the same soil. Seed were sown (six seeds per pot) on the first day of September, two days after irrigation with 3.5 L per pot (drip system, Figure 1a).
The field capacity and wilting point of the soil were 33.1 and 15.9% (V/V), respectively. The chemical analysis of the soil is presented in Table 1.
Green bean seedlings were thinned to three plants per pot, when the first trifoliate leaf appeared and the plant reached approximately 10 cm in height. Subsequently, the plants were drip-irrigated at 9.00 a.m. at two-day intervals with three different application volumes of irrigation water according to the ET equation. The water volume gradually increased from September to October, tending to remain almost constant during the harvest period, and decreased at the end of November. The water requirement for green bean plants was calculated based on the following formulas, according to Allen et al. [16]:
where:
ET0 = Epan × Kp
CU = ET0 × Kc
WR = CU × L%,
- ETo: Reference evapotranspiration. Epan: Pan evaporation in mm.
- Kp: Pan coefficient (constant, 0.85). CU: Water consumption.
- WR: Water requirement (L/m2). L%: Leaching factor (1.25%).
- Kc: Crop coefficient (variable 0.5:1.0, depending on the plant growth stage.
The total water volumes applied were 261, 209, and 157 L/m2, calculated as 100, 80, and 60% of evapotranspiration, respectively.
The experimental design was a two-factorial split-plot with three replications. The three treatments: 100, 80, and 60% of evapotranspiration (ET), were assigned as the main-plots, factor A; the green bean cultivars represent the sub-plots, factor B. Each sub-plot area contained 13 pots and each pot contained three plants. The complete nutrient solution containing essential elements was added weekly to all experimental plots, 0.5L–1.0L per pot. The nutrient solution contained macroelements (mg/L): 210 N, 31 P, 234 K, 200 Ca, 48 Mg, and 64 S and microelements (mg/L), i.e., 5 Fe, 0.5 Mn, 0.05 Zn, 0.02 Cu, 0.5 B and 0.01 Mo. Green pods were harvested manually when they reached the marketing stage, on three harvest dates. Other agricultural practices, e.g., harvest, pest control, etc., were applied whenever they were deemed necessary and as commonly recommended in the commercial production of green beans at the local experimental site.
Evaluated Parameters
The following parameters were measured:
- Vegetative growth parameters: A representative sample of 10 plants from each plot were randomly selected to record plant height (cm), number of leaves per plant, number of branches per plant, fresh weight (g), and dry matter percent (%) after drying samples at 70 °C for three days, as well as total chlorophyll (SPAD values) using a digital Minolta Chlorophyll Meter (SPAD-501), 45 days after sowing (flowering stage, Figure 1b).
- Pod yield: The green pods were harvested on three weekly dates, starting 60 days after sowing. Pod yield was calculated as g pods per m2 and number of pods per plant.
- Water use efficiency (WUE) was calculated as pod yield (g) vs. supplied water (L).
- Pod traits: Weight (g), length (cm), and diameter (cm) were determined using random representative samples.
- Chemical composition: Representative green pod samples from each plot were selected for chemical analysis to determine the macronutrients N, P, K, Ca, and Mg, and the micronutrients Fe, Mn, Zn, and Cu (ICP-AES method, NY/T 1653-2008) [17], as well as other chemical constituents related to pod quality, including protein (Kjeldahl method), vitamin C (2,6-dichloroindophenol titration), fiber (total dietary fiber), titratable acid (alkali titration), and soluble sugars (anthrone colorimetry), according to Nielsen [18].
Statistical Analysis
The treatment effects were evaluated by analysis of variance. The mean values were compared using Duncan’s multiple range test at P < 5% to determine the differences among treatment means, according to Gomez and Gomez [19].
3. Results
3.1. Vegetative Growth Parameters
The effect of three different irrigation water volumes on vegetative growth parameters of two green bean cultivars and their interactions are presented in Table 2.
Plant height, number of leaves per plant, number of branches per plant, and total fresh weight as well as total chlorophyll content generally increased when the supplied water was increased from 60 to 80% of ET. Increasing water volume to 100% of evapotranspiration tended to decrease the fresh biomass accumulated during the growing period, compared to 80% of ET. Conversely, dry matter percent was increased by reducing water volume from 100 to 60% of ET (Table 2).
With regard to the effect of green bean cultivars on plant vegetative growth parameters, there were no differences in their effects on the number of leaves per plant, number of branches per plant, total fresh weight, or dry matter percent. The ‘Bronco’ cultivar was taller than ‘Paulista’. On the other hand, ‘Paulista’ had a higher total chlorophyll content. In general, ‘Bronco’ had better vegetative growth characteristics; however, the differences were not statistically significant (Table 2).
3.2. Pod Yield, WUE, and Pod Parameters
The 80% of ET water volume resulted in the highest pod yield and total pod number per plant, 1188 g/m2 and 15.0/plant, respectively. The plants irrigated with the lowest water volume resulted in the lowest pod yield and total pod number per plant, 994 g/m2 and 13.2/plant, respectively (Table 3). The reduction of water volume positively affected water use efficiency (WUE). The results showed that WUE progressively increased when decreasing the water application from 100 to 60% of ET. The weight, length and diameter of the green pods were generally increased by the application of a moderate water volume (80% of ET). Conversely, the lowest water volume (60% of ET) resulted in the lowest weight, length, and diameter of the green pods (Table 3).
The ‘Bronco’ cultivar had a higher pod yield, WUE, pod weight, and pod diameter compared to ‘Paulista’. ‘Paulista’ had a greater number of pods per plant and pod length (Table 3).
Concerning possible interaction effects between water volume and cultivar on number of pods per plant, pod weight, and pod diameter, there were no differences (Table 3). The ‘Bronco’ cultivar, when irrigated by 80% of ET, resulted in the highest pod yield, while 60% of ET resulted in the lowest pod yield for ‘Paulista’. ‘Bronco’ irrigated by the lowest water volume recorded the highest WUE, while the 100% of ET resulted in the lowest WUE for ‘Paulista’. ‘Paulista’ irrigated at 80% of ET resulted in the longest, while the shortest pod was recorded by ‘Bronco’ when irrigated at 60% of ET (Table 3).
3.3. Chemical Composition
The effect of three different irrigation water volumes on two green bean cultivars and their interaction on chemical composition are presented in Table 4, Table 5 and Table 6.
The highest contents of N, P, K (Table 4), Fe, Zn, Cu (Table 5), and protein (Table 6) were at 80% of ET. The highest volume of irrigation water (100% of ET) resulted in the highest contents of Ca, Mg (Table 4), Mn (Table 5), and soluble sugar (Table 6). Conversely, the lowest volume of irrigation water (60% of ET) resulted in the lowest contents of N, Ca, Mg (Table 4), Mn, Zn (Table 5), protein and soluble sugar (Table 6). In contrast, 100% of ET produced the lowest contents of P, K (Table 4), Fe and Cu (Table 5). Total fiber content was gradually increased by reducing water volumes from 100 to 60% of ET (Table 6). There were no differences among the three water volumes on vitamin C and titratable acid (Table 6).
With regard to the effect of cultivar on chemical composition, ‘Paulista’ had higher contents of P, Ca, Mg (Table 4), Fe, Cu (Table 5), protein, vitamin C, titratable acid, and soluble sugar (Table 6)compared to ‘Bronco’. ‘Bronco’ recorded relative superiority in total fiber (Table 6). However, the cultivars did differ in N, K (Table 4), Mn, and Zn (Table 5) content.
Concerning the interactions between water volume and cultivas on chemical composition, ‘Paulista’ irrigated at 80% of ET recorded the highest contents of N, K (Table 4), and protein (Table 6). ‘Paulista’ irrigated at 100% of ET recorded the highest contents of Mn (Table 5) and vitamin C (Table 6). ‘Bronco’ irrigated by 80% of ET recorded the highest content of P (Table 4). On the other hand, ‘Bronco’ irrigated by 60% of ET recorded the highest content of Fe (Table 5). However, there were no differences among interactions concerning their effects on Ca, Mg (Table 4), Zn, Cu (Table 5), fiber, titratable acid, and soluble sugar (Table 6).
4. Discussion
Green bean productivity was affected by the volume of irrigation water. Most plant growth parameters and pod yield increased with increasing water application from 60 to 80% of ET, without any additional increase up to 100% of ET. The results under the controlled system of the presented study using drip irrigation supported the hypothesis that a greater amount of water produced a faster growth rate, but only up to a certain level (209 L/m2 in our experimental conditions). It is well known that water plays a crucial role in the nutrient uptake and transport and photosynthesis.
A correlation analysis showed that the total water volume, calculated in percent of evapotranspiration, WUE and as some generative parameters, was strongly inversely related to WUE (r = −0.94, P = 0.005), and moderately positively related to pod yield (r = 0.59, P = 0.011). Moreover, a good correlation was observed between the irrigation regime and the chlorophyll content (r = 0.76, P = 0.005) (data not shown).
Moderate soil moisture was necessary to ensure a uniform plant stand after germination and during the plant establishment stage. Green beans are extremely sensitive to both water deficit and excess water [13,15,20]. For instance, water deficit during vegetative growth and flowering has the greatest negative impact on pod yield and pod quality [20,21]. Mainly during flowering and pod set, green beans are very sensitive to water stress. To insure proper moisture availability, the soil should not hold more than 60% of field capacity during the pod elongation and pod-filling period, according to Abd El-Aal et al. [15].
The present study concluded that 80% of ET was quite enough to achieve the maximum productivity for green beans. Our results are similar to those previously reported by El-Noemani et al. [11]. They noted that increasing the irrigation amount up to 100% of ET prompted the highest growth, although the maximum pod yield was achieved by 80% of ET. Under stress conditions, water deficit had a significant impact on plant growth, leading to a decline in growth, leaf area development, and photosynthetic capacity [22]. Previous studies revealed that the reduction in bean productivity (number of pods per plant and seed biomass) due to heat stress was associated with reduced leaf water content [23,24]. Under scarce water in semi-arid areas, irrigation water management aims to provide sufficient water to replenish depleted soil water in time to avoid physiological water stress in growing plants, using modern irrigation technologies such as a drip irrigation system [8,14].
On the other hand, excessive water volume can also reduce the growth rate of plants. Moreover, too much water in the soil is detrimental to plant growth, due to oxygen deprivation in the plant’s roots. Furthermore, additional water must reflect the same increase rate in yield, because of the additional costs, based on the law of diminishing returns (WUE). However, the soil type has to be taken into account as well. For instance, Abdel-Mawgoud [14] recorded a linear correlation between bean yield and water application up to 120% ETc. He found that vegetative growth parameters and yield components responded positively to water increasing up to 120% ETc in newly reclaimed sandy land. This was due to sandy soil having a small water holding capacity compared to silty clay soil. With irrigation, we maintained adequate conditions for optimal plant growth during all stages. Therefore, irrigation management can positively affect the profitability of bean productivity.
A correlation analysis between vegetative growth and generative development of the two green bean cultivars showed that vegetative growth parameters strongly influenced pod yield. The correlation coefficients were r = 0.93 (P = 0.008), 0.90 (P = 0.015), 0.94 (P = 0.005), and 0.95 (P = 0.003), respectively, for plant height, number of leaves, number of branches, and total fresh weight per plant. The simple correlation between the vegetative growth parameters and pod growth was weak with respect to pod diameter. It is important to mention that vegetative growth parameters were similarly correlated with the number of pods and pod weight, with an even higher correlation coefficient for the number of pods. This indicated that the yield was affected more by the number of pods than by the pod weight (data not shown).
Consumer interest in the quality of vegetable products has increased worldwide in recent years. Product quality is a complex issue. As well as visual characteristics, properties such as texture, the content of minerals and vitamins, flavor, and other organoleptic characteristics must be considered [25]. With regard to the cultivars examined in the presented study, ‘Bronco’ had higher pod yield with better WUE. ‘Paulista’ was superior in pod number, pod length, and nutritional value (e.g., P, Ca, Mg, Fe, Cu, protein, vitamin C, titratable acid, and soluble sugar). These results can be attributed to the genetic differences between the two genotypes. It can be concluded that ‘Bronco’ is more tolerant to water deficit than ‘Paulista’. Our results are in accordance with the findings of El-Noemani et al. [11] and Shalaby et al. [10]. These researchers, as well as Boutraa and Sanders [20], Bayuelo-Jimenez et al. [22], and Omae et al. [24], showed a wide variation among bean cultivars in terms of their performance and response to stress conditions. El-Bassiony et al. [26] also reported the sensitivity of ‘Paulista’ to drought stress, which was reflected in the plant growth and pod yield.
The actual performance of any cultivar depends on how its genetic parameters interact with the environmental conditions. Therefore, high yields and better WUE can be achieved by using suitable cultivars and optimizing water management, because the optimum water requirements are variable between different cultivars. Modern irrigation systems such as drip or subsurface drip irrigation, as well as the application of biostimulants, e.g., brassinosteroids [26], citric acid [27], biofertilization [28,29], and/or arbuscular mycorrhizal fungi [30], will be useful. More sustainable cultural practices are and must be developed.
5. Conclusions
The application of 80% of ET was enough to increase green bean productivity and improve pod quality. ‘Bronco’ ad higher pod yield, WUE, pod weight, pod diameter, and total fiber. ‘Paulista’ was superior in pod number, pod length, P, Ca, Mg, Fe, Cu, protein, vitamin C, titratable acid, and soluble sugar. Under less water availability, we can recommend the ‘Bronco’ cultivar. With sufficient available water, ‘Paulista’ can be recommended for its higher pod nutritional quality. The combination of suitable cultivars, improvement of WUE, use of modern irrigation systems, and optimization of cultivation management practices can improve cost-effectiveness and minimize problems of water shortages with a particular emphasis on sustainable resource management and environmental protection.
Acknowledgments
The authors would like to thank the Talented Young Scientist Program (TYSP) of the Chinese Ministry of Science and Technology for providing a Visiting Research Fellowship to Said Saleh (Position No. P150I3166). This research was completed with financial assistance from the Ministry of Agriculture Public Welfare Industry Scientific Research Project “Sustainable Development of Beijing-Tianjin-Hebei: Planting Efficient Water Use Key Technology” (201303133-2).
Author Contributions
Said Saleh and Mingchi Liu conceptualized and designed the experiment. Said Saleh and Yanhai Ji performed the experiments; Guangmin Liu collected the samples; Guangmin Liu and Hongju He prepared the samples for analysis and supported the lab work; Said Saleh and Hongju He analyzed the data and wrote the paper; Nazim Gruda revised the paper.
Conflicts of Interest
The authors declare no conflict of interest. The founding sponsors had no role in the design of the study; in the collection, analyses, or interpretation of data; in the writing of the manuscript, and in the decision to publish the results.
References
- United Nations World Water Assessment Programme (WWAP). The United Nations World Water Development Report: Water and Energy; UNESCO: Paris, France, 2014. [Google Scholar]
- Quda, S. Major Crops and Water Scarcity in Egypt: Irrigation Water Management under Changing Climate; Springer: Cham, Switzerland, 2016; ISBN 978-3-319-21771-0. [Google Scholar]
- Bray, E.A.; Bailey-Serres, J.; Weretilnyk, E. Responses to abiotic stresses. In Biochemistry and Molecular Biology of Plants; Gruissem, W., Buchannan, B., Jones, R., Eds.; ASPP: Rockville, MD, USA, 2000; pp. 1158–1249. [Google Scholar]
- Bisbis, M.B.; Gruda, N.; Blanke, M. Potential impacts of climate change on vegetable production and product quality—A review. J. Clean. Prod. 2018, 170, 1602–1620. [Google Scholar] [CrossRef]
- Abdel-Mawgowd, A.M.; El-Nemr, M.A.; Tantawy, A.S.; Habib, H.A. Alleviation of salinity effects on green bean plants using some environmental friendly materials. J. Appl. Sci. Res. 2010, 6, 871–878. [Google Scholar]
- Darwish, K.H.; Safaa, M.; Momou, A.; Saleh, S.A. Egypt: Land degradation issues with special reference to the impact of climate change. In Combating Desertification in Asia, Africa and Middle East, Proven Practices; Heshmati, G.A., Squires, V.R., Eds.; Springer: Dordrecht, The Netherlands, 2013; Chapter 6; pp. 113–136. [Google Scholar]
- Badr, M.A.; Abou Hussein, S.D.; El-Tohamy, W.A.; Gruda, N. Efficiency of subsurface drip irrigation for potato production under different dry stress conditions. Gesunde Pflanzen 2010, 62, 63–70. [Google Scholar] [CrossRef]
- Saleh, S.A.; El-Shal, Z.S.; Fawzy, Z.S.; El-Bassiony, A.M. Effect of water amounts on artichoke productivity irrigated with brackish water. Aust. J. Basic Appl. Sci. 2012, 6, 54–61. [Google Scholar]
- FAOSTAT. Green Bean World Statistics. Major food and agricultural commodities producers—Countries by commodity. Available online: www.faostat.fao.org (accessed on 23 October 2017).
- Shalaby, M.A.; Ibrahim, S.K.; Zaki, E.M.; Abou-Sedera, F.A.; Abdallah, A.S. Effect of sowing dates and plant cultivar on growth, development and pod production of snap bean (Phaseolus vulgaris L.) during summer season. Int. J. PharmTech Res. 2016, 9, 231–242. [Google Scholar]
- El-Noemani, A.A.; El-Zeiny, H.A.; El-Gindy, A.M.; El-Sahhar, E.A.; El-Shawadfy, M.A. Performance of some bean (Phaseolus vulgaris L.) varieties under different irrigation systems and regimes. Aust. J. Basic Appl. Sci. 2010, 4, 6185–6196. [Google Scholar]
- Tarantino, E.; Rubino, P. Water consumption of broccoli, spinach, snap beans and gherkin in cropping sequence. Cent. Di Studio Sull Ortic. Ind. 1989, 36, 228–234. [Google Scholar]
- Sazen, S.M.; Yazar, A.; Akyildiz, A.; Dasgan, H.Y.; Gencel, B. Yield and quality response of drip irrigated green beans under full and deficit irrigation. Sci. Hortic. 2008, 117, 95–102. [Google Scholar] [CrossRef]
- Abdel-Mawgowd, A.M. Growth, yield and quality of green bean (Phaseolus vulgaris) in response to irrigation and compost applications. Aust. J. Basic Appl. Sci. 2006, 2, 443–450. [Google Scholar]
- Abd El-Aal, H.; El-Hwat, N.; El-Hefnawy, N.; Medany, M. Effect of sowing dates, irrigation levels and climate change on yield of common bean (Phaseolus vulgaris L.). Am.-Eurasian J. Agric. Environ. Sci. 2011, 11, 79–86. [Google Scholar]
- Allen, R.G.; Pereira, L.S.; Raes, D.; Smith, M. Crop Evapotranspiration-Guidelines for Computing Crop Water Requirements-FAO Irrigation and Drainage Paper 56; FAO: Rome, Italy, 1998; Volume 300. [Google Scholar]
- Determination for Mineral Elements in Vegetables, Fruits and Derived Products by ICP-AES Method; NY/T 1653-2008; Standard of Ministry of Agriculture of the People’s Republic of China: Beijing, China, 2008.
- Nielsen, S.S. Food Analysis. Laboratory Manual; Springer: New York, NY, USA, 2010; ISBN 978-1-4419-1477-4. [Google Scholar]
- Gomez, K.A.; Gomez, A.A. Statistical Procedures for Agricultural Research, 2nd ed.; John Wiley & Sons, Inc.: New York, NY, USA, 1984. [Google Scholar]
- Boutraa, T.; Sanders, F.E. Influence of water stress on grain yield and vegetative growth of two cultivars of bean (Phaseolus vulgaris L.). J. Agron. Crop Sci. 2000, 187, 251–257. [Google Scholar] [CrossRef]
- Alvino, A.; Tedeschi, P.; Zerbi, G. Growth, flowering, setting and yield of kidney bean (Phaseolus vulgaris L.) as influenced by water regime, P fertilization and bnoa treatment. ISHS Acta Hortic. 1988, 228, 219–226. [Google Scholar] [CrossRef]
- Bayuelo-Jimenez, J.S.; Debouck, D.G.; Lynch, J.P. Growth, gas exchange, water relations and ion composition of Phaseolus species grown under saline conditions. Field Crops Res. 2003, 80, 207–222. [Google Scholar] [CrossRef]
- Omae, H.; Kumar, A.; Egawa, Y.; Kashiwaba, K.; Shono, M. Leaf water status of two snap bean (Phaseolus vulgaris L.) cultivars differing to high temperature stress. Jpn. J. Trop. Agric. 2004, 48, 5–6. [Google Scholar]
- Omae, H.; Kumar, A.; Egawa, Y.; Kashiwaba, K.; Shono, M. Genotypic differences in plant water status and relationship with reproductive responses in snap bean (Phaseolus vulgaris L.) during water stress. Jpn. J. Trop. Agric. 2005, 49, 1–7. [Google Scholar]
- Gruda, N. Impact of environmental factors on product quality of greenhouse vegetables for fresh consumption. Crit. Rev. Plant Sci. 2005, 24, 227–247. [Google Scholar] [CrossRef]
- El-Bassiony, A.M.; Ghoname, A.A.; El-Awadi, M.E.; Fawzy, Z.F.; Gruda, N. Ameliorative effects of Brassinosteroids on growth and productivity to snap beans grown under high temperature. Gesunde Pflanzen 2012, 64, 175–182. [Google Scholar] [CrossRef]
- El-Tohamy, W.A.; El-Abagy, H.M.; Badr, M.A.; Gruda, N. Drought tolerance and water status of bean plants (Phaseolus vulgaris L.) as affected by citric acid application. J. Appl. Bot. Food Qual. 2013, 86, 212–216. [Google Scholar] [CrossRef]
- El-Tohamy, W.A.; El-Abagy, H.M.; El-Greadly, N.H.M.; Gruda, N. Hormonal changes, growth and yield of tomato plants in response to chemical and bio-fertilization application in sandy soils. J. Appl. Bot. Food Qual. 2009, 82, 179–182. [Google Scholar]
- Saleh, S.A.; Glala, A.A.; Ezzo, M.I.; Ghoname, A.A. An attempt for reducing mineral fertilization in lettuce production by using bio-organic farming system. Acta Hortic. 2010, 852, 311–318. [Google Scholar] [CrossRef]
- Baum, C.; El-Tohamy, W.; Gruda, N. Increasing the productivity and product quality of vegetable crops using arbuscular mycorrhizal fungi: A review. Sci. Hortic. 2015, 187, 131–141. [Google Scholar] [CrossRef]
Figure 1.
(a) Pots with drip irrigation, used for the experiment; (b) Green beans at the start of the flowering stage. Photos: Said Saleh, 2016.
Figure 1.
(a) Pots with drip irrigation, used for the experiment; (b) Green beans at the start of the flowering stage. Photos: Said Saleh, 2016.

Table 1.
Soil analysis.
| Total Salt (g/kg) | EC (dS/m) | pH | Organic Matter (g/kg) | Total N (g/kg) | NO3 (mg/kg) | Available P (mg/kg) | Available K (mg/kg) |
|---|---|---|---|---|---|---|---|
| 3.66 | 0.92 | 7.76 | 14.5 | 0.92 | 27.3 | 33.2 | 180 |
Table 2.
Effect of different irrigation water volumes based on supplying 60, 80 or 100% of evapotranspiration (ET) on vegetative growth parameters of two green bean cultivars.
Table 2.
Effect of different irrigation water volumes based on supplying 60, 80 or 100% of evapotranspiration (ET) on vegetative growth parameters of two green bean cultivars.
| Treatments | Plant Height (cm) | No. of Leaves/Plant | No. of Branches/Plant | Fresh Weight (g) | Dry Matter (%) | Chlorophyll (SPAD) | |
|---|---|---|---|---|---|---|---|
| Irrigation rates (A): | |||||||
| 60% ET | 47.8 b | 18.7 c | 6.2 b | 57.0 b | 14.9 a | 38.3 b | |
| 80% ET | 52.0 a | 21.8 a | 7.8 a | 64.7 a | 14.2 ab | 42.5 a | |
| 100% ET | 50.2 a | 20.0 b | 7.5 a | 61.8 a | 13.6 b | 42.0 a | |
| Cultivars (B): | |||||||
| ‘Paulista’ | 49.9 b | 19.9 a | 7.0 a | 59.9 a | 14.2 a | 41.6 a | |
| ‘Bronco’ | 50.8 a | 20.4 a | 7.3 a | 62.4 a | 14.3 a | 40.3 b | |
| Interactions (A × B): | |||||||
| 60% ET | ‘Paulista’ | 48.3 a | 18.3 a | 6.0 a | 54.3 a | 14.6 a | 39.0 a |
| ‘Bronco’ | 49.3 a | 19.0 a | 6.3 a | 59.7 a | 15.1 a | 37.7 a | |
| 80% ET | ‘Paulista’ | 51.7 a | 21.7 a | 7.7 a | 64.0 a | 14.4 a | 43.3 a |
| ‘Bronco’ | 52.3 a | 22.0 a | 8.0 a | 65.3 a | 14.1 a | 41.7 a | |
| 100% ET | ‘Paulista’ | 49.7 a | 19.7 a | 7.3 a | 61.3 a | 13.5 a | 42.3 a |
| ‘Bronco’ | 50.7 a | 20.3 a | 7.7 a | 62.3 a | 13.6 a | 41.7 a | |
Means within each column within main effects and interactions followed by the same letter are not significantly different at P < 5%.
Table 3.
Effect of different irrigation water volumes based on supplying 60, 80 or 100% of evapotranspiration (ET) on the pod yield, water use efficiency, and pod parameters of two green bean cultivars.
Table 3.
Effect of different irrigation water volumes based on supplying 60, 80 or 100% of evapotranspiration (ET) on the pod yield, water use efficiency, and pod parameters of two green bean cultivars.
| Treatments | Pod Yield (g/m2) | WUE (g/L) | No. of Pods/Plant | Pod Weight (g) | Pod Length (cm) | Pod Diameter (cm) | |
|---|---|---|---|---|---|---|---|
| Irrigation rates (A): | |||||||
| 60% ET | 994 c | 6.33 a | 13.2 b | 3.43 b | 9.67 c | 0.66 c | |
| 80% ET | 1188 a | 5.68 b | 15.0 a | 3.61 a | 11.33 a | 0.70 a | |
| 100% ET | 1129 b | 4.33 c | 14.3 a | 3.59 a | 10.67 b | 0.68 b | |
| Cultivars (B): | |||||||
| ‘Paulista’ | 1061 b | 5.22 b | 14.6 a | 3.31 b | 11.67 a | 0.65 b | |
| ‘Bronco’ | 1146 a | 5.67 a | 13.8 b | 3.78 a | 9.44 b | 0.71 a | |
| Interactions (A × B): | |||||||
| 60% ET | ‘Paulista’ | 946 e | 6.03 b | 13.3 a | 3.23 a | 10.33 b | 0.63 a |
| ‘Bronco’ | 1041 d | 6.63 a | 13.0 a | 3.64 a | 9.00 c | 0.70 a | |
| 80% ET | ‘Paulista’ | 1129 bc | 5.40 c | 15.3 a | 3.35 a | 12.67 a | 0.67 a |
| ‘Bronco’ | 1247 a | 5.96 b | 14.7 a | 3.87 a | 10.0 b | 0.73 a | |
| 100% ET | ‘Paulista’ | 1107 c | 4.24 e | 15.0 a | 3.36 a | 12.00 a | 0.65 a |
| ‘Bronco’ | 1151 b | 4.41 d | 13.7 a | 3.83 a | 9.33 c | 0.71 a | |
Means within each column within main effects and interactions followed by the same letter are not significantly different at P < 5%.
Table 4.
Effect of different irrigation water volumes based on supplying 60, 80 or 100% of evapotranspiration (ET) on the content of macroelements for two green bean cultivars.
Table 4.
Effect of different irrigation water volumes based on supplying 60, 80 or 100% of evapotranspiration (ET) on the content of macroelements for two green bean cultivars.
| Treatments | N | P | K | Ca | Mg | |
|---|---|---|---|---|---|---|
| (mg/100g FW) | ||||||
| Irrigation rates (A): | ||||||
| 60% ET | 476 b | 77.1 ab | 523 ab | 72.8 c | 50.8 c | |
| 80% ET | 501 a | 81.6 a | 555 a | 78.1 b | 53.6 b | |
| 100% ET | 490 ab | 73.6 b | 502 b | 82.7 a | 56.5 a | |
| Cultivars (B): | ||||||
| ‘Paulista’ | 498 a | 78.5 a | 535 a | 79.8 a | 55.4 a | |
| ‘Bronco’ | 480 a | 76.4 b | 519 a | 75.9 b | 51.9 b | |
| Interactions (A × B): | ||||||
| 60% ET | ‘Paulista’ | 484 b | 80.1 a | 506 b | 73.9 a | 51.9 a |
| ‘Bronco’ | 468 c | 73.3 b | 541 ab | 71.6 a | 49.8 a | |
| 80% ET | ‘Paulista’ | 518 a | 80.4 a | 595 a | 81.0 a | 55.1 a |
| ‘Bronco’ | 483 b | 82.8 a | 515 b | 75.3 a | 52.2 a | |
| 100% ET | ‘Paulista’ | 491 b | 74.0 b | 503 b | 84.6 a | 59.4 a |
| ‘Bronco’ | 490 b | 73.1 b | 501 b | 80.8 a | 53.7 a | |
Means within each column within main effects and interactions followed by the same letter are not significantly different at P < 5%.
Table 5.
Effect of different irrigation water volumes based on supplying 60, 80 or 100% of evapotranspiration (ET) on the content of microelements for two green bean cultivars.
Table 5.
Effect of different irrigation water volumes based on supplying 60, 80 or 100% of evapotranspiration (ET) on the content of microelements for two green bean cultivars.
| Treatments | Fe | Mn | Zn | Cu | |
|---|---|---|---|---|---|
| (mg/kg FW) | |||||
| Irrigation rates (A): | |||||
| 60% ET | 6.79 ab | 3.51 b | 2.89 b | 1.51 a | |
| 80% ET | 7.23 a | 3.58 b | 3.47 a | 1.58 a | |
| 100% ET | 6.40 b | 3.80 a | 3.38 a | 1.40 b | |
| Cultivars (B): | |||||
| ‘Paulista’ | 7.07 a | 3.53 a | 3.30 a | 1.53 a | |
| ‘Bronco’ | 6.55 b | 3.74 a | 3.19 a | 1.47 b | |
| Interactions (A × B): | |||||
| 60% ET | ‘Paulista’ | 7.63 a | 3.24 b | 2.98 a | 1.58 a |
| ‘Bronco’ | 5.96 c | 3.78 ab | 2.79 a | 1.45 a | |
| 80% ET | ‘Paulista’ | 7.00 b | 3.32 b | 2.45 a | 1.61 a |
| ‘Bronco’ | 7.46 ab | 3.86 ab | 2.50 a | 1.58 a | |
| 100% ET | ‘Paulista’ | 6.59 bc | 4.03 a | 2.48 a | 1.42 a |
| ‘Bronco’ | 6.21 c | 3.58 ab | 2.29 a | 1.39 a | |
Means within each column within main effects and interactions followed by the same letter are not significantly different at P < 5%.
Table 6.
Effect of different irrigation water volumes based on supplying 60, 80 or 100% of evapotranspiration (ET) on the content of protein, vitamin C, fiber, titratable acid, and soluble sugar for two green bean cultivars.
Table 6.
Effect of different irrigation water volumes based on supplying 60, 80 or 100% of evapotranspiration (ET) on the content of protein, vitamin C, fiber, titratable acid, and soluble sugar for two green bean cultivars.
| Treatments | Protein (g/100 g FW) | Vitamin C (mg/100 g FW) | Fiber (g/100 g FW) | Titratable Acid (g/100 g FW) | Soluble Sugar (g/100 g FW) | |
|---|---|---|---|---|---|---|
| Irrigation rates (A): | ||||||
| 60% ET | 2.98 b | 24.2 a | 1.65 a | 0.37 a | 1.87 b | |
| 80% ET | 3.13 a | 26.4 a | 1.61 a | 0.38 a | 2.09 a | |
| 100% ET | 3.06 ab | 28.1 a | 1.52 b | 0.39 a | 2.16 a | |
| Cultivars (B): | ||||||
| ‘Paulista’ | 3.11 a | 27.4 a | 1.55 b | 0.40 a | 2.10 a | |
| ‘Bronco’ | 3.00 b | 25.1 b | 1.64 a | 0.36 b | 1.98 b | |
| Interactions (A × B): | ||||||
| 60% ET | ‘Paulista’ | 3.03 b | 24.6 c | 1.60 a | 0.39 a | 1.91 a |
| ‘Bronco’ | 2.93 c | 23.9 c | 1.69 a | 0.35 a | 1.83 a | |
| 80% ET | ‘Paulista’ | 3.24 a | 27.3 b | 1.58 a | 0.40 a | 2.15 a |
| ‘Bronco’ | 3.02 b | 25.6 bc | 1.64 a | 0.37 a | 2.03 a | |
| 100% ET | ‘Paulista’ | 3.07 b | 30.3 a | 1.46 a | 0.42 a | 2.25 a |
| ‘Bronco’ | 3.06 b | 25.9 bc | 1.59 a | 0.36 a | 2.06 a | |
Means within each column within main effects and interactions followed by the same letter are not significantly different at P < 5%.
© 2018 by the authors. Licensee MDPI, Basel, Switzerland. This article is an open access article distributed under the terms and conditions of the Creative Commons Attribution (CC BY) license (http://creativecommons.org/licenses/by/4.0/).
Share and Cite
MDPI and ACS Style
Saleh, S.; Liu, G.; Liu, M.; Ji, Y.; He, H.; Gruda, N. Effect of Irrigation on Growth, Yield, and Chemical Composition of Two Green Bean Cultivars. Horticulturae 2018, 4, 3. https://doi.org/10.3390/horticulturae4010003
AMA Style
Saleh S, Liu G, Liu M, Ji Y, He H, Gruda N. Effect of Irrigation on Growth, Yield, and Chemical Composition of Two Green Bean Cultivars. Horticulturae. 2018; 4(1):3. https://doi.org/10.3390/horticulturae4010003
Chicago/Turabian StyleSaleh, Said, Guangmin Liu, Mingchi Liu, Yanhai Ji, Hongju He, and Nazim Gruda. 2018. "Effect of Irrigation on Growth, Yield, and Chemical Composition of Two Green Bean Cultivars" Horticulturae 4, no. 1: 3. https://doi.org/10.3390/horticulturae4010003
Note that from the first issue of 2016, this journal uses article numbers instead of page numbers. See further details here.