Article

Implications of Smallholder Farm Production Diversity for Household Food Consumption Diversity: Insights from Diverse Agro-Ecological and Market Access Contexts in Rural Tanzania

1
Department of Economics and Social Studies, Ardhi University, 35176 Dar es Salaam, Tanzania
2
Technical University of Munich (TUM) Campus Straubing of Biotechnology and Sustainability, Weihenstephan-Triesdorf University of Applied Sciences, 85354 Freising, Germany
3
Institute for Environmental Economics and World Trade, Leibniz Universität Hannover, Königsworther Platz 1, 30167 Hannover, Germany
*
Author to whom correspondence should be addressed.
Horticulturae 2018, 4(3), 14; https://doi.org/10.3390/horticulturae4030014
Submission received: 9 May 2018 / Revised: 30 June 2018 / Accepted: 6 July 2018 / Published: 8 July 2018
(This article belongs to the Special Issue Marketing Strategies of the Horticultural Production Chain)

Abstract

:
Owing to persistent challenges of food and nutritional insecurity, recent literature has focused on the role diversity of farm production has on food consumption diversity, particularly for smallholder households. Yet, the relationship between farm production diversity and household food consumption diversity remains complex and empirical evidence is, so far, mixed. The present article assesses this relationship using two districts—Kilosa and Chamwino—with contrasting agro-ecological and market contexts in rural Tanzania. These districts represent the majority of farming systems found in Tanzania as well as in several countries within the region. We used household data and employed descriptive as well as multivariate regression analyses. The results indicated a positive role of farm production diversity for food consumption diversity in the district with relatively harsh climatic and agro-ecological characteristics and poor access to markets. Furthermore, increased farm production diversity was generally associated with seasonal food consumption diversity. However, results suggested a lesser role of farm production diversity in the presence of better agro-ecological and market access characteristics. These findings imply that promoting farm production diversity should consider the existing agro-ecological and market characteristics. In addition, achieving increased food consumption diversity among rural households may require effective market related infrastructure and institutions.

1. Introduction

For most developing countries, smallholder agriculture plays a pivotal role in enhancing rural livelihoods including households’ food security [1,2]. This is mainly achieved through production of own food and incomes from sales of agricultural produce [3]. Despite recent significant strides in agricultural production, challenges such as food insecurity, under-nutrition and volatile food prices have persistently affected most smallholders [4,5,6]. In the wake of these challenges, there has been increased support for diversification of smallholder production as a strategy to enhance rural households’ food security through increased food sufficiency and diversity [3,7,8,9,10,11].
At the farm level, production diversity entails smallholders maintaining a variety of species for both plants and animals [12]. The logical argument put forth is that increased diversity of smallholder production (for both crops and livestock) will enhance access to a diverse portfolio of food for consumption at the household level, thereby improving the dietary diversity of smallholder households. Fundamentally, a considerable body of research notes that agricultural diversity is vital in enhancing overall sustainability of food and agricultural systems by promoting agricultural lands’ stability, productivity and resilience to shocks [13]. However, the debate on the role of smallholder farm production diversity on household food consumption diversity is far from conclusive. While some recent studies find a positive influence in this relationship [3,8,14], others have had mixed results [9,11]. Essentially, besides smallholder farm production diversity, household food consumption diversity may be influenced by market access and opportunities for off-farm income, among other factors [3,9]. Moreover, the implications of farm production diversity on food consumption of rural households may vary depending on, among other factors, agro-ecological characteristics which determine cropping systems pursued by smallholders [11,15].
Nevertheless, despite increased promotion of agricultural diversification for smallholders, empirical evidence on its role and implications in different smallholder contexts has lagged behind. In particular, evidence from diverse agro-ecological and market access settings is rare. We therefore use household data from diverse agro-ecological and market access contexts in rural Tanzania to answer three questions: (1) what is the nature and extent of farm production diversity among smallholders in the study regions? (2) What determines the observed farm production diversity? and (3) how does farm production diversity influence household food consumption diversity?
This article adds on previous literature in two ways. First, we use data from two distinct agro-ecological and market access contexts to analyze the farm production diversity-food consumption diversity relationship. This is important since this relationship may be masked by analyses that use national averages (such as Pellegrini and Tasciotti [8]). The objective is then to get insights on the nature and role of farm production diversity on food consumption diversity from diverse contexts as smallholder agriculture is inherently heterogeneous. Secondly, we use data on seasonal food consumption to further assess the potential of farm production diversity in contributing to seasonal food consumption diversity. In principle, smallholder households’ consumption is inherently seasonal [16,17], with food insecurity being more prevalent in planting and pre-harvest season. Potentially, farm production diversity may enhance access to a variety of crops in different seasons [18], and hence improve food consumption diversity during different seasons.
The remainder of this article is organized as follows: The next section reviews related literature followed by section three which presents the study area, data and empirical strategy. Results are then presented in Section 4 and a discussion in Section 5. Section 6 gives a summary of main findings and draws emerging conclusions.

2. Literature Review

2.1. Farm Production Diversity in Smallholder Agriculture

Smallholder farming systems particularly in Sub-Saharan Africa are characterized by a considerable amount of diversity, owing to heterogeneous biophysical and socio-economic environments [19]. Consequently, smallholders are confronted with multiple constraints and opportunities in their environments, which ultimately shape the diversity of their strategies [19,20]. As argued by Barrett [20], diversification of assets, activities or incomes by farm households may be due to “push factors” such as land or liquidity constraints and high transaction costs or “pull factors” where new opportunities may provide higher returns and thus enable improvement of livelihoods. Farm production diversity constitutes part of smallholder diversification strategies. Fundamentally, farm production diversity, which falls within the broader concept of agro-biodiversity, entails not only maintaining a variety of species for both plants and domestic animals but also genetic diversity within each species [12].
The level of farm diversity maintained by smallholders depends on households’ socio-demographic characteristics (such as age, gender and education) and assets such as land and labor [21,22]. Households’ productive assets can be, in particular, important in enhancing the capacity of households to exploit the advantages of production diversity such as through crop-livestock integration. Equally important, agro-ecological characteristics, access to markets and available infrastructure are also instrumental in influencing the level of farm production diversity [22,23]. Corral and Radchenko [24], for example, note that in Nigeria, decisions by households regarding diversification are driven by factors in the local environmental such as constraints in infrastructure and weather shocks. Depending on existing agro-ecological characteristics, smallholders may be inclined to maintain a high diversity in their production due to presence of climatic and other agricultural risks. Similarly, smallholders may substantially rely on self-provision of food in less accessible villages due to high costs of accessing markets, thereby maintaining a higher diversity at the farm. Following on the “push factors” argument, farm production diversity can be used as a way of mitigating risks by smallholders, especially in presence of output market imperfections and harsh agro-ecological environments [8,25].

2.2. Linking Production Diversity to Consumption Diversity

The wider benefits of maintaining diversity of various species—both plants and animals—by smallholders are well argued in the literature. The contribution of this diversity includes enhancing resilience of food production, provision of important nutritional benefits and supporting the overall sustainability of food systems [12]. However, despite these unarguably important benefits, promotion of farm production diversity for improved nutrition has confronted several challenges. An example is the existence of agricultural and food security policies in many developing countries which promote a few cereal staples. This follows decades of implementation of Green Revolution policies, which focused primarily on cereal-based systems—involving mainly maize, rice and wheat—to enhance calorie availability [12]. In addition, Hunter and Fanzo [26] argue that there is a general lack of empirical evidence that links biodiversity and improved nutrition outcomes such as dietary diversity.
In recent empirical literature, several studies show a positive influence of farm production diversity on household food consumption diversity. For example, in a wide study involving eight developing countries, Pellegrini and Tasciotti [8] assessed the role of crop diversification and found a positive correlation between the number of crops cultivated and indicators of dietary diversity. Similarly, Oyarzun et al. [27] observed that on-farm species diversity is positively correlated with household-level dietary diversity in the Ecuadorian rural highlands. Also using a nationally representative sample of farming households in Malawi, Jones et al. [3] found that farm production diversity is positively associated with dietary diversity. However, these results may be context driven and thus promoting farm production diversity cannot be viewed as a blanket policy to enhance dietary diversity of most rural smallholders. In addition, this literature acknowledges that the relationship may be complex given influences of household characteristics, market orientation and the nature of farm diversity. In Tanzania, Herforth [18] offers first insights into the relationship between farm production diversity and food consumption diversity at the household. Using household data from northern Tanzania and central Kenya, the study found that crop diversity was positively associated with household dietary diversity. However, it does not offer insights on diverse contexts as it was based on areas with largely similar agro-ecological and market access characteristics. Also, farm diversity was limited to crop diversity (i.e., the number of crops grown by a household).
Conversely, mixed results have also been documented. KC et al. [11] observed in three agro-ecological regions of Nepal that crop diversity was more beneficial in enhancing food self-sufficiency for households in low agricultural potential areas and with poor market access compared to those in agro-ecological zones with higher agricultural potential and market access. Also, Sibhatu et al. [9] conducted a study using household-level data from Malawi, Kenya, Ethiopia and Indonesia. They observed that on-farm production diversity was not positively associated with dietary diversity in all cases and that this relationship depended on the level of production diversity and the nature of market access. In addition, the relationship between farm production diversity and food consumption diversity was insignificant, and even negative, at higher levels of diversification, implying foregone income from specialization. With this, specialization and market access could also be argued to play an even stronger role in enhancing food consumption diversity. However, context still matters. Radchenko and Corral [24], for example, in a study looking at agricultural commercialization and food security in Malawi, found that higher agricultural incomes from cash cropping did not translate to higher food expenditures and better diets. The transmission from agricultural income to higher nutrition-related expenditures was rather weak. Other studies find no significant associations between farm diversity and dietary diversity. For instance, Ng’endo et al. [28] found no strong association between on-farm diversity and dietary diversity among smallholders in western Kenya. Instead, socioeconomic factors such as household wealth and education played a stronger role in influencing dietary diversity.
Accordingly, in assessing the links between the nature of farm production diversity and food consumption diversity, an emerging realization is the significant role of opportunities and constraints provided for by household socio-economic factors and the existing market characteristics and agro-ecological environment. The theorized links are summarized in the conceptual framework presented in Figure 1. Food security outcomes (such as food consumption diversity) are assumed to be influenced by the level of agro-biodiversity (represented here by farm production diversity). In addition, farm production diversity and food consumption diversity are also influenced by household socio-economic factors together with the existing agro-ecological and market access characteristics.

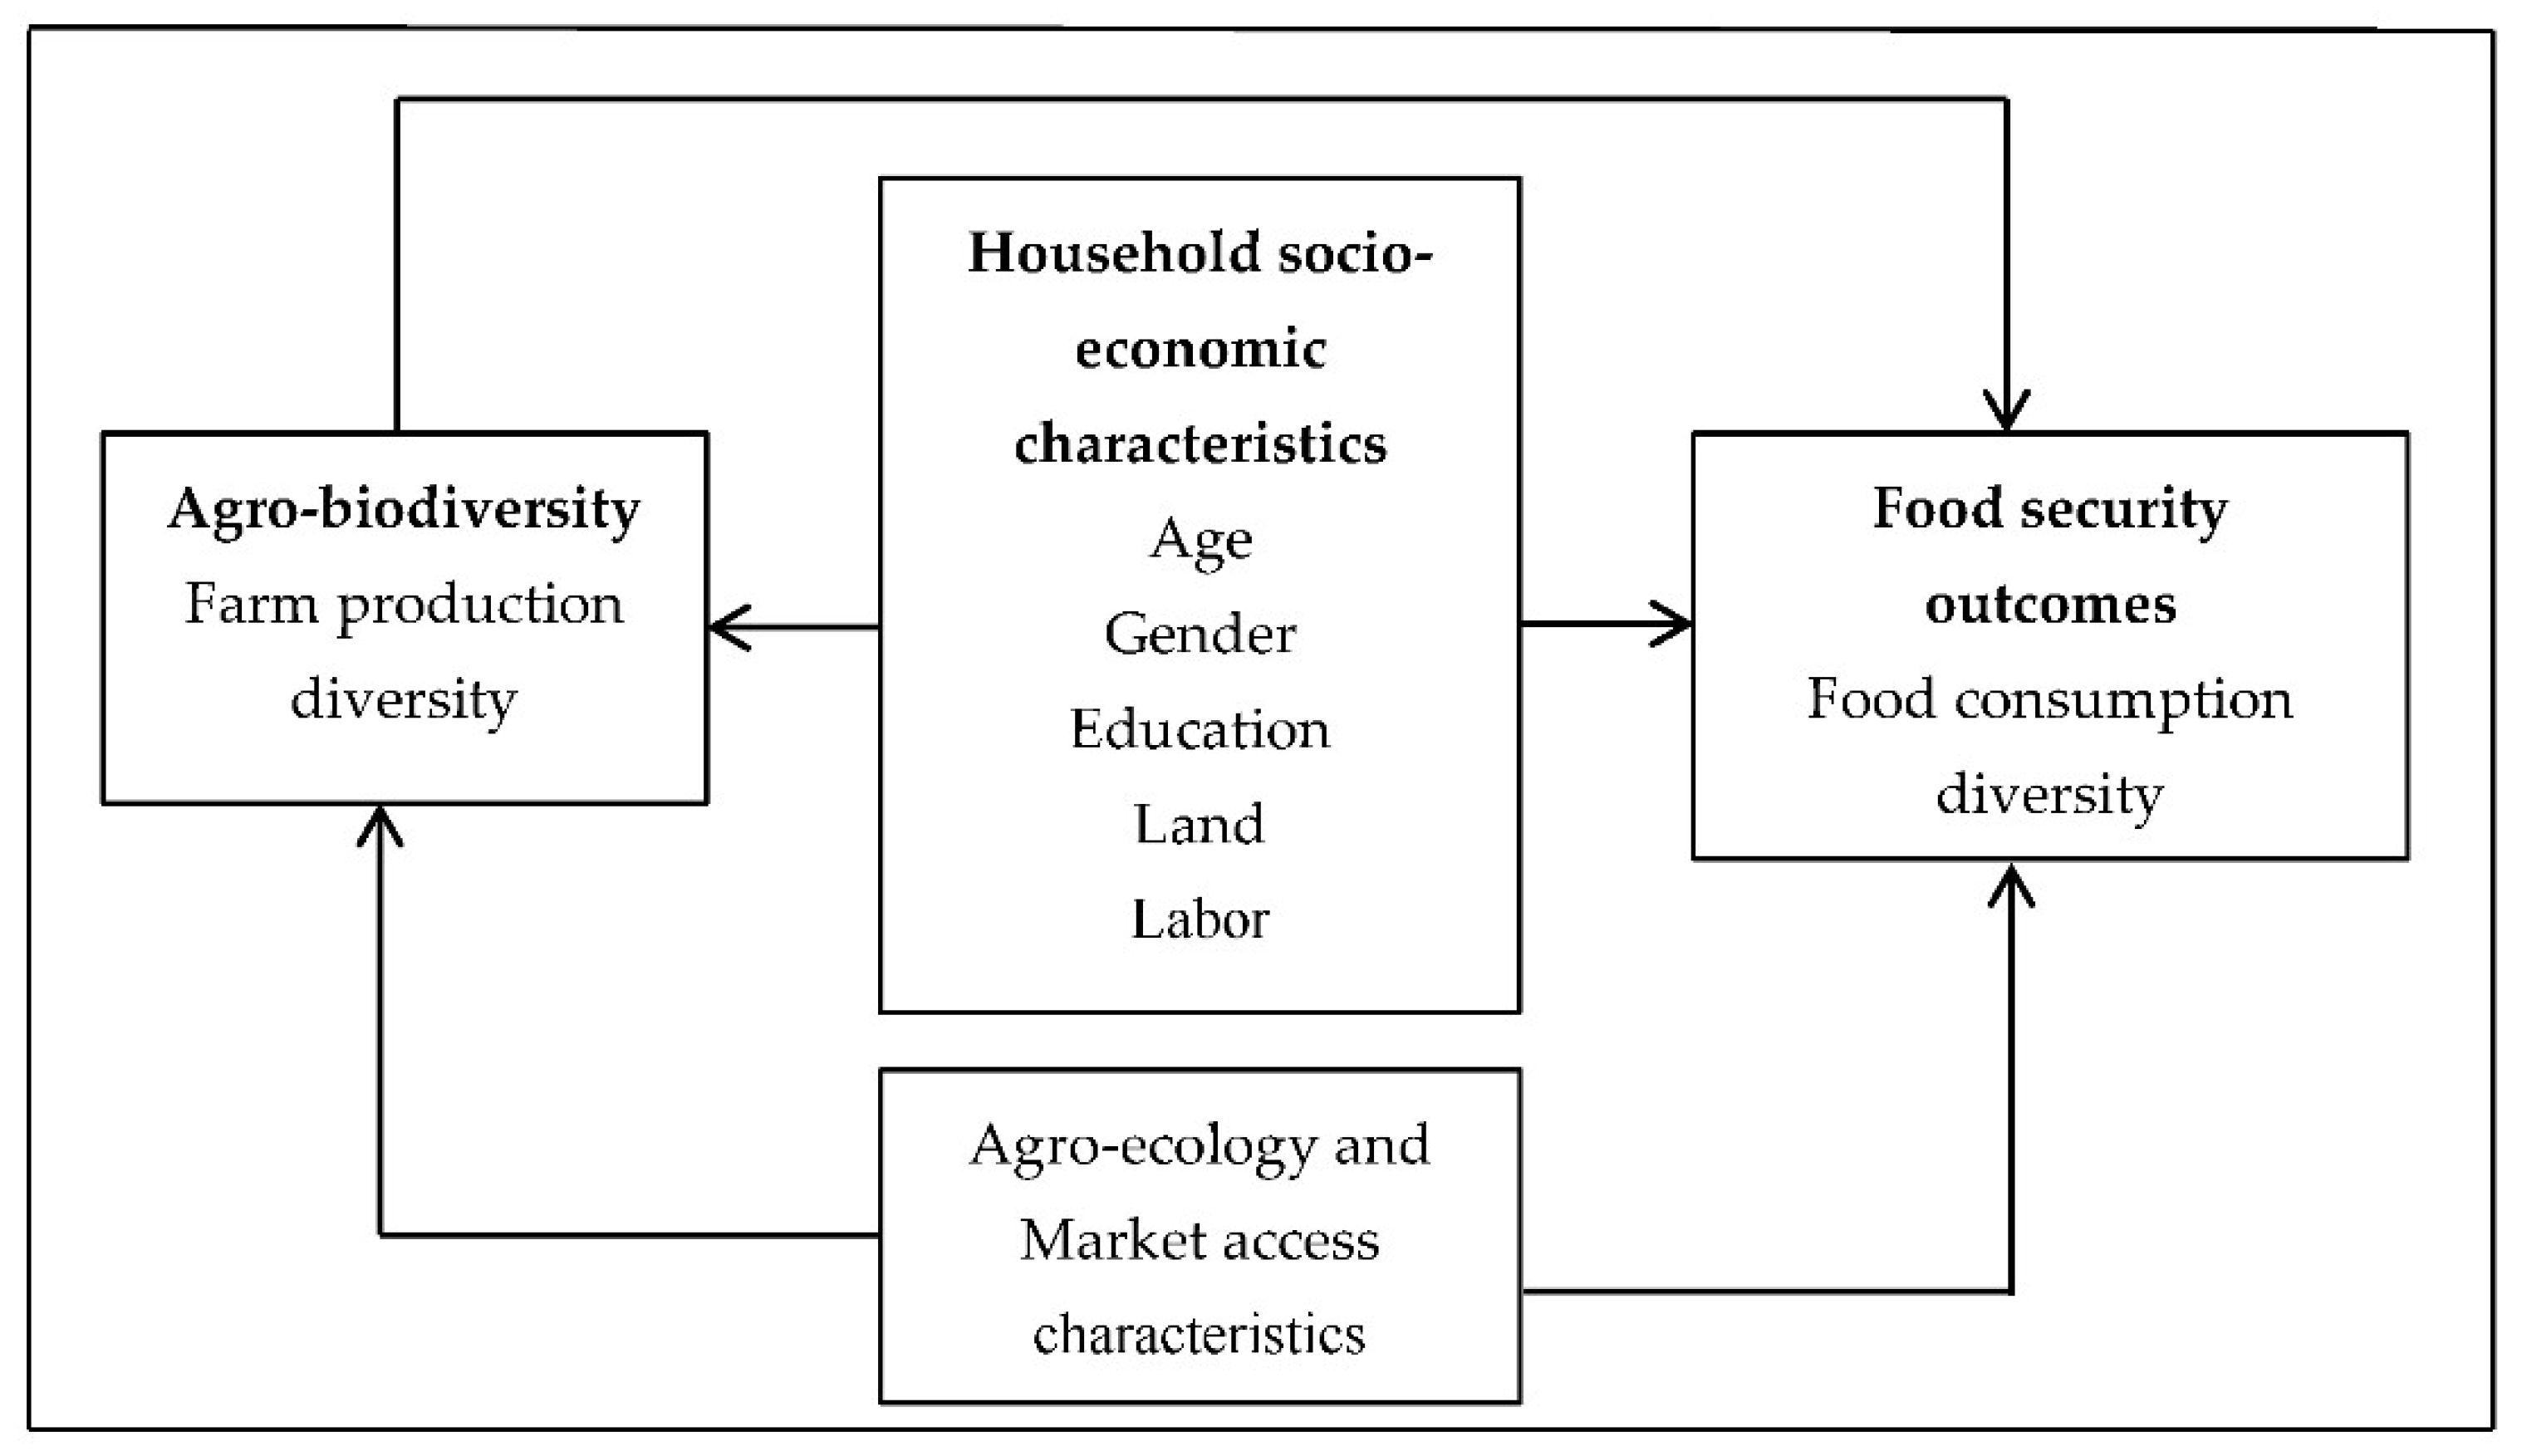
3. Materials and Methods

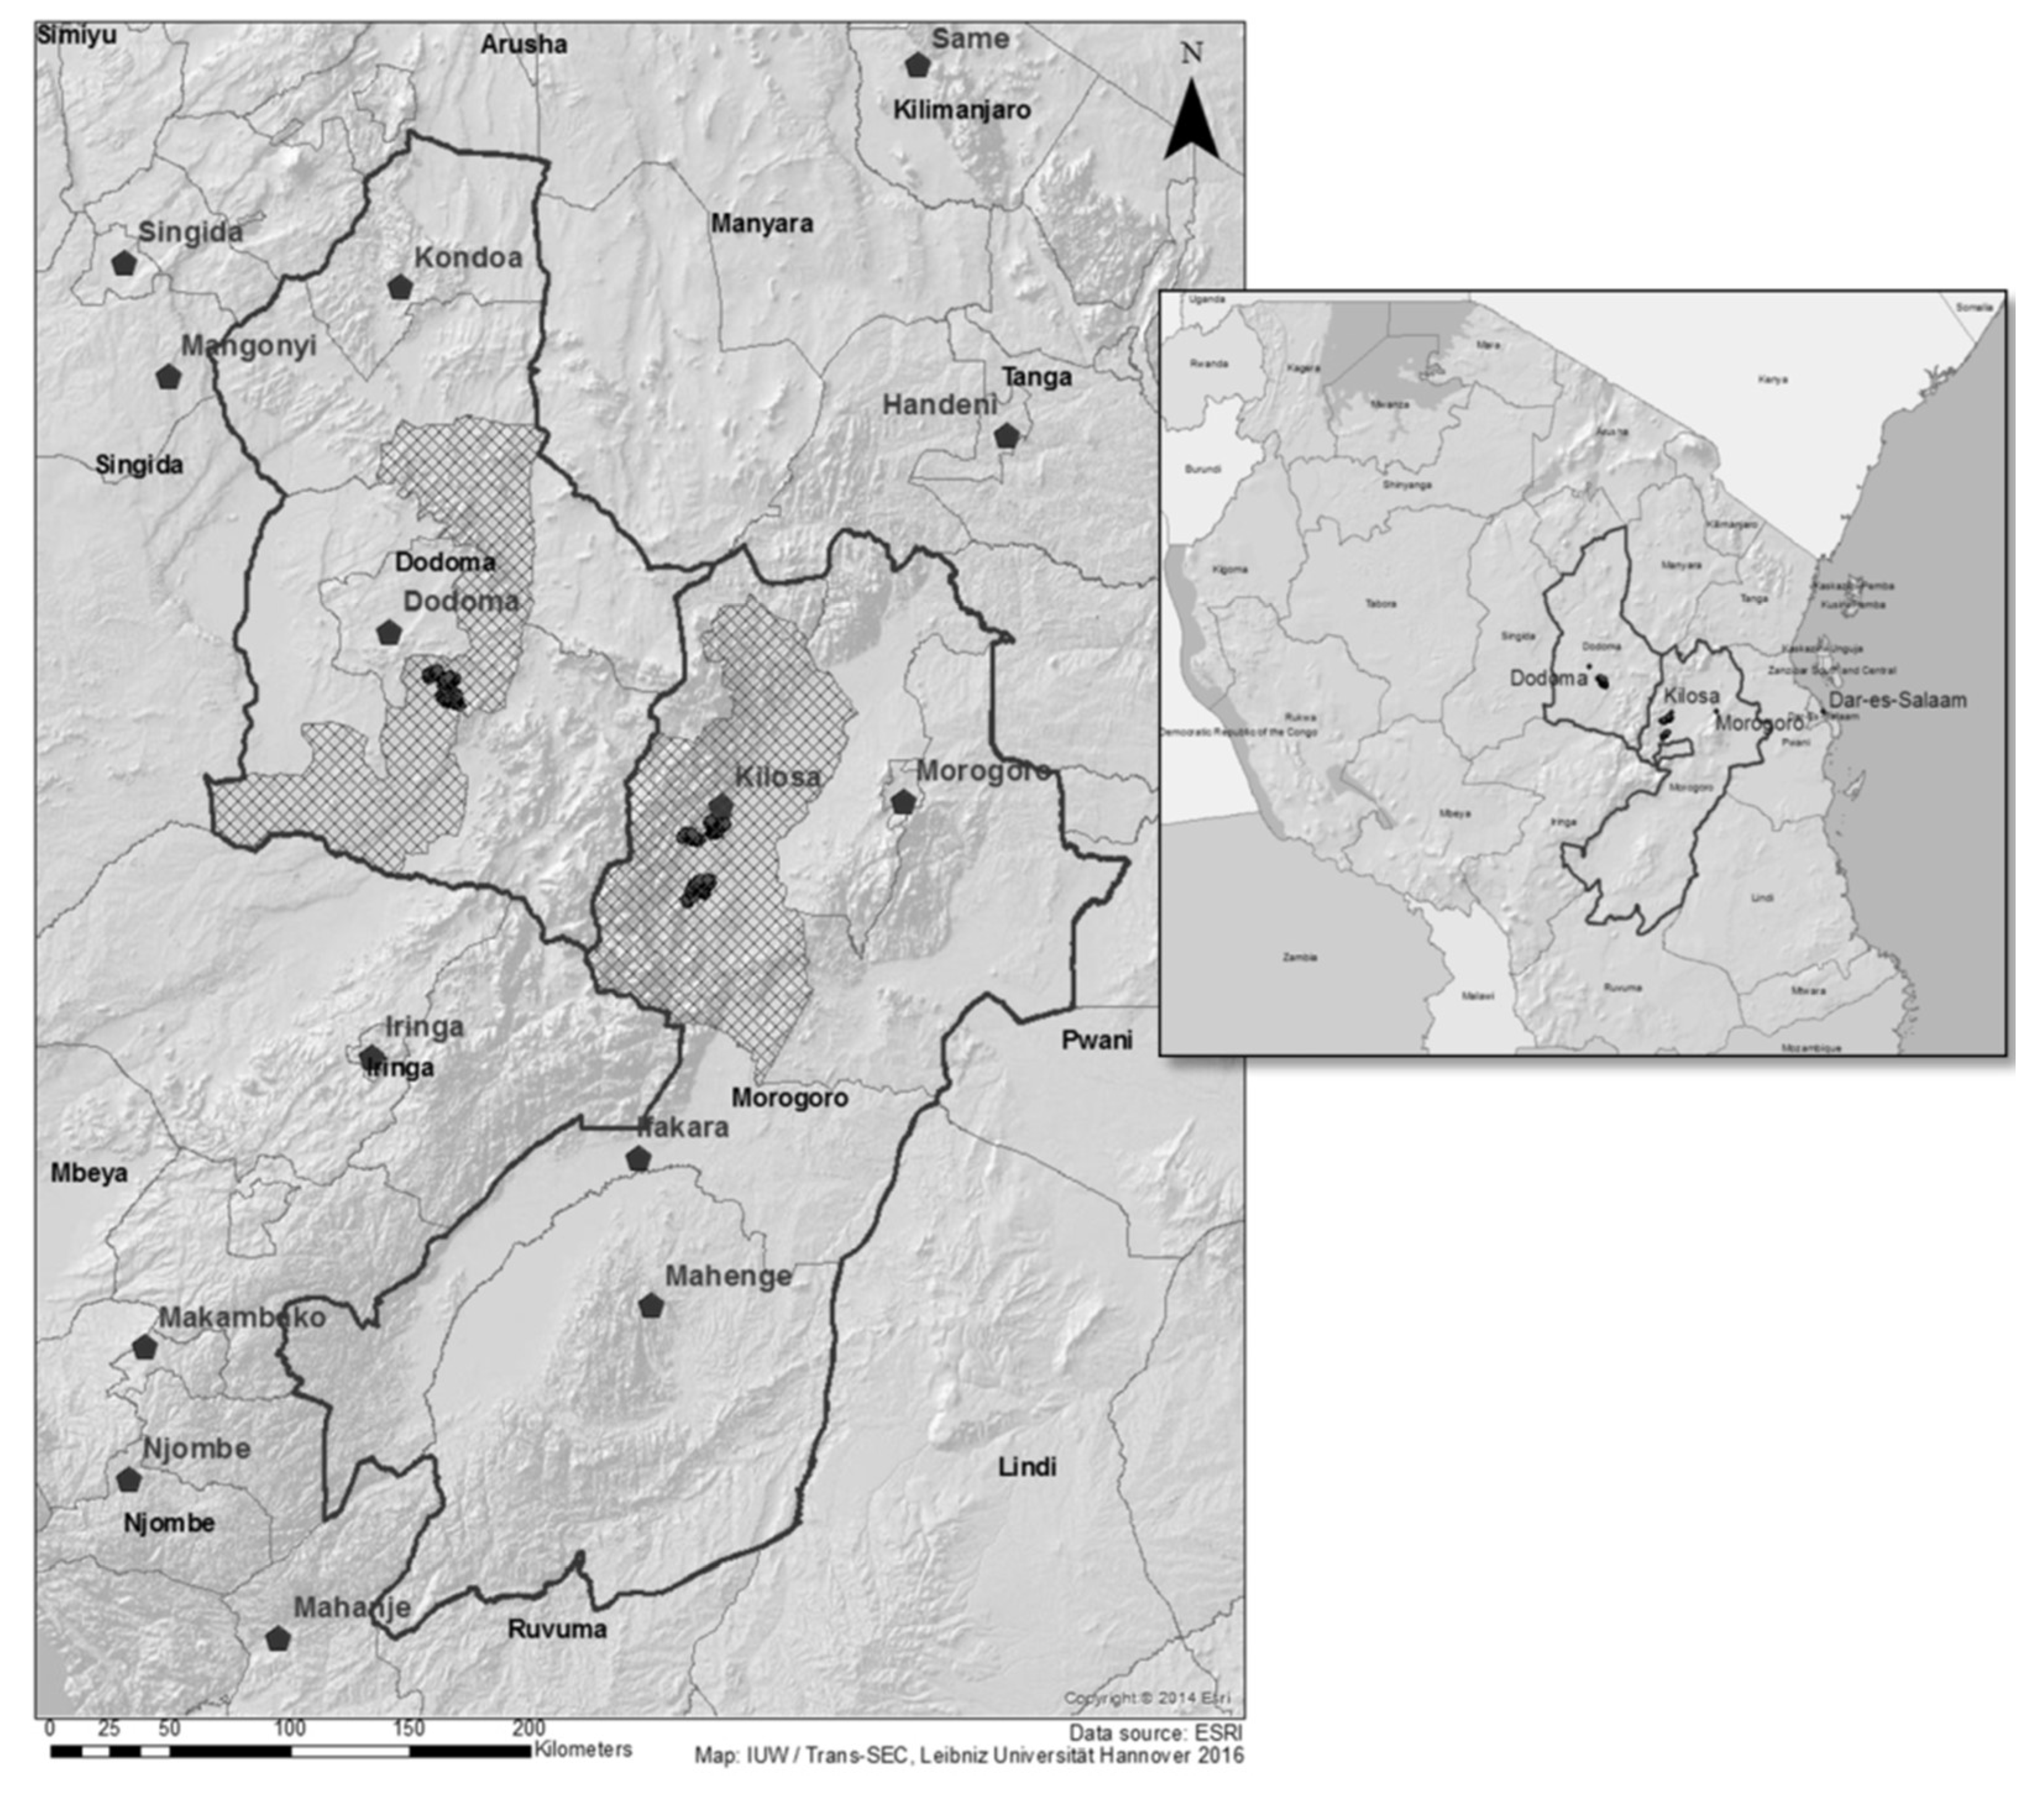
3.1. Study Area and Data

Tanzania has diverse climatic and ecological zones which support different agricultural systems [29]. Given the focus of this article, we use data from Kilosa and Chamwino Districts within two Regions in Tanzania (Morogoro and Dodoma). These regions are situated in two distinct agro-ecological zones and, in general, represent about 70%–80% of the types of farming system found in Tanzania [30]. Table 1 provides a summary of main characteristics of the study areas in terms of agro-ecology, agricultural potential, access to major markets and cropping as well as livestock systems. The two study areas also differ with regards to food security. Morogoro fairs better but has areas with varying levels of food security while most areas in Dodoma are characterized by high food insecurity.

3.2. Data Collection

To enable a comparative analysis, two focus districts were selected from each region namely Kilosa in Morogoro and Chamwino in Dodoma (see Figure 2). In each district, three villages were chosen based on having relatively similar (1) village sizes (800–1500 households), (2) climatic conditions, (3) livestock integration and (4) rain-fed cropping systems. The selected villages were Ilolo, Ndebwe and Idifu for Chamwino district and Changarawe, Nyali and Ilakala for Kilosa district.
A primary household survey was then conducted in the six villages. Using household lists prepared by local agricultural extension officers in collaboration with village heads, 900 households were randomly selected, proportional to sub-village sizes. A total of 150 households were interviewed from each village. A detailed structured questionnaire was used to collect data at the household level. Apart from socio-demographic information, the questionnaire contained comprehensive sections on agriculture, livestock, off-farm employment, non-farm self-employment and food consumption and expenditure. It also captured seasonal aspects of food consumption at the household level.

3.3. Measures of Diversity

We use several variables to measure farm production diversity and household food consumption diversity. With respect to farm production diversity, we use two indicators. The first is based on species count for both crops and livestock, as recommended by Last et al. [34] and used in several recent studies (see, for example, Jones et al. [3]; Pellegrini and Tasciotti [8]; Sibhatu et al. [9]). In this indicator, a household cultivating three crops (e.g., maize, sorghum and groundnuts) and keeping cattle only will have a crop-livestock count of 4. The second measure uses the number of food groups produced on the farm to generate production diversity scores. Based on our data, we use 9 food groups (cereals; roots, tubers and plantains; pulses, seeds and nuts; fruit; vegetables; fish; meat; eggs; and milk and dairy products). In this case, a household cultivating only maize, rice and sorghum will have a production diversity score of 1, because all crops belong to cereals. Conversely, if a household cultivates maize and groundnuts and keeps goats, the diversity score will be 3, as they fall under different food groups. This indicator addresses the fact that crops and livestock produced on a farm might have different nutritional functions and hence affect household food consumption diversity differently [35,36]. In general, these indicators are suitable for comparison among farms and regions [34] and also allow for a comprehensive analysis of a typical smallholder farm production, which, in most cases, integrates crops and livestock. Alternative indicators in the literature include (1) the Simpson’s Index, which measures species diversity and accounts for both, species richness and evenness and (2) the modified Margalef species richness index [34,37]. However, the use of these indicators in the present analysis would limit the scope to crops only as both measures require land area in their computation. For household food consumption diversity, we also use two indicators. These are the Household Dietary Diversity Score (HDDS) and the Food Variety Score (FVS). Following Swindale and Bilinsky [38], HDDS is constructed from the number of different food groups consumed by a household in a specified reference period, in our case a 7-day period. We use 9 food groups as those used in the indicator for production diversity above. We also extend the HDDS indicator to capture household dietary patterns during planting, pre-harvest and post-harvest seasons. For this, households were asked how many days in a normal week they would eat foods from a certain food group for each season in the past year. Overall, although the HDDS does not measure dietary quality, it is widely used as an indicator of household economic access to a variety of foods [39]. On the part of the FVS, this indicator records the number of different food items eaten during a specified reference period [40]. A 7-day recall period is also used based on the previous normal week.

3.4. Empirical Strategy

In assessing the relationship between farm production diversity and household food consumption diversity, we first examine determinants of farm production diversity and then analyze how this diversity is associated with household food consumption diversity outcomes.

3.4.1. Analyzing the Determinants of Farm Production Diversity

Observed farm production diversity may be influenced by different household, farm, institutional and locational characteristics. Farm production diversity is represented as a score for both diversity indicators i.e., crop-livestock count, and the number of food groups produced. We therefore use a Poisson regression model which is suitable for analyzing count variables. Following Green [41], the model is specified as:
E ( y i | x i ) = exp ( α + X β ) y i = 0 , 1 , , i
where y i represents the level of farm production diversity by household i, X i represents a vector of explanatory variables and β is a vector of parameters to be estimated.
Drawing from literature on farm production diversity, the predicting variables include household, farm and locational characteristics. Household socio-demographic characteristics such as age and gender are important in influencing the skills, experiences, risk attitude, willingness and ability to maintain different levels of diversity in their production [22]. These may influence farm production diversity either positively or negatively. For example, while older household heads may be less able and eager to maintain higher diversity especially for new crop or livestock varieties as compared to younger ones, the accumulated skills and experience in farm production may influence farm production positively. Also, depending on the level of control of household productive assets such as land, labor and equipment, female headed households may maintain more or less diversity at the farm. Education, on the other hand, is expected to influence farm production diversity positively as it enhances skills and use of information for maintaining different varieties of crops and livestock [22]. Household productive assets such as land and labor are expected to have a positive influence on farm production diversity [22]. Locational factors are equally important. As distances to key services and markets increase, transaction costs increase thus compelling households to allocate land to more diverse production to cater for expected consumption [8,22].

3.4.2. Analyzing the Influence of Farm Production Diversity on Consumption Diversity

Food consumption diversity may be influenced by farm production diversity as well as a set of other factors. Specifically, household socio-economic characteristics (such as age, gender and education) and market related factors are important when analyzing diversity of food consumption at the household beyond farm production diversity. For example, gender of the household may determine the control of household resources and how they are allocated [3]. Household income in female-headed household may be spent more on quality diets than that of male-headed households. Household productive assets such as land, labor and livestock may also enhance household’s production capacity and thus influencing food consumption diversity positively. Household wealth is expected to play a strong positive role in enhancing food consumption diversity because it increases the ability of households to afford diverse diets [3]. Households with higher consumption expenditure are therefore expected to have higher food consumption diversity. Equally important is the fact that food consumption diversity may also be influenced by market access [9]. Proximity to markets and purchasing power to access different food items are expected to raise household food consumption diversity. Proximity to markets enables market-oriented smallholders to take advantage of lucrative product markets thereby enhancing incomes which may be spent on accessing diverse diets [3]. In addition, income from non-farm self-employment and other sources is essential in raising household’s purchasing power, thus expected to enhance food consumption diversity.
In assessing the link between food consumption diversity and farm production diversity, we also use a Poisson regression model following the basic specification in Equation (1). In this, food consumption diversity is measured as a score based on HDDS and FVS. However, Poisson regressions assume equi-dispersion (that is, the conditional mean of the dependent variable is equal to its variance). In absence of equi-dispersion, the estimates from Poisson regression may be inefficient and biased [41]. A negative binomial regression model is appropriate in this case as it can be used in case of violation of the equi-dispersion assumption. This model is given by:
E ( y i | x i , ε ) = exp ( α + X β + ε )   With   variance   V a r ( y i | x i , ε ) = λ ^ i α λ i 2
From its functional form, a negative binomial regression model relaxes the assumption of equi-dispersion and thus suitable in cases of over-dispersion. We therefore employ this regression model, when tests suggest that a Poisson regression model is inappropriate.
Furthermore, we test for potential collinearity among independent variables and also use robust standard errors to address problems of heteroscedasticity in the estimates. Given the cross-sectional nature of the data, our analysis is restricted to potential relationships between key explanatory factors and food consumption diversity. Thus, results should not be interpreted as causal but rather correlational.

4. Results

4.1. Descriptive Results

4.1.1. Sample Characteristics

Table 2 presents the characteristics of the sample at the household and farm-level for Kilosa and Chamwino, as well as a pooled sample covering the two districts. In the two districts, farm level characteristics showed important differences. In particular, households in Chamwino district possessed more land and livestock and have more cultivated plots and crops grown, on average, as compared to those in Kilosa district. Levels of self-provision of food seemed to also be higher in Chamwino evidenced by higher share of home consumption from total output. Furthermore, greater distance to paved roads suggests poor access to markets and key services. This was not the case for Kilosa which has a better proximity to markets.

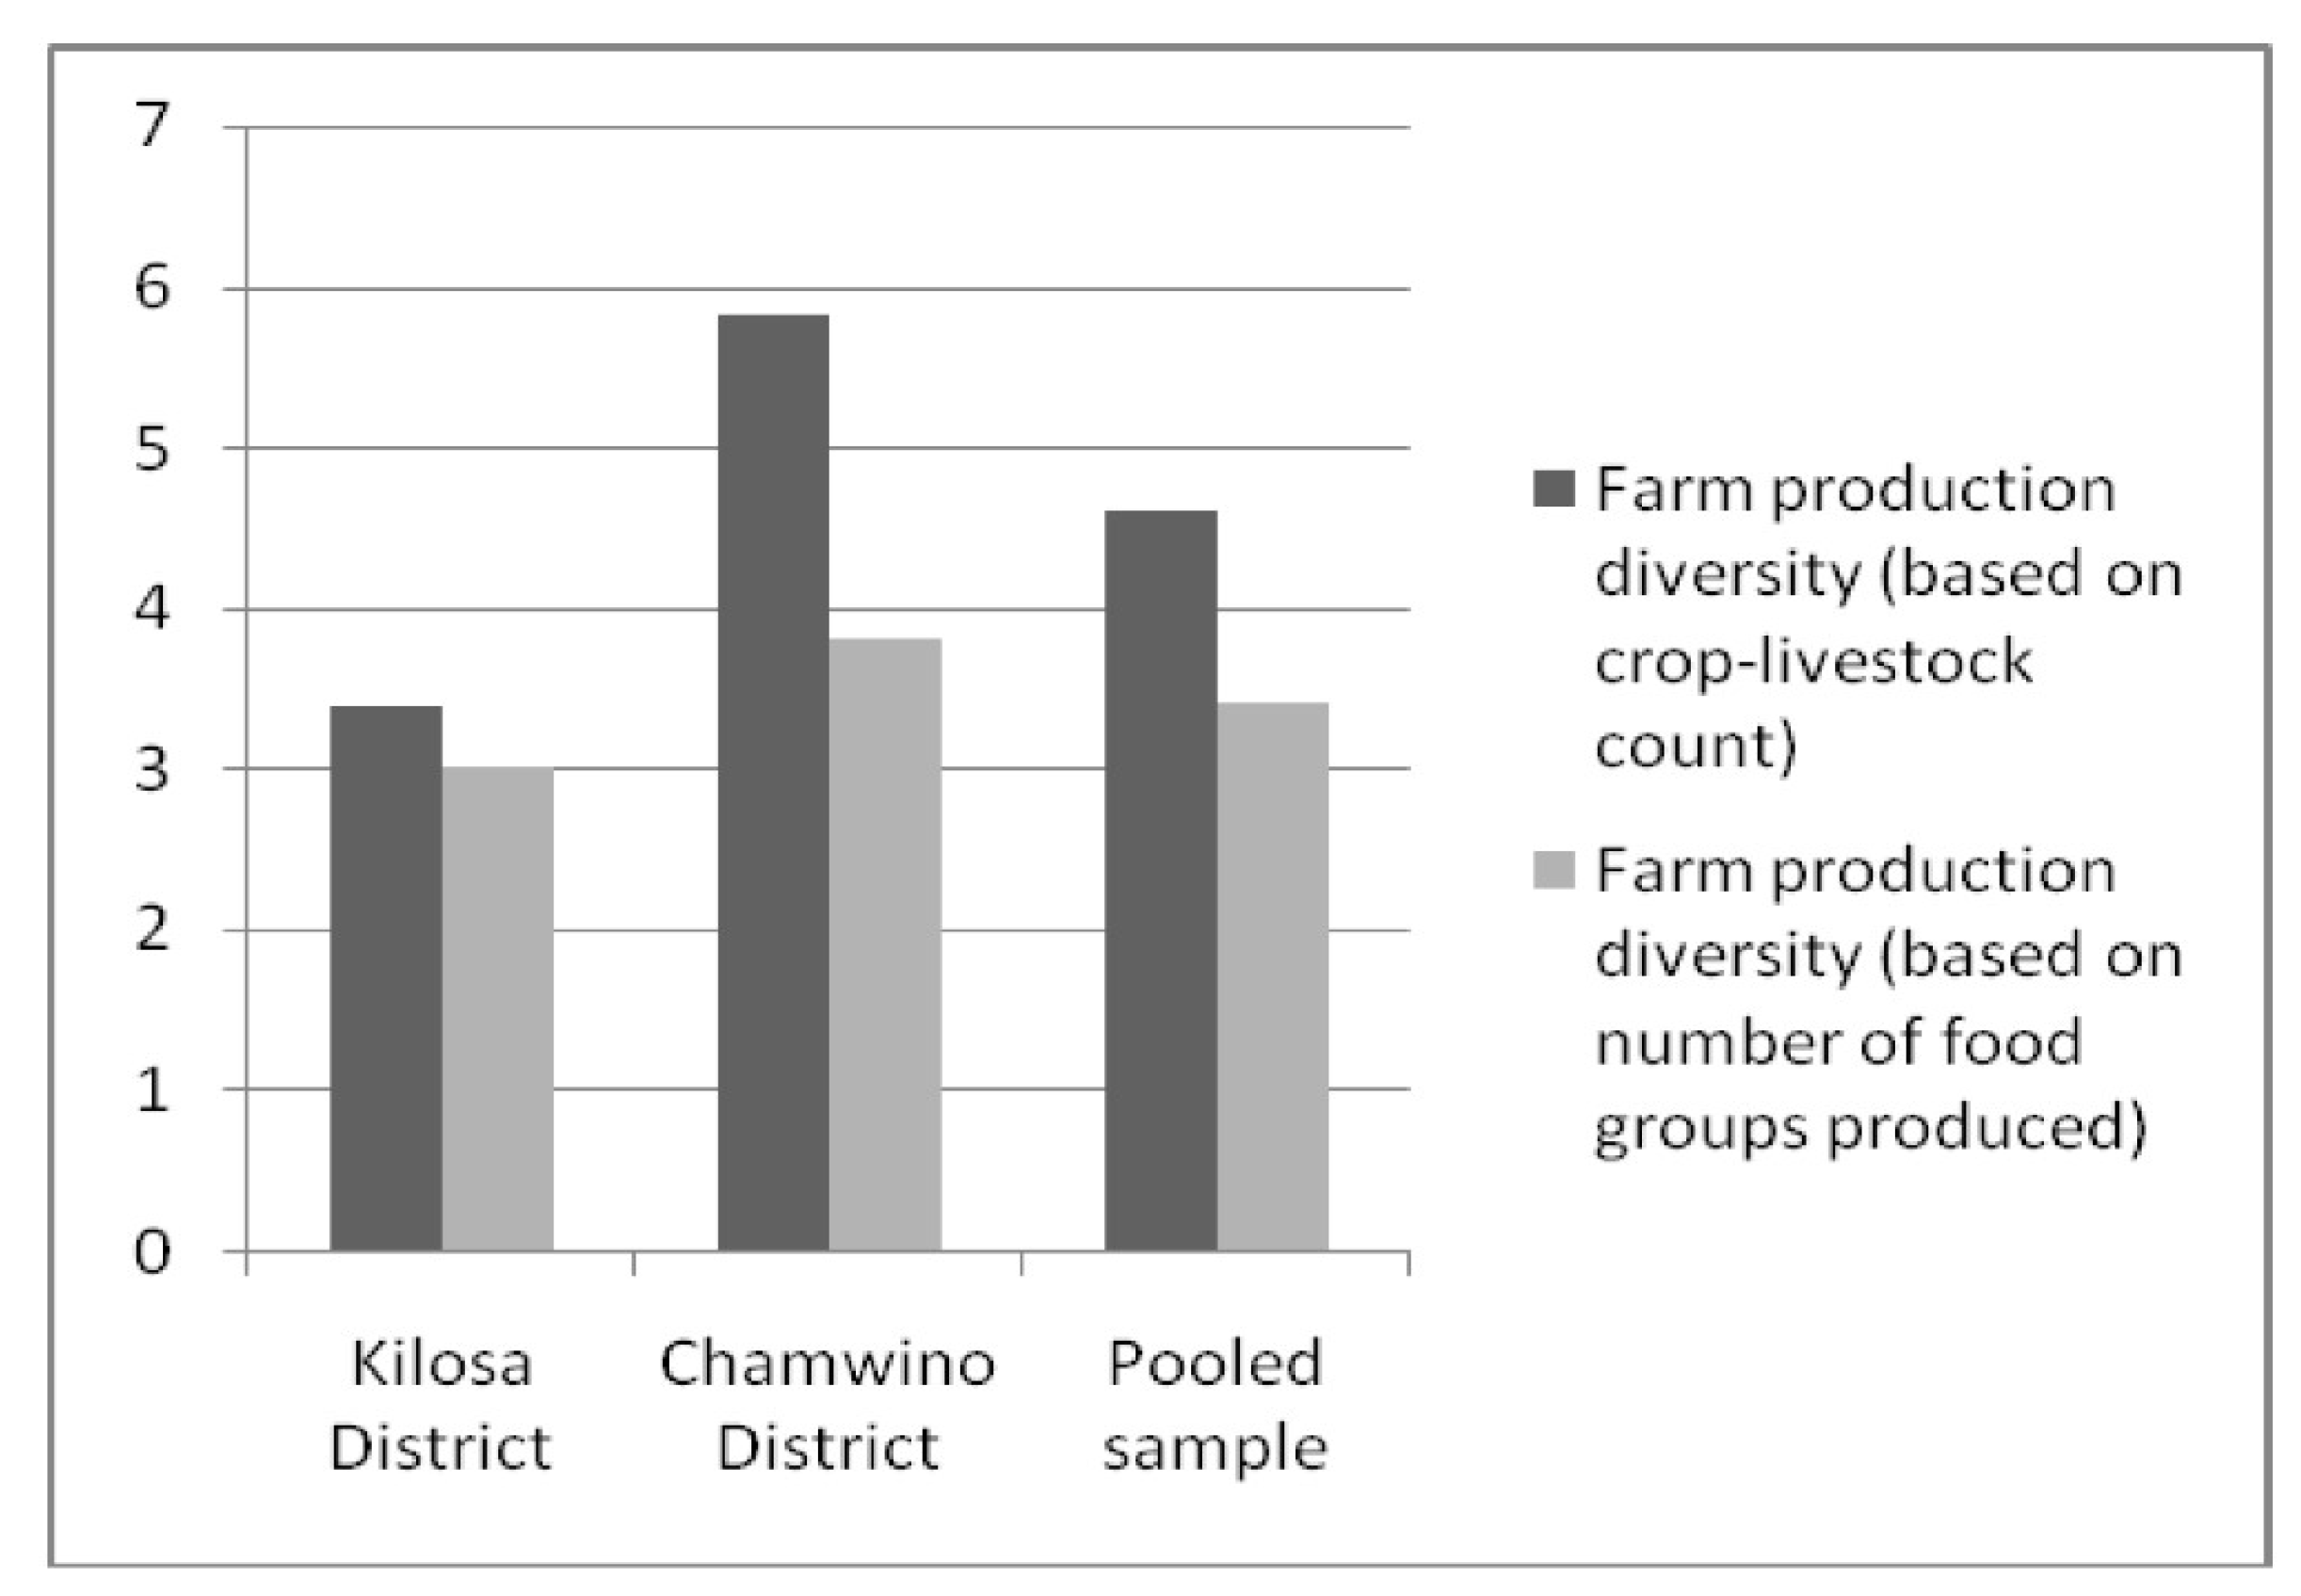
4.1.2. Comparison of Farm Production Diversity by Agro-Ecology and Market Access

Figure 3 provides a comparison of farm production diversity indicators based on agro-ecological and market access characteristics in Kilosa and Chamwino districts. It also presents the overall levels of farm production diversity using data pooled from the two districts. Overall, significant differences in farm production diversity can be observed between the two districts. Specifically, diversity based on crop-livestock count was significantly lower for Kilosa compared to that of Chamwino. Similarly, diversity based on the number of food groups produced showed the same pattern. In both districts, however, cereals constituted the main food group that is produced. In Kilosa, the second, third and fourth most important food groups produced were pulses, seeds and nuts. In Chamwino, on the other hand, the ‘pulses, seeds and nuts’ food group ranked second in terms of production after cereals.

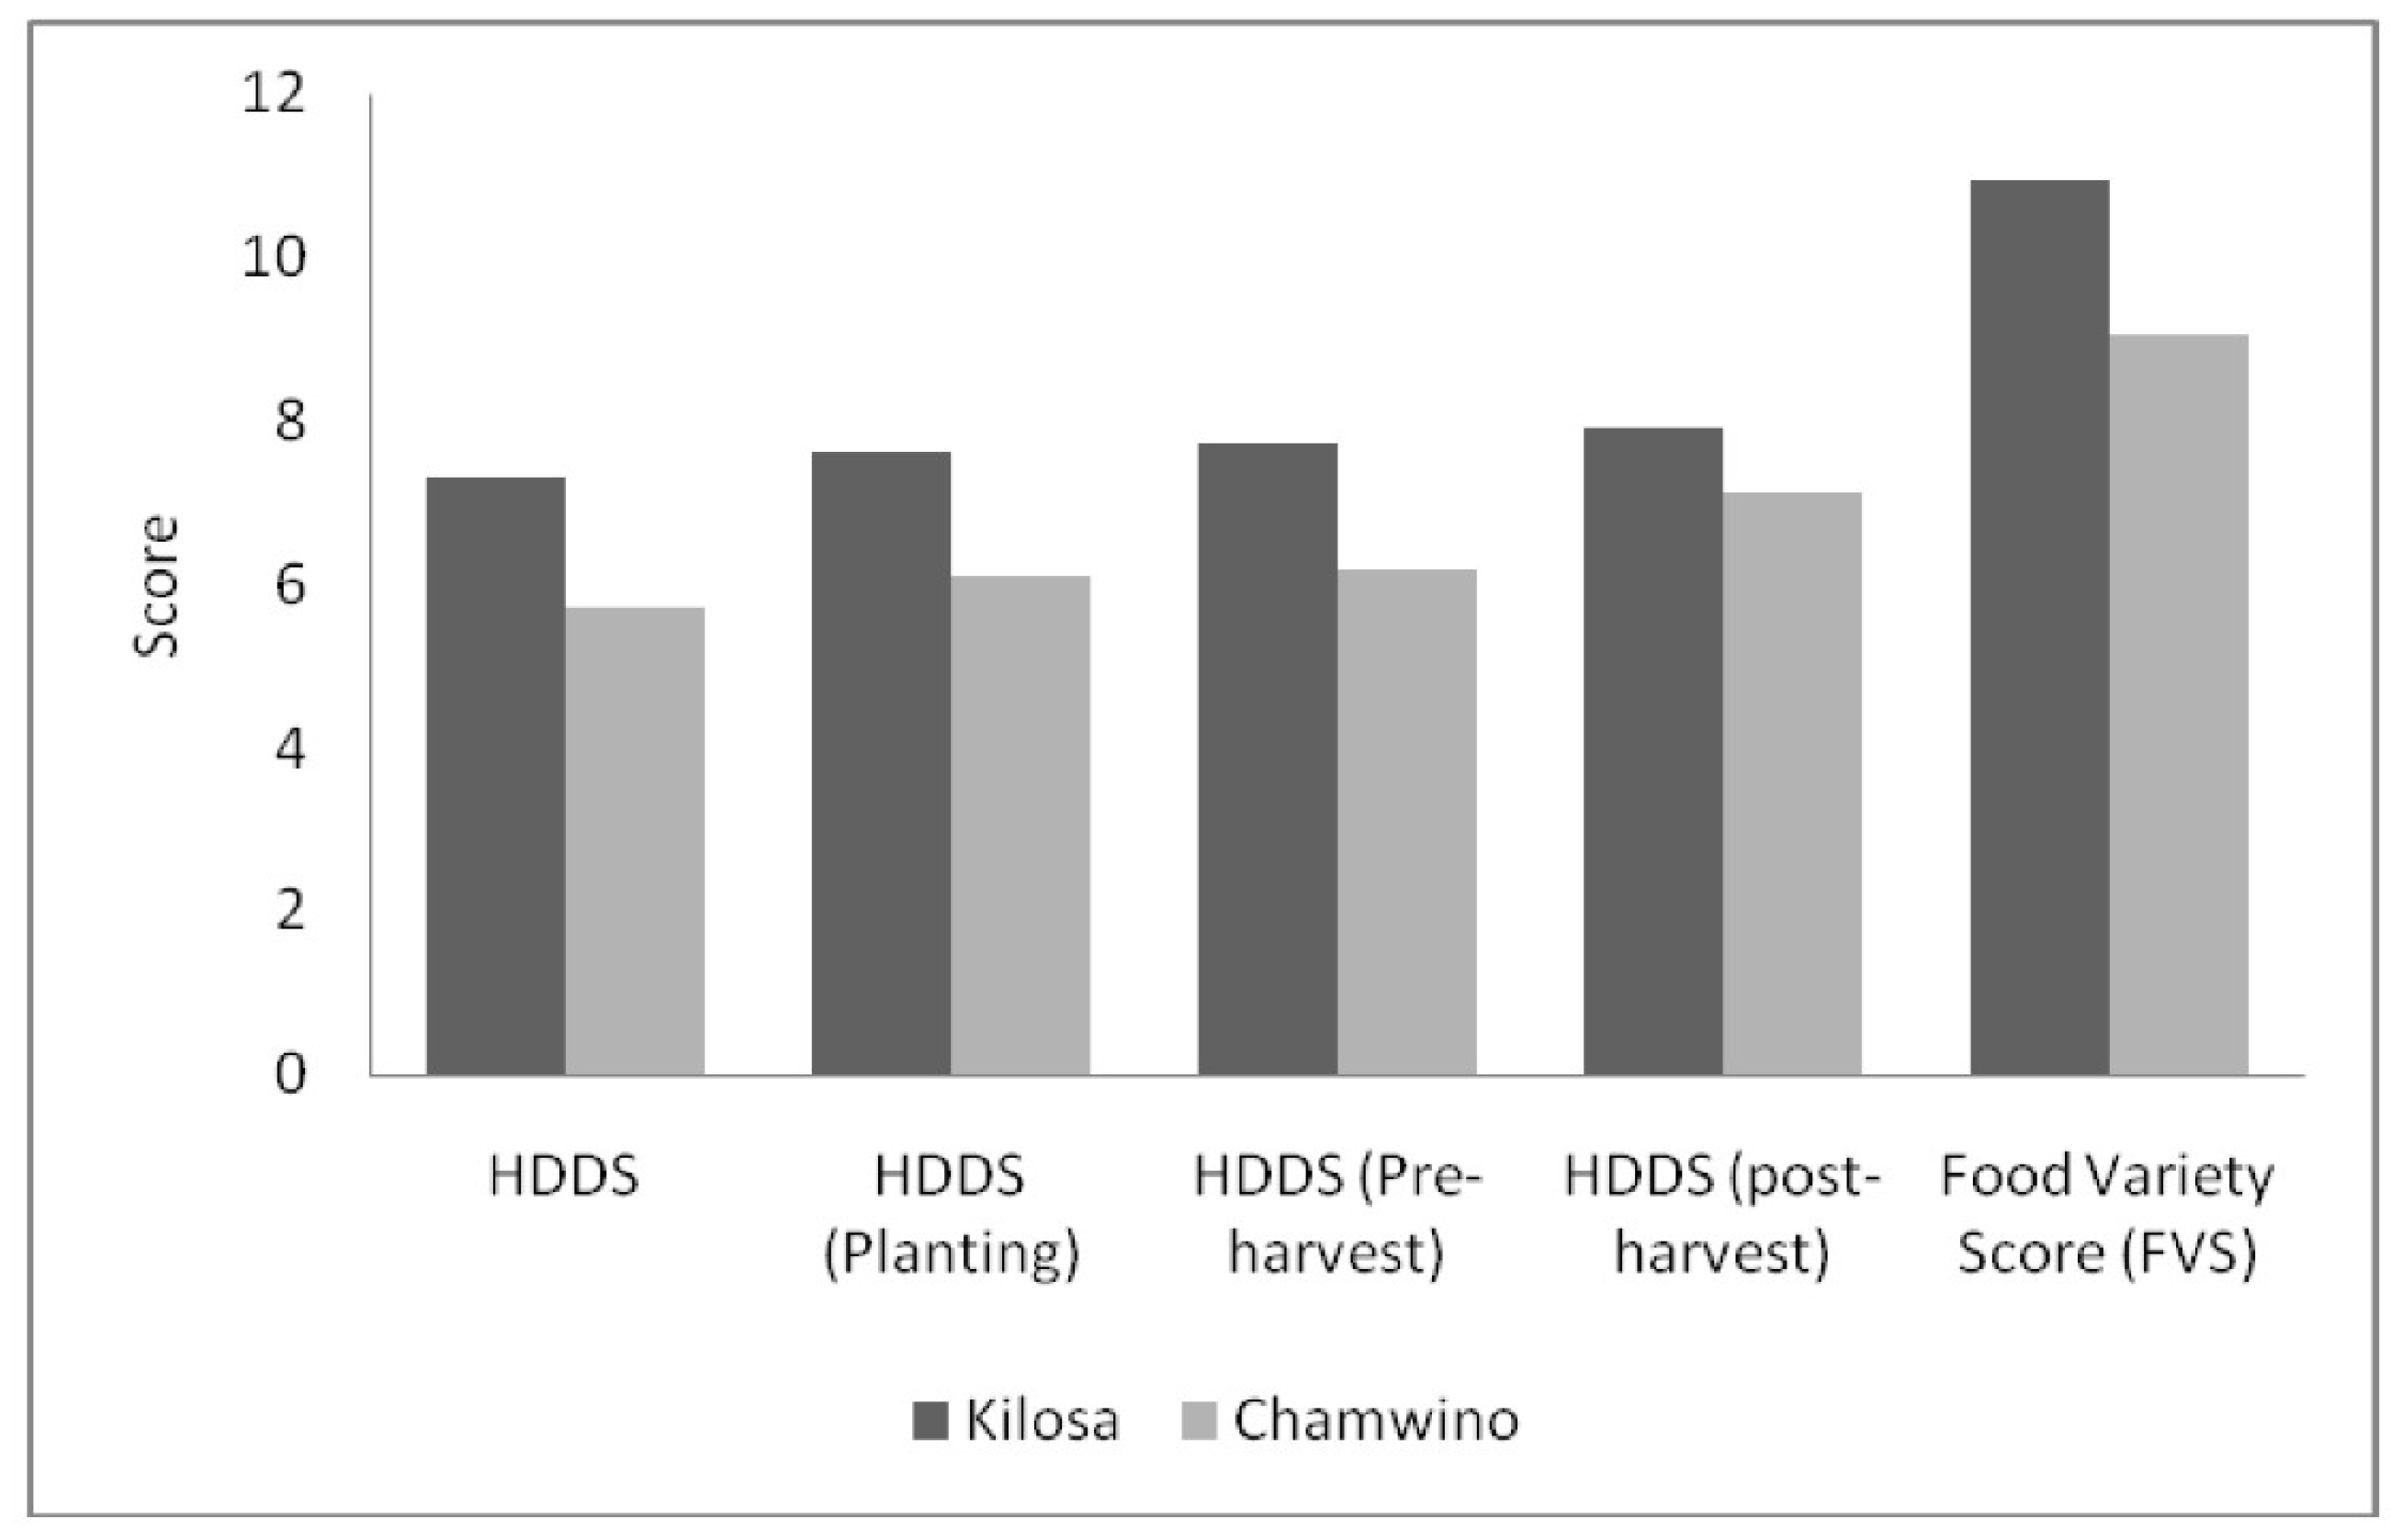
4.1.3. Comparison of Food Consumption Diversity in Kilosa and Chamwino Districts

Food consumption diversity was higher for households in Kilosa district, compared to those in Chamwino (see Figure 4). This was despite the low farm production diversity observed in Kilosa. Notwithstanding the high farm production diversity in Chamwino, the household food consumption diversity was relatively low compared to Kilosa, consistently for both measures of food consumption diversity (HDDS and FVS) and for the planting, pre-harvest and post-harvest agricultural seasons. A deeper look into the data shows that among the food groups, cereals dominated in terms of consumption for both districts. Additionally, although Kilosa fared better in terms of food consumption diversity, vegetables, and pulses, seeds and nuts were important food groups that were consumed in both districts. However, meat, and milk and dairy products food groups were least consumed in the districts.
We also compared food consumption diversity based on low and high farm production diversity of households (Table 3). To achieve a simplified comparison, the threshold for high and low diversity was determined by median values of the crop-livestock diversity indicator. Households with crop-livestock diversity above the median were classified as having high production diversity while those below the median were considered to have low production diversity. For Kilosa district, crop-livestock diversity ranges from 1 to 12 with the median value of 3. For the case of Chamwino district, the median crop-livestock diversity was 4 with diversity ranging from 1 to 14. Consistently, results showed that households with high production diversity had higher food consumption diversity based on HDDS and FVS in both districts, though this difference was not significant in a few cases. In Chamwino, the difference was far more significant thus suggesting a stronger role of farm production diversity. Despite the difference in food consumption diversity between the low and high production diversity households, cereals, vegetables, and pulses, seeds and nuts still dominate in both groups as the main food groups consumed.

4.2. Determinants of Farm Production Diversity

In the analysis of factors determining the observed farm production diversity, we present results based on crop-livestock count and the number of food groups produced—our primary indicators of farm production diversity—as dependent variables. Despite a few differences, the results from the two indicators of diversity provided a similar picture. Here we interpret the Poisson regression results based on crop-livestock count for both regions and the pooled sample (Table 4).
Results showed that farm production diversity is positively and significantly influenced by age of household head, availability of labor in the household and access to credit, for both Kilosa and Chamwino districts. For Kilosa, column (1), education of the household head and access to non-farm self-employment were also significantly and positively associated with increased farm production diversity. Interestingly, increased distance to nearest paved road had a significant positive influence on production diversity only for Kilosa with better market access suggesting an increased role of self-sufficiency for households far from market opportunities. However, for Kilosa and the pooled sample, agricultural shocks were negatively associated with farm production diversity. This could suggest that resource-constrained households may opt for a few highly resistant crops and livestock—or even venture into non-agricultural activities—after the experience of agricultural shock. In addition, the onset of an agricultural shock (such as drought, crop pests or unusually heavy rainfall) may have severe and negative impacts which may further reduce their agricultural production including its diversity. For Chamwino, the preparedness of a household to undertake risk, availability of land and other assets were significant in raising farm production diversity. Locational dummies also confirm the pattern observed in descriptive analysis, where residing in villages in Kilosa was negatively related to farm production diversity, unlike in Chamwino.

4.3. The Role of Farm Production Diversity on Household Food Consumption Diversity

In the analysis of the role of farm production diversity on food consumption diversity of households, we used several regression models. As pointed out earlier, the aim was to assess this relationship based on the two regions with distinct agro-ecological and market access characteristics as well as to ascertain whether farm production diversity plays a role in influencing seasonal food consumption diversity. For farm production diversity, we used crop-livestock count and the number of food groups. To get insights on food consumption diversity and its seasonal nature, the dependent variables were HDDS and FVS; and HDDS (planting), HDDS (pre-harvest) and HDDS (post-harvest) respectively. All regression models were estimated with Poisson regression except for FVS which were estimated with negative binomial regressions. In the latter regressions, the test of the over-dispersion parameter indicated that alpha is significantly different from zero, suggesting inappropriateness of Poisson regression. Table 5 presents these results showing the determinants of food consumption diversity.
Taking the case of crop-livestock count, results showed that farm production diversity had an overall positive and significant influence on household food consumption diversity. Going beyond farm production diversity, results also showed that household food consumption diversity was also influenced by market access characteristics. Access to market information and income from non-farm self-employment was significantly associated with increased food consumption diversity. Similarly, per capita food expenditure per month was positively related to food consumption diversity indicating that sourcing of different varieties of food from markets seems to be a relevant factor. Distance to nearest paved road was negatively related to food consumption diversity suggesting that market access plays an important role. Specifically, residing far from markets lowers the level of food consumption diversity in the households. A largely similar pattern of influences was observed for results of regressions using the number of food groups produced as an indicator of farm production diversity (see Table 6).
While results for district-specific regressions (presented in Table A1, Table A2, Table A3 and Table A4) showed almost consistent positive effects of farm production diversity on household food consumption diversity for Chamwino district, the same effects were not observed for Kilosa, except for HDDS (planting). The magnitudes of effects are also consistently higher for the former than the latter. The results suggest that the role of farm production diversity is more pronounced in Chamwino, which has relatively poor market access and agricultural potential as compared to Kilosa district with better market access. Additionally, the crop-livestock indicator showed that farm production diversity had a positive effect on seasonal food consumption diversity. However, the role of market access was less pronounced for Chamwino district. Despite a significant influence of access to market information on food consumption diversity, distance to nearest paved road and access to income from non-farm self-employment (except for HDDS for post-harvest) were insignificant. However, there was still a significant positive association between per capita food expenditure per month and household food consumption diversity.

5. Discussion

5.1. The Nature and Drivers of Farm Production Diversity

Typical to smallholder farming systems, our results showed that households’ farm production is rather diverse, constituting of a variety of crops and livestock species. Farm production diversity was substantially higher in Chamwino district which has a semi-arid agro-ecology with less agricultural potential and market access compared to Kilosa district. The agro-ecology of Chamwino district supports a ‘pastoralist/agro-pastoralist’ farming system [42]. This partly contributed to the observed higher levels of farm production diversity. In addition, unlike in Kilosa, the semi-arid nature of Chamwino implies that households may experience more frequent periods of food insecurity and other shocks such as drought. In areas with fragile agro-ecologies farm production diversity has been argued to be an important strategy. Thus, smallholders may diversify their agricultural production as a risk mitigation strategy from the negative effects of weather shocks and other agro-ecological conditions [5].
Regarding determinants of farm production diversity within the two agro-ecological regions, results suggest that households’ socio-economic characteristics and endowments in terms of land and labor play an important role. These results were also in line with the results of Benin et al. [21] and Di Falco et al. [22]. In addition to age and education, households’ preparedness to undertake risk was correlated with increased farm production diversity especially in Chamwino district which has a relatively fragile agro-ecology. Farm production diversity was also significantly associated with access to land and labor, together with other agricultural assets. Interestingly, occurrence of agricultural shocks was associated with decreased diversity of farm production. As noted, this may be particularly the case for resource-constrained households. Porter [43], for example, argued that when households lack access to assets or credit markets, shifting labor resources to other non-agricultural activities may be the only coping strategy at their disposal in the event of agricultural shocks. Similar to observations by Benin et al. [21], our results also underscored the role of location, particularly with respect to agro-ecological conditions and proximity to markets. Fundamentally, ecological characteristics of different locations—such as soil, climate, water availability and altitude—are instrumental in enhancing or diminishing diversity in farms, villages and agro-ecological zones [13]. Also, in line with the findings of Sibhatu et al. [9], market access equally played an important role in influencing farm production diversity. Households in villages which were least accessible to markets have higher farm production diversity, even within the same agro-ecological region signaling increased self-provisioning of food through increased diversity of farm production.

5.2. The Influence of Farm Production Diversity on Food Consumption Diversity

Farm production diversity has increasingly been considered important in improving food consumption especially for smallholder rural households [8,9,12,13]. Results from our analysis showed that this role is largely dependent on agro-ecological characteristics and market considerations. While farm production diversity played a significant and positive role for household food consumption diversity in Chamwino district, this role was rather small in Kilosa district. This was observed for both indicators of food consumption diversity, that is, HDDs and FVS. The significant role of farm production diversity in Chamwino may be partly attributed to the challenging agro-ecological characteristics and low market access. In these contexts, households resort to subsistence production to cater for food consumption needs. KC et al. [11] also observed the same pattern in a study in Nepal, where the role of crop diversity on food self-sufficiency was stronger in agro-ecological regions which are less accessible and with low market access. Similarly, Di Falco and Chavas [37] found that the benefits of crop biodiversity were more pronounced in ecologically fragile agricultural systems. Kilosa, on the other hand, has relatively better agro-ecology and subsequently a higher agricultural potential. The region has, however, far less diversity of production with mainly maize-legume cropping system with little livestock integration. Cereals, vegetables, and pulses, seeds and nuts constitute the main groups of crops produced in the district.

5.3. The Role of Market Access in Food Consumption Diversity

Recent studies have also shown that food consumption diversity for smallholder households may be influenced by factors beyond farm production. In essence, most smallholders are neither strictly subsistence-oriented nor market-oriented [3]. As noted earlier, our analysis shows that household food consumption expenditure was positively associated with food consumption diversity. This partly suggests that households with higher food consumption expenditure spend on more diverse food items that are available in food markets. In Kilosa district where the contribution of farm production diversity was largely insignificant, access to markets, both for selling of agricultural produce and purchases of food, appeared to play a significant role in influencing household food consumption diversity. Descriptive analysis showed that, despite low farm production diversity, households in Kilosa had higher food consumption diversity compared to those in Chamwino. This may be associated with better agricultural potential and market access in Kilosa as compared to Chamwino. As noted by Sibhatu et al. [9], increased market transactions tend to lower the role of farm production diversity on food consumption. They note that better access to markets enable households to not only purchase diverse foods but also use their comparative advantage to produce and sell food and cash crops and hence generate higher agricultural incomes.

5.4. Farm Production Diversity and Seasonal Food Consumption

As aforementioned, farm production diversification has received increased attention due to its potential for enhancing seasonal food consumption. As Herforth [18] argued, for example, different crops may grow in different agricultural seasons and consequently increased farm production diversity may be beneficial in cases of seasonal food insecurity. Results from our regression models showed that both farm production diversity indicators were positively associated with increased food consumption diversity in the planting, pre-harvest and post-harvest seasons. Specifically, results showed that in Chamwino, where the role of markets was low, and production was oriented towards food crops and livestock, farm production diversity had a significant positive role in seasonal food consumption diversity. However, with an exception for the planting season, this relationship was not significant for Kilosa which had lower farm production diversity. Nevertheless, the results from Chamwino and the pooled sample offer insights on the potential positive role of farm production diversity can play in enhancing food consumption diversity.

5.5. Limitations

Several potential limitations are worth highlighting. First, the link between farm production diversity and household food consumption diversity is a complex one. As Jones et al. [3] observes, this relationship is influenced by many factors. While we attempted to include the relevant aspects in line with the literature and the focus of the present article, these factors may not be entirely exhaustive. For example, cultural values may influence consumption of particular food items, but this may be difficult to capture in the analysis. Second, HDDS is an indicator that is based on household recall of food consumption in the previous 24 h or 7 days. Given the cost and time limitations for collecting data on seasonal food consumption in each agricultural season, we rely on recall also for seasonal food consumption diversity. Therefore, our modified HDDS for planting, pre-harvest and post-harvest relies on relatively long recall periods. Apart from this, however, the indicator provides a similar pattern of food security in our sample as other indicators used such as the normal HDDS and FVS. Despite these potential limitations, the analysis provides unique empirical insights on the smallholder households’ production-consumption link using two distinct agro-ecological and market access contexts.

6. Conclusions

This article assessed how farm production diversity influences household food consumption diversity in two districts (Kilosa and Chamwino) with distinct agro-ecological and market access contexts in rural Tanzania. Specifically, (1) it examined the nature and extent of farm production diversity, and its determinants, and (2) it analyzed the role of farm production diversity on household food consumption diversity.
Findings reveal that smallholder households maintain a considerable diversity in their production, both for crops and livestock. However, significant differences exist between the two agro-ecological regions with regards to farm production diversity and food consumption diversity. While low farm production diversity was observed in Kilosa district, households in Chamwino districts had significantly higher farm production diversity in terms of crops and livestock. Regarding the role of farm production diversity in household food consumption diversity, our results underscore findings from earlier studies that this relationship is largely dependent on agro-ecological characteristics and market contexts, among other factors. Results showed that, while farm production diversity was significantly associated with increased food consumption diversity in Chamwino, the same relationship was not observed in Kilosa. This influence was also observed for seasonal food consumption diversity, particularly in Chamwino which suggests additional benefits for smallholder farm production diversification. These observations suggest a stronger role of farm production diversity on food consumption diversity in areas with challenging agro-ecological characteristics and low market accessibility, and a lesser role in presence of better agro-ecological and market access characteristics.
These findings imply that, strategies geared at promoting farm production diversity should consider the existing agro-ecological and market characteristics. In challenging agro-ecological settings and less accessible rural communities, farm production diversity can be more beneficial in enhancing food security and, most importantly, seasonal food consumption diversity. In addition, to achieve increased food consumption diversity in farm households, the focus of policy should not only be on increasing diversity of smallholder farm production but also aim at improvements in market related infrastructure and institutions.

Author Contributions

Conceptualization, L.K., A.F. and U.G.; Data curation, L.K.; Formal analysis, L.K. and A.F.; Methodology, L.K. and A.F.; Project administration, U.G.; Supervision, A.F.; Writing—original draft, L.K.; Writing—review & editing, A.F. and U.G.

Funding

This research was funded by the German Federal Ministry of Education and Research (BMBF) and the German Federal Ministry for Economic Cooperation and Development (BMZ) through the project “Trans-SEC” (www.trans-sec.org).

Acknowledgments

The authors would like to thank the research project “Trans-SEC” (www.trans-sec.org), the Institute for Environmental Economics and World Trade—Hannover, Germany and Ardhi University—Dar es Salaam, Tanzania for administrative and technical support during the undertaking of this research.

Conflicts of Interest

The authors declare no conflict of interest. The founding sponsors had no role in the design of the study; in the collection, analyses, or interpretation of data; in the writing of the manuscript, and in the decision to publish the results.

Appendix A

Table A1. Determinants of food consumption diversity in Chamwino (Production diversity indicator used: crop-livestock count).
VariableHDDSHDDS (Planting)HDDS
(Pre-Harvest)
HDDS
(Post-Harvest)
FVS
Crop-livestock count0.032 ***0.016 ***0.018 ***0.011 **0.051 ***
(0.006)(0.006)(0.006)(0.005)(0.009)
Age of HH head (years)−0.004 ***−0.003 ***−0.003 ***−0.002 ***−0.006 ***
(0.001)(0.001)(0.001)(0.001)(0.001)
Gender of HH head (Male = 1)−0.0220.044−0.039−0.027−0.030
(0.035)(0.036)(0.033)(0.027)(0.045)
Education of HH head (School years)0.003−0.0050.0010.0010.004
(0.004)(0.004)(0.004)(0.003)(0.006)
Land size owned (ha.)0.0010.0080.005−0.001−0.003
(0.008)(0.006)(0.006)(0.005)(0.010)
Livestock owned (TLU)0.0050.011 ***0.007 *0.007 **0.003
(0.004)(0.004)(0.004)(0.003)(0.007)
Labor (Worker equivalents)−0.0010.000−0.0010.0080.009
(0.009)(0.009)(0.010)(0.007)(0.013)
Per capita per month: Low-middle0.0250.0510.0020.0030.021
(0.040)(0.049)(0.043)(0.033)(0.054)
Per capita per month: Middle0.0200.163 ***0.075 *0.0330.041
(0.045)(0.049)(0.044)(0.034)(0.057)
Per capita per month: High-middle0.124 ***0.209 ***0.124 ***0.075 **0.157 ***
(0.044)(0.046)(0.044)(0.033)(0.055)
Per capita per month: High0.114 **0.225 ***0.147 ***0.073 **0.161 **
(0.048)(0.052)(0.052)(0.036)(0.066)
Share of home consumption−0.006−0.0070.008−0.001−0.002
(0.033)(0.034)(0.033)(0.026)(0.043)
Access to market information (Yes = 1)0.123 ***0.124 ***0.147 ***0.079 ***0.131 ***
(0.029)(0.029)(0.029)(0.023)(0.037)
Distance to nearest paved road0.000−0.0050.003−0.0050.003
(0.009)(0.009)(0.009)(0.008)(0.012)
Access to off-farm employment (Yes = 1)−0.0120.044−0.005−0.0060.005
(0.029)(0.029)(0.028)(0.022)(0.038)
Access to non-farm self-employment (Yes = 1)0.0440.0390.0140.056 ***0.031
(0.028)(0.027)(0.027)(0.020)(0.038)
Household asset holding (asset score)0.000 ***0.000 **0.000 **0.0000.000 ***
(0.000)(0.000)(0.000)(0.000)(0.000)
Household resides in Ilolo village0.048−0.0010.059−0.0240.065
(0.054)(0.055)(0.054)(0.047)(0.078)
Household resides in Ndebwe village0.0350.0260.082 **0.0230.045
(0.035)(0.036)(0.034)(0.028)(0.045)
Constant1.556 ***1.597 ***1.605 ***1.934 ***1.908 ***
(0.132)(0.132)(0.126)(0.104)(0.175)
ln(alpha) −3.673
(0.369)
Alpha 0.785
(0.095)
Observations449449449449449
Wald chi2166.31130.43117.4472.48127.74
Probability > chi20.000.000.000.000.00
Pseudo R20.0340.0320.0270.0130.052
Table A2. Determinants of food consumption diversity in Chamwino (Production diversity indicator used: Number of food groups produced).
HDDSHDDS (Planting)HDDS
(Pre-Harvest)
HDDS
(Post-Harvest)
FVS
Number of food groups produced0.048 ***0.0150.030 **0.0140.061 ***
(0.013)(0.014)(0.014)(0.012)(0.016)
Age of HH head (years)−0.004 ***−0.003 ***−0.002 *−0.002 **−0.005 ***
(0.001)(0.001)(0.001)(0.001)(0.001)
Gender of HH head (Male = 1)0.0010.068−0.025−0.025−0.026
(0.036)(0.043)(0.041)(0.034)(0.046)
Education of HH head (School years)0.001−0.0060.0010.0030.003
(0.004)(0.005)(0.005)(0.004)(0.006)
Land size owned (ha.)0.0070.016 *0.0110.0010.010
(0.007)(0.008)(0.008)(0.007)(0.010)
Livestock owned (TLU)0.0070.021 ***0.015 ***0.013 ***0.007
(0.006)(0.005)(0.005)(0.004)(0.007)
Labor (Worker equivalents)−0.004−0.005−0.0120.0100.013
(0.009)(0.011)(0.012)(0.009)(0.013)
Per capita per month: Low-middle−0.0040.027−0.0240.0120.034
(0.041)(0.054)(0.052)(0.040)(0.055)
Per capita per month: Middle0.0420.171 ***0.0810.0540.060
(0.045)(0.055)(0.052)(0.042)(0.058)
Per capita per month: High-middle0.124 ***0.211 ***0.143 ***0.112 ***0.167 ***
(0.045)(0.054)(0.054)(0.042)(0.056)
Per capita per month: High0.116 **0.239 ***0.166 ***0.100 **0.197 ***
(0.050)(0.060)(0.064)(0.047)(0.068)
Share of home consumption−0.001−0.050−0.003−0.029−0.023
(0.033)(0.040)(0.040)(0.032)(0.044)
Access to market information (Yes = 1)0.125 ***0.169 ***0.177 ***0.093 ***0.141 ***
(0.030)(0.035)(0.035)(0.028)(0.038)
Distance to nearest paved road−0.006−0.012−0.004−0.013−0.000
(0.009)(0.010)(0.011)(0.010)(0.013)
Access to off-farm employment (Yes = 1)−0.0000.067 *0.009−0.0120.014
(0.030)(0.035)(0.035)(0.028)(0.039)
Access to non-farm self-employment (Yes = 1)0.0380.028−0.0030.073 ***0.034
(0.030)(0.033)(0.034)(0.027)(0.039)
Household asset holding (asset score)0.000 ***0.000 ***0.000 ***0.0000.000 **
(0.000)(0.000)(0.000)(0.000)(0.000)
Household resides in Ilolo village0.048−0.0730.014−0.0860.081
(0.055)(0.066)(0.069)(0.057)(0.079)
Household resides in Ndebwe village0.055−0.0160.0610.0070.046
(0.035)(0.042)(0.042)(0.035)(0.046)
Constant1.286 ***1.489 ***1.407 ***1.785 ***1.933 ***
(0.136)(0.160)(0.163)(0.129)(0.181)
ln(alpha) −3.447
(0.308)
Alpha 0.823
(0.075)
Observations449449449449449
Wald chi2139.84162.66135.1186.41107.96
Probability > chi20.000.000.000.000.00
Pseudo R20.0270.0380.0310.0170.044
Table A3. Determinants of food consumption diversity in Kilosa (Production diversity indicator used: crop-livestock count).
HDDSHDDS (Planting)HDDS
(Pre-Harvest)
HDDS
(Post-Harvest)
FVS
Crop-livestock count0.0010.016 **0.0080.0060.008
(0.007)(0.005)(0.005)(0.005)(0.008)
Age of HH head (years)−0.002 **−0.001−0.000−0.000−0.002 **
(0.001)(0.001)(0.001)(0.001)(0.001)
Gender of HH head (Male = 1)0.0080.007−0.001−0.0230.015
(0.032)(0.029)(0.028)(0.024)(0.039)
Education of HH head (School years)0.0030.0020.0040.0040.001
(0.004)(0.003)(0.003)(0.003)(0.005)
Land size owned (ha.)0.0080.014 ***0.010 **0.012 ***0.007
(0.007)(0.005)(0.005)(0.004)(0.008)
Livestock owned (TLU)−0.0020.0000.0000.000−0.004 **
(0.001)(0.000)(0.000)(0.000)(0.002)
Labor (Worker equivalents)0.007−0.0010.0050.0060.012
(0.009)(0.008)(0.006)(0.005)(0.011)
Per capita per month: Low-middle0.051−0.041−0.025−0.0190.092 *
(0.042)(0.035)(0.037)(0.030)(0.053)
Per capita per month: Middle0.097 **0.0200.057 *0.0360.135 ***
(0.039)(0.030)(0.030)(0.026)(0.051)
Per capita per month: High-middle0.117 ***−0.0100.0280.0160.167 ***
(0.038)(0.030)(0.029)(0.025)(0.049)
Per capita per month: High0.154 ***0.0400.053 **0.038 *0.192 ***
(0.034)(0.028)(0.027)(0.022)(0.044)
Share of home consumption−0.036−0.036−0.028−0.034−0.048
(0.031)(0.026)(0.027)(0.023)(0.039)
Access to market information (Yes = 1)0.063 **0.039 *0.0240.038 *0.071 **
(0.027)(0.023)(0.023)(0.021)(0.033)
Distance to nearest paved road−0.033 ***−0.015 **−0.009−0.013 **−0.042 ***
(0.007)(0.006)(0.006)(0.005)(0.009)
Access to off-farm employment (Yes = 1)−0.065 **−0.051 **−0.0290.017−0.102 ***
(0.029)(0.024)(0.024)(0.018)(0.036)
Access to non-farm self-employment (Yes = 1)0.051 *0.0270.044 **0.039 **0.075 **
(0.026)(0.021)(0.019)(0.017)(0.034)
Household asset holding (asset score)−0.000−0.000−0.000−0.000−0.000
(0.000)(0.000)(0.000)(0.000)(0.000)
Household resides in Ilakala village−0.0130.0040.010−0.012−0.018
(0.028)(0.024)(0.024)(0.022)(0.033)
Household resides in Nyali village0.0070.064 ***0.049 **0.040 *0.036
(0.030)(0.025)(0.025)(0.023)(0.037)
Constant1.970 ***1.983 ***1.951 ***2.010 ***2.335 ***
(0.077)(0.072)(0.069)(0.063)(0.099)
Observations450450450450450
Wald chi2119.3556.2845.1448.03119.33
Probability > chi20.000.000.000.000.00
Pseudo R20.0210.0090.0060.0050.039
Table A4. Determinants of food consumption diversity in Kilosa (Production diversity indicator used: Number of food groups produced).
HDDSHDDS (Planting)HDDS
(Pre-Harvest)
HDDS
(Post-Harvest)
FVS
Number of food groups produced0.0090.0140.0060.0040.015
(0.009)(0.010)(0.010)(0.009)(0.011)
Age of HH head (years)−0.002 **−0.001−0.001−0.000−0.002 **
(0.001)(0.001)(0.001)(0.001)(0.001)
Gender of HH head (Male = 1)0.0120.0210.003−0.0280.013
(0.035)(0.036)(0.035)(0.031)(0.040)
Education of HH head (School years)0.0030.0030.0060.0050.001
(0.004)(0.004)(0.004)(0.004)(0.005)
Land size owned (ha.)0.0090.018 **0.013 *0.016 ***0.008
(0.008)(0.007)(0.007)(0.006)(0.010)
Livestock owned (TLU)−0.002 *0.002 **0.001 *0.001 **−0.003
(0.001)(0.001)(0.001)(0.001)(0.003)
Labor (Worker equivalents)0.000−0.0070.0010.0010.012
(0.010)(0.011)(0.009)(0.008)(0.011)
Per capita per month: Low-middle0.084 *−0.035−0.003−0.0030.091 *
(0.046)(0.045)(0.046)(0.040)(0.053)
Per capita per month: Middle0.120 ***0.0370.088 **0.0560.135 ***
(0.044)(0.041)(0.041)(0.036)(0.050)
Per capita per month: High-middle0.147 ***−0.0240.0300.0150.167 ***
(0.045)(0.043)(0.040)(0.037)(0.050)
Per capita per month: High0.172 ***0.0490.064 *0.0400.192 ***
(0.040)(0.040)(0.038)(0.034)(0.048)
Share of home consumption−0.025−0.071 **−0.053−0.065 **−0.053
(0.034)(0.036)(0.035)(0.031)(0.039)
Access to market information (Yes = 1)0.0470.0480.0340.050 *0.074 **
(0.030)(0.031)(0.030)(0.028)(0.034)
Distance to nearest paved road−0.029 ***−0.021 **−0.014 *−0.020 ***−0.043 ***
(0.009)(0.008)(0.008)(0.007)(0.010)
Access to off-farm employment (Yes = 1)−0.082 **−0.082 **−0.0380.014−0.102 ***
(0.034)(0.032)(0.032)(0.026)(0.039)
Access to non-farm self-employment (Yes = 1)0.0410.0380.061 **0.067 ***0.072 *
(0.029)(0.030)(0.029)(0.026)(0.040)
Household asset holding (asset score)0.0000.0000.000−0.000−0.000
(0.000)(0.000)(0.000)(0.000)(0.000)
Household resides in Ilakala village−0.035−0.0070.004−0.026−0.018
(0.031)(0.033)(0.032)(0.029)(0.037)
Household resides in Nyali village−0.0410.079 **0.063 *0.0470.040
(0.034)(0.034)(0.035)(0.032)(0.041)
Constant1.638 ***1.793 ***1.757 ***1.826 ***2.321 ***
(0.084)(0.093)(0.090)(0.082)(0.096)
Observations450450450450450
Wald chi2104.0259.6748.7256.5893.54
Probability > chi20.000.000.000.000.00
Pseudo R20.0190.0130.0090.0090.040

References

  1. Herrero, M.; Thornton, P.K.; Notenbaert, A.M.; Wood, S.; Msangi, S.; Freeman, H.A.; Bossio, D.; Dixon, J.; Peters, M.; van de Steeg, J.; et al. Smart investments in sustainable food production: Revisiting mixed crop-livestock systems. Science 2010, 327, 822–825. [Google Scholar] [CrossRef] [PubMed]
  2. International Fund for Agricultural Development (IFAD); United Nations Environment Program (UNEP). Smallholders, Food Security and the Environment; IFAD (International Fund for Agricultural Development): Rome, Italy; Nairobi, Kenya, 2013; Available online: https://www.ifad.org/documents/10180/666cac24-14b6-43c2-876d-9c2d1f01d5dd (accessed on 25 January 2018).
  3. Jones, A.D.; Shrinivas, A.; Bezner-Kerr, R. Farm production diversity is associated with greater household dietary diversity in Malawi: Findings from nationally representative data. Food Policy 2014, 46, 1–12. [Google Scholar] [CrossRef]
  4. Godfray, H.C.J.; Beddington, J.R.; Crute, I.R.; Haddad, L.; Lawrence, D.; Muir, J.F.; Pretty, J.; Robinson, S.; Thomas, S.M.; Toulmin, C. Food security: The challenge of feeding 9 billion people. Science 2010, 327, 812–818. [Google Scholar] [CrossRef] [PubMed]
  5. Dorward, A. The short- and medium- term impacts of rises in staple food prices. Food Secur. 2012, 4, 633–645. [Google Scholar] [CrossRef] [Green Version]
  6. International Food Policy Research Institute (IFPRI). Actions and Accountability to Accelerate the World’s Progress on Nutrition. Global Nutrition Report; International Food Policy Research Institute: Washington, DC, USA, 2014; Available online: http://ebrary.ifpri.org/cdm/ref/collection/p15738coll2/id/128484 (accessed on 13 December 2017).
  7. Burlingame, B.; Dernini, S. Sustainable diets and biodiversity: Directions and solutions for policy, research and action. In Proceedings of the International Scientific Symposium on Biodiversity and Sustainable Diets: United Against Hunger, Rome, Italy, 3–5 November 2010; Food and Agriculture Organization: Rome, Italy, 2012. [Google Scholar]
  8. Pellegrini, L.; Tasciotti, L. Crop diversification, dietary diversity and agricultural income: Empirical evidence from eight developing countries. Can. J. Dev. Stud. 2014, 35, 211–227. [Google Scholar] [CrossRef]
  9. Sibhatu, K.T.; Krishna, V.V.; Qaim, M. Production diversity and dietary diversity in smallholder farm households. Proc. Natl. Acad. Sci. USA 2015, 112, 10657–10662. [Google Scholar] [CrossRef] [PubMed]
  10. Powell, B.; Thilsted, S.H.; Ickowitz, A.; Termote, C.; Sunderland, T.; Herforth, A. Improving diets with wild and cultivated biodiversity from across the landscape. Food Secur. 2015, 7, 535–554. [Google Scholar] [CrossRef] [Green Version]
  11. KC, K.; Pant, L.; Fraser, E.; Shrestha, P.; Shrestha, D.; Lama, A. Assessing links between crop diversity and food self-sufficiency in three agro-ecological regional of Nepal. Reg. Environ. Chang. 2015, 16, 1239–1251. [Google Scholar] [CrossRef]
  12. Fanzo, J.; Hunter, D.; Borelli, T.; Mattei, F. Diversifying Food and Diets: Using Agricultural Diversity to Improve Nutrition and Health; Routledge: London, UK, 2013; pp. 1–13. ISBN 978-1-84971-457-0. [Google Scholar]
  13. Remans, R.; Flynn, D.; DeClerck, F.; Diru, W.; Fanzo, J.; Gaynor, K.; Lambrecht, I.; Mudiope, J.; Mutuo, P.K.; Nkhoma, P.; et al. Assessing Nutritional Diversity of Cropping Systems in African Villages. PLoS ONE 2011, 6, e21235. [Google Scholar] [CrossRef] [PubMed] [Green Version]
  14. Kumar, N.; Harris, J.; Rawat, R. If They Grow It, Will They Eat and Grow? Evidence from Zambia on Agricultural Diversity and Child Undernutrition. J. Dev. Stud. 2015, 51, 1060–1077. [Google Scholar] [CrossRef]
  15. Ruel, M.T. Operationalizing dietary diversity: A review of measurement issues and research priorities. J. Nutr. 2003, 133, 3911S–3926S. [Google Scholar] [CrossRef] [PubMed]
  16. Vaitla, B.; Devereux, S.; Swan, S.H. Seasonal hunger: A neglected problem with proven solutions. PLoS Med. 2009, 6, e1000101. [Google Scholar] [CrossRef] [PubMed]
  17. Bacon, C.M.; Sundstrom, W.A.; Gómez, M.E.; Méndez, E.V.; Santos, R.; Goldoftas, B.; Dougherty, I. Explaining the ‘hungry farmer paradox’: Smallholders and fair trade cooperatives navigate seasonality and change in Nicaragua’s corn and coffee markets. Glob. Environ. Chang. 2014, 25, 133–149. [Google Scholar] [CrossRef]
  18. Herforth, A. Promotion of Traditional African Vegetables in Kenya and Tanzania: A Case Study of an Intervention Representing Emerging Imperatives in Global Nutrition. Ph.D. Thesis, Cornell University, Ithaca, NY, USA, 2010. [Google Scholar]
  19. Tittonell, P.; Muriuki, A.W.; Shepherd, K.D.; Mugendi, D.; Kaizzi, K.C.; Okeyo, J.; Verchot, L.; Coe, R.; Vanlauwe, B. The diversity of rural livelihoods and their influence on soil fertility in agricultural systems of East Africa—A typology of smallholder farms. Agric. Syst. 2010, 103, 83–97. [Google Scholar] [CrossRef]
  20. Barrett, C.; Reardon, R.; Webb, P. Non-farm income diversification and household livelihood strategies in rural Africa: Concepts, dynamics, and policy implications. Food Policy 2001, 26, 315–331. [Google Scholar] [CrossRef]
  21. Benin, S.; Smale, M.; Pender, J.; Gebremedhin, B.; Ehui, S. The economic determinants of cereal crop diversity on farms in the Ethiopian highlands. Agric. Econ. 2004, 31, 197–208. [Google Scholar] [CrossRef] [Green Version]
  22. Di Falco, S.; Bezabih, M.; Yesuf, M. Seeds for livelihood: Crop biodiversity and food production in Ethiopia. Ecol. Econ. 2010, 69, 1695–1702. [Google Scholar] [CrossRef]
  23. Benin, S.; Smale, M.; Pender, J. Explaining the diversity of cereal crops and varieties grown on household farms in the highlands of northern Ethiopia. In Valuing Crop Biodiversity: On-Farm Genetic Resources and Economic Change; Smale, M., Ed.; CABI Publishing: Wallingford, UK, 2005; pp. 78–96. ISBN 9780851990835. [Google Scholar]
  24. Radchenko, N.; Corral, P. Agricultural Commercialization and Food Security in Rural Economies: Malawian Experience. J. Dev. Stud. 2018, 54, 256–270. [Google Scholar] [CrossRef]
  25. Hazell, P. Managing drought risks in the low-rainfall areas of the Middle East and North Africa. In Case Studies in Food Policy for Developing Countries; Pinstrup-Andersen, P., Cheng, F., Eds.; Cornell University Press: Ithaca, NY, USA, 2007; p. 10. [Google Scholar]
  26. Hunter, D.; Fanzo, J. Agricultural biodiversity, diverse diets and improving nutrition. In Diversifying Food and Diets: Using Agricultural Biodiversity to Improve Nutrition and Health; Issues in Agricultural Biodiversity; Fanzo, J., Hunter, D., Borelli, T., Mattei, F., Eds.; Earthscan: London, UK, 2013; pp. 1–13. [Google Scholar]
  27. Oyarzun, P.J.; Borja, R.M.; Sherwood, S.; Parra, V. Making sense of agro-biodiversity, diet, and intensification of smallholder family farming in the highland Andes of Ecuador Ecol. Food Nutr. 2013, 52, 515–541. [Google Scholar] [CrossRef]
  28. Ng’endo, M.; Bhagwat, S.; Keding, G.B. Influence of Seasonal On-Farm Diversity on Dietary Diversity: A Case Study of Smallholder Farming Households in Western Kenya. Ecol. Food Nutr. 2016, 55, 403–427. [Google Scholar] [CrossRef] [PubMed]
  29. National Bureau of Statistics (NBS). Environment Statistics 2015; United Republic of Tanzania: Dar es Salaam, Tanzania, 2015. [Google Scholar]
  30. United States Agency for International Development (USAID). Preliminary Rural Livelihood Zoning: Tanzania, A Special Report by the Famine Early Warning System Network (FEWS NET). Dar es Salaam. 2008. Available online: http://fews.net/sites/default/files/documents/reports/tz_zonedescriptions_en.pdf (accessed on 12 January 2018).
  31. United Republic of Tanzania. National Sample Census of Agriculture 2007/2008 Morogoro Region Report; United Republic of Tanzania: Dar es Salaam, Tanzania, 2012. [Google Scholar]
  32. National Sample Census of Agriculture 2007/2008 Dodoma Region Report; United Republic of Tanzania: Dar es Salaam, Tanzania, 2012.
  33. Trans-Sec Research Project, Innovating Strategies to Safeguard Food Security Using Technology and Knowledge Transfer: A People-Centred Approach. 2016. Available online: http://www.trans-sec.org (accessed on 10 January 2018).
  34. Last, L.; Arndorfer, M.; Balázs, K.; Dennis, P.; Dyman, T.; Fjellstad, W.; Friedel, J.K.; Herzog, F.; Jeanneret, P.; Lüscher, G.; et al. Indicators for the on-farm assessment of crop cultivar and livestock breed diversity: A survey-based participatory approach. Biodivers. Coserv. 2014, 23, 3051–3071. [Google Scholar] [CrossRef]
  35. Berti, P.R. Relationship between production diversity and dietary diversity depends on how number of foods is counted. Proc. Natl. Acad. Sci. USA 2015, 112, e5656. [Google Scholar] [CrossRef] [PubMed]
  36. Sibhatu, K.T.; Qaim, M. Farm production diversity and dietary quality: Linkages and measurement issues. Food Secur. 2018, 10, 47–59. [Google Scholar] [CrossRef]
  37. Di Falco, S.; Chavas, J.P. On crop biodiversity, risk exposure, and food security in the highlands of Ethiopia. Am. J. Agric. Econ. 2009, 91, 599–611. [Google Scholar] [CrossRef]
  38. Swindale, A.; Bilinsky, P. Household Dietary Diversity Score (HDDS) for Measurement of Household Food Access: Indicator Guide (v.2); Food and Nutrition Technical Assistance (FANTA) Project; Academy for Educational Development: Washington, DC, USA, 2006; Available online: https://www.fantaproject.org/sites/default/files/resources/HDDS_v2_Sep06_0.pdf (accessed on 13 January 2018).
  39. Food and Agriculture Organization (FAO). Guidelines for Measuring Household and Individual Dietary Diversity; Food and Agriculture Organization of the United Nations: Rome, Italy, 2012; Available online: http://www.fao.org/docrep/014/i1983e/i1983e00.htm (accessed on 16 June 2018).
  40. Hatley, A.; Torheim, L.E.; Oshaug, A. Food variety—A good indicator of nutritional adequacy of the diet? A case study from an urban area in Mali, West Africa. Eur. J. Clin. Nutr. 1998, 52, 891–898. [Google Scholar] [CrossRef]
  41. Greene, W. Functional forms for the negative binomial model for count data. Econ. Lett. 2008, 99, 585–590. [Google Scholar] [CrossRef]
  42. Mnenwa, R.; Maliti, E. A Comparative Analysis of Poverty Incidence in Farming Systems of Tanzania. Special paper 10/4. REPOA. Dar-es-Salaam. 2010. Available online: http://www.repoa.or.tz/documents_storage/publications/10-4%20web.pdf (accessed on 20 January 2018).
  43. Porter, C. Shocks, consumption and income diversification in rural ethiopia. J. Dev. Stud. 2012, 48, 1209–1222. [Google Scholar] [CrossRef]
Figure 1. Conceptual framework (Authors’ construction based on KC et al. [11]).
Horticulturae 04 00014 g001
Figure 2. Study sites in Morogoro and Dodoma regions, Tanzania (Source: Trans-Sec [33]).
Horticulturae 04 00014 g002
Figure 3. Comparison of mean farm production diversity by agro-ecology and market access in Kilosa and Chamwino Districts.
Horticulturae 04 00014 g003
Figure 4. Mean HDDS and FVS in Kilosa and Chamwino districts.
Horticulturae 04 00014 g004
Table 1. Summary of main characteristics of study area.
Morogoro
(Kilosa District—Rural)
Dodoma
(Chamwino District—Rural)
Agro-ecologySemi-humid (Rainfall 600–800 mm)Semi-arid (Rainfall 350–500 mm)
Agricultural potentialRelatively goodRelatively poor
Access to major marketsRelatively goodRelatively poor
Cropping systemCereals and legumes (Maize, Rice, Peas and Sesame)
Fruit and vegetables (Tomatoes, Okras, Eggplants, Onions, Cabbage, Chilies, Amaranths and Pumpkins)
Drought resistant cereals, legumes and seeds (Sorghum, Millet, Groundnuts and Sunflower)
Fruit and vegetables (Tomatoes, Onions, Spinach, Grapes, Pawpaws)
Livestock systemLittle livestock keeping (poultry, goats)Heavy integration of livestock (Cattle, goat, poultry)
Sources: Environment statistics [29], National sample census Morogoro [31], National sample census Dodoma [32].
Table 2. Selected household and farm characteristics.
VariableKilosa District—Semi Humid with Better Market Access
(n = 450)
Chamwino District—Semi Arid with Poor Market Access
(n = 449)
Pooled Sample
Mean (SD)Mean (SD)Mean (SD)
Household characteristics
Age of HH head (years)48.20 (17.28)49.10 (16.94)48.65 (17.11)
Gender of HH head (Male = 1)0.81 (0.39)0.77 (0.42)0.79 (0.41)
Education of HH head (School years)4.89 (3.30)3.96 (3.48)4.42 (3.42)
Labor (Worker equivalents)2.84 (1.43)3.19 (1.49)3.01 (1.47)
Access to off-farm employment (Yes = 1)0.20 (0.40)0.47 (0.50)0.33 (0.47)
Access to non-farm self-employment (Yes = 1)0.16 (0.37)0.35 (0.48)0.25 (0.44)
Non-food expenditure (Per capita/month-PPP $)34.11 (34.97)23.49 (20.31)28.81 (29.07)
Food expenditure (Per capita/ month PPP $)13.65 (19.18)9.94 (11.33)11.81 (15.86)
Share of home consumption from total output0.45 (0.38)0.68 (0.42)0.57 (0.42)
Distance to nearest paved road (Km)1.94 (1.16)10.18 (2.74)6.15 (4.72)
Farm characteristics
Land size owned (ha)1.47 (1.56)1.95 (1.91)1.71 (1.76)
Number of plots cultivated2.2 (0.7)3.2 (1.3)2.6 (1.11)
Livestock owned (Tropical Livestock Unit)0.53 (6.06)1.26 (2.70)0.90 (4.71)
Number of crops cultivated2.66 (1.28)4.47 (1.80)3.56 (1.81)
Worker equivalents used to capture labor available at the household were calculated by weighting household members: less than 9 years = 0, 9–15 = 0.7, 16–49 = 1 and above 49 years = 0.7; All monetary variables have been converted from local currency Tanzanian Shilling (TZS) to 2010-based purchasing power parity United States Dollars (PPP $).
Table 3. Comparison of food consumption diversity based on crop-livestock diversity.
Food Consumption Diversity IndicatorKilosaChamwino
Low Production Diversity (n = 133)High Production Diversity (n = 317)Low Production Diversity (n = 213)High Production Diversity (236)
MeanSDMeanSDMeanSDMeanSD
HDDS7.321.947.321.785.151.796.25 ***1.73
HDDS (Planting)7.411.667.71 ***1.415.591.976.54 ***1.79
HDDS (Pre-harvest)7.531.637.82 ***1.415.712.016.57 ***1.66
HDDS (post-harvest)7.821.447.95 **1.296.771.767.38 ***1.53
Food Variety Score (FVS)10.813.4511.003.367.803.6110.14 ***3.68
Wilcoxon-Mann-Whitney non-parametric two-sample test used to examine differences between low and high production diversity; ** and ***: Significant difference at 10%, 5% and 1%-levels respectively.
Table 4. Determinants of farm production diversity.
Variable(1)
Kilosa
(2)
Chamwino
(3)
Pooled
Crop-Livestock CountNumber of Food Groups ProducedCrop-Livestock CountNumber of Food Groups ProducedCrop-Livestock CountNumber of Food Groups Produced
Age of HH head (years)0.003 *0.0020.002 *0.0010.002 ***0.002 **
(0.001)(0.001)(0.001)(0.001)(0.001)(0.001)
Gender of HH head (Male = 1)0.0570.0870.088 *0.0370.087 **0.066 *
(0.062)(0.064)(0.047)(0.040)(0.038)(0.035)
Education of HH head (School years)0.012 *0.0080.0030.0050.0060.007
(0.007)(0.007)(0.006)(0.005)(0.004)(0.004)
Risk attitude (scale: 1–10)0.001−0.0040.019 ***0.010 **0.015 ***0.005
(0.010)(0.009)(0.006)(0.005)(0.005)(0.004)
Land size owned (ha)0.0270.0110.059 ***0.038 ***0.051 ***0.028 ***
(0.019)(0.016)(0.008)(0.006)(0.007)(0.006)
Labor (Worker equivalents)0.040 ***0.028 *0.038 ***0.033 ***0.038 ***0.030 ***
(0.013)(0.014)(0.011)(0.010)(0.009)(0.008)
Access to off-farm employment (Yes = 1)−0.085−0.0430.0450.0420.0040.005
(0.056)(0.059)(0.037)(0.031)(0.030)(0.028)
Access to non-farm self-employment (Yes = 1)0.105 *0.136 **0.0490.0420.068 **0.076 ***
(0.058)(0.056)(0.037)(0.031)(0.032)(0.028)
Distance to nearest paved road (Km)0.024 *0.032 **0.0000.0110.0120.025 ***
(0.014)(0.014)(0.013)(0.011)(0.010)(0.009)
Access to credit (Yes = 1)0.144 *0.132 **0.165 ***0.109 ***0.150 ***0.103 ***
(0.074)(0.061)(0.045)(0.041)(0.037)(0.033)
Access to market information (Yes = 1)0.0050.0020.0000.0020.0010.002
(0.004)(0.005)(0.002)(0.001)(0.001)(0.001)
Agricultural shocks (Yes = 1)−0.110 *−0.177 ***−0.047−0.027−0.067 **−0.072 **
(0.058)(0.068)(0.037)(0.032)(0.031)(0.029)
Household asset holding (asset score)0.000−0.0000.000 *0.000 ***0.000 **0.000
(0.000)(0.000)(0.000)(0.000)(0.000)(0.000)
Household resides in Ilolo village 0.0750.0310.124 **0.086
(0.077)(0.068)(0.063)(0.058)
Household resides in Ndebwe village 0.001−0.0090.0090.005
(0.042)(0.037)(0.042)(0.037)
Household resides in Changarawe village−0.102 *−0.047 −0.376 ***0.036
(0.055)(0.050) (0.114)(0.105)
Household resides in Ilakala village −0.291 ***0.074
(0.110)(0.102)
Household resides in Nyali village−0.150 ***−0.176 *** −0.403 ***−0.073
(0.056)(0.056) (0.095)(0.089)
Constant0.854 ***0.817 ***1.127 ***0.800 ***1.041 ***0.681 ***
(0.142)(0.134)(0.166)(0.156)(0.130)(0.128)
Observations450450449449899899
Wald chi280.7949.70201.86135.46690.71239.01
Probability > chi20.000.000.000.000.000.00
Pseudo R20.0230.0160.0600.0240.1070.030
All models are estimated with Poisson regressions; ***, ** and * indicate a significance level of 1%, 5%, and 10%, respectively; Values shown in parentheses are standard errors.
Table 5. Effects of farm production diversity on household food consumption diversity—Pooled sample (Farm production diversity indicator: Crop-livestock count).
HDDSHDDS (Planting)HDDS
(Pre-Harvest)
HDDS
(Post-Harvest)
FVS
Crop-livestock count0.022 ***0.019 ***0.015 ***0.010 ***0.037 ***
(0.004)(0.004)(0.004)(0.003)(0.006)
Age of HH head (years)−0.002 ***−0.002 ***−0.001 **−0.001 ***−0.004 ***
(0.001)(0.001)(0.001)(0.000)(0.001)
Gender of HH head (Male = 1)−0.0030.033−0.012−0.024−0.001
(0.024)(0.023)(0.022)(0.018)(0.029)
Education of HH head (School years)0.004−0.0010.0030.0020.004
(0.003)(0.003)(0.003)(0.002)(0.004)
Land size owned (ha.)0.0060.010 **0.0060.0060.004
(0.005)(0.004)(0.004)(0.003)(0.007)
Livestock owned (TLU)−0.0010.0010.0010.001−0.003
(0.001)(0.001)(0.001)(0.001)(0.003)
Labor (Worker equivalents)0.002−0.0010.0010.008 *0.009
(0.006)(0.006)(0.006)(0.004)(0.008)
Food consumption expenditure quintile
Per capita per month: Low-middle0.0440.010−0.008−0.0050.062 *
(0.029)(0.030)(0.029)(0.022)(0.037)
Per capita per month: Middle0.063 **0.094 ***0.072 ***0.038 *0.088 **
(0.029)(0.028)(0.026)(0.021)(0.036)
Per capita per month: High-middle0.118 ***0.098 ***0.075 ***0.046 **0.158 ***
(0.029)(0.028)(0.026)(0.021)(0.036)
Per capita per month: High0.142 ***0.126 ***0.095 ***0.054 ***0.179 ***
(0.028)(0.027)(0.026)(0.020)(0.037)
Share of home consumption−0.031−0.018−0.016−0.015−0.030
(0.022)(0.021)(0.020)(0.017)(0.028)
Access to market information (Yes = 1)0.101 ***0.084 ***0.095 ***0.062 ***0.108 ***
(0.020)(0.019)(0.018)(0.015)(0.024)
Distance to nearest paved road−0.027 ***−0.021 ***−0.021 ***−0.012 ***−0.027 ***
(0.003)(0.003)(0.003)(0.002)(0.004)
Access to off-farm employment (Yes = 1)−0.036 *−0.006−0.024−0.000−0.039
(0.020)(0.019)(0.019)(0.015)(0.026)
Access to non-farm self-employment (Yes = 1)0.046 **0.033 *0.0220.047 ***0.049 *
(0.020)(0.018)(0.018)(0.014)(0.026)
Household asset holding (asset score)0.0000.0000.000 *0.0000.000 *
(0.000)(0.000)(0.000)(0.000)(0.000)
Household resides in Ilakala village−0.0180.0260.032−0.006−0.037
(0.026)(0.023)(0.023)(0.020)(0.036)
Household resides in Nyali village0.0100.102 ***0.097 ***0.044 **0.023
(0.026)(0.022)(0.022)(0.018)(0.035)
Household resides in Ilolo village−0.100 ***−0.090 ***−0.079 ***−0.054 **−0.089 **
(0.028)(0.028)(0.029)(0.022)(0.036)
Household resides in Ndebwe village0.0210.0120.052 *0.0190.043
(0.034)(0.034)(0.032)(0.027)(0.039)
Constant1.903 ***1.864 ***1.903 ***2.004 ***2.256 ***
(0.060)(0.057)(0.055)(0.046)(0.072)
ln(alpha) −4.945
(0.726)
Alpha 0.802
(0.132)
Observations899899899899899
Wald chi2456.17338.94321.60153.50250.30
Probability > chi20.000.000.000.000.00
Pseudo R20.0440.0350.0320.0130.051
***, ** and * indicate a significance level of 1%, 5%, and 10%, respectively; Values shown in parentheses are standard errors; Negative binomial model used for FVS regression: Likelihood-ratio test of alpha = 0; chibar2 (01) = 258.20; Prop > = chibar2 = 0.000. This suggests that alpha is non-zero rendering Poisson model less appropriate.
Table 6. Effects of farm production diversity on household food consumption diversity – Pooled sample (Farm production diversity indicator: Number of food groups produced).
HDDSHDDS (Planting)HDDS
(Pre-Harvest)
HDDS
(Post-Harvest)
FVS
Number of food groups produced0.030 ***0.025 ***0.023 ***0.012 *0.041 ***
(0.007)(0.008)(0.008)(0.007)(0.009)
Age of HH head (years)−0.002 ***−0.002 **−0.001 *−0.001 *−0.003 ***
(0.001)(0.001)(0.001)(0.001)(0.001)
Gender of HH head (Male = 1)0.0110.053 *−0.002−0.027−0.002
(0.026)(0.029)(0.027)(0.023)(0.030)
Education of HH head (School years)0.003−0.0010.0050.0040.004
(0.003)(0.003)(0.003)(0.003)(0.004)
Land size owned (ha.)0.010 *0.018 ***0.012 **0.009 *0.012 *
(0.005)(0.006)(0.005)(0.005)(0.007)
Livestock owned (TLU)−0.0010.003 *0.003 *0.003 *−0.002
(0.001)(0.002)(0.001)(0.002)(0.002)
Labor (Worker equivalents)−0.002−0.007−0.0050.0070.011
(0.007)(0.008)(0.007)(0.006)(0.008)
Food consumption expenditure quintile
Per capita per month: Low-middle0.044−0.001−0.0140.0040.068 *
(0.030)(0.036)(0.035)(0.028)(0.037)
Per capita per month: Middle0.086 ***0.105 ***0.092 ***0.058 **0.099 ***
(0.031)(0.034)(0.033)(0.027)(0.037)
Per capita per month: High-middle0.135 ***0.090 **0.084 **0.063 **0.166 ***
(0.032)(0.035)(0.034)(0.028)(0.036)
Per capita per month: High0.151 ***0.134 ***0.105 ***0.066 **0.192 ***
(0.031)(0.035)(0.034)(0.027)(0.038)
Share of home consumption−0.024−0.054 **−0.035−0.042 *−0.043
(0.023)(0.026)(0.026)(0.022)(0.028)
Access to market information (Yes = 1)0.094 ***0.108 ***0.116 ***0.074 ***0.114 ***
(0.021)(0.024)(0.023)(0.020)(0.024)
Distance to nearest paved road−0.027 ***−0.020 ***−0.022 ***−0.013 ***−0.023 ***
(0.003)(0.003)(0.003)(0.003)(0.004)
Access to off-farm employment (Yes = 1)−0.041 *−0.016−0.027−0.009−0.038
(0.022)(0.024)(0.024)(0.020)(0.026)
Access to non-farm self-employment (Yes = 1)0.036 *0.0320.0200.069 ***0.050 *
(0.022)(0.024)(0.023)(0.019)(0.027)
Household asset holding (asset score)0.000 **0.000 **0.000 **0.0000.000 *
(0.000)(0.000)(0.000)(0.000)(0.000)
Household resides in Ilakala village−0.040−0.0040.013−0.030−0.042
(0.029)(0.031)(0.031)(0.027)(0.036)
Household resides in Nyali village−0.0270.097 ***0.101 ***0.0350.020
(0.029)(0.029)(0.028)(0.025)(0.035)
Household resides in Ilolo village−0.074 **−0.102 ***−0.088 ***−0.067 **−0.041
(0.030)(0.033)(0.033)(0.028)(0.035)
Household resides in Ndebwe village0.043−0.0150.0350.0120.052
(0.034)(0.040)(0.039)(0.033)(0.039)
Constant1.570 ***1.642 ***1.665 ***1.789 ***2.225 ***
(0.065)(0.073)(0.071)(0.060)(0.074)
ln(alpha) −4.697
(0.579)
Alpha 0.398
(0.067)
Observations899899899899899
Wald chi2411.99337.48311.61151.31231.70
Probability > chi20.000.000.000.000.00
Pseudo R20.0350.0390.0370.0160.047
***, ** and * indicate a significance level of 1%, 5%, and 10%, respectively; Values shown in parentheses are standard errors; Negative binomial model used for FVS regression: Likelihood-ratio test of alpha = 0; chibar2 (01) = 197.16; Prop > = chibar2 = 0.000. The estimated alpha coefficient for the Negative binomial model is significant suggesting absence of equi-dispersion which would favor the use of a Poisson model.

