
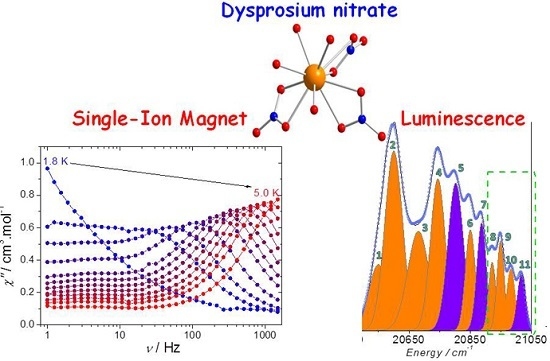
Magneto-Luminescence Correlation in the Textbook Dysprosium(III) Nitrate Single-Ion Magnet

 , ,
, ,  ,
,  and
and
Abstract
:
1. Introduction
2. Results
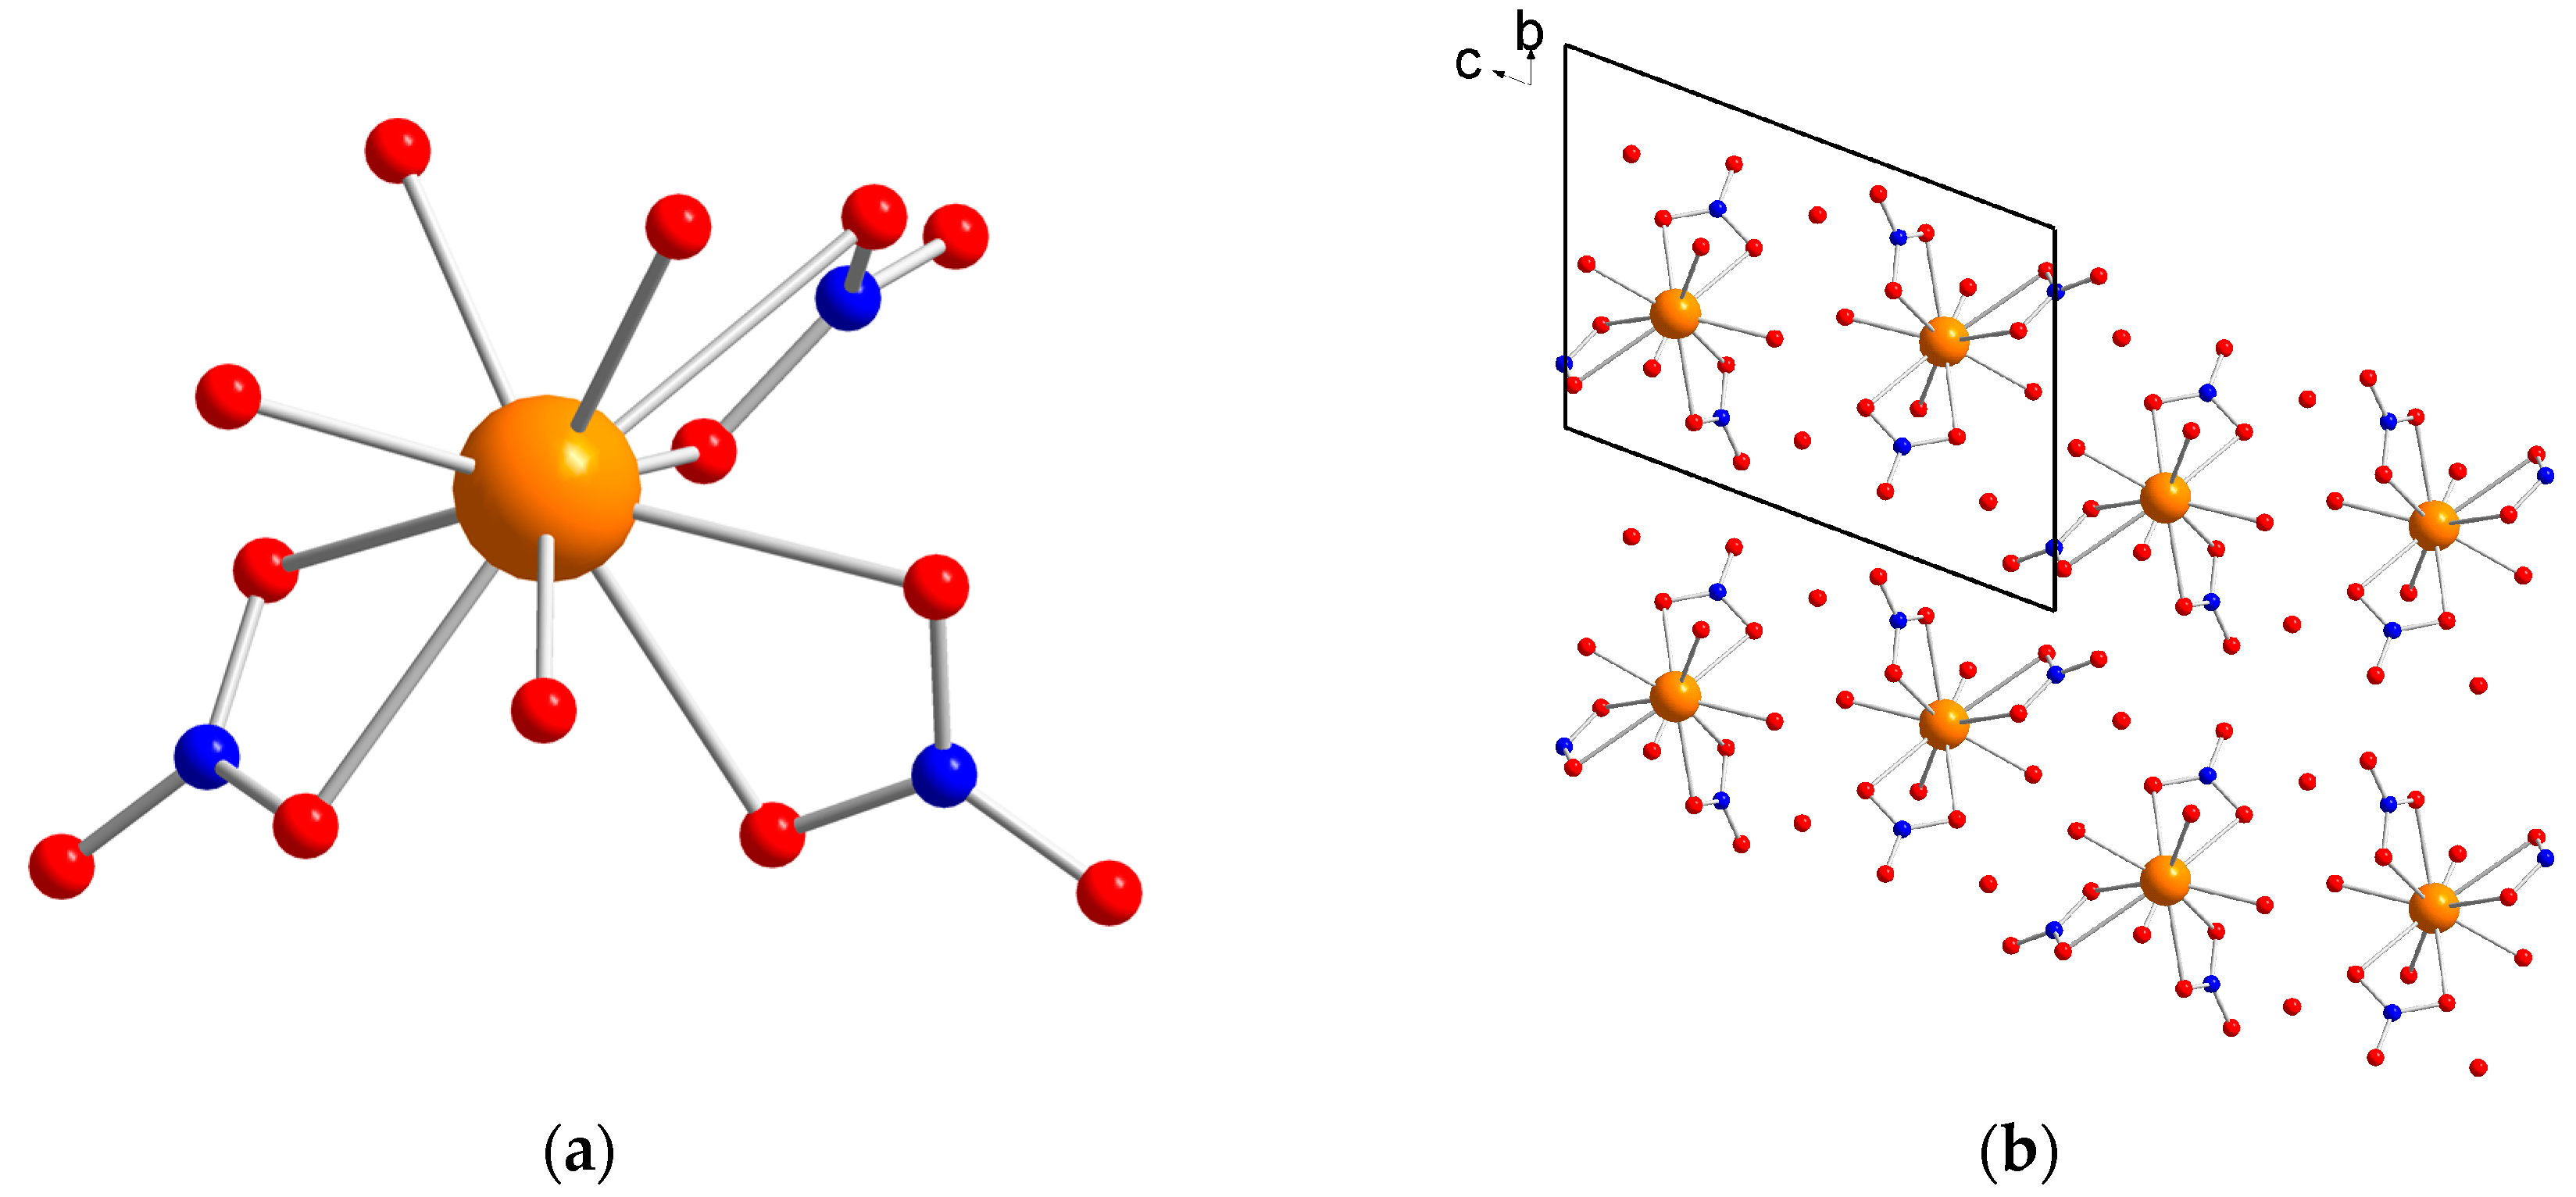
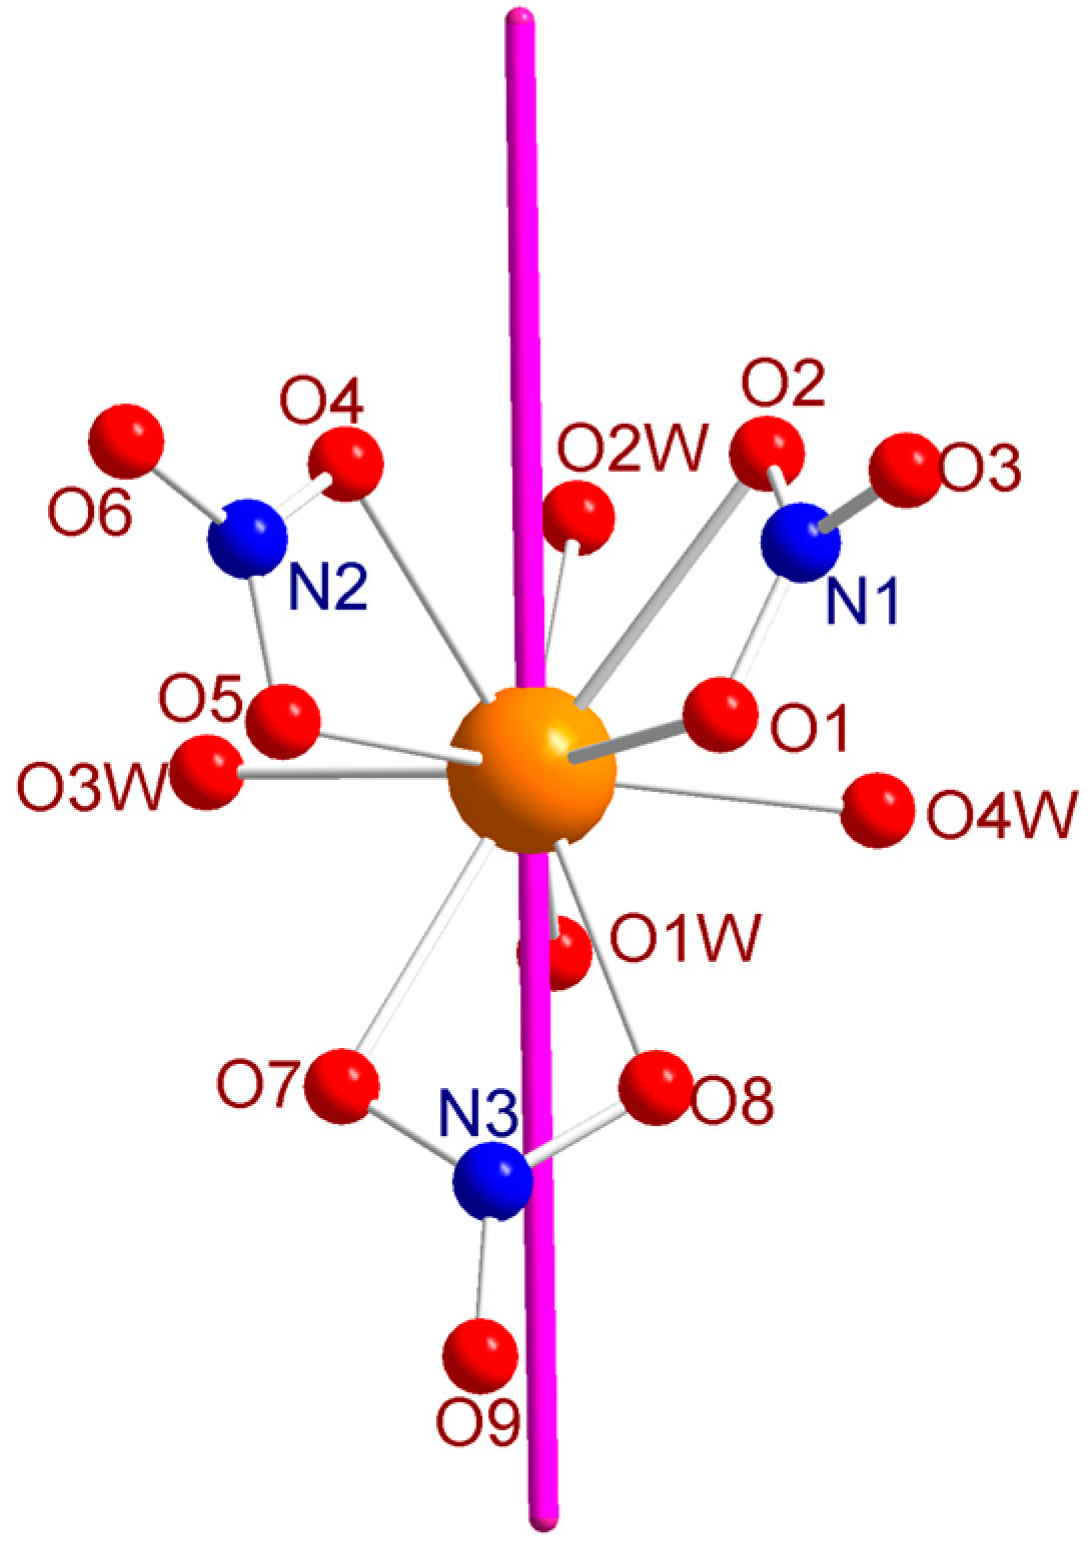
2.1. Structure
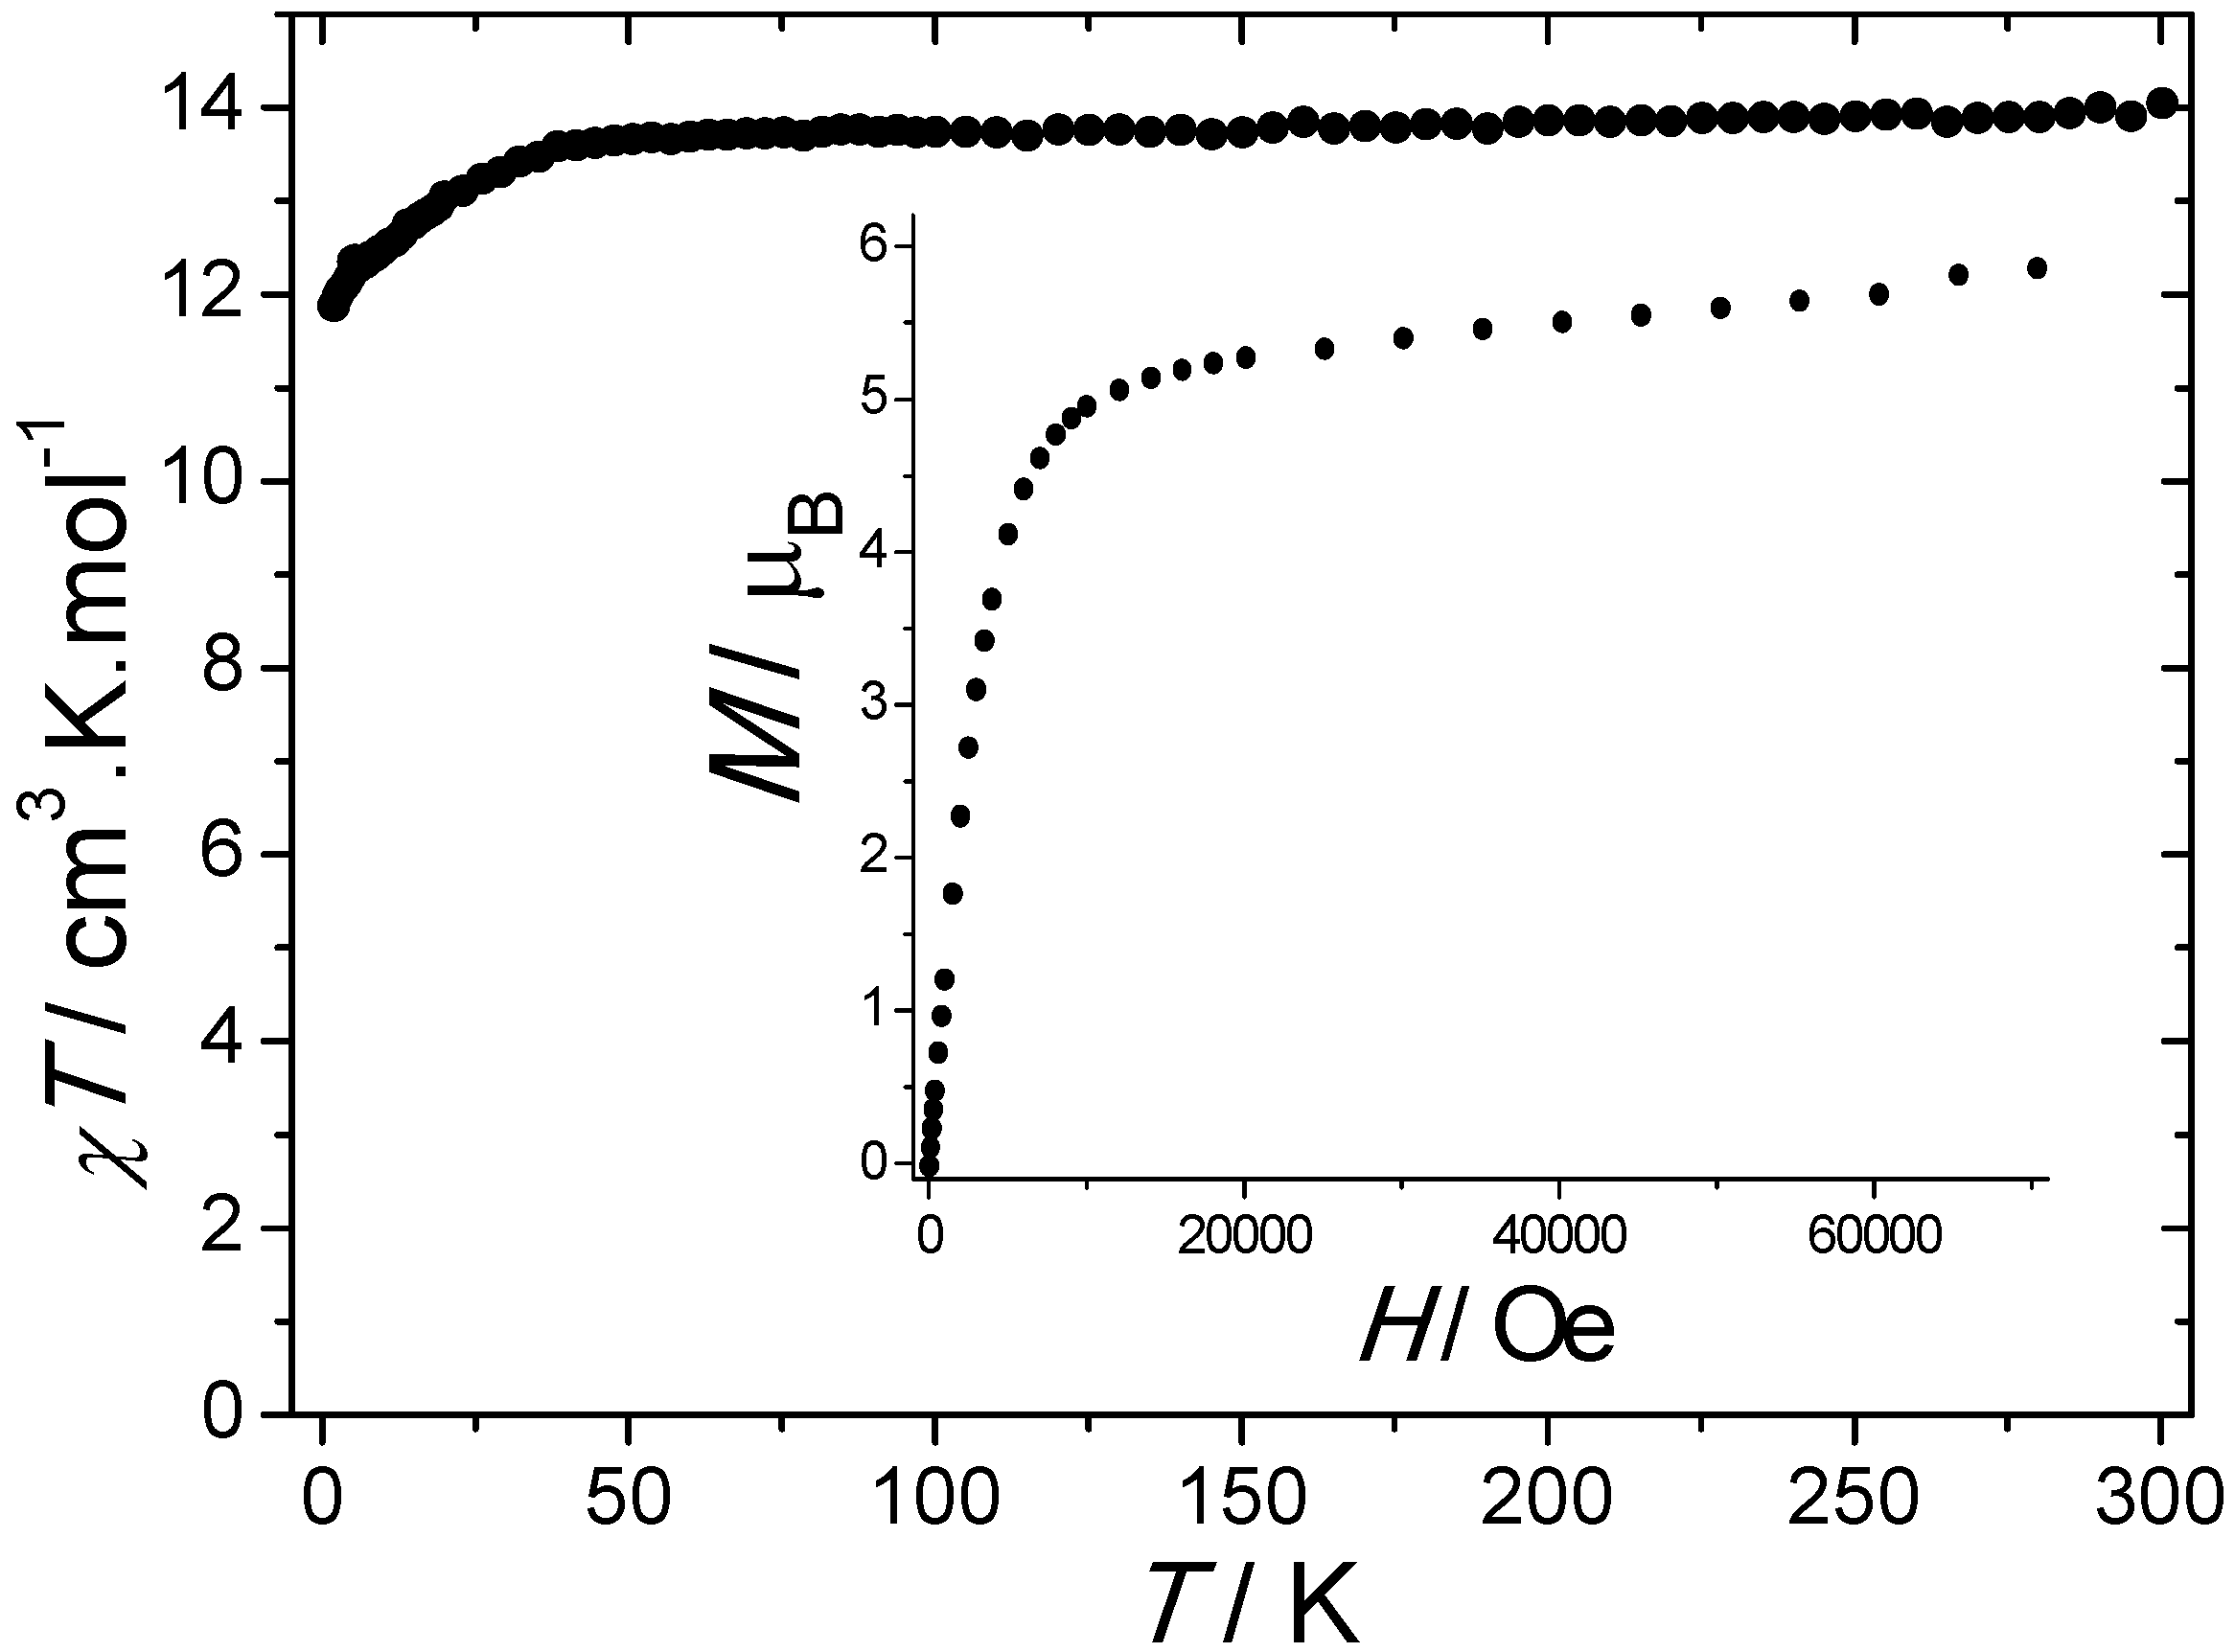
2.2. Magnetic Properties
2.2.1. DC Magnetic Properties
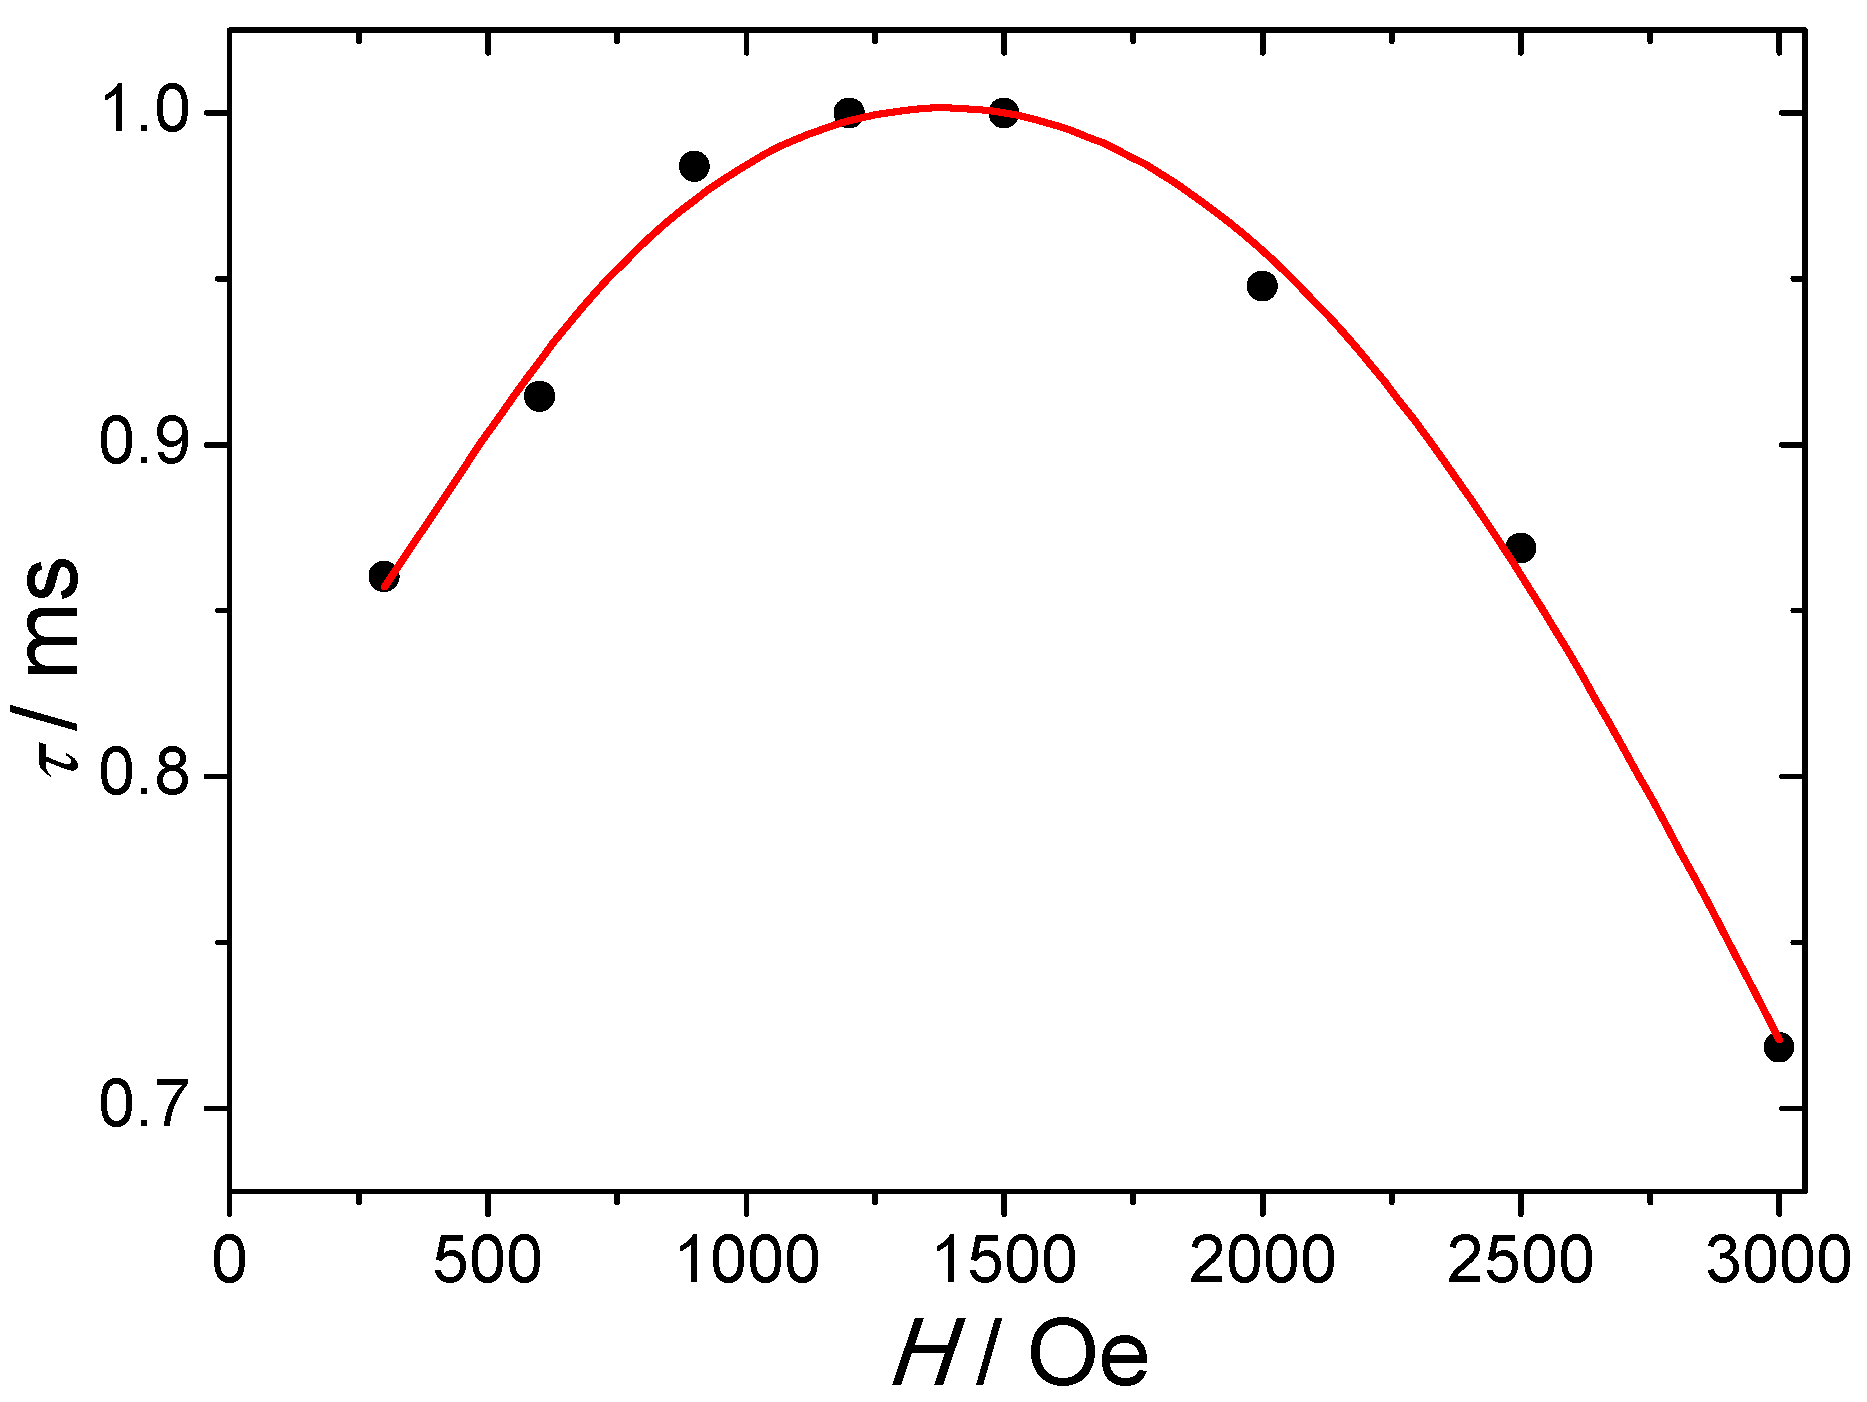
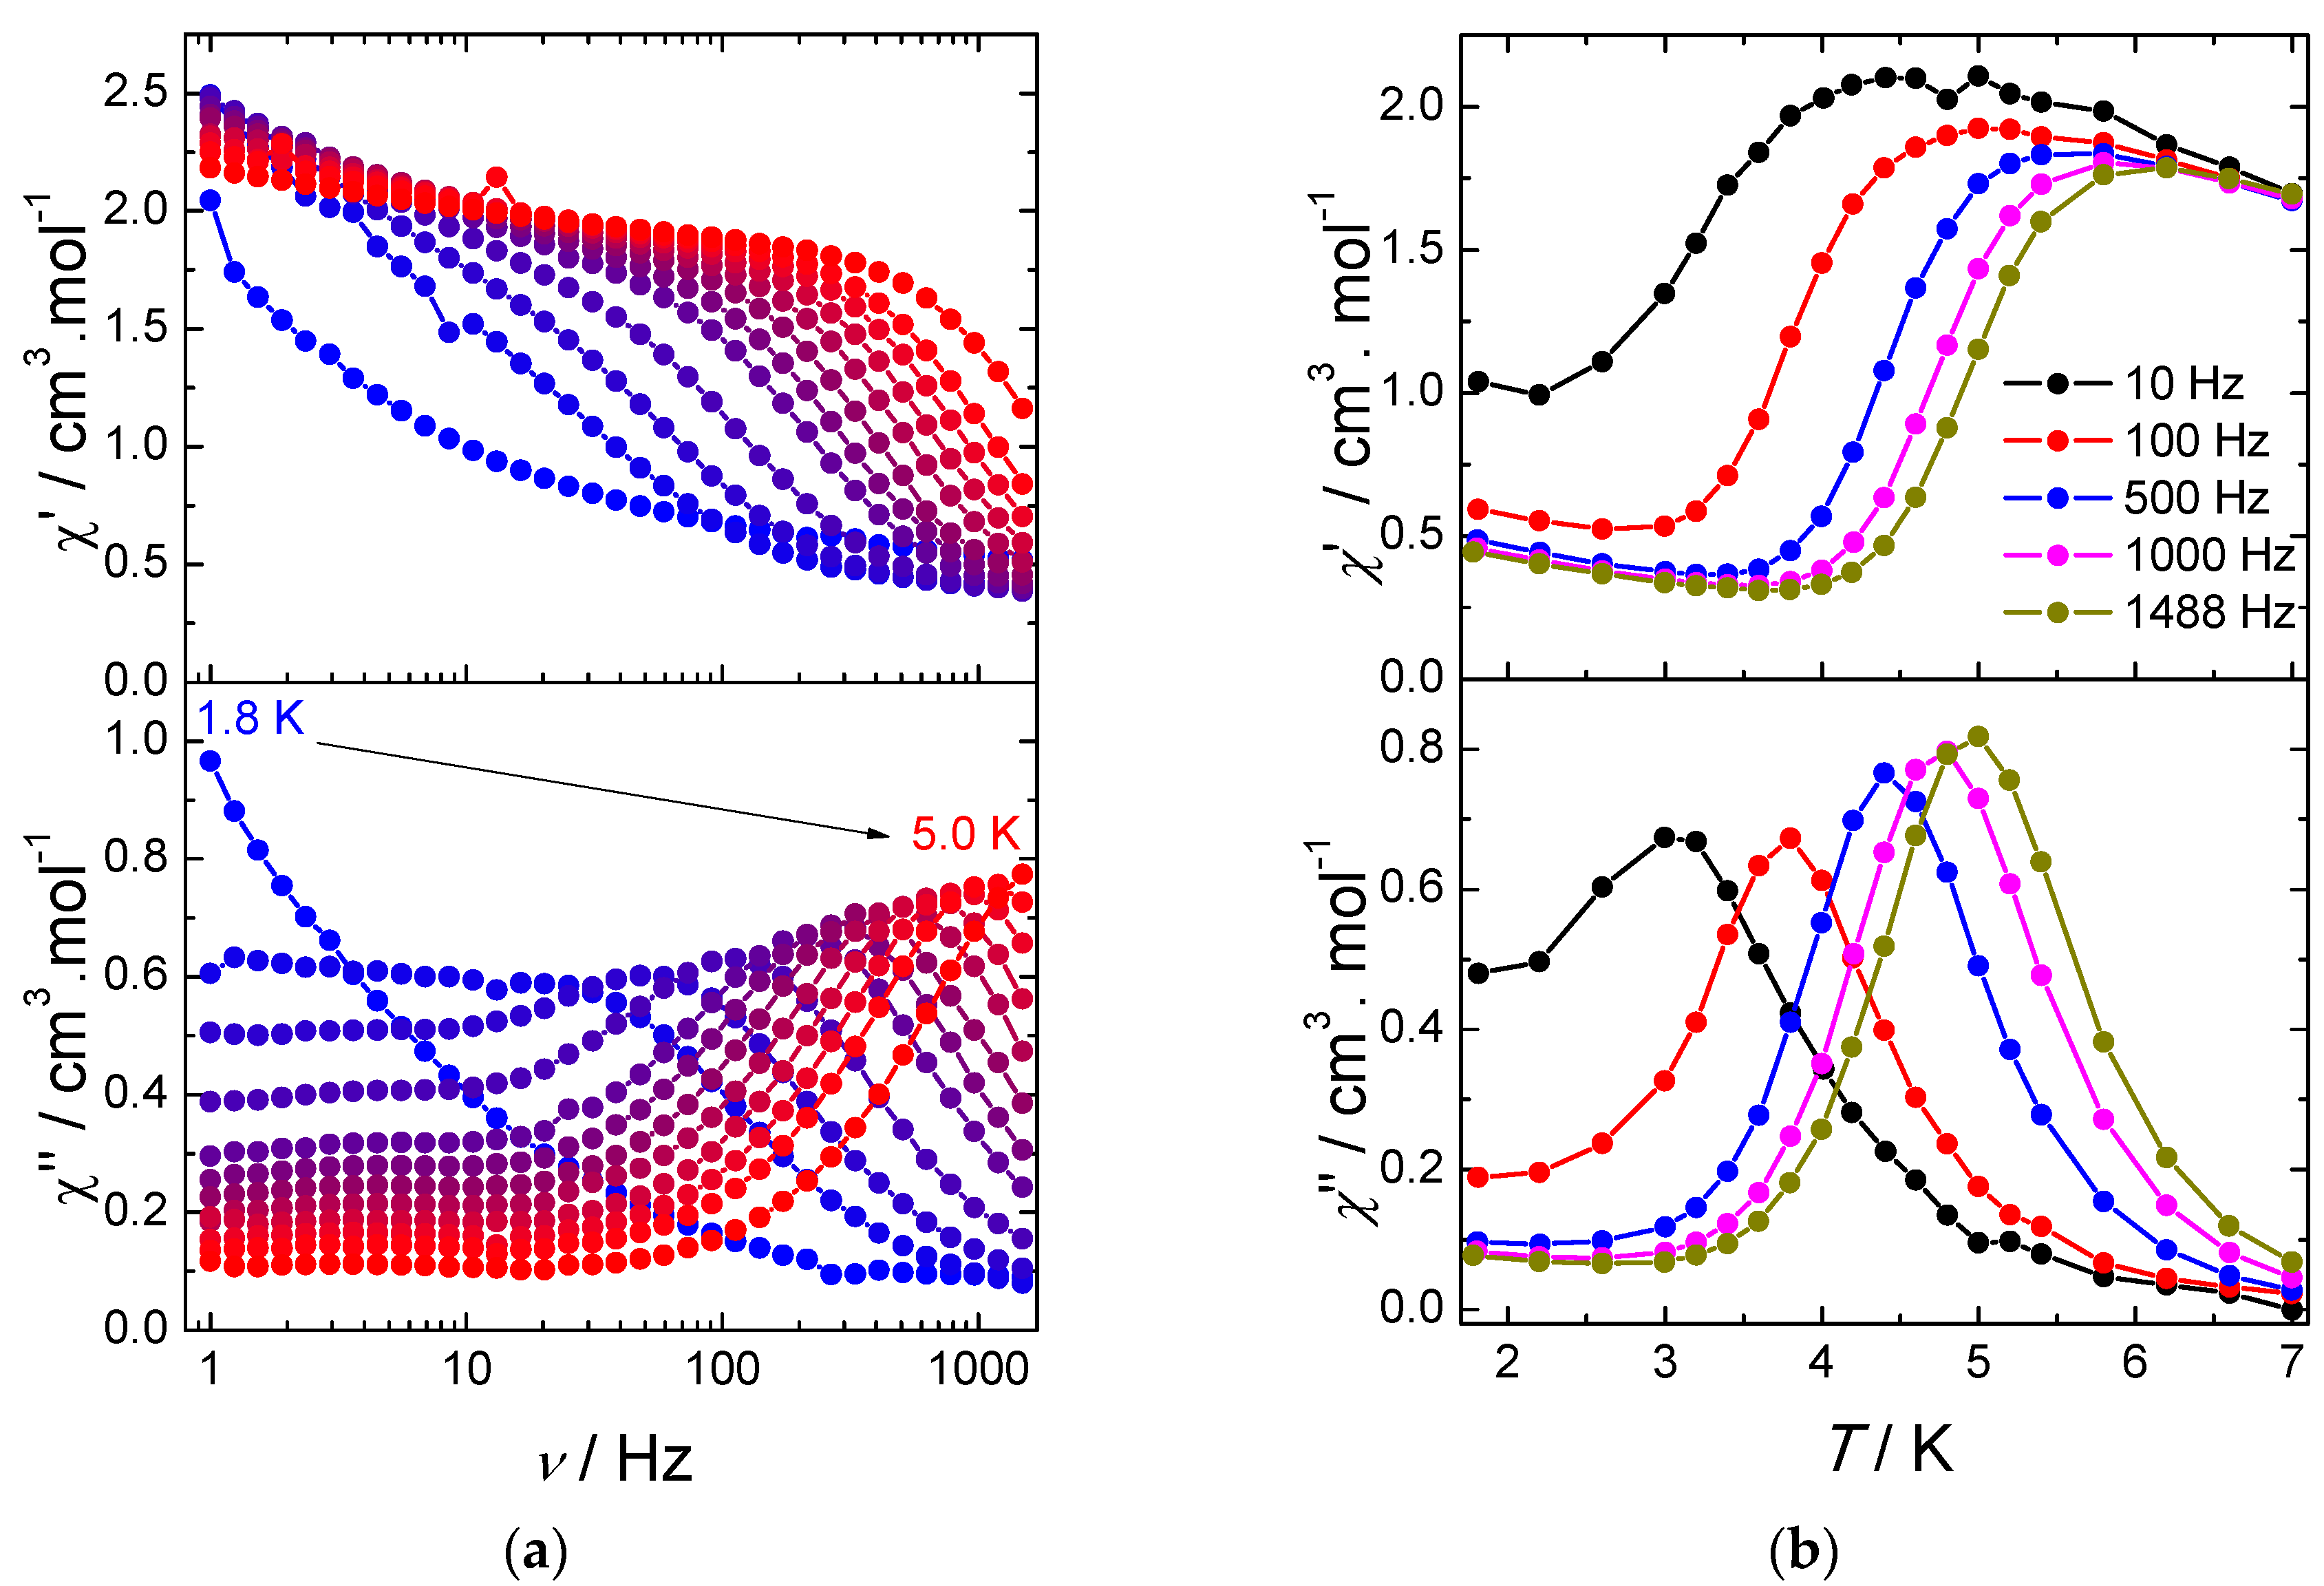
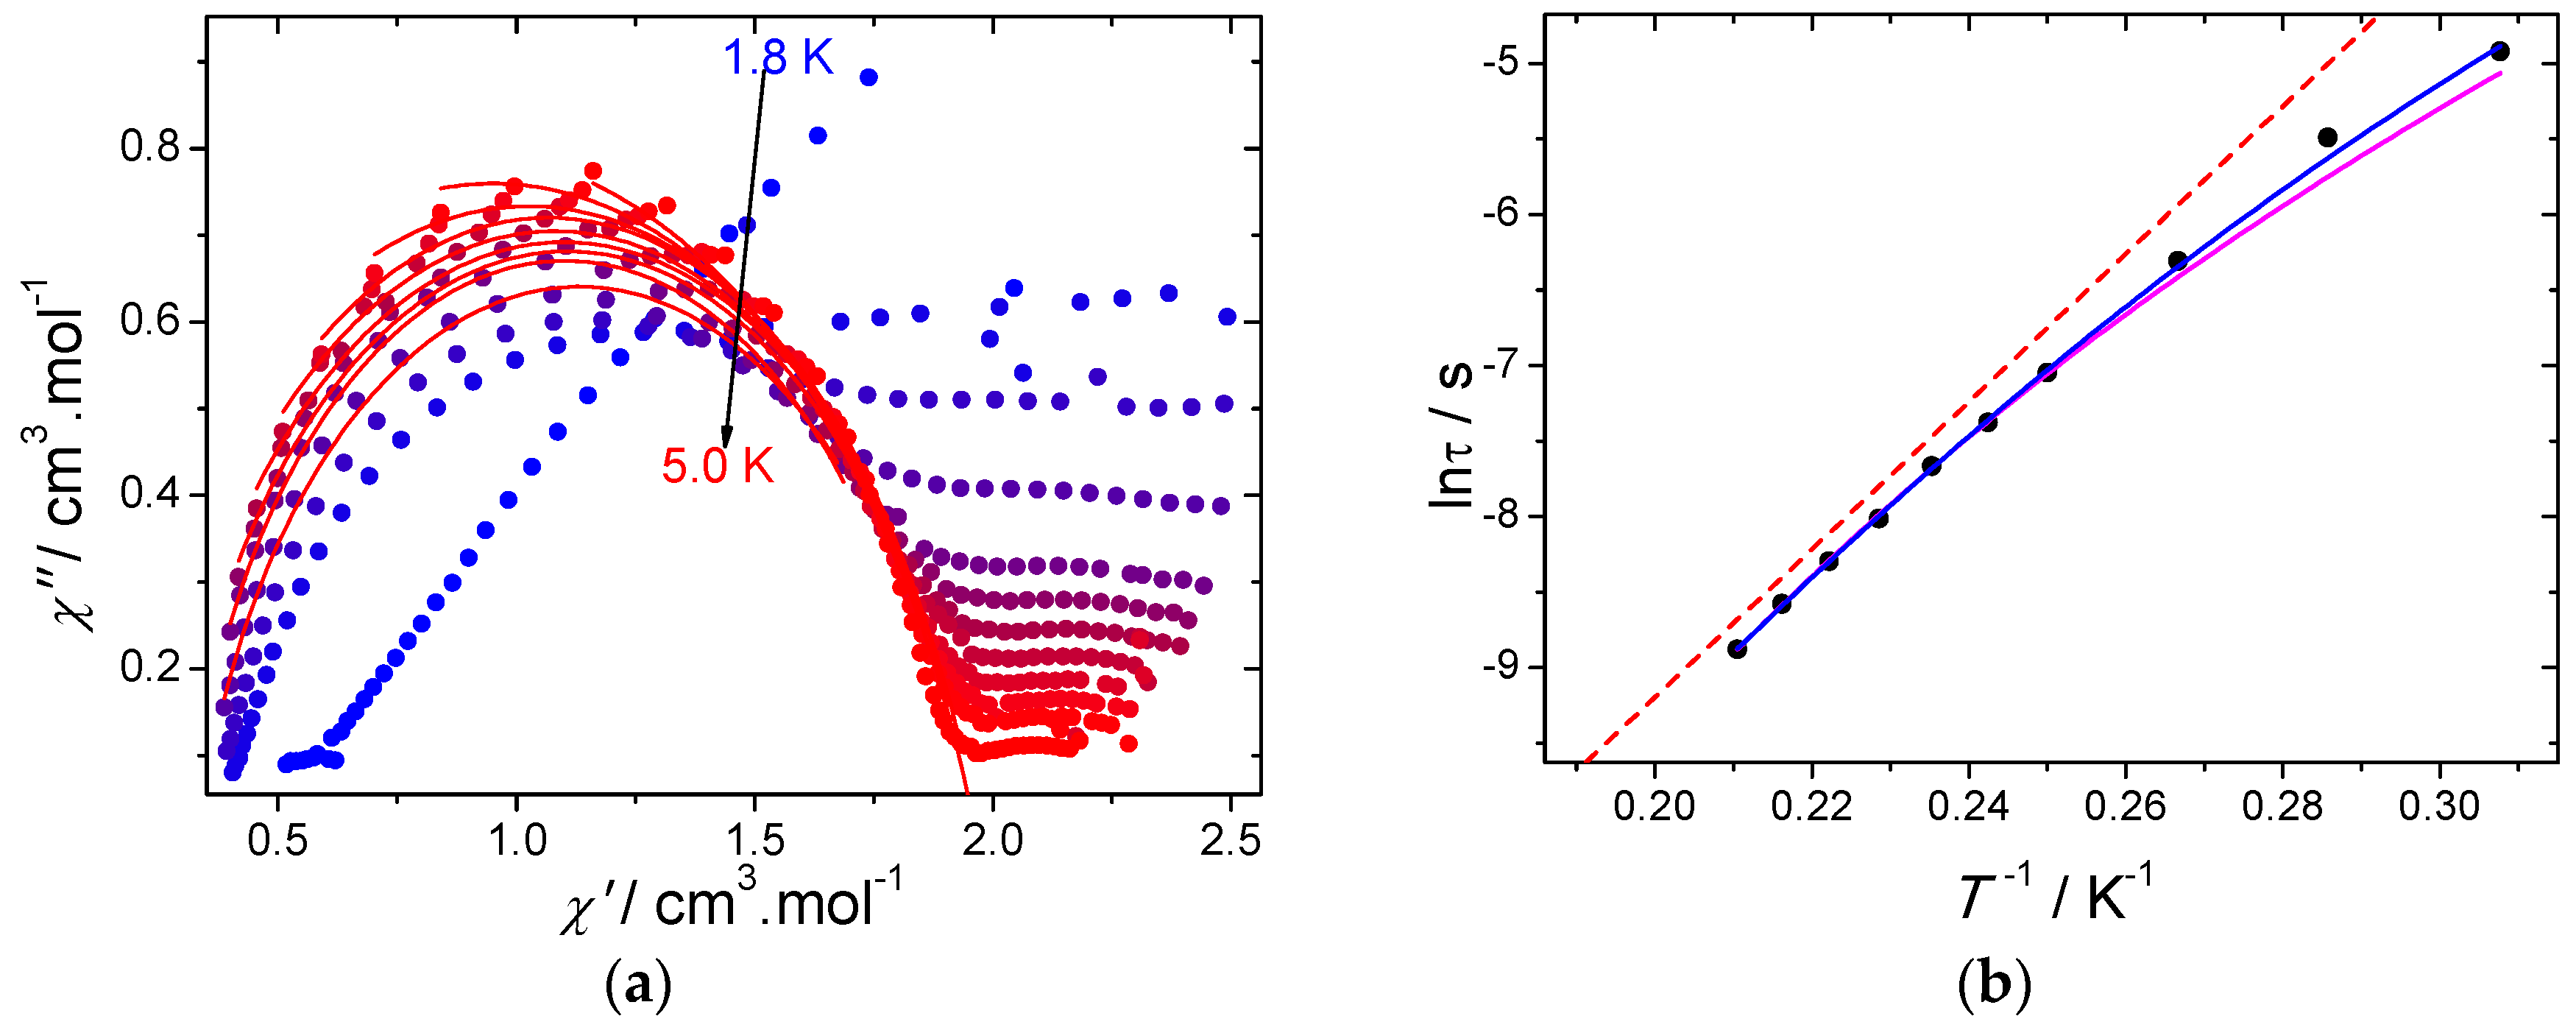
2.2.2. AC Magnetic Properties
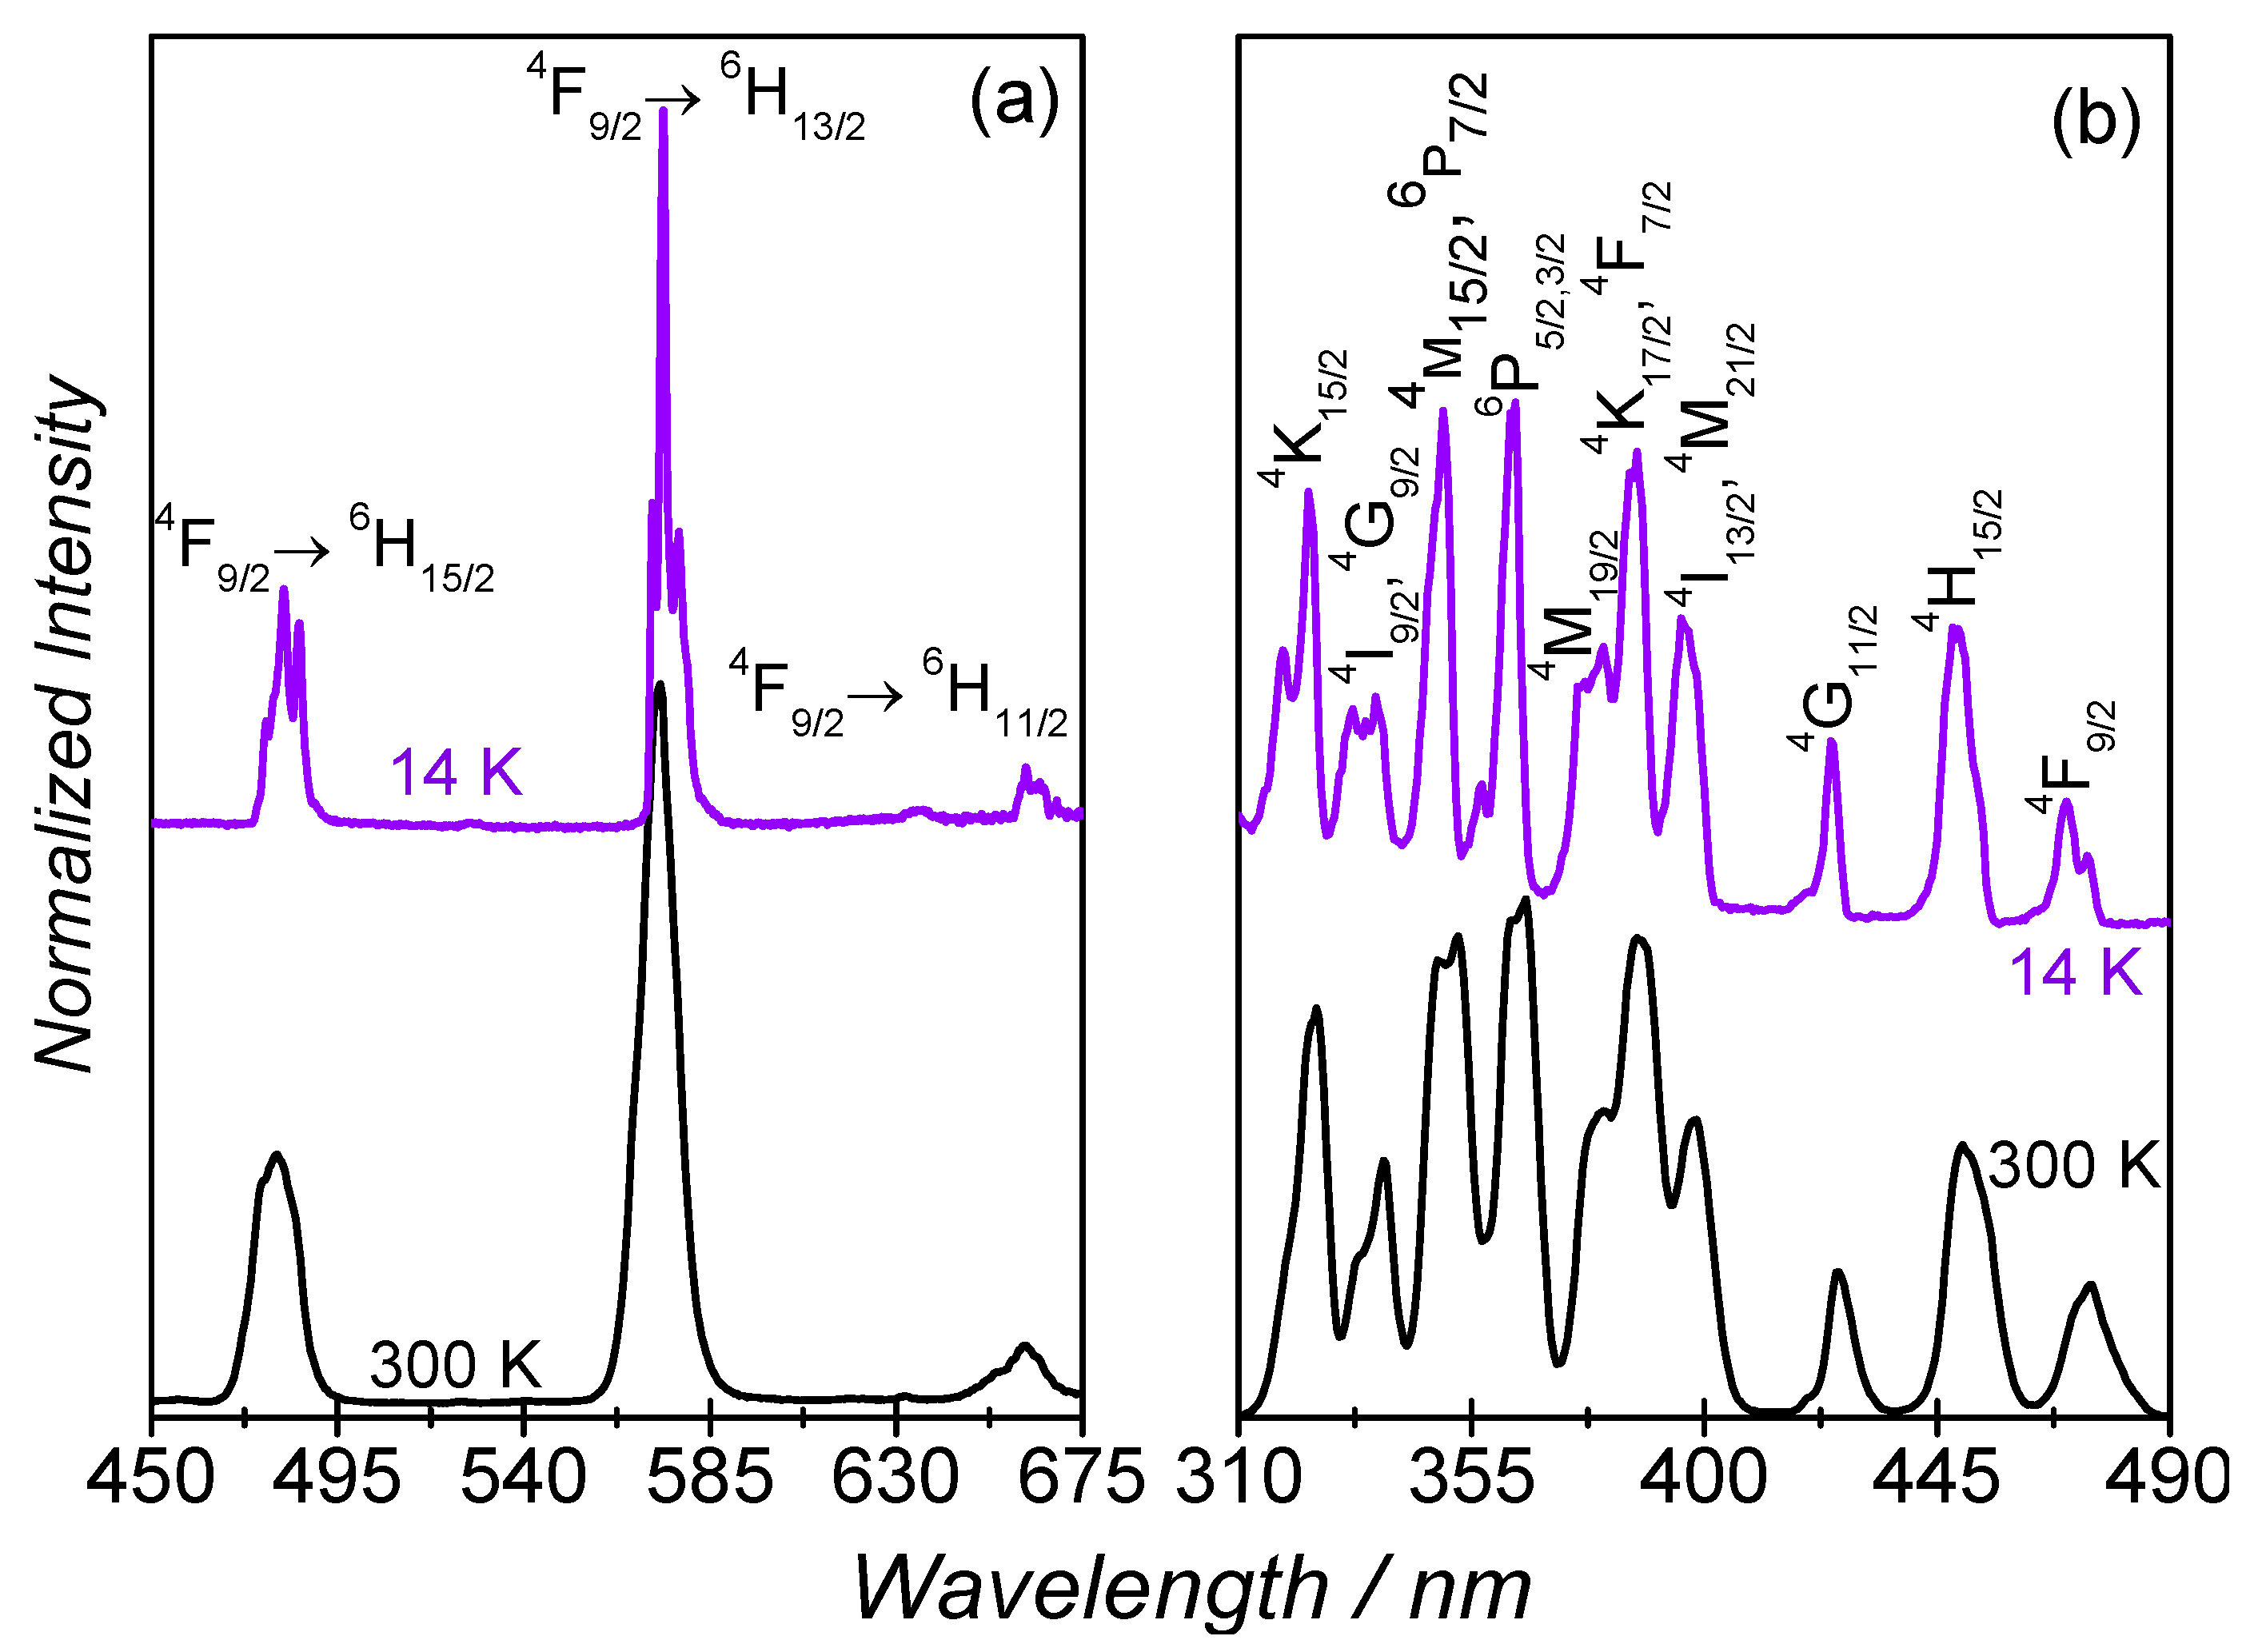
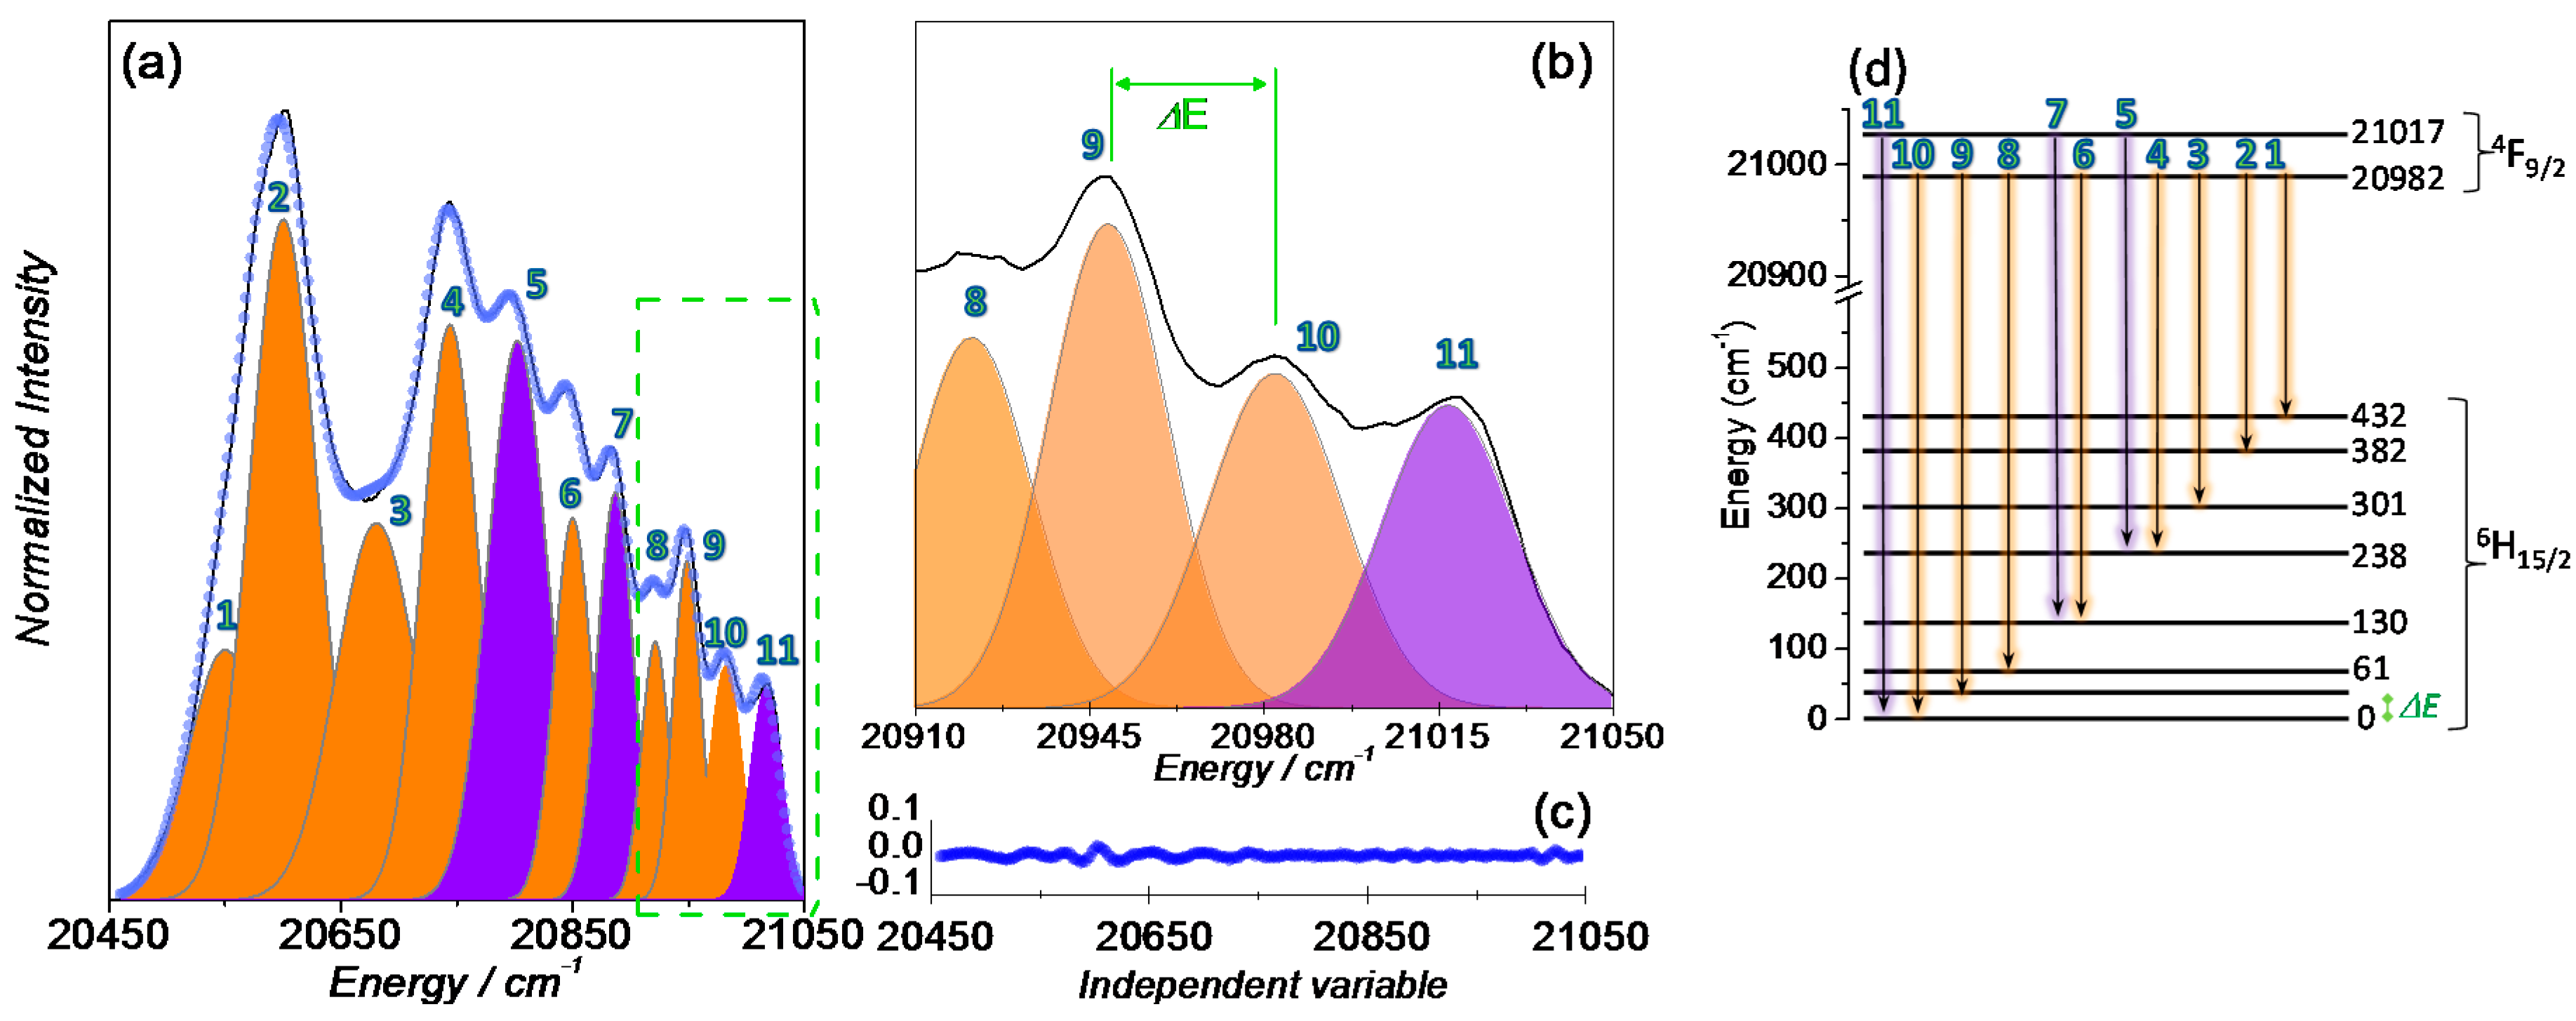
2.3. Luminescence
3. Discussion
4. Materials and Methods
4.1. Synthesis and Crystal Structure
4.2. Magnetic Measurements
4.3. Photoluminescence Measurements
5. Conclusions
Supplementary Materials
Acknowledgments
Author Contributions
Conflicts of Interest
References
- Woodruff, D.N.; Winpenny, R.E.P.; Layfield, R.A. Lanthanide single-molecule magnets. Chem. Rev. 2013, 113, 5110–5148. [Google Scholar] [CrossRef] [PubMed]
- Layfield, R.A. Organometallic single-molecule magnets. Organometallics 2014, 33, 1084–1099. [Google Scholar] [CrossRef]
- Liddle, S.T.; van Slageren, J. Improving f-element single molecule magnets. Chem. Soc. Rev. 2015, 44, 6655–6669. [Google Scholar] [CrossRef] [PubMed]
- Luzon, J.; Sessoli, R. Lanthanides in molecular magnetism: So fascinating, so challenging. Dalton Trans. 2012, 41, 13556–13567. [Google Scholar] [CrossRef] [PubMed]
- Rinehart, J.D.; Long, J.R. Exploiting single-ion anisotropy in the design of f-element single-molecule magnets. Chem. Sci. 2011, 2, 2078–2085. [Google Scholar] [CrossRef]
- Pointillart, F.; Bernot, K.; Golhen, S.; Le Guennic, B.; Guizouarn, T.; Ouahab, L.; Cador, O. Magnetic memory in an isotopically enriched and magnetically isolated mononuclear dysprosium complex. Angew. Chem. Int. Ed. 2015, 54, 1504–1507. [Google Scholar] [CrossRef] [PubMed]
- Cucinotta, G.; Perfetti, M.; Luzon, J.; Etienne, M.; Car, P.-E.; Caneschi, A.; Calvez, G.; Bernot, K.; Sessoli, R. Magnetic anisotropy in a dysprosium/dota single-molecule magnet: Beyond simple magneto-structural correlations. Angew. Chem. Int. Ed. 2012, 51, 1606–1610. [Google Scholar] [CrossRef] [PubMed]
- Long, J.; Vallat, R.; Ferreira, R.A.S.; Carlos, L.D.; Almeida Paz, F.A.; Guari, Y.; Larionova, J. A bifunctional luminescent single-ion magnet: Towards correlation between luminescence studies and magnetic slow relaxation processes. Chem. Commun. 2012, 48, 9974–9976. [Google Scholar] [CrossRef] [PubMed]
- Yamashita, K.; Miyazaki, R.; Kataoka, Y.; Nakanishi, T.; Hasegawa, Y.; Nakano, M.; Yamamura, T.; Kajiwara, T. A luminescent single-molecule magnet: Observation of magnetic anisotropy using emission as a probe. Dalton Trans. 2013, 42, 1987–1990. [Google Scholar] [CrossRef] [PubMed]
- Pointillart, F.; Le Guennic, B.; Golhen, S.; Cador, O.; Maury, O.; Ouahab, L. A redox-active luminescent ytterbium-based single molecule magnet. Chem. Commun. 2013, 49, 615–617. [Google Scholar] [CrossRef] [PubMed]
- Gavey, E.L.; Al Hareri, M.; Regier, J.; Carlos, L.D.; Ferreira, R.A.S.; Razavi, F.S.; Rawson, J.M.; Pilkington, M. Placing a crown on dy(III)—A dual property lniii crown ether complex displaying optical properties and smm behaviour. J. Mater. Chem. C 2015, 3, 7738–7747. [Google Scholar] [CrossRef]
- Shintoyo, S.; Murakami, K.; Fujinami, T.; Matsumoto, N.; Mochida, N.; Ishida, T.; Sunatsuki, Y.; Watanabe, M.; Tsuchimoto, M.; Mrozinski, J.; et al. Crystal field splitting of the ground state of terbium(iii) and dysprosium(III) complexes with a triimidazolyl tripod ligand and an acetate determined by magnetic analysis and luminescence. Inorg. Chem. 2014, 53, 10359–10369. [Google Scholar] [CrossRef] [PubMed]
- Ren, M.; Bao, S.-S.; Ferreira, R.A.S.; Zheng, L.-M.; Carlos, L.D. A layered erbium phosphonate in pseudo-D5h symmetry exhibiting field-tunable magnetic relaxation and optical correlation. Chem. Commun. 2014, 50, 7621–7624. [Google Scholar] [CrossRef] [PubMed]
- Long, J.; Rouquette, J.; Thibaud, J.-M.; Ferreira, R.A.S.; Carlos, L.D.; Donnadieu, B.; Vieru, V.; Chibotaru, L.F.; Konczewicz, L.; Haines, J.; et al. A high-temperature molecular ferroelectric Zn/Dy complex exhibiting single-ion-magnet behavior and lanthanide luminescence. Angew. Chem. Int. Ed. 2015, 54, 2236–2240. [Google Scholar] [CrossRef] [PubMed]
- Rechkemmer, Y.; Fischer, J.E.; Marx, R.; Dörfel, M.; Neugebauer, P.; Horvath, S.; Gysler, M.; Brock-Nannestad, T.; Frey, W.; Reid, M.F.; et al. Comprehensive spectroscopic determination of the crystal field splitting in an erbium single-ion magnet. J. Am. Chem. Soc. 2015, 137, 13114–13120. [Google Scholar] [CrossRef] [PubMed]
- Gregson, M.; Chilton, N.F.; Ariciu, A.-M.; Tuna, F.; Crowe, I.F.; Lewis, W.; Blake, A.J.; Collison, D.; McInnes, E.J.L.; Winpenny, R.E.P.; et al. A monometallic lanthanide bis(methanediide) single molecule magnet with a large energy barrier and complex spin relaxation behaviour. Chem. Sci. 2016, 7, 155–165. [Google Scholar] [CrossRef]
- Bi, Y.; Chen, C.; Zhao, Y.-F.; Zhang, Y.-Q.; Jiang, S.-D.; Wang, B.-W.; Han, J.-B.; Sun, J.-L.; Bian, Z.-Q.; Wang, Z.-M.; et al. Thermostability and photoluminescence of dy(III) single-molecule magnets under a magnetic field. Chem. Sci. 2016, 7, 5026–5031. [Google Scholar] [CrossRef]
- Al Hareri, M.; Gavey, E.L.; Regier, J.; Ras Ali, Z.; Carlos, L.D.; Ferreira, R.A.S.; Pilkington, M. Encapsulation of a [Dy(OH2)8]3+ cation: Magneto-optical and theoretical studies of a caged, emissive smm. Chem. Commun. 2016, 52, 11335–11338. [Google Scholar] [CrossRef] [PubMed]
- Bunzli, J.-C.G.; Piguet, C. Taking advantage of luminescent lanthanide ions. Chem. Soc. Rev. 2005, 34, 1048–1077. [Google Scholar] [CrossRef] [PubMed]
- Casanova, D.; Llunell, M.; Alemany, P.; Alvarez, S. The rich stereochemistry of eight-vertex polyhedra: A continuous shape measures study. Chem. Eur. J. 2005, 11, 1479–1494. [Google Scholar] [CrossRef] [PubMed]
- Zadrozny, J.M.; Atanasov, M.; Bryan, A.M.; Lin, C.-Y.; Rekken, B.D.; Power, P.P.; Neese, F.; Long, J.R. Slow magnetization dynamics in a series of two-coordinate iron(II) complexes. Chem. Sci. 2013, 4, 125–138. [Google Scholar] [CrossRef]
- Bilyachenko, A.N.; Yalymov, A.I.; Korlyukov, A.A.; Long, J.; Larionova, J.; Guari, Y.; Zubavichus, Y.V.; Trigub, A.L.; Shubina, E.S.; Eremenko, I.L.; et al. Heterometallic Na6Co3 phenylsilsesquioxane exhibiting slow dynamic behavior in its magnetization. Chem. Eur. J. 2015, 21, 18563–18565. [Google Scholar] [CrossRef] [PubMed]
- Meihaus, K.R.; Minasian, S.G.; Lukens, W.W.; Kozimor, S.A.; Shuh, D.K.; Tyliszczak, T.; Long, J.R. Influence of pyrazolate vs. N-heterocyclic carbene ligands on the slow magnetic relaxation of homoleptic trischelate lanthanide(III) and uranium(III) complexes. J. Am. Chem. Soc. 2014, 136, 6056–6068. [Google Scholar] [CrossRef] [PubMed]
- Ungur, L.; Chibotaru, L.F. Strategies toward high-temperature lanthanide-based single-molecule magnets. Inorg. Chem. 2016, 55, 10043–10056. [Google Scholar] [CrossRef] [PubMed]
- Shrivastava, K.N. Theory of spin–lattice relaxation. Phys. Status Solidi B 1983, 117, 437–458. [Google Scholar] [CrossRef]
- Scott, P.L.; Jeffries, C.D. Spin-lattice relaxation in some rare-earth salts at helium temperatures; observation of the phonon bottleneck. Phys. Rev. 1962, 127, 32–51. [Google Scholar] [CrossRef]
- Blagg, R.J.; Ungur, L.; Tuna, F.; Speak, J.; Comar, P.; Collison, D.; Wernsdorfer, W.; McInnes, E.J.L.; Chibotaru, L.F.; Winpenny, R.E.P. Magnetic relaxation pathways in lanthanide single-molecule magnets. Nat. Chem. 2013, 5, 673–678. [Google Scholar] [CrossRef] [PubMed]
- Amjad, A.; Figuerola, A.; Caneschi, A.; Sorace, L. Multiple magnetization reversal channels observed in a 3d-4f single molecule magnet. Magnetochemistry 2016, 2. [Google Scholar] [CrossRef]
- Mydosh, J.A. Spin Glasses: An Experimental Introduction; Taylor & Francis: London, UK; Washington, DC, USA, 1993. [Google Scholar]
- Chilton, N.F.; Collison, D.; McInnes, E.J.L.; Winpenny, R.E.P.; Soncini, A. An electrostatic model for the determination of magnetic anisotropy in dysprosium complexes. Nat. Commun. 2013, 4. [Google Scholar] [CrossRef] [PubMed]
- Orbach, R.; Blume, M. Spin-lattice relaxation in multilevel spin systems. Phys. Rev. Lett. 1962, 8, 478–480. [Google Scholar] [CrossRef]
- Dolomanov, O.V.; Bourhis, L.J.; Gildea, R.J.; Howard, J.A.K.; Puschmann, H. Olex2: A complete structure solution, refinement and analysis program. J. Appl. Cryst. 2009, 42, 339–341. [Google Scholar] [CrossRef]
- Palatinus, L.; Prathapa, S.J.; van Smaalen, S. Edma: A computer program for topological analysis of discrete electron densities. J. Appl. Cryst. 2012, 45, 575–580. [Google Scholar] [CrossRef]
- Bourhis, L.J.; Dolomanov, O.V.; Gildea, R.J.; Howard, J.A.; Puschmann, H. The anatomy of a comprehensive constrained, restrained refinement program for the modern computing environment—Olex2 dissected. Acta Cryst. A 2015, 71, 59–75. [Google Scholar] [CrossRef] [PubMed]


© 2016 by the authors; licensee MDPI, Basel, Switzerland. This article is an open access article distributed under the terms and conditions of the Creative Commons Attribution (CC-BY) license (http://creativecommons.org/licenses/by/4.0/).
Share and Cite
Mamontova, E.; Long, J.; Ferreira, R.A.S.; Botas, A.M.P.; Luneau, D.; Guari, Y.; Carlos, L.D.; Larionova, J. Magneto-Luminescence Correlation in the Textbook Dysprosium(III) Nitrate Single-Ion Magnet. Magnetochemistry 2016, 2, 41. https://doi.org/10.3390/magnetochemistry2040041
Mamontova E, Long J, Ferreira RAS, Botas AMP, Luneau D, Guari Y, Carlos LD, Larionova J. Magneto-Luminescence Correlation in the Textbook Dysprosium(III) Nitrate Single-Ion Magnet. Magnetochemistry. 2016; 2(4):41. https://doi.org/10.3390/magnetochemistry2040041
Chicago/Turabian StyleMamontova, Ekaterina, Jérôme Long, Rute A. S. Ferreira, Alexandre M. P. Botas, Dominique Luneau, Yannick Guari, Luis D. Carlos, and Joulia Larionova. 2016. "Magneto-Luminescence Correlation in the Textbook Dysprosium(III) Nitrate Single-Ion Magnet" Magnetochemistry 2, no. 4: 41. https://doi.org/10.3390/magnetochemistry2040041