Article

Slow Magnetic Relaxation of Lanthanide(III) Complexes with a Helical Ligand

1
Department of Chemistry, Faculty of Science, Nara Women’s University, Kita-uoya Nishi-machi, Nara 630-8506, Japan
2
Department of Chemistry and Biological Science, College of Science and Engineering, Aoyama Gakuin University, Fuchinobe, Chuo-ku, Sagamihara, Kanagawa 252-5258, Japan
*
Authors to whom correspondence should be addressed.
Magnetochemistry 2016, 2(4), 43; https://doi.org/10.3390/magnetochemistry2040043
Submission received: 31 October 2016 / Revised: 28 November 2016 / Accepted: 30 November 2016 / Published: 8 December 2016
(This article belongs to the Special Issue Molecular Magnetism of Lanthanides Complexes and Networks)

Abstract

:
Isostructural Ln(III) mononuclear complexes [Ln(NO3)2L]PF6·MeCN (Ln = Nd, Tb, or Dy; L denotes a helical hexa-dentate ligand) were synthesized, and their slow magnetic relaxation behavior was investigated. In these complexes, oblate-type Ln(III) ions are located in an axially stressed ligand field with two nitrate anions, and can exhibit single-molecule magnet (SMM) behavior. Field-induced SMM behavior was observed for Nd(III) and Dy(III) complexes under an applied bias DC field of 1000 Oe.

Graphical Abstract

1. Introduction

Single-molecule magnets (SMMs) are fascinating molecule-based nanomaterials [1,2,3,4,5,6,7,8]. They are characterized by slow magnetization at low temperature, of which the magnetic anisotropy plays an essential role in preventing the flipping of the magnetic moment [1]. As the orbital angular momentum of 4f electrons are maintained and unquenched, each lanthanide(III) (Ln(III)) ion possesses a large magnetic moment correlated with the total angular momentum, J, which is defined by the length of the resultant vector of the spin angular momentum, S, and the orbital angular momentum, L. The expected J values of Ce(III) (L = 3, S = 1/2), Nd(III) (L = 6, S = 3/2), Tb(III) (L = 3, S = 3), and Dy(III) (L = 5, S = 5/2) are 5/2, 9/2, 6, and 15/2, respectively. In each Ln(III) ion, the contribution of the orbital angular momentum to the total angular momentum is greater than that of the spin angular momentum. Hence, each sub-level, which is characterized by magnetic quantum number Jz, has a distinguishable electronic distribution and interacts with the crystal field in a different manner. In these Ln(III) ions, sub-levels with the highest |Jz| quantum numbers, that is, Jz = ±5/2 for Ce(III), ±9/2 for Nd(III), ±6 for Tb(III), and ±15/2 for Dy(III), have oblate-shaped electronic distributions and are called oblate-type Ln(III) ions [9,10,11]. These Jz sublevels are relatively stabilized when the Ln(III) ion is located in an axially stressed crystal field, where the equatorial electronic repulsion is smaller than the axial electronic repulsion, since other Jz sub-levels are more destabilized under these conditions. This situation can be realized in complexes by combining neutral multi-dentate ligands, which occupy the equatorial positions of the Ln(III) ion and anionic ligands, which occupy the axial positions [11]. In a previous paper, we reported the syntheses and crystal structures of a series of Ln(III) complexes constructed from a single helical ligand (L, Figure 1) and two nitrate anions, [LnL(NO3)2]PF6·MeCN (Ln = Nd, Eu, Gd, and Tb) and [HoL(NO3)2]PF6·2MeCN, with the aim of highly efficient f-f luminescence by UV irradiation of aromatic bipyridine moieties in L [12]. This series of complexes was beneficial to study the magneto-structural correlation of slow magnetic relaxation phenomena, not only because the coordination structure was beneficial to the magnetic anisotropy design, but also because similar molecular structures were achieved in a wide variety of Ln(III) ions containing both light and heavy lanthanide ions. Several years ago, we reported that the slow magnetic relaxation of light lanthanide complexes can be achieved using a synthetic strategy similar to that employed for the heavy lanthanide ions [13,14,15]. However, examples of light lanthanide complexes that show slow magnetic relaxation phenomena are somewhat rare [13,14,15,16,17,18]. In this study, we have newly prepared a Dy(III) complex with crystal structure confirmed to be isostructural with those of the reported Nd(III) and Tb(III) complexes, and investigated the slow magnetic relaxation phenomena of this complex family, [LnL(NO3)2]PF6·MeCN (Ln = Nd (1), Tb (2), or Dy(3)), each of which contains oblate-type lanthanide ions as a magnetic center.

2. Results

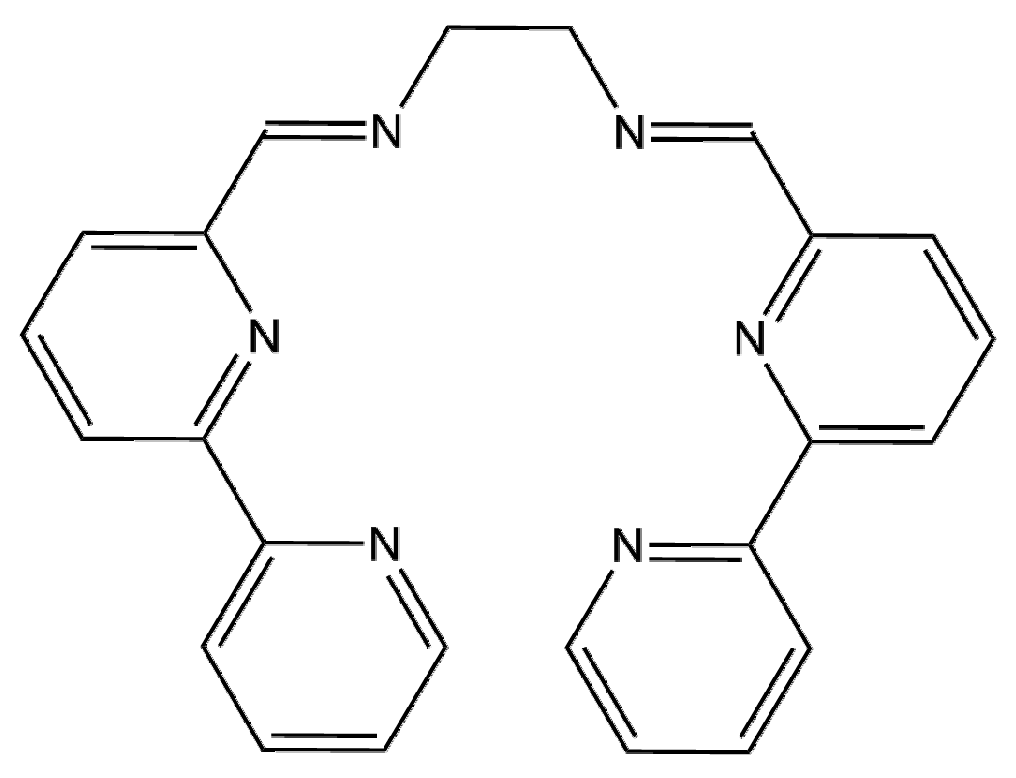
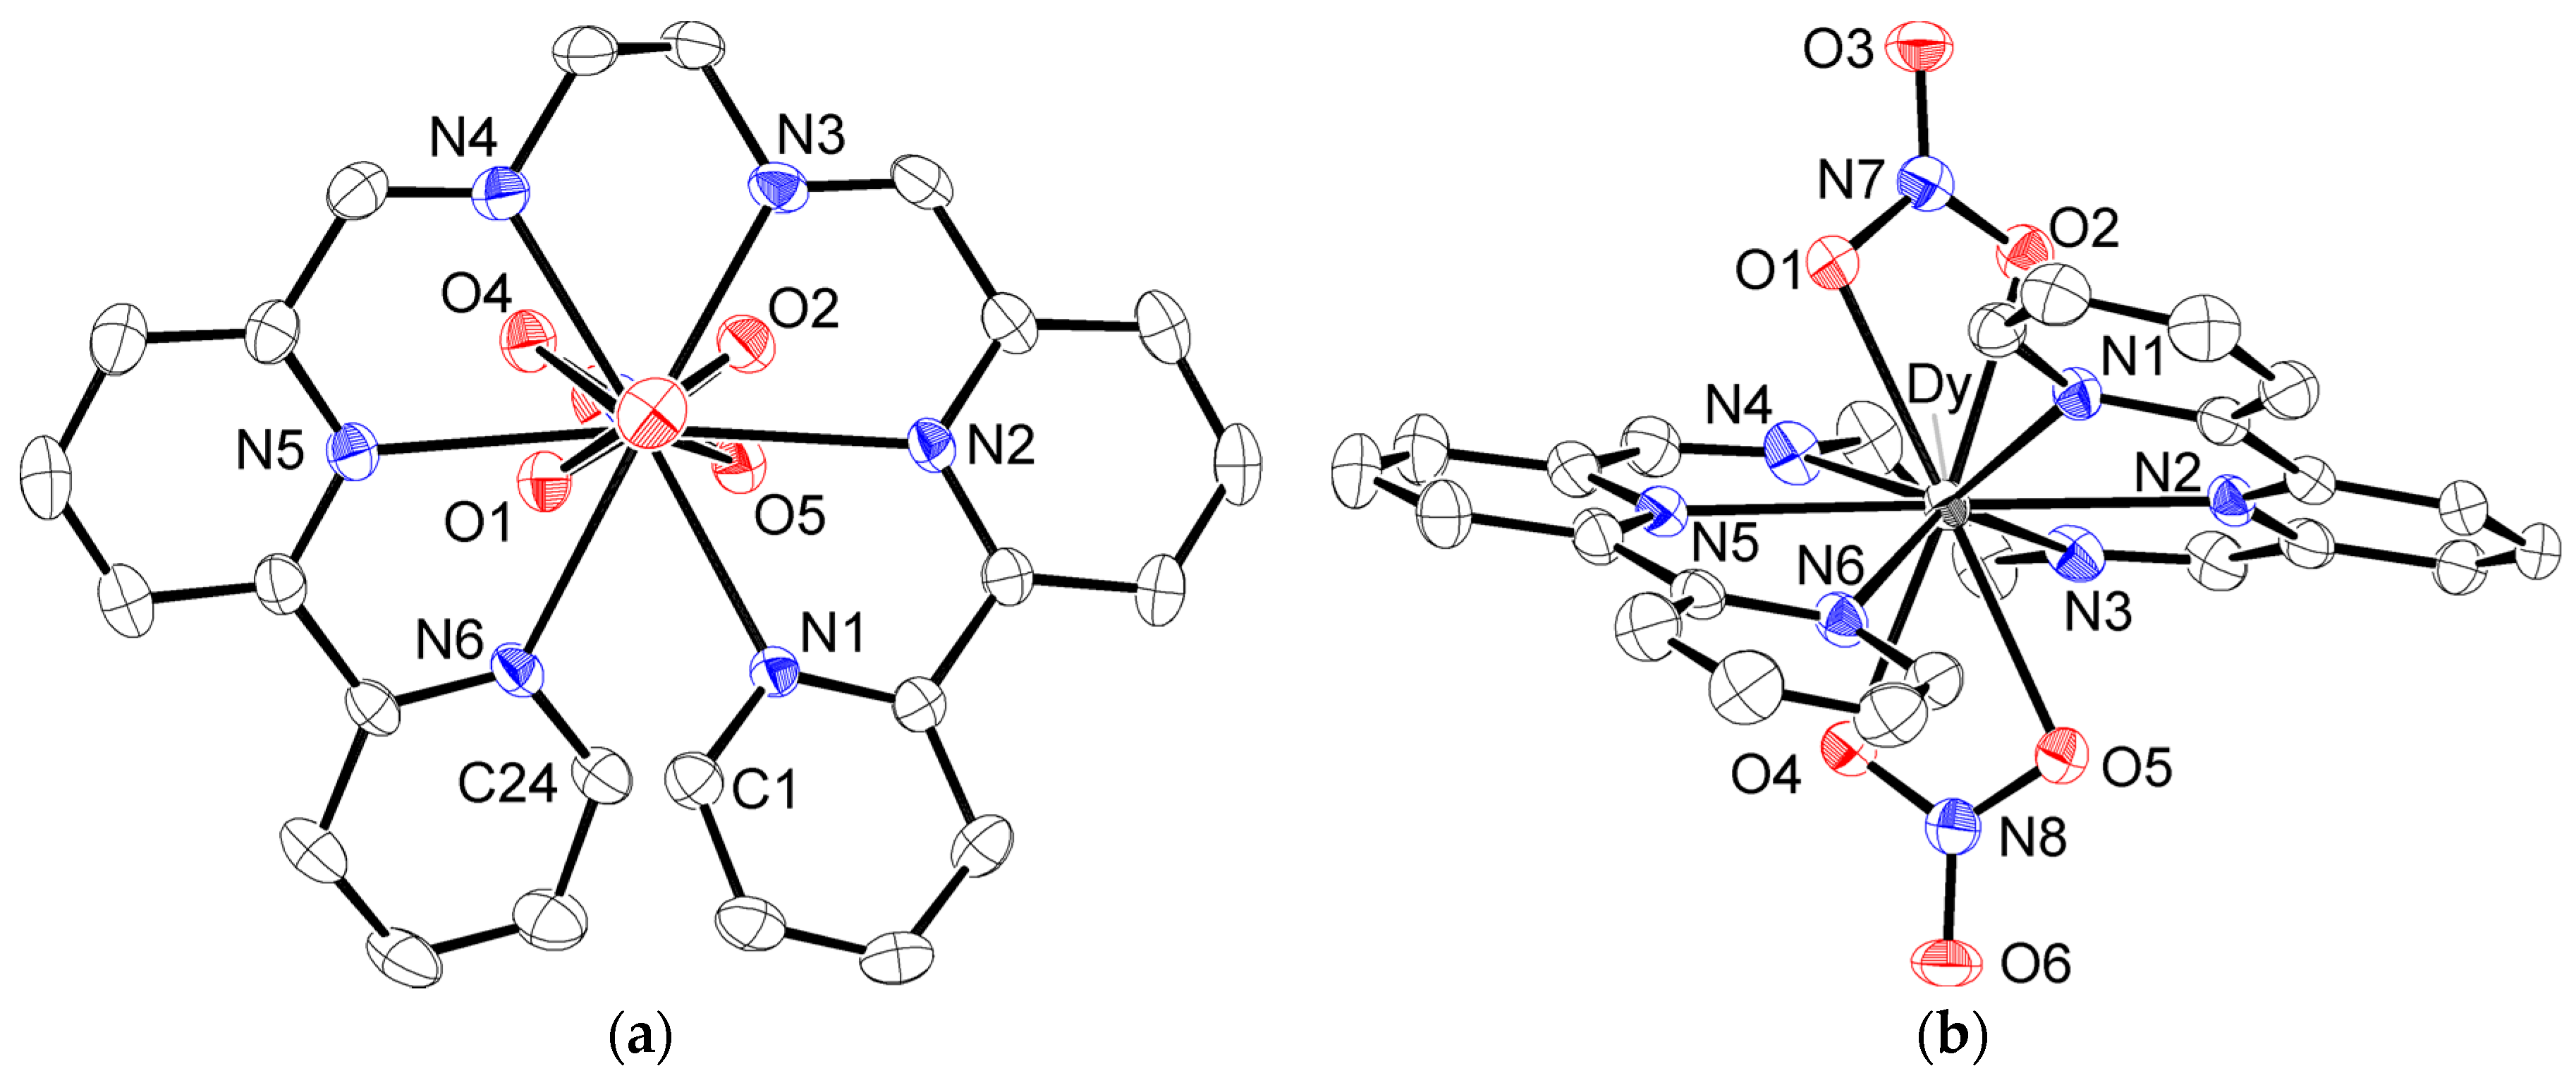
2.1. Synthesis and Characterization

The syntheses and crystal structures of Nd(III), Eu(III), Gd(III), Tb(III), and Ho(III) complexes have already been reported with the aim of the investigating their optical properties [12]. The mono-nuclear complexes of Nd(III), Eu(III), Gd(III), and Tb(III) were found to be crystallographically isostructural, while the Ho(III) complex was different. The solvent molecule content in the crystals was also slightly different between the Ho(III) complex and the other complexes, with the former formulated as [HoL(NO3)2]PF6·2MeCN and the latter as [LnL(NO3)2]PF6·MeCN. These differences may be attributed to lanthanide contraction. Gradual changes in the ionic radii of the lanthanide ions sometimes cause a clear change in the crystal structures when the lanthanide ions varied from lighter to heavier elements. In the aforementioned series, the Dy(III) complex may be located on the boundary of the structural change of the crystals. X-ray analysis revealed that the Dy(III) complex was isomorphous with the Tb(III) complex and formulated as [DyL(NO3)2]PF6·MeCN. As we could handle this series of isomorphous complexes, which include three oblate-type lanthanide complexes, we decided to investigate the magnetism of these complexes, which include Nd(III), Tb(III), and Dy(III), as magnetic centers.
We obtained the newly synthesized Dy(III) complex using a synthetic method similar to that used for other lanthanide ions. This complex showed a typical Dy(III) ion-based luminescence under irradiation with UV light (315 nm), which confirmed the formation of a Dy(III) complex with ligand L (Figure S1). The molecular structure was revealed by an X-ray diffraction study. The structure of the cationic part of [DyL(NO3)2]PF6·MeCN (3) is given in Figure 2. Crystallographic data, accompanied by coordination distances and angles, were summarized in Tables S1 and S2. In 3, neutral ligand L occupied the equatorial positions around the Dy(III) ion, forming five pentagonal chelating rings. Each bpy moiety maintained its planar arrangement, with the two terminated-pyridine rings in a face-to-face conformation, with shortest contacts of 3.198(5) Å (C1…C24). This led to the helical coordination of the entire ligand with a twisting angle of 32.5(1)°, which was defined as the dihedral angle between the two bipyridine moieties. Two nitrate anions were coordinated above and below the Dy(III) ion to complete the deca-coordination. The nitrate–Dy–nitrate arrangement was almost linear, with a N7–Dy–N8 angle of 172.18(8)°. Two nitrate groups were located in a twisting manner around the N7–Dy–N8 axis with the dihedral angle of 64.30(15)°, which is confirmed by the top view in Figure 2. Anionic nitrate coordinated with a slightly shorter bond distance (Dy–O = 2.451(3)–2.488(3) Å) than the neutral N6 ligand (Dy–N = 2.495(3)–2.596(3) Å). The estimated coordination distances were slightly shorter than those of the Tb(III) complex (Tb–O = 2.466(3)–2.500(3) Å, Tb–N = 2.505(3)–2.601(3) Å). Although there were slight differences in the coordination distances due to lanthanide contraction, the ligand field geometries of the isostructural complexes 13 were very similar, which could lead to an axially stressed ligand field by sandwiching the Ln(III) ion between negatively charged nitrate ligands. This was advantageous for achieving Ising-type magnetic anisotropy in the oblate-type Nd(III), Tb(III), and Dy(III) ions.
The complexes were crystalized in a triclinic system with space group P-1, and a Z value of 2. The nearest molecules were correlated using the inversion center, and the shortest Dy...Dy distances were estimated as 8.7477(12) Å (symmetry code: −x, 1−y, −z). The packing diagram in the unit cell is given as Figure S2.

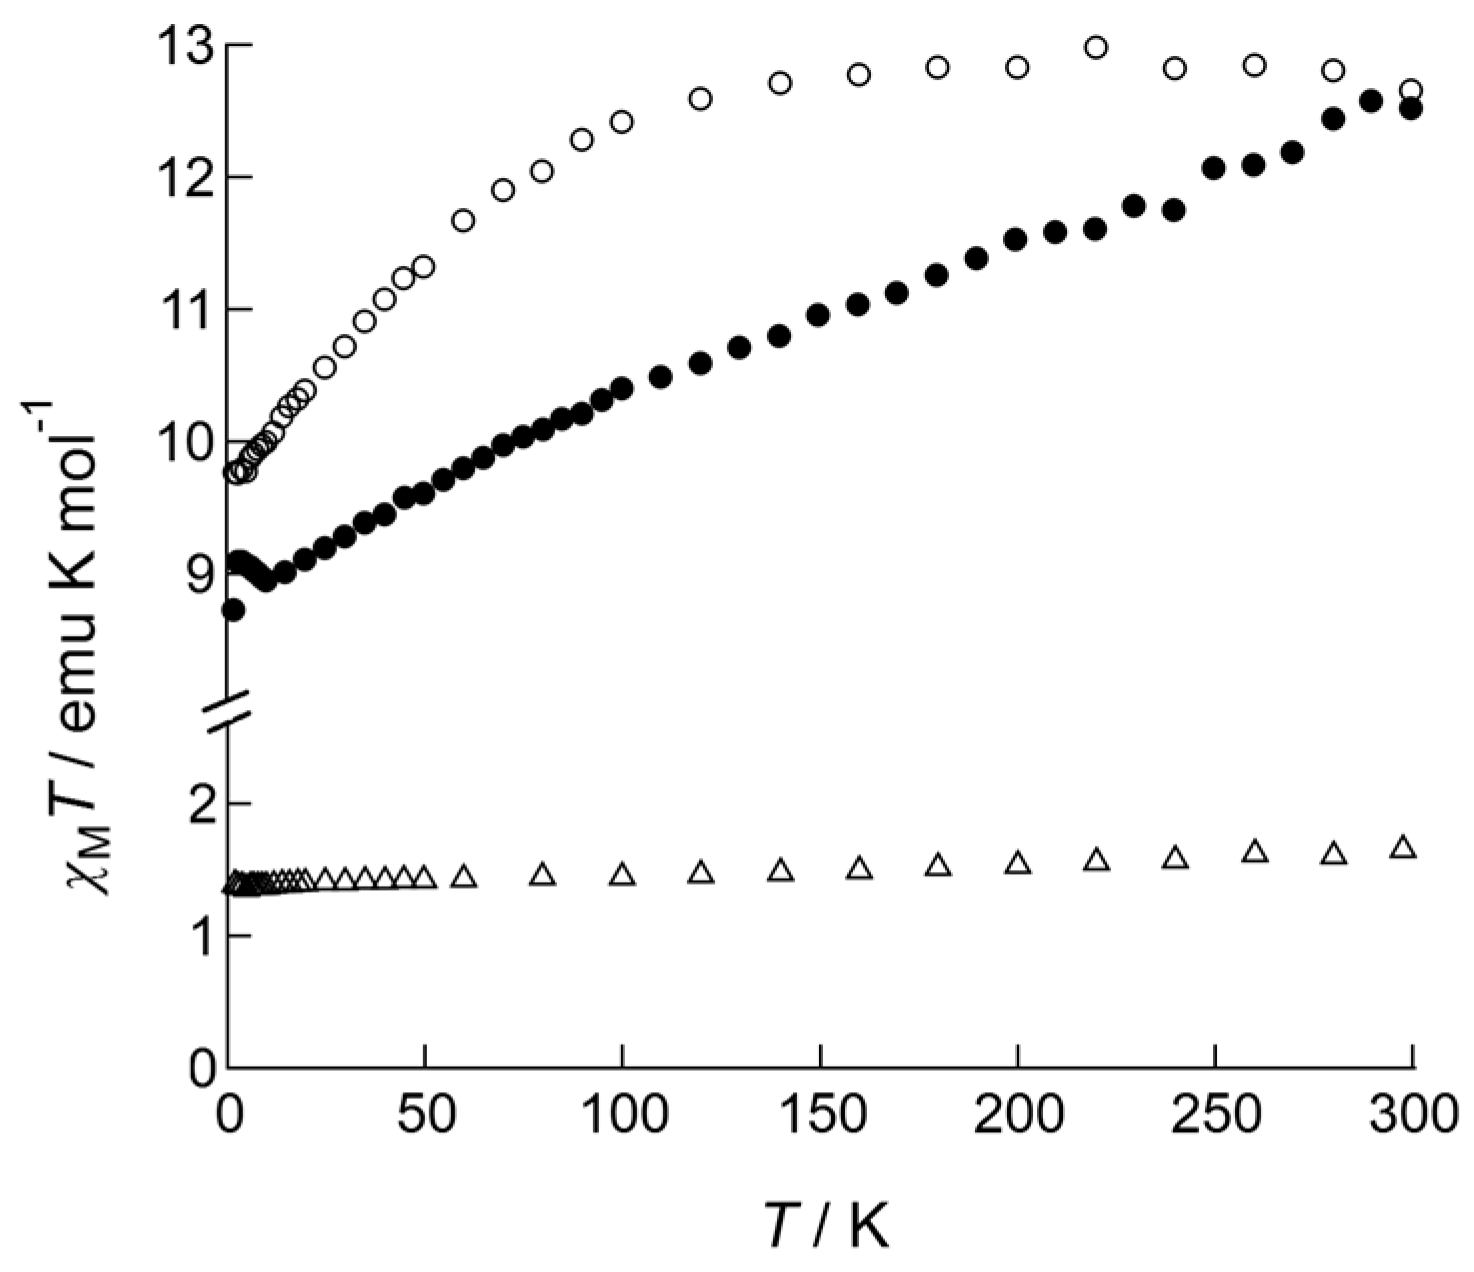
2.2. DC Susceptibility of the Complexes

The magnetic features of the complexes were initially determined from the temperature dependence of χMT products measured under 1000 Oe DC field applied (Figure 3). The expected χMT values of Ln(III) ions in the absence of a crystal field are 1.64 emu·K·mol−1 for Nd(III) (J = 9/2 and g = 8/11), 11.81 emu·K·mol−1 for Tb(III) (J = 6 and g = 3/2), and 14.17 emu·K·mol−1 for Dy(III) (J = 15/2 and g = 4/3). Observed values for 1 (1.64 emu·K·mol−1) and for 2 (12.51 emu·K·mol−1) at room temperature were similar to the expected values; however, the value was slightly smaller for 3 (12.65 emu·K·mol−1) than expected, presumably due to the effect of large magnetic anisotropy. 1 exhibited a Curie-like behavior for the entire temperature range down to 2.0 K, keeping its χMT value constant, however; 2 and 3 showed characteristic dependence of χMT values on temperature when the samples were cooled down to 2.0 K. The χMT value of 3 was almost constant on cooling; below 100 K, it gradually decreased, suggesting the presence of an intrinsic thermal-depopulation process as well as a weak inter-molecular magnetic interaction. The χMT value of 2 linearly decreased on cooling for the entire temperature range, which may be due to the thermal depopulation among several pairs of Jz-sublevels split under an anisotropic crystal field.

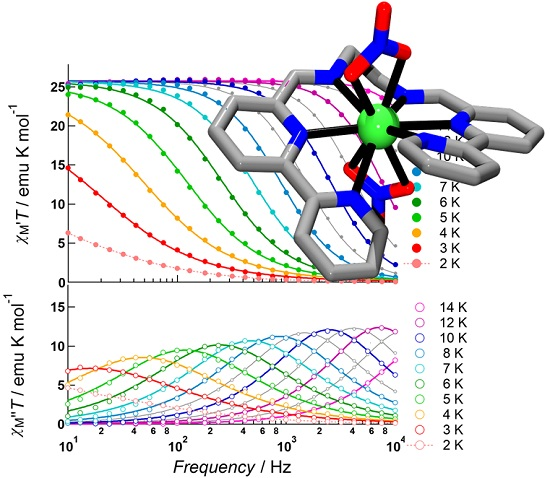
2.3. Dynamic Susceptibility of the Complexes

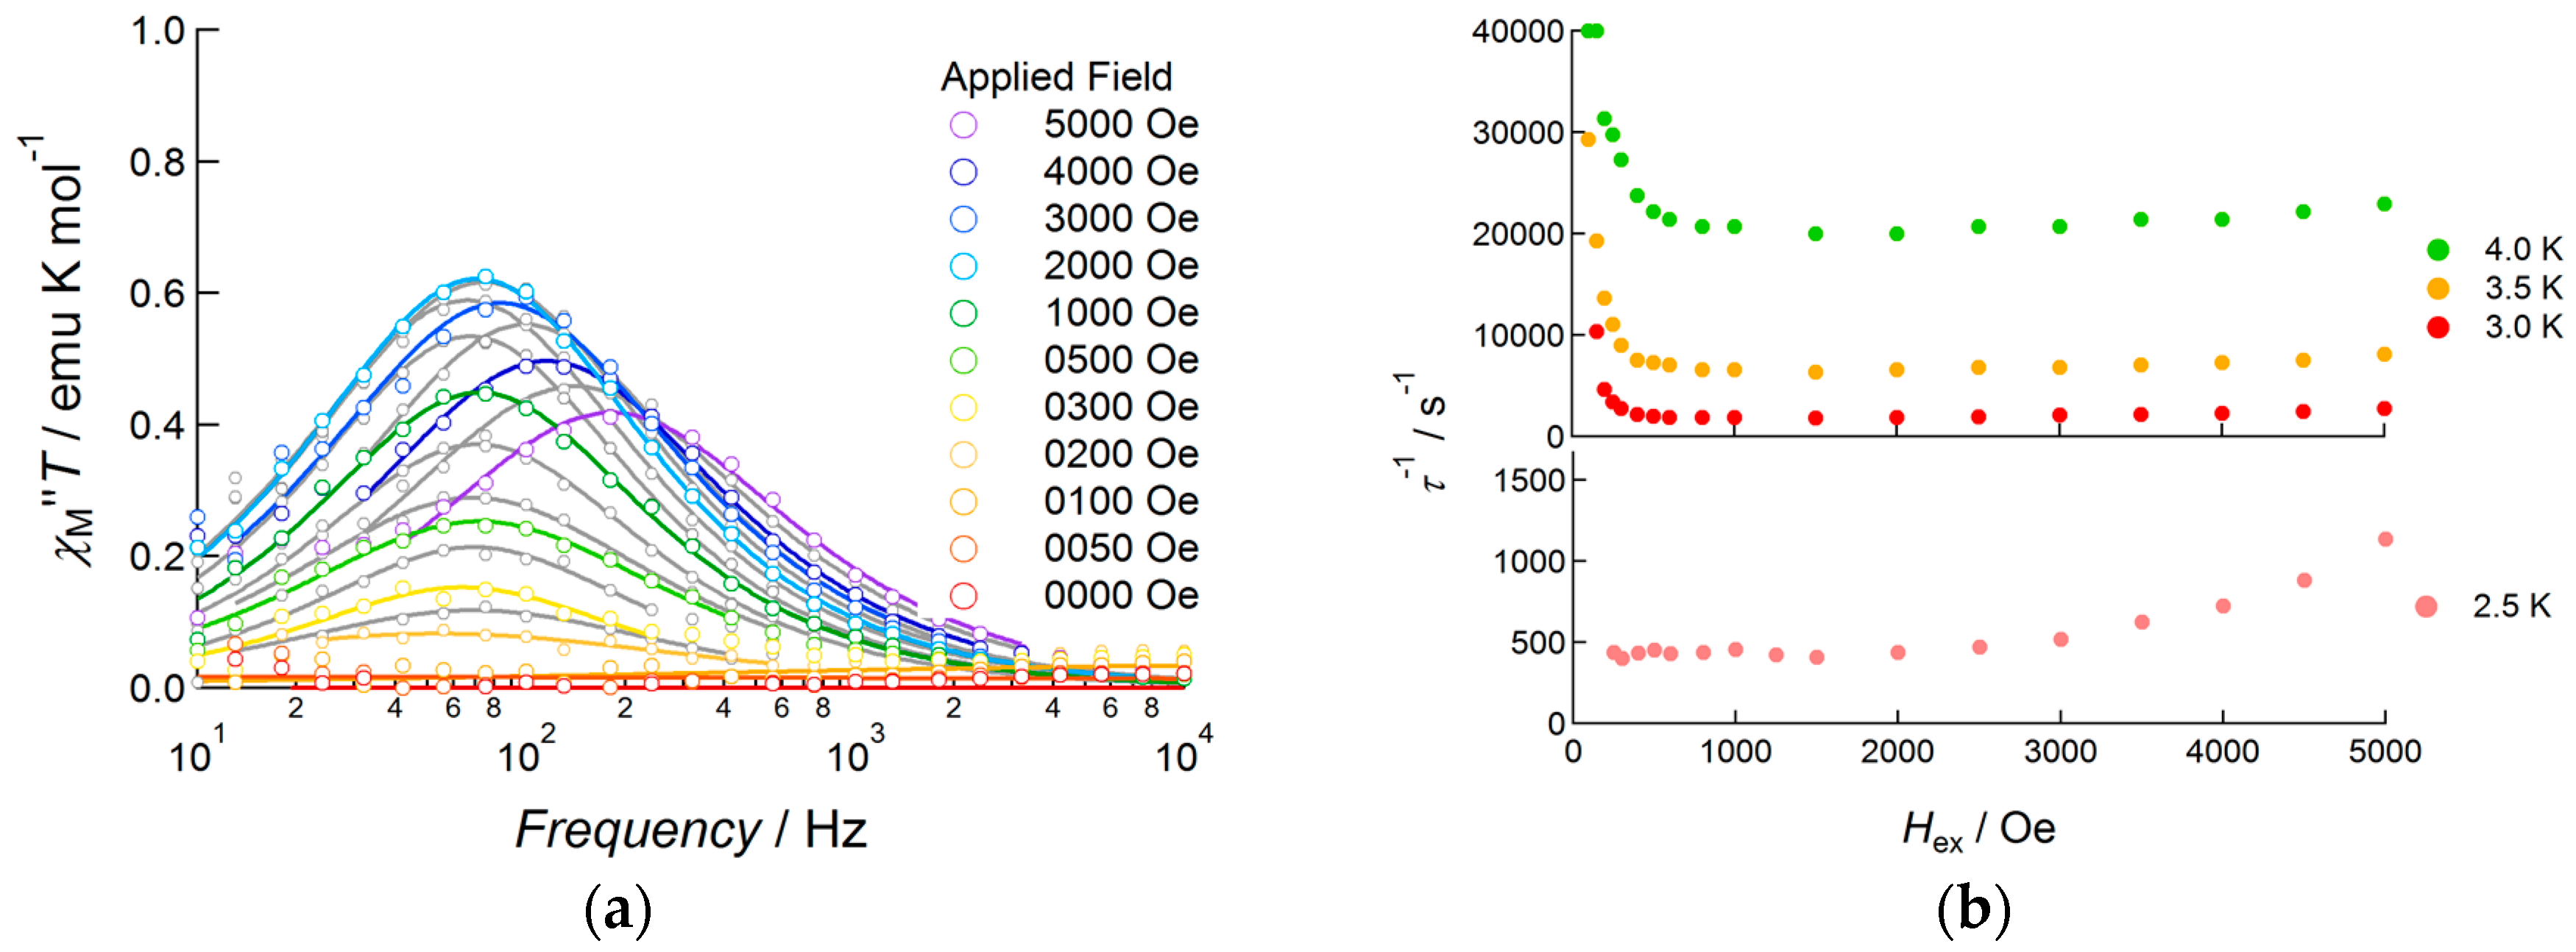
2.3.1. Nd(III) Complex 1

The slow magnetic relaxation of the complexes was revealed by measuring the alternating current (AC) magnetic susceptibility under zero field or DC field applied conditions. For Complex 1, the dynamic behavior of susceptibility was initially measured under a zero DC bias field (Figure S3), which exhibited no out-of-phase signals, χM′′, due to the quantum-tunneling magnetization (QTM) relaxation process, which was faster than the reversal of the magnetic field. The products of in-phase susceptibility and temperature, χMT, were almost constant at this AC field frequency and exhibited Curie-like behavior. This could have arisen from the relatively large separation between the ground and excited Jz sub-levels, as well as thermal depopulation phenomena not occurring in this temperature range. To suppress fast relaxation via the QTM process, the AC susceptibility was measured under 1000 Oe DC bias field applied conditions (Figure 4) [18]. Under these conditions, 1 exhibited frequency dependent χM′′ signals at temperatures up to 5.0 K and an AC frequency of up to 10,000 Hz. Figure 4a shows the frequency dependence of both in-phase and out-of-phase susceptibilities as products of temperature. The Cole–Cole plots (Figure 4b) [19] had a semicircular shape. The AC susceptibility data were well fitted with the generalized Debye equations [1,19]:
χ ( ω ) = χ S + ( χ T χ S ) 1 + ( ω τ ) 1 α sin ( π α / 2 ) 1 + 2 ( ω τ ) 1 α sin ( π α / 2 ) + ( ω τ ) 2 2 α
χ ( ω ) = ( χ T χ S ) ( ω τ ) 1 α cos ( π α / 2 ) 1 + 2 ( ω τ ) 1 α sin ( π α / 2 ) + ( ω τ ) 2 2 α ,
where χT denotes isothermal susceptibility, χS denotes adiabatic susceptibility, τ denotes relaxation time at each temperature, and α denotes the distribution of τ (Table S3). The estimated α values were small enough that slow magnetic relaxation occurred via a single process.
To investigate the slow magnetic relaxation of 1 in detail, the bias field dependence of slow relaxation was revealed in the field range 0–5000 Oe for the temperature range 2.5–4.0 K (Figure 5 and Figure S4). At 2.5 K, no peak was observed when the applied DC field was lower than 200 Oe. By applying a 250 Oe DC field, a small peak appeared at around 70 Hz (τ = 2.3 ms). When the DC field increased from 300 to 2000 Oe, a continuous increase in the amplitude of the out-of-phase signal was observed, keeping the peak frequency at around 70 Hz; above 2500 Oe, the peak frequency was gradually enhanced as the applied field was increased. This field dependence of the peak frequency showed strong temperature dependence when the temperature was increased from 2.5 K to 4.0 K. Above 3.0 K, the flipping rate under 100 Oe was drastically accelerated up to 6000 Hz. Upon increasing the field, the flipping rate decreased, reaching a minimum at around 1000 Oe, and then increased again under a DC field over 2000 Oe. Below 1000 Oe, suppression of the flipping rate under the higher magnetic field indicated that magnetic relaxation occurred via a QTM process. However, strong temperature dependence indicated that the tunneling process was not unique as well as the presence of another possibility. Throughout the whole temperature range outlined above, the relaxation rate was minimal at an applied DC field of 1000 Oe, and so AC data measured under this bias field would be used below in Arrhenius analysis.
Figure 6 shows the Arrhenius plot for 1 measured under a 1000 Oe DC applied field. A slightly bent plot was obtained over the entire temperature range, which might indicate the presence of several relaxation processes, such as Raman and/or thermally assisted QTM (TA-QTM) processes. Before considering the Raman process, the data were first analyzed using the linear Arrhenius equation for the data above 3.5 K, which gave best fit parameters of ΔE/kB = 36(1) K and τ0−1 = 4.3(9) × 10−9 s. The data were then analyzed using Equation (3), which considers both Raman and TA-QTM processes [20,21]:
τ 1 = C T n + τ 0 1 exp ( Δ E k B T ) .
On the right-hand side of the equation, the first term denotes the Raman process, where n takes the values of 5 or 9 for Kramers ions such as Nd(III) and Dy(III). Initially, the data were fitted only considering the Raman process, which gave the value of n as 8.2(1). Then least square fitting based on Equation (3) was carried out for the data, which resulted in better agreement with the observations. The estimated values were ΔE/kB = 34(1) K, τ0−1 = 1.1(4) × 10−8 s, and C = 2.8(2) s‒1 K‒5 for n = 5, and ΔE/kB = 10(2) K, τ0−1 = 2.0(16) × 10−4 s, and C = 0.081(2) s‒1 K‒9 for n = 9. The former ΔE/kB and τ0−1 values agreed well with the linear analysis results above, and were used to describe the slow magnetic relaxation behavior of 1.

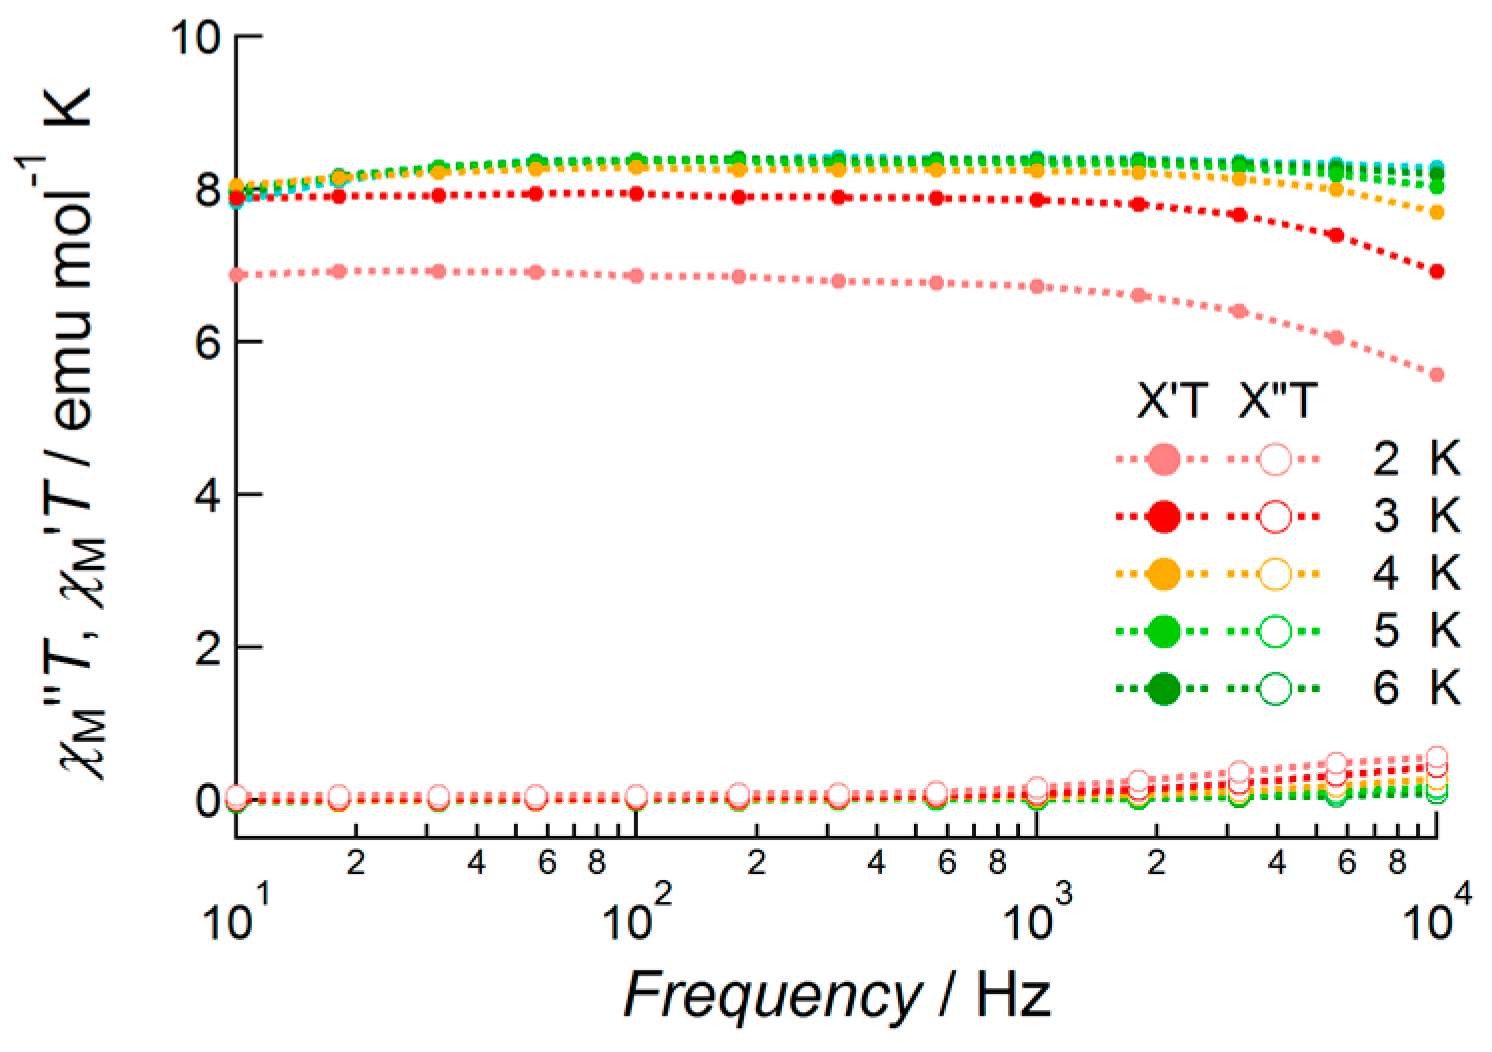
2.3.2. Tb(III) Complex 2

Tb(III) complex 2 exhibited no out-of-phase signals under zero field conditions down to 2.0 K (Figure S3). The values of the χTT products were constant and thermal depopulation phenomena were not observed below 7 K. With the application of a DC bias field of 1000 Oe, the temperature- and frequency-dependent out-of-phase component of susceptibility was observed (Figure 7). However, the observed signals were weak and no peaks were observed in this frequency range. This meant that magnetic relaxation occurred at faster frequencies than the flipping rate of the AC field under these conditions.

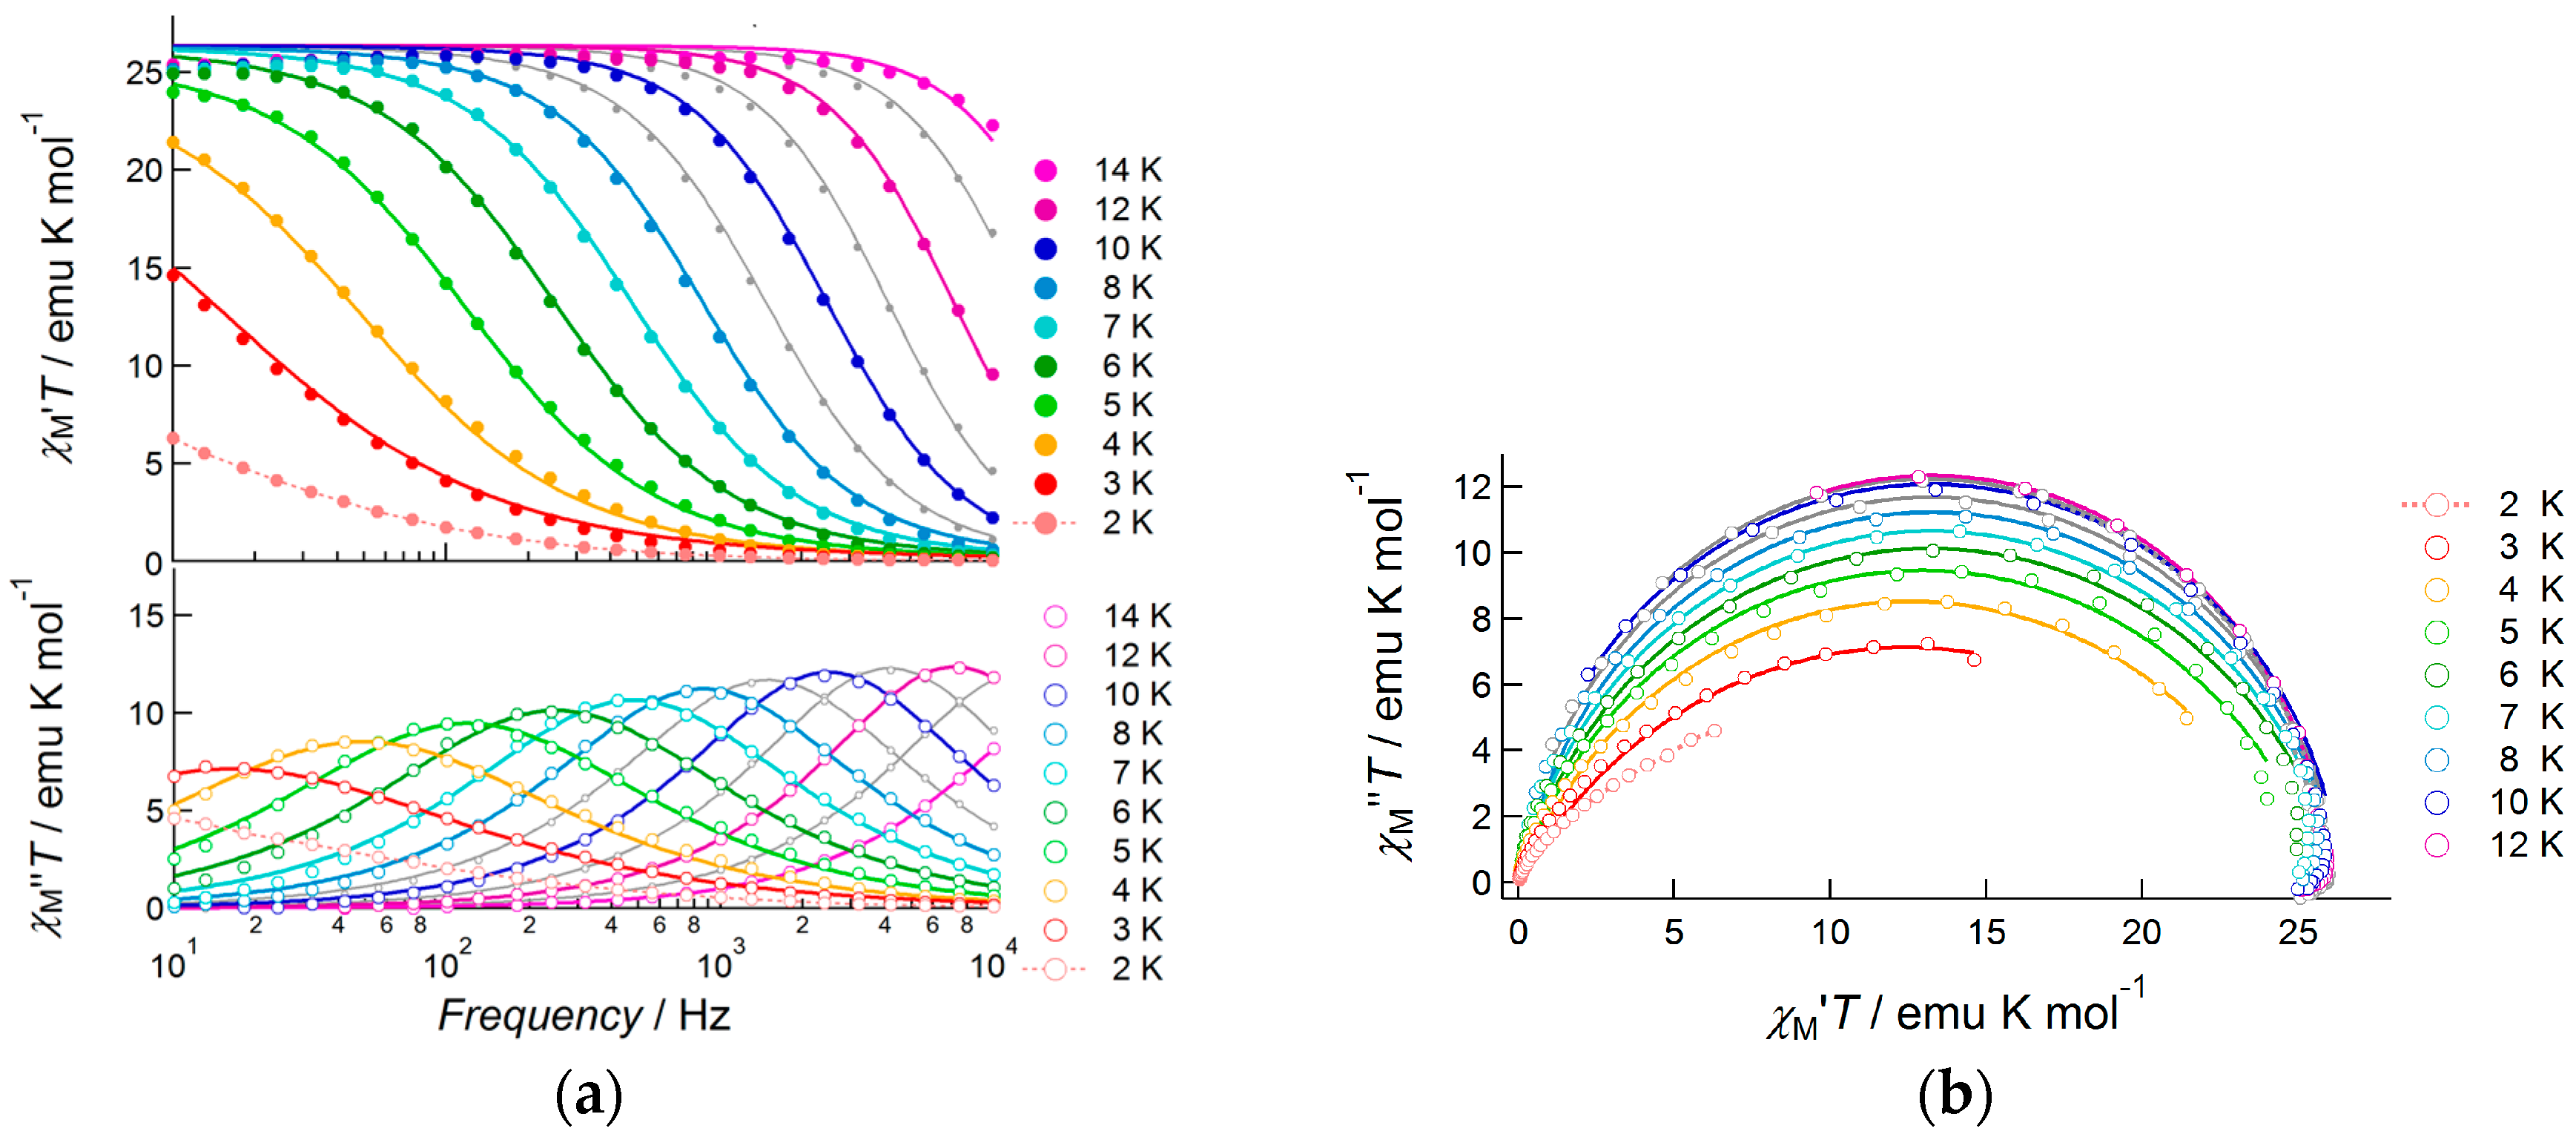
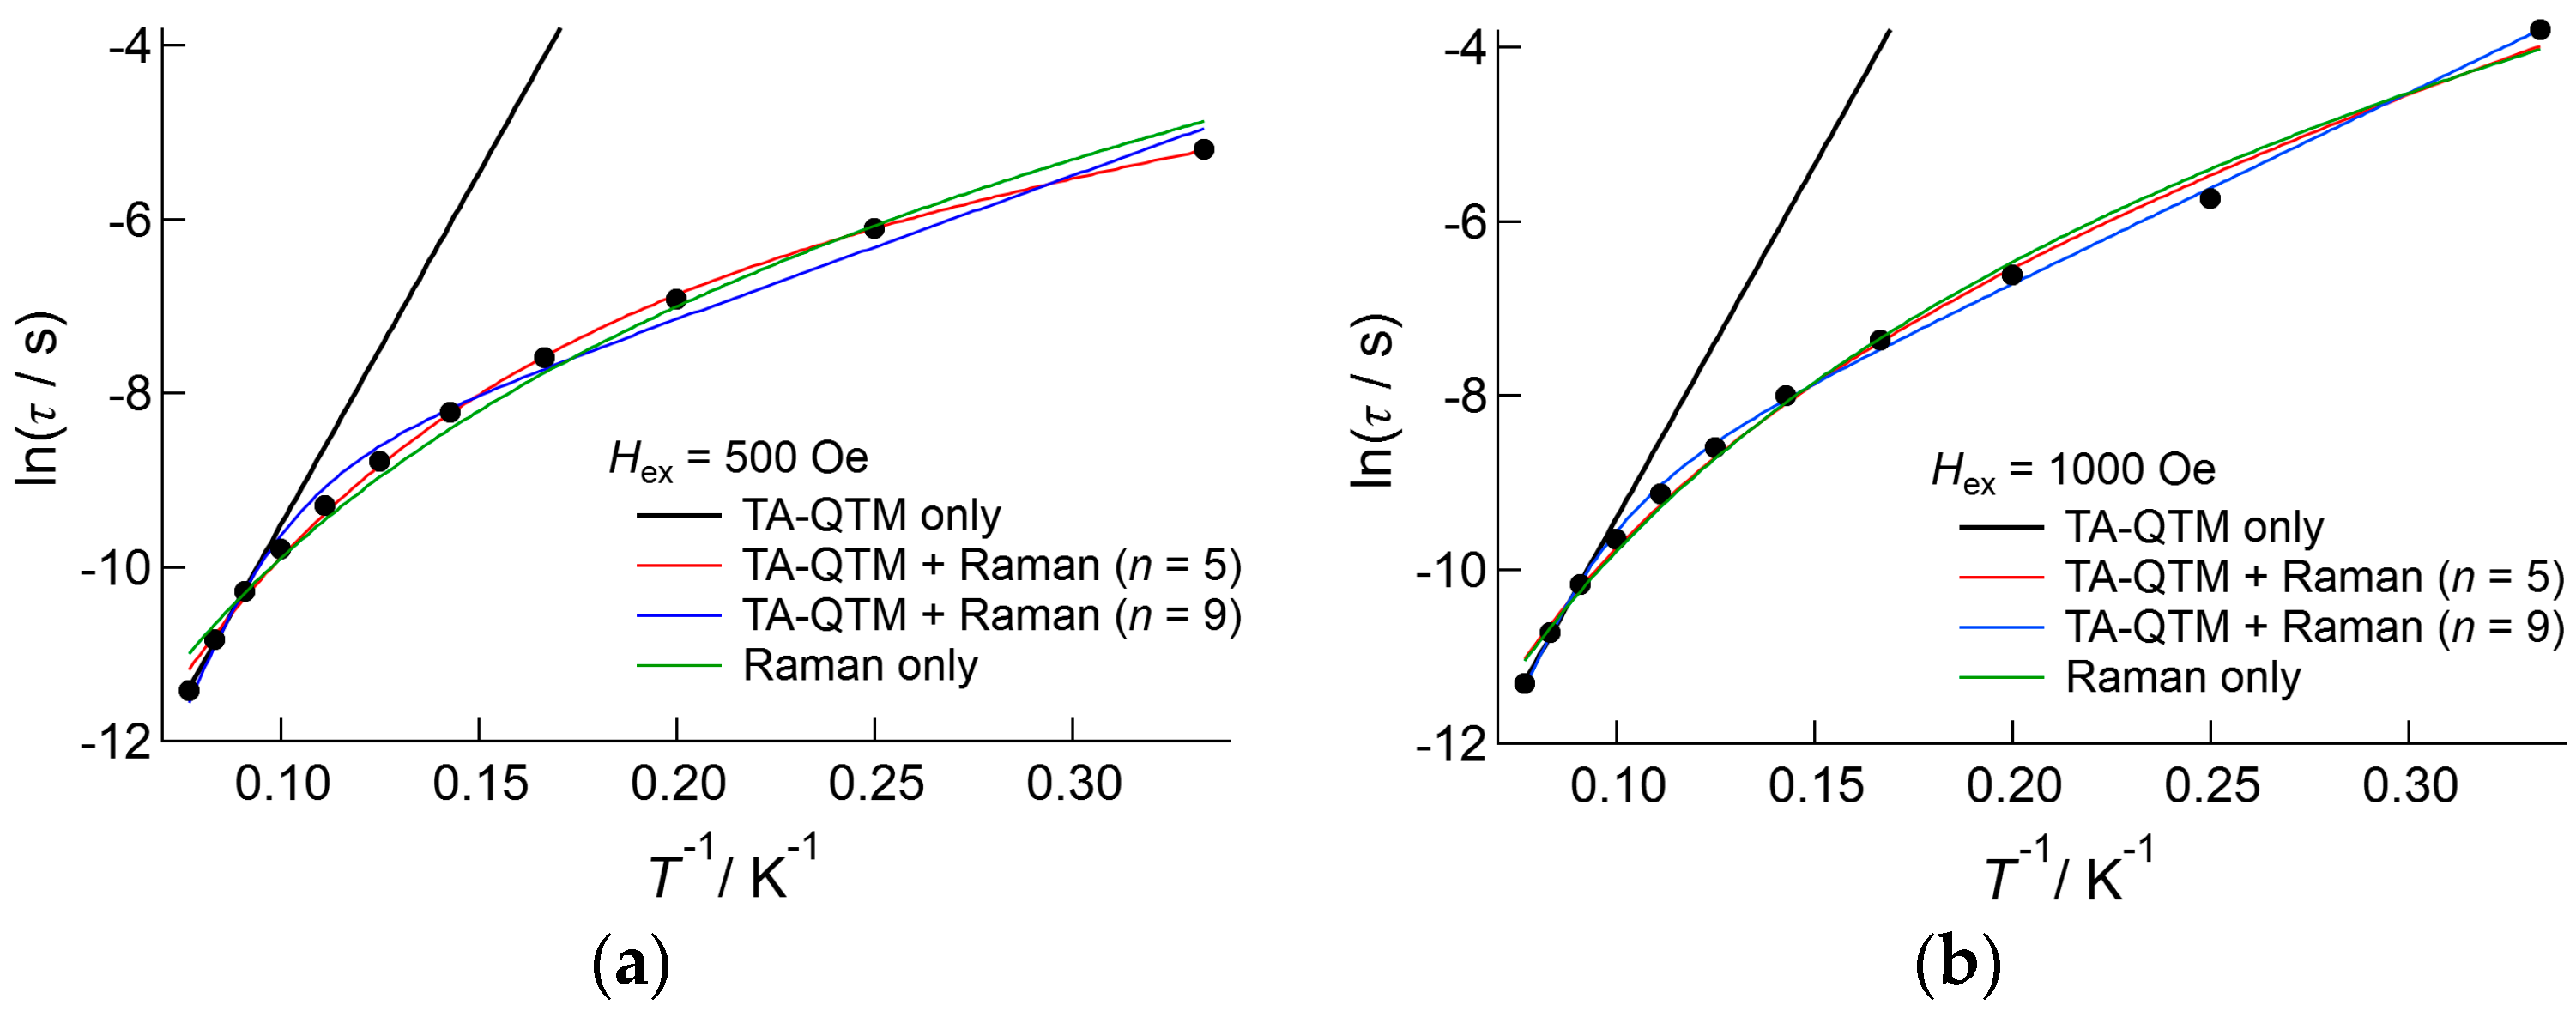
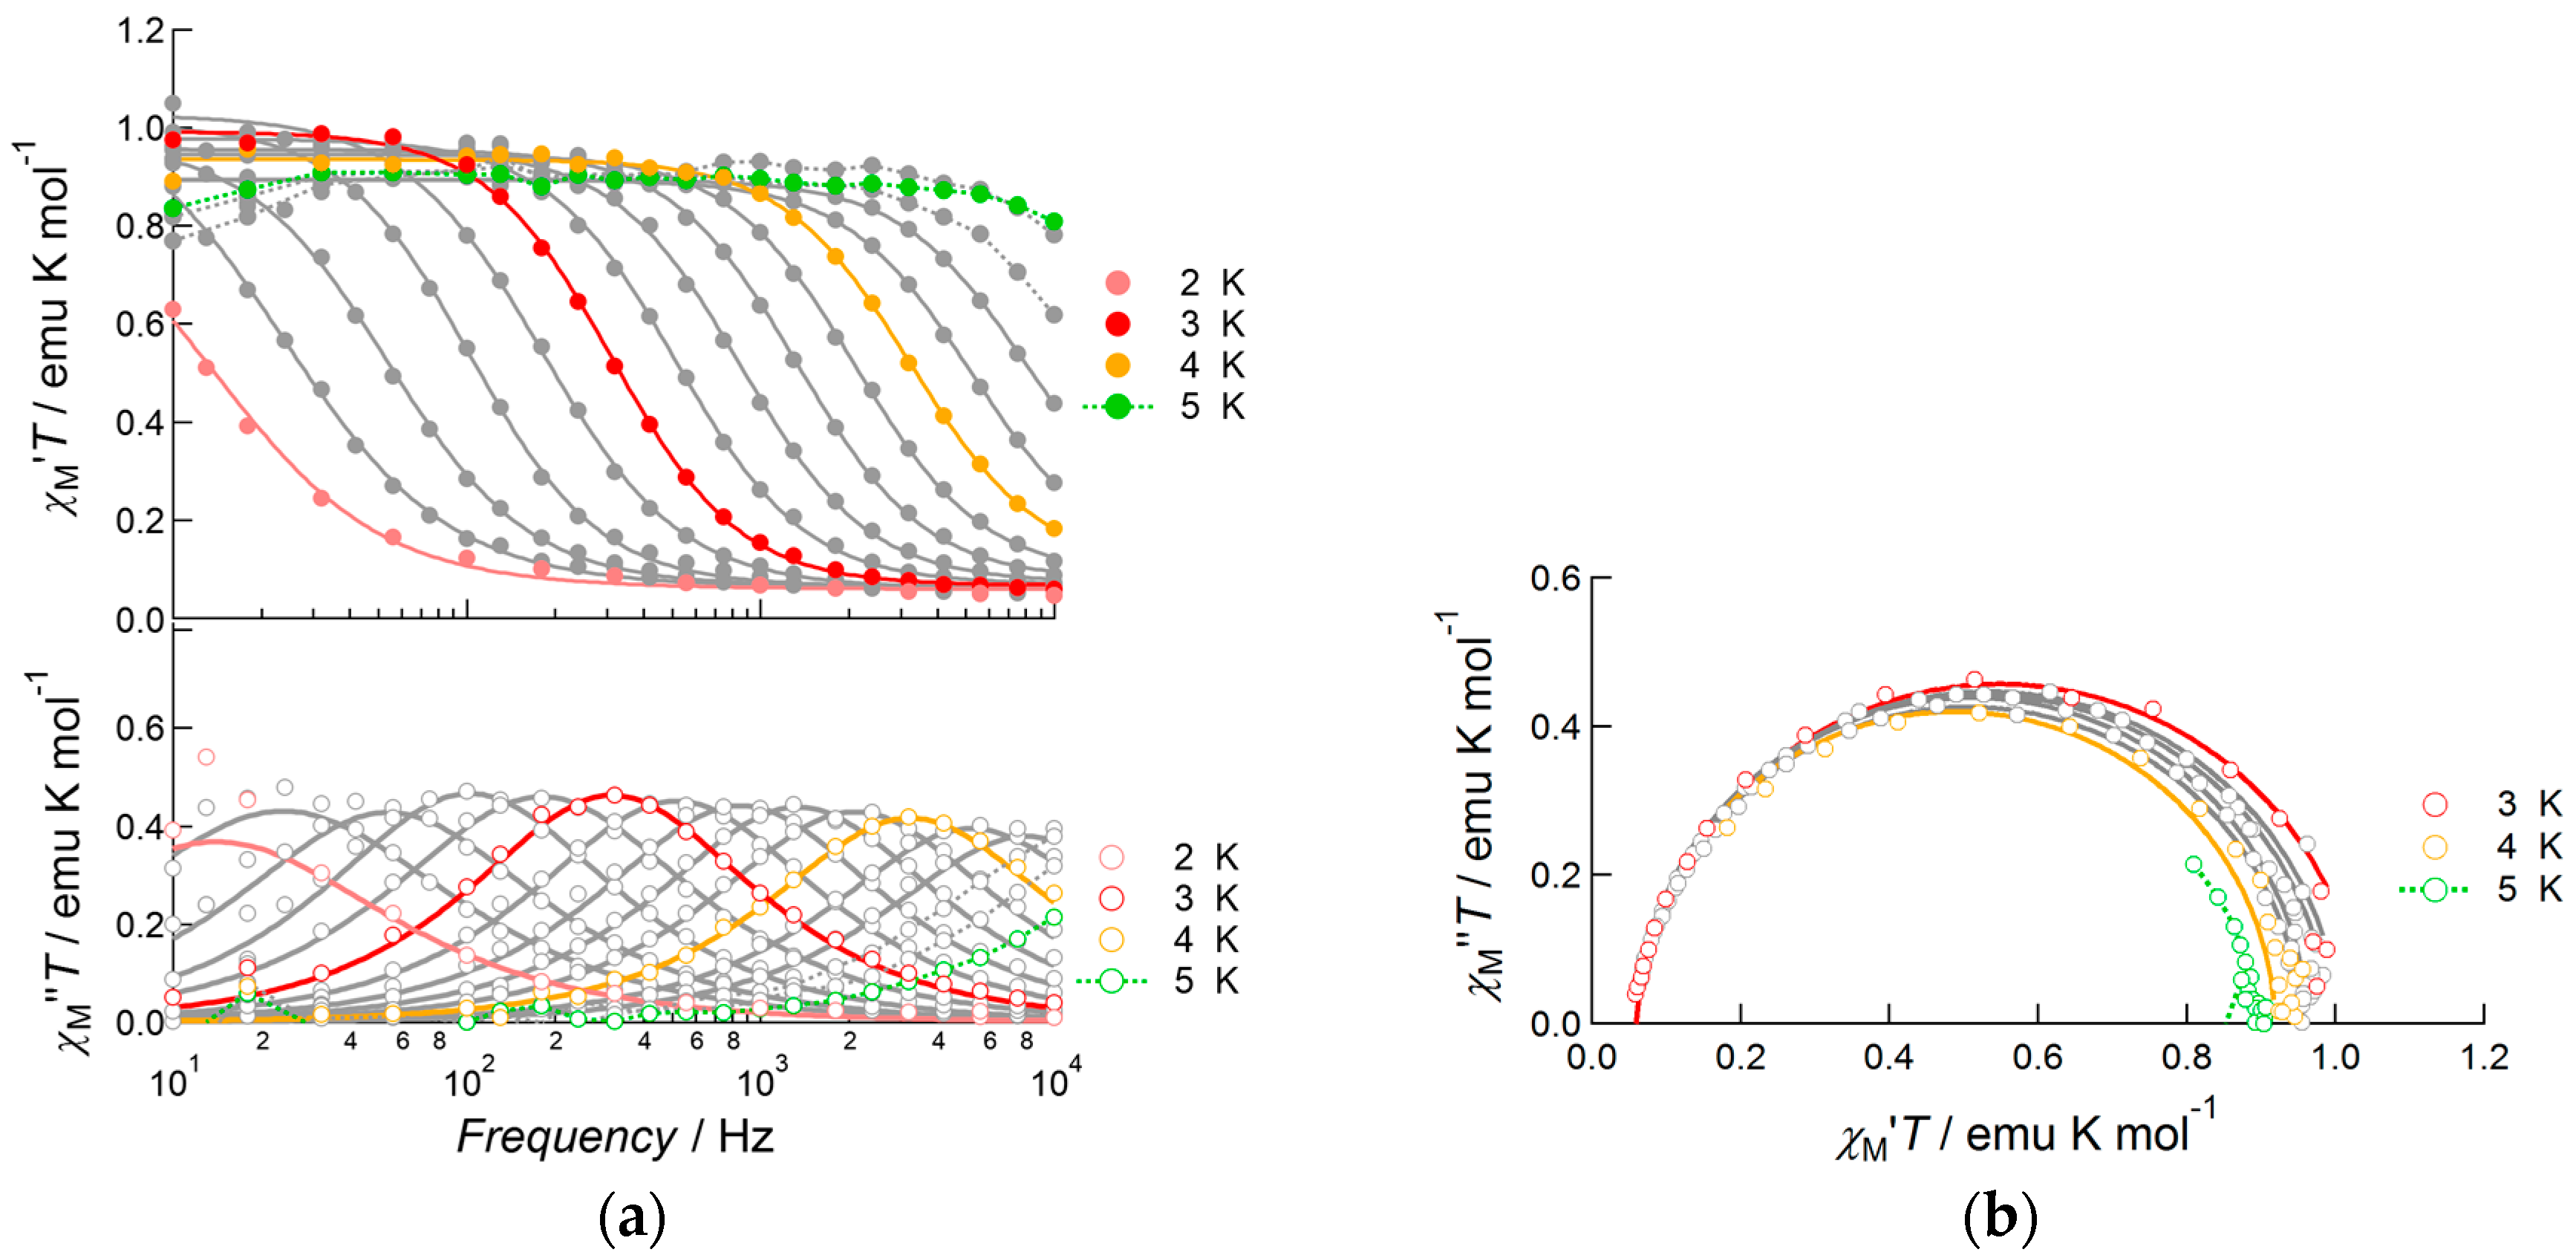
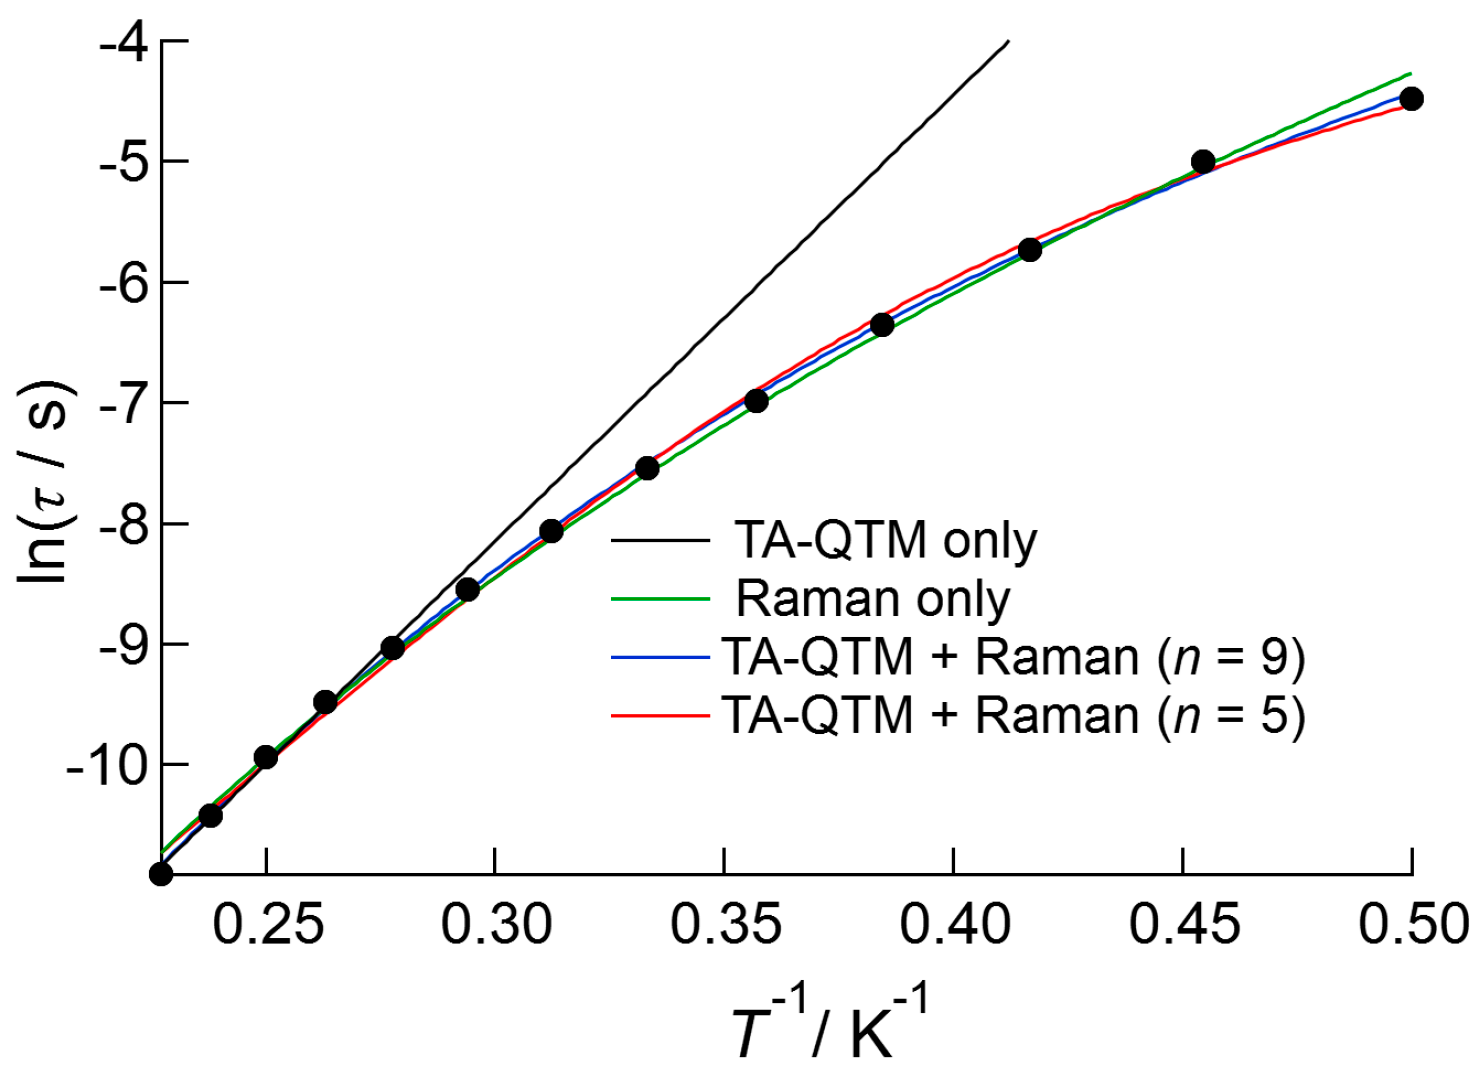
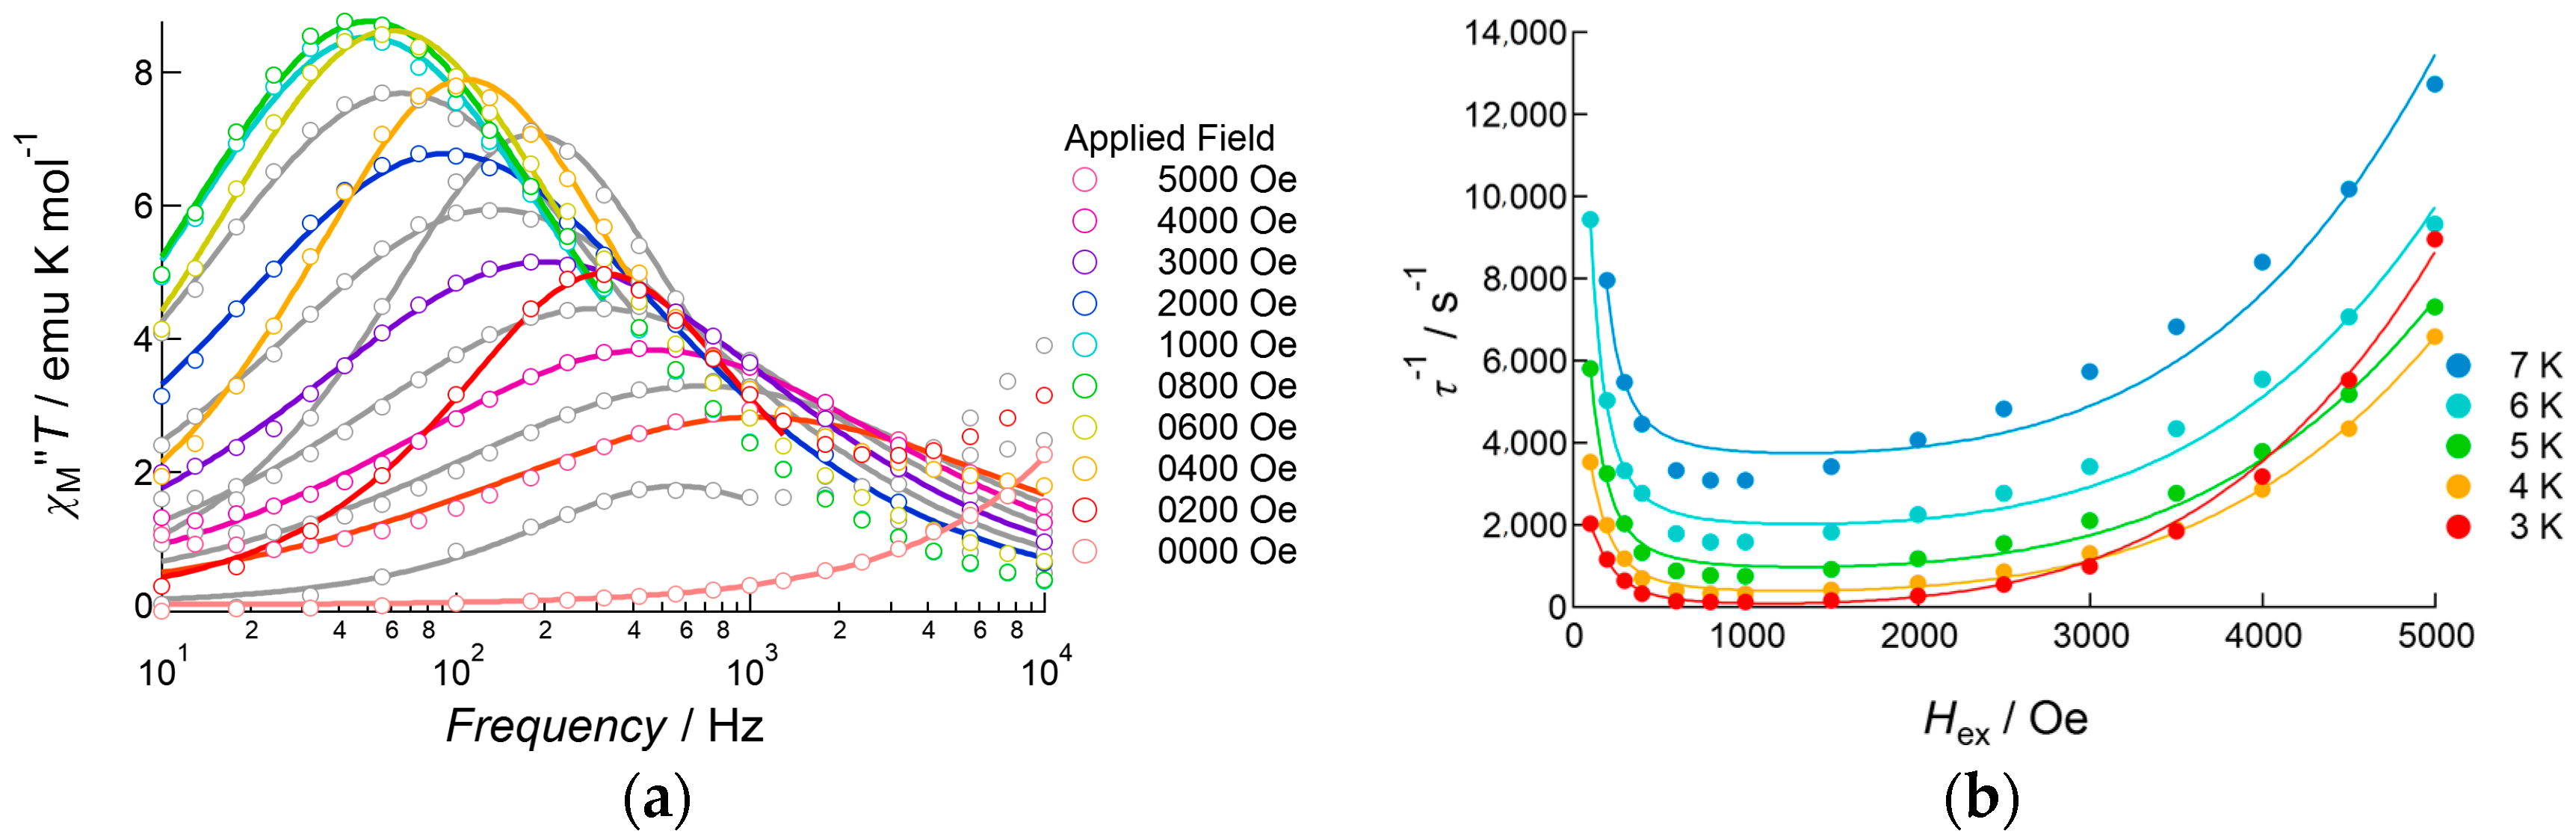
2.3.3. Dy(III) Complex 3

Under zero field condition, Dy(III) complex 3 exhibited out-of-phase signals around the high frequency limit of field flipping, which indicated the presence of fast relaxation via a tunneling process (Figure S3).
When a 1000 Oe bias field was applied, the fast relaxation process was suppressed and slow magnetic relaxation was observed up to 13.0 K in the frequency range from 10 Hz to 10,000 Hz (Figure 8). To determine the detailed features of slow magnetic relaxation phenomena, both in-phase and out-of-phase susceptibilities were analyzed using generalized Debye Equations (1) and (2) to extract the flipping time τ and distribution of τ, α, as summarized in Table S4. The observed data obeyed Debye equations over the entire temperature range. The α parameter was slightly larger at low temperatures (0.30(1) at 3.0 K and 0.255(6) at 4.0 K), but it was sufficiently small above 5.0 K (0.015(8)–0.196(6) for the temperature range 5.0–12.0 K) indicating a single relaxation process. Hence, 3 was confirmed to be a field-induced SMM. The product of χTT was almost constant in this temperature range and obeyed Curie’s law. In contrast, due to the increase in α value on cooling, the χMT value of each peak decreased when the temperature was reduced from 14.0 to 3.0 K. Relatively large α values below 4.0 K indicated the presence of very weak intermolecular magnetic interactions. We assumed that a through-space dipole–dipole interaction potentially occurred in Dy(III) complex 3, while in Nd(III) complex 1 this interaction was negligible due to smaller values of J.
To determine the effect of an applied DC field on magnetization flipping, the DC field dependence of AC susceptibility was measured in the temperature range 3.0–7.0 K (Figure 9 and Figure S5). Under zero field conditions at 4.0 K, a shoulder of the out-of-phase signal was observed in the high-frequency region, for which the peak appear at a higher frequency region in the measurement range of the equipment. When a weak DC field was applied, the intensity of the shoulder signal decreased, accompanied by the appearance of a weak peak at around 1000 Hz. Upon increasing the DC field up to 500 Oe, the peak intensity increased with a slowing of the flipping rate. Above 600 Oe, the shoulder signal was disappeared. Above 1000 Oe, each single peak was fitted with Equation (2) using the whole frequency data, whereas below 900 Oe, the selected data around each peak were used for fitting to extract the relaxation rate τ−1. Figure 9b shows the DC field dependence of the relaxation rate. The plot exhibited a clear dependence of τ−1 for the field. In the low-field region, the relaxation rate decreased when tunneling relaxation was suppressed by applying a bias field. τ−1 maintained its minimum value at around 600–1000 Oe. Then magnetic relaxation was enhanced upon increasing the DC field, which corresponded to the direct process. The data were analyzed using Equation (4) [20,21]:
τ ( H , T ) 1 = A H 4 T + B 1 1 + B 2 H 2 + D ,
where the first two terms on the right-hand side denote a direct process and the resonance tunneling process, while the third term is a constant at each temperature that includes the terms of thermal relaxation processes, which are independent of DC field strength but dependent on the temperature. The observed data fitted well with Equation (4), giving four parameters: A = 2.50(5) × 10−12 s−1 Oe−4 K−1, B1 = 5.1(5) × 103 s−1, B2 = 6(1) × 10−5 Oe−2, and D = 3.1(5) × 102 s−1 (Table S5).
Similar plots were obtained in the temperature range 3.0–7.0 K (Figure 9b). At a lower field below 600 Oe, the observed data exhibited strong temperature dependence, but at a higher field, where the direct process was dominant, temperature dependence was smaller. According to Equation (4), in the direct process region, the relaxation rate should increase in a linear manner according to temperature. The least square fitting to Equation (4) was successful below 4.0 K; however, above 5.0 K the observed data did not obey Equation (4), and least square fitting failed (Table S5). This suggested that the magnetic relaxation dynamics of 3 were not explained by this model. To avoid the influence of DC field dependence, Arrhenius analysis was carried out for data measured under the 500 and 1000 Oe DC applied fields, as shown in Figure 10. The relaxation rates measured under the 500 and 1000 Oe DC field conditions were similar in the higher temperature region. However, the difference became larger on cooling. The plots were analyzed above 11.0 K using the linear Arrhenius equation, which resulted in good agreement under both conditions, with values of ΔE/kB = 81(5) K and τ0−1 = 2.0(9) × 10−8 s for 500 Oe applied conditions, and ΔE/kB = 81(5) K and τ0−1 = 24(10) × 10−9 s for 1000 Oe applied conditions. Then, the data were analyzed only considering the Raman process employing C and n as fitting parameters, of which the best fit parameters were summarized in Table S6. These results indicated that the value of n is close to 4 (Hex = 500 Oe) or 5 (Hex = 1000 Oe); however, the agreement between observations and the theoretical calculations was not sufficient. Finally, the data were analyzed on the basis of Equation (3) both for n = 5 and n = 9, and applied field of 500 Oe and 1000 Oe conditions. The fitting gave better agreements with the observations; however, the obtained values of the barrier height and relaxations time were inconsistent with the values obtained from the linear Arrhenius analyses: the estimated barrier height was lower, ranging from 7(2) K to 21.8(5) K, and the relaxation time was longer, ranging from 11(15) × 10−5 s to 6(3) × 10−4 s. Using these values, we can estimate the contribution of the Raman process to the relaxation rate, which reaches more than 50% at 10 K both for n = 5 and 9, and increases at higher temperature. This means that the contribution of the Raman process was overestimated in this analysis, and Equation (3) is not appropriate to estimate the barrier height in this case. We will employ the value of ΔE/kB = 81(5) K for the discussion given below.

3. Discussion

Isostructural complexes with different lanthanide(III) centers provided an opportunity to discuss correlations between the coordination structure and magnetic anisotropy. In Complexes 13, oblate-type Nd(III), Tb(III), and Dy(III) ions were located in an axially stressed crystal field, which led to the slow magnetic relaxation phenomena of Nd(III) and Dy(III) complexes. However, any out-of-phase susceptibility was not observed in the Tb(III) complex. There are two possible reasons for these differences. The first is the difference in the quantum number, J. As Tb(III) is a non-Kramers ion with an integer J number, odd numbered Jz sub-levels are not necessarily degenerated, and non-negligible mixing of the sublevels leads to fast tunneling during relaxation. Another possibility is the match/mismatch of crystal field anisotropy and magnetic anisotropy of the series. The Jz = ±6 sub-levels of Tb(III) were previously reported to have the largest electronic distributions in the equatorial plane, whereas in Nd(III) and Dy(III) ions, each Jz = ±9/2 and Jz = ±15/2 sub-level was slightly constricted in the electronic distribution in the equatorial plane. As the N donor atoms surrounded the equatorial plane, the Jz = ±J sublevels of the Tb(III) ion were more destabilized than those of the Nd(III) and Dy(III) ions, leading to a smaller separation between the ground and excited sub-levels in the Tb(III) complex.
Nd(III) complex 1 showed a field-induced SMM behavior with an effective barrier of ΔE/kB = 34(2) K and relaxation rate of τ0−1 = 1.1(3) × 10−8 s. The smaller J value compared with those of heavy lanthanide ions caused slow magnetic relaxation phenomena to be rarely observed for Nd(III) complexes [13,14,15,16,22,23,24], and a few known examples of Nd(III) complexes show field-induced SMM behaviors. The reported values of ΔE/kB varied from 4.09(10) to 40.0(2) K, and the height of the barrier of 1 was similar to that reported. This result also indicated that the synthetic strategy for SMMs, including oblate-type Tb(III) and Dy(III), was valid for the construction of Nd(III)-based SMMs. In the axially ligating nitrate anion, the negative charge is delocalized over the whole moiety. Replacing nitrate anions with carboxylate anions or other monodentate oxygen-donor ligands would enhance the SMM features since the negative charge is more concentrated on donor atom(s) than on nitrate, leading to stronger electronic repulsion.
Dy(III) complex 3 also showed field-induced SMM behavior up to 13.0 K (frequency range: 10–10,000 Hz) with the barrier of ΔE/kB = 81(5) K. The estimated barrier of 3 was more than twice as high as that of 1, mainly due to the larger value of total angular momentum J. The dynamic feature of susceptibility was complicated, showing an unanalyzable dependence on DC bias field strength. The resultant Arrhenius plots showed non-negligible dependence on the DC field, especially at low temperatures, which might partially originate from weak intermolecular interactions. Theoretical calculations, as well as a dilution study of the Dy(III) complex with diamagnetic La(III) or Y(III) complexes, would help to investigate this low-temperature magnetism. At present, La(III) and Y(III) complexes isostructural to the Dy(III) complex are not known, and these studies remain future prospects.

4. Materials and Methods

4.1. General Procedures and Methods

All chemicals and reagents were of reagent grade and used without further purification. All chemical reactions and sample preparations for physical measurements were performed in ambient atmosphere. Variable temperature magnetic susceptibility measurements were performed on MPMS-5S (for DC susceptibility) and PPMS-9 (for AC susceptibility) magnetometers (Quantum Design Japan, Tokyo, Japan). Diamagnetic corrections for each sample were applied using Pascal’s constants. The excitation and luminescence spectra of 3 were measured with Fluorolog 3-22 spectrofluorometer (Horiba Jovin Ybon, Kyoto, Japan) at room temperature and 77 K.

4.2. Synthesis of Complexes [LnL(NO3)2]PF6·MeCN

[NdL(NO3)2]PF6·MeCN (1) and [TbL(NO3)2]PF6·MeCN (2) were prepared according to a previously reported method [12].
[DyL(NO3)2]PF6·MeCN (3) was synthesized using a procedure similar to those of 1 and 2, using Dy(NO3)3·6H2O as the starting material.

4.3. Crystallography

A single crystal of 3 was mounted on a Varimax Saturn area detector (Rigaku Co., Tokyo, Japan) for data collection using confocal monochromated MoKα radiation at low temperature (153 K). Intensity data were corrected for absorption using an empirical method included in the Crystal Clear software [25]. The structures were solved by direct methods with SIR-97 [26], and structure refinement was carried out using the full-matrix least squares method on SHELXL-97 [27]. Non-hydrogen atoms were anisotropically refined and hydrogen atoms were treated using the riding model. Crystallographic data are summarized in Tables S1 and S2. Complete crystal structure results as a CIF file, including bond lengths, angles, and atomic coordinates, are available in the Supplementary Materials. The CCDC number is 1512922 for compound 3.

Supplementary Materials

The following are available online at www.mdpi.com/2312-7481/2/4/43/s1, Figure S1: excitation and emission spectra of 3, Figure S2: crystal packing of 3, Figure S3: frequency dependence of χMT and χM′′T of 13, Figure S4: dc bias field dependence of χM′′T of 1, Figure S5: dc bias field dependence of χM′′T of 3, Table S1: crystallographic data for 3, Table S2: Coordination distances and angles of 3, Table S3: best fitted parameters of extended Debye fitting for 1, Table S4: best fitted parameters of extended Debye fitting for 3, Table S5: best fitted parameters of 3 using Equation (4), Table S6: best fitted parameters of 3 using Equation (3).

Acknowledgments

This work was supported by a Grant-in Aid for Scientific Research (B) (No. 23350067) and a Grant-in-Aid for Exploratory Research (No. 24655127) from JSPS, Japan (Takashi Kajiwara), as well as by the Exploratory Research Center Project for Private University and a matching fund subsidy from MEXT (2013-2017), Japan (Miki Hasegawa).

Author Contributions

D.I. and M.H. prepared and characterized the complexes. H.W., S.O., and T.K. performed the magnetic measurements and analyzed the data. All the authors reviewed the paper.

Conflicts of Interest

The authors declare no conflict of interest.

Abbreviations

The following abbreviations are used in this manuscript:
SMM
Single Molecule Magnet
QTM
Quantum Tunneling of Magnetization
TM
Thermally Assisted
AC and DC
Alternating and Direct Current

References

  1. Gatteschi, D.; Sessoli, R.; Villain, J. Molecular Nanomagnets; Oxford University Press: New York, NY, USA, 2006; pp. 47–159. [Google Scholar]
  2. Glaser, T. Rational design of single-molecule magnets: A supramolecular approach. Chem. Comm. 2011, 47, 116–130. [Google Scholar] [CrossRef] [PubMed]
  3. Layfield, R.A. Organometallic Single-Molecule Magnets. Organometallics 2014, 33, 1084–1099. [Google Scholar] [CrossRef]
  4. Madhu, N.T.; Tang, J.-K.; Hewitt, I.J.; Clérac, R.; Wernsdorfer, W.; van Slageren, J.; Anson, C.E.; Powell, A.K. What makes a single molecule magnet? Polyhedron 2005, 24, 2864–2869. [Google Scholar] [CrossRef]
  5. Liddle, S.T.; Van Slageren, J. Improving f-element single molecule magnets. Chem. Soc. Rev. 2015, 24, 6655–6669. [Google Scholar] [CrossRef] [PubMed]
  6. Feltham, H.L.C.; Brooker, S. Review of purely 4f and mixed-metal nd-4f single-molecule magnets containing only one lanthanide ion. Coord. Chem. Rev. 2014, 276, 1–33. [Google Scholar] [CrossRef]
  7. Zhang, P.; Guo, Y.-N.; Tang, J. Recent advances in dysprosium-based single molecule magnets: Structural overview and synthetic strategies. Coord. Chem. Rev. 2013, 257, 1728–1763. [Google Scholar] [CrossRef]
  8. Woodru, D.N.; Winpenny, R.E.P.; Layfield, R.A. Lanthanide Single-Molecule Magnets. Chem. Rev. 2013, 113, 5110–5148. [Google Scholar] [CrossRef] [PubMed]
  9. Schmitt, D. Angular distribution of 4f electrons in the presence of a crystal field. J. Phys. 1986, 47, 677–681. [Google Scholar] [CrossRef]
  10. Walter, U. Charge Distributions of Crystal Field States. Z. Phys. B: Condens. Matter 1986, 62, 299–309. [Google Scholar] [CrossRef]
  11. Rinehart, J.R.; Long, J.R. Exploiting single-ion anisotropy in the design of f-element single-molecule magnets. Chem. Sci. 2011, 2, 2078–2085. [Google Scholar] [CrossRef]
  12. Hasegawa, M.; Ohtsu, H.; Kodama, D.; Kasai, T.; Sakurai, S.; Ishii, A.; Suzuki, K. Luminescence behaviour in acetonitrile and in the solid state of a series of lanthanide complexes with a single helical ligand. New J. Chem. 2014, 38, 1225–1234. [Google Scholar] [CrossRef]
  13. Takahara, C.; Then, P.L.; Kataoka, Y.; Nakano, M.; Yamamura, T.; Kajiwara, T. Slow magnetic relaxation of light lanthanidebased linear LnZn2 trinuclear complexes. Dalton Trans. 2015, 44, 18276–18283. [Google Scholar] [CrossRef] [PubMed]
  14. Hino, S.; Maeda, M.; Kataoka, Y.; Nakano, M.; Yamamura, T.; Kajiwara, T. SMM Behavior Observed in Ce(III)Zn(II)2 Linear Trinuclear Complex. Chem. Lett. 2013, 42, 1276–1278. [Google Scholar] [CrossRef]
  15. Hino, S.; Maeda, M.; Yamashita, K.; Kataoka, Y.; Nakano, M.; Yamamura, T.; Nojiri, H.; Kofu, M.; Yamamuro, O.; Kajiwara, T. Linear Trinuclear Zn(II)–Ce(III)–Zn(II) Complex which Behaves as Single-molecule Magnet. Dalton Trans. 2013, 42, 2683–2686. [Google Scholar] [CrossRef] [PubMed]
  16. Le Roy, J.J.; Gorelsky, S.I.; Korobkov, I.; Murugesu, M. Slow Magnetic Relaxation in Uranium(III) and Neodymium(III) Cyclooctatetraenyl Complexes. Organometallics 2015, 34, 1415–1418. [Google Scholar] [CrossRef]
  17. Singh, S.K.; Gupta, T.; Ungur, L.; Rajaraman, G. Magnetic Relaxation in Single-Electron Single-Ion Cerium(III) Magnets: Insights from Ab Initio Calculations. Chem. Eur. J. 2015, 21, 13812–13819. [Google Scholar] [CrossRef] [PubMed]
  18. Habib, F.; Long, J.; Lin, P.-H.; Korobkov, I.; Ungur, L.; Wernsdorfer, W.; Chibotaru, L.F.; Murugesu, M. Supramolecular architectures for controlling slow magnetic relaxation in field-induced single-molecule magnets. Chem. Sci. 2012, 3, 2158–2164. [Google Scholar] [CrossRef]
  19. Cole, K.S.; Cole, R.H. Dispersion and Absorption in Dielectrics I. Alternating Current Characteristics. J. Chem. Phys. 1941, 9, 341–351. [Google Scholar] [CrossRef]
  20. Abragam, A.; Bleaney, B. Electron Paramagnetic Resonance of Transition Ions; Oxford University Press: Oxford, UK, 1970; pp. 60–74 and pp. 555–560. [Google Scholar]
  21. Carlin, R.L. Magnetochemistry; Springer: Berlin/Heidelberg, Germany, 1986; pp. 36–51. [Google Scholar]
  22. Vrábel, P.; Orendáč, M.; Orendáčová, A.; Čižmár, E.; Tarasenko, R.; Zvyagin, S.; Wosnitza, J.; Prokleška, J.; Sechovský, V.; Pavlík, V.; et al. Slow spin relaxation induced by magnetic field in [NdCo(bpdo)(H2O)4(CN)6]·3H2O. J. Phys. Condens. Matter. 2013, 25, 186003. [Google Scholar] [CrossRef] [PubMed]
  23. Zhang, Y.-Z.; Duan, G.-P.; Sato, O.; Gao, S. Structures and magnetism of cyano-bridged grid-like two-dimensional 4f–3d arrays. J. Mater. Chem. 2006, 16, 2625–2634. [Google Scholar] [CrossRef]
  24. Ma, B.-Q.; Gao, S.; Su, G.; Xu, G.-X. Cyano-Briged 4f-3d Coordination Polymers with a Unique Two-Dimensional Topological Architecture and Unusual Magnetic Behavior. Angew. Chem. Int. Ed. 2001, 40, 434–437. [Google Scholar] [CrossRef]
  25. Crystal Clear, Version 1.3.5; Operating Software for the CCD Detector System; Rigaku and Molecular Structure Corp.: Tokyo, Japan; The Woodlands, TX, USA, 2003.
  26. Altomare, A.; Burla, M.C.; Camalli, M.; Cascarano, G.L.; Giacovazzo, C.; Guagliardi, A.; Moliterni, A.G.G.; Polidori, G.; Spagna, R. SIR97: A new tool for crystal structure determination and refinement. J. Appl. Cryst. 1999, 32, 115–119. [Google Scholar] [CrossRef]
  27. Sheldrick, G.M. SHELXL-97: Program for the Refinement of Crystal Structures; University of Göttingen: Göttingen, Germany, 1996. [Google Scholar]
Figure 1. Structure of ligand L.
Magnetochemistry 02 00043 g001
Figure 2. ORTEP drawing of the cationic part of 3 at the 50% probability level. Hydrogen atoms were omitted for clarity: (a) top view and (b) side view of the molecule.
Magnetochemistry 02 00043 g002
Figure 3. Temperature dependence of the χMT products of 1 (open triangles), 2 (closed circles), and 3 (open circles) measured under an applied DC field of 1000 Oe.
Magnetochemistry 02 00043 g003
Figure 4. AC susceptibility data of 1 measured under 1000 Oe bias applied field: (a) frequency dependence of the products of temperature and in-phase susceptibility (top), and temperature and out-of-phase susceptibility (bottom), measured at several temperatures from 2.0 to 5.0 K; (b) Cole–Cole plots of 1 measured under the same conditions. Solid curves represent theoretical calculations on the basis of generalized Debye equations, of which the estimated parameters are listed in Table S3.
Magnetochemistry 02 00043 g004
Figure 5. (a) Frequency dependence of the out-of-phase component of AC susceptibility of 1 at 2.5 K measured under several DC field applied conditions; (b) DC field dependence of the relaxation rate τ−1 measured in the temperature range 2.5–4.0 K.
Magnetochemistry 02 00043 g005
Figure 6. Arrhenius plot of 1 measured under an applied DC field of 1000 Oe. The black line is the result of the fitting to the linear Arrhenius equation, and the green curve is the result of fitting when simply Raman process was considered. The red and black curves represent the results of the fitting using Equation (3), which considers both thermally assisted QTM and Raman processes. The value of n in the Raman term was fixed at 5 for the red curve and 9 for the blue curve.
Magnetochemistry 02 00043 g006
Figure 7. AC susceptibility data of 2 measured under 1000 Oe bias applied field conditions in the temperature range 2.0–6.0 K and frequency range 10–10,000 Hz. Closed circles and open circles denote the value of χMT and χM′′T, respectively.
Magnetochemistry 02 00043 g007
Figure 8. AC susceptibility data for 3, measured under a 1000 Oe bias applied field: (a) frequency dependence of the products of temperature and in-phase susceptibility (top), and temperature and out-of-phase susceptibility (bottom), measured at several temperatures in the range 2.0–14.0 K; (b) Cole–Cole plots of 3 measured under the same conditions. Solid curves represent theoretical calculations on the basis of generalized Debye equations, of which the estimated parameters were listed in Table S4.
Magnetochemistry 02 00043 g008
Figure 9. AC susceptibility data for 3, measured under several DC applied fields: (a) frequency dependence of out-of-phase susceptibility at 4.0 K, measured under several DC applied fields ranging from 0 to 5000 Oe. Solid curves represent theoretical calculations on the basis of Equation (2). (b) DC field dependence of the relaxation rate measured in the temperature range 3.0–7.0 K. Solid curves represent theoretical calculations on the basis of Equation (4).
Magnetochemistry 02 00043 g009
Figure 10. Arrhenius plot of 3, measured under applied DC fields of (a) 500 Oe and (b) 1000 Oe. The solid lines and curves represent the results of the fitting based on the linear Arrhenius equation (black) and Raman process (green), and the fitting using Equation (3) with n values of 5 (red) and 9 (blue). The estimated parameters were listed in Table S6.
Magnetochemistry 02 00043 g010

